Embed Size (px)
Citation preview

SUMMARY OF CORAL CAY CONSERVATION’S DATA ON COMMERCIALLY IMPORTANT REEF FISH AND
INVERTEBRATES FROM TURNEFFE ATOLL, BELIZE
- by -
Rosalie Gardiner, Data Analyst Alastair Harborne, Marine Science Co-ordinator
September 2000
CORAL CAY CONSERVATION LTD 154 CLAPHAM PARK ROAD LONDON SW4 7DE, UK TEL: +44 (0)20 7498 4019 FAX: +44 (0)20 7498 8447 Email: [email protected] www: http://www.coralcay.org
This report is part of a series of working documents detailing CCC’s science programme on Turneffe Atoll (1994-1998).
The series is also available on CD-Rom.
Contents Turneffe Atoll commercial species report
i
CONTENTS CONTENTS ..............................................................................................................................................................I
EXECUTIVE SUMMARY ................................................................................................................................ III
ACKNOWLEDGEMENTS ................................................................................................................................ V
ABBREVIATIONS ..............................................................................................................................................VI
FIGURES, TABLES AND APPENDICES ...................................................................................................VII
1. INTRODUCTION .......................................................................................................................................1
1.1 BELIZE......................................................................................................................................................... 1 1.2 CORAL CAY CONSERVATION................................................................................................................... 1 1.3 TURNEFFE ATOLL PROJECT ...................................................................................................................... 3 1.4 FISHING PRESSURE IN BELIZE .................................................................................................................. 3
1.4.1 Overview..........................................................................................................................................3 1.4.2 Lobster .............................................................................................................................................4 1.4.3 Conch...............................................................................................................................................4 1.4.4 Finfish ..............................................................................................................................................4 1.4.5 Turneffe Atoll ..................................................................................................................................6
1.5 REPORT OUTLINE....................................................................................................................................... 6
2. METHODS ....................................................................................................................................................7
2.1 SURVEYORS................................................................................................................................................ 7 2.2 STUDY SITES............................................................................................................................................... 7 2.3 SURVEY PROTOCOL ................................................................................................................................... 7 2.4 DATA VALIDATION.................................................................................................................................. 10 2.5 DATA ANALYSIS....................................................................................................................................... 10
2.5.1 Habitat classification...................................................................................................................10 2.5.2 Species densities...........................................................................................................................13 2.5.3 Inter-habitat and inter-study variation of fish species...........................................................13
3. RESULTS .....................................................................................................................................................14
3.1 DATA COLLECTION.................................................................................................................................. 14 3.2 BENTHIC DATA......................................................................................................................................... 14 3.3 GEOMORPHOLOGICAL DATA AND HABITAT TYPES............................................................................. 17 3.4 FISH DATA................................................................................................................................................. 18
3.4.1 Summary statistics........................................................................................................................18 3.4.2 Species inter-habitat trends........................................................................................................20 3.4.3 Family inter-habitat trends.........................................................................................................21 3.4.4 Summary of habitat preferences................................................................................................21 3.4.5 Inter-study spatial variation.......................................................................................................22 3.4.6 Factors related to fish mean abundance..................................................................................24
3.5 INVERTEBRATE DATA.............................................................................................................................. 25 3.5.1 Summary statistics........................................................................................................................25 3.5.2 Species inter-habitat trends........................................................................................................25 3.5.3 Inter-study spatial variation.......................................................................................................25
3.6 SUMMARY OF DISTRIBUTION PATTERNS............................................................................................... 26 3.6.1 Fish species...................................................................................................................................26 3.6.2 Invertebrate species.....................................................................................................................38
4. DISCUSSION..............................................................................................................................................39
4.1 OVERVIEW................................................................................................................................................ 39 4.2 BENTHIC AND GEO-MORPHOLOGICAL DATA........................................................................................ 39 4.3 SPECIES DISTRIBUTION PATTERNS......................................................................................................... 40
Contents Turneffe Atoll commercial species report
ii
4.4 STATUS OF FISHERY SPECIES ON TURNEFFE ATOLL ........................................................................... 42 4.4.1 Fish .................................................................................................................................................42 4.4.2 Lobster ...........................................................................................................................................43 4.4.3 Conch.............................................................................................................................................43
4.5 RELATIVE IMPORTANCE OF EACH HABITAT TYPE............................................................................... 44 4.6 RELATIVE IMPORTANCE OF EACH STUDY AREA.................................................................................. 47
5. CONCLUSION AND RECOMMENDATIONS ...............................................................................49
6. REFERENCES ...........................................................................................................................................52
APPENDICES

Executive summary Turneffe Atoll commercial species report
iii
EXECUTIVE SUMMARY The coastal waters of Belize consist of a complex set of reefal resources which are economically important for industries such as tourism and fishing. Effective management of these resources can be assisted by data collected by self-financing volunteer divers. This technique has been used in Belize by Coral Cay Conservation (CCC) to provide data to the Department of Fisheries and Coastal Zone Management Project. Between 1994 and 1997 CCC collected baseline data on the benthic and fish communities of Turneffe Atoll in order to produce a habitat map and associated database. Although data on fish abundance are available via this technique, they are limited by the variable length of each transect and use of an ordinal scale. This study, conducted between 1997 and 1998, aimed to provide fully quantitative data on commercially important fish and invertebrate species, here defined as jacks, grunts, snappers, groupers, barracuda, mackerel, tarpon, hogfish, conch and lobster. Such data could then be used to provide baseline densities for comparison with future studies, habitat preferences of individual species, variations in densities around the atoll and management recommendations and suggested future research. Managing fisheries in Belize’s coastal zone, including Turneffe Atoll, is vitally important because the industry is a key part of the country’s economy (e.g. lobster exports were worth US$8.8 million in 1995). Data were collected by volunteers following an intensive training course supervised by field science staff. Teams of four volunteers conducted surveys along transects (70 m long x 5 m wide = 350 m2) with two volunteers counting fish numbers (half the species list each). The other two volunteers surveyed the benthos (via a semi-quantitative scale), to allow densities to be linked to habitat type, and counting lobster and conch. Transects were surveyed at a series of randomly located ‘Sites’, each comprising of three transects at four depths (21 m, 18 m, 12 m and 6 m). Sites were allocated to one of 13 ‘Study areas’ around the atoll, delineated to facilitate data analysis at a spatial scale useful to management. Data were summarised via univariate techniques and more detailed analysis was conducted using multivariate protocols (e.g. cluster analysis of benthic data and Kruskal-Wallis ANOVA of fish densities between habitat types). This study generated a total of 908 surveys, each assigned to one of 13 habitat types (formed from five benthic and three geomorphological classes). All target fish species were seen during the study and mean abundances in each habitat type are presented. These data, along with analysis of preference for each study area, facilitated a description of the distribution of each fish on Turneffe Atoll. These patterns highlight overall abundance, key habitat types and important study areas. Similar data are presented for each of the four most diverse families (jacks, snappers, grunts and groupers). To summarise overall habitat and study area preferences of all fish species combined and for each family, a simple index was calculated using mean abundance data. Finally, further analysis indicated an exponential relationship between each species’ abundance and the number of habitats or studies in which it was found. Conch and lobster data are also presented as mean abundance in each habitat type, order of habitat preference and study areas with the highest abundance.
Executive summary Turneffe Atoll commercial species report
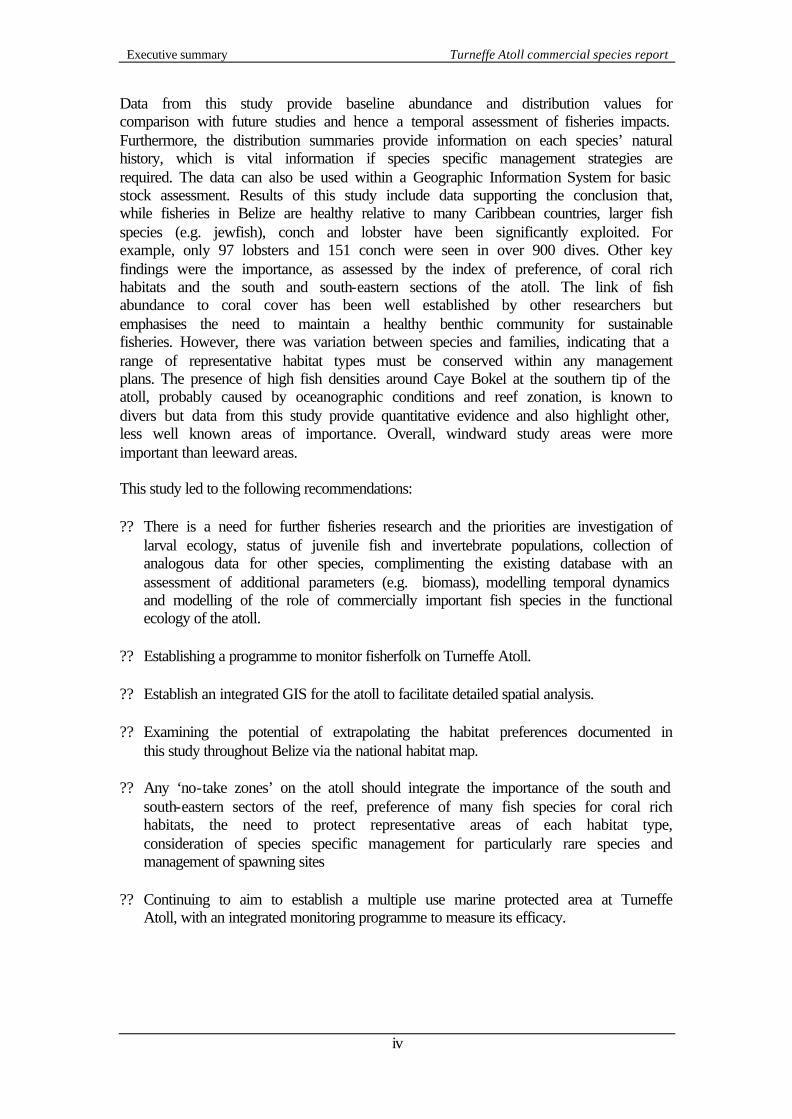
iv
Data from this study provide baseline abundance and distribution values for comparison with future studies and hence a temporal assessment of fisheries impacts. Furthermore, the distribution summaries provide information on each species’ natural history, which is vital information if species specific management strategies are required. The data can also be used within a Geographic Information System for basic stock assessment. Results of this study include data supporting the conclusion that, while fisheries in Belize are healthy relative to many Caribbean countries, larger fish species (e.g. jewfish), conch and lobster have been significantly exploited. For example, only 97 lobsters and 151 conch were seen in over 900 dives. Other key findings were the importance, as assessed by the index of preference, of coral rich habitats and the south and south-eastern sections of the atoll. The link of fish abundance to coral cover has been well established by other researchers but emphasises the need to maintain a healthy benthic community for sustainable fisheries. However, there was variation between species and families, indicating that a range of representative habitat types must be conserved within any management plans. The presence of high fish densities around Caye Bokel at the southern tip of the atoll, probably caused by oceanographic conditions and reef zonation, is known to divers but data from this study provide quantitative evidence and also highlight other, less well known areas of importance. Overall, windward study areas were more important than leeward areas. This study led to the following recommendations: ?? There is a need for further fisheries research and the priorities are investigation of
larval ecology, status of juvenile fish and invertebrate populations, collection of analogous data for other species, complimenting the existing database with an assessment of additional parameters (e.g. biomass), modelling temporal dynamics and modelling of the role of commercially important fish species in the functional ecology of the atoll.
?? Establishing a programme to monitor fisherfolk on Turneffe Atoll. ?? Establish an integrated GIS for the atoll to facilitate detailed spatial analysis. ?? Examining the potential of extrapolating the habitat preferences documented in
this study throughout Belize via the national habitat map. ?? Any ‘no-take zones’ on the atoll should integrate the importance of the south and
south-eastern sectors of the reef, preference of many fish species for coral rich habitats, the need to protect representative areas of each habitat type, consideration of species specific management for particularly rare species and management of spawning sites
?? Continuing to aim to establish a multiple use marine protected area at Turneffe
Atoll, with an integrated monitoring programme to measure its efficacy.
Acknowledgements Turneffe Atoll commercial species report
v
ACKNOWLEDGEMENTS CCC would like to thank the Department of Fisheries (Ministry of Agriculture and Fisheries), UNDP-GEF Coastal Zone Management Project and University College of Belize for their support at the Calabash Cay Marine Research Centre. CCC is also very grateful to all the field staff and volunteers who have participated on the Turneffe Atoll project. CCC would also like to thank the following: Belize Defence Force British Forces Belize British High Commission, Belize Darwin Initiative for the Survival of Species Department of Forestry (Ministry of Natural Resources) Environmental Systems Research Institute (ESRI) Lands Information Centre (Ministry of Natural Resources) Ministry of Tourism and the Environment Trimble Navigation Unistat Ltd
Abbreviations Turneffe Atoll commercial species report
vi
ABBREVIATIONS ANOVA Analysis of variance CCC Coral Cay Conservation CZMP Coastal Zone Management Project CZMU Coastal Zone Management Unit GEF Global Environment Facility GIS Geographic Information System GOB Government of Belize GPS Global Positioning System IUCN World Conservation Union MOU Memorandum of Understanding MRC Marine Research Centre NGO Non Government Organisation n.s. Not significant PS Project Scientist SCUBA Self contained underwater breathing apparatus SO Science Officer UCB University Collage Belize UNEP United Nations Environment Programme UNDP United Nations Development Programme The following abbreviations are used for benthic classes discriminated in this study: BDF Bedrock/ rubble and dense gorgonians + Fore reef BDS Bedrock/ rubble and dense gorgonians + Spur and groove BSE Bedrock/ rubble and sparse gorgonians + Escarpment BSF Bedrock/ rubble and sparse gorgonians + Fore reef BSS Bedrock/ rubble and sparse gorgonians + Spur and groove DEE Dense massive and encrusting coral + Escarpment DEF Dense massive and encrusting coral + Fore reef DES Dense massive and encrusting coral + Spur and groove SE Sand and sparse algae + Escarpment SF Sand and sparse algae + Fore reef SEE Sparse massive and encrusting coral + Escarpment SEF Sparse massive and encrusting coral + Fore reef SES Sparse massive and encrusting coral + Spur and groove The following abbreviations are used for individual study areas around the atoll: BC Blackbird Cay CB Caye Bokel CC Calabash Cay CR Crawl Cay DF Dog Flea Cay DM Deadmans Cay GB Grand Bogue LR Long Ridge MC Mauger Cay SC Soldier Cay SP Snake Point TF Turneffe Flats TP Tarpon Creek
Figures, tables and appendices Turneffe Atoll commercial species report
vii
FIGURES, TABLES AND APPENDICES Figure 1. Map of Belize showing the location of Turneffe Atoll. Figure 2. Nominal catches from all fisheries in Belize. Figure 3. Map of Turneffe Atoll, showing the boundaries of the study areas. Figure 4. Schematic diagram of a survey dive team showing the positions and
data gathering responsibilities of all four divers. Figure 5. Schematic diagram of the steps required to assign benthic survey data
to a habitat type. Figure 6. Proportion of surveys at each depth around Turneffe Atoll. Figure 7. Final dendrogram showing the five benthic clusters delineated by
cluster analysis. Figure 8. Distribution of Records between the five benthic classes identified on
Turneffe Atoll. Figure 9. Relationship between mean abundance for each fish species and the
number of habitats or studies in which it occurs. Table 1. Belize ‘Flag of Convenience’ fishing statistics 1994-1997. Table 2. Key characteristic species and substratum categories of the five benthic
classes identified during this study. Table 3. Habitat classification results for benthic surveys around Turneffe Atoll. Table 4. Proportion of transects in each study area. Table 5. Mean abundance of each fish species in each habitat type discriminated
in this study. Table 6. Results of Kruskal-Wallis one-way ANOVA of abundance of each fish
species between each of the 13 habitat types. Table 7. Mean abundance of each fish family in each habitat type discriminated
in this study. Table 8. Results of Kruskal-Wallis one-way ANOVA for variation of
abundance of each fish family between each of the 13 habitat types. Table 9. Relative importance of each habitat type for all species combined and
each family, assessed via a simple index of preference. Table 10. Results of Kruskal-Wallis one-way ANOVA of abundance of each fish
species between each of the 13 study areas. Table 11. Relative importance of each study area for all species combined and
each family, assessed via a simple index of preference. Table 12. Mean abundance of lobster and conch in each habitat type
discriminated in this study. Table 13. Results of Kruskal-Wallis one-way ANOVA of abundance of lobster
and conch between each of the 13 habitat types. Table 14. Results of Kruskal-Wallis one-way ANOVA of abundance of each fish
species between each of the 13 study areas. Appendix 1. Survey forms used by volunteers during commercial fish and
invertebrate counts. Appendix 2. Latin names of the fish species recorded during quantitative surveys.
Introduction Turneffe Atoll commercial species report
1
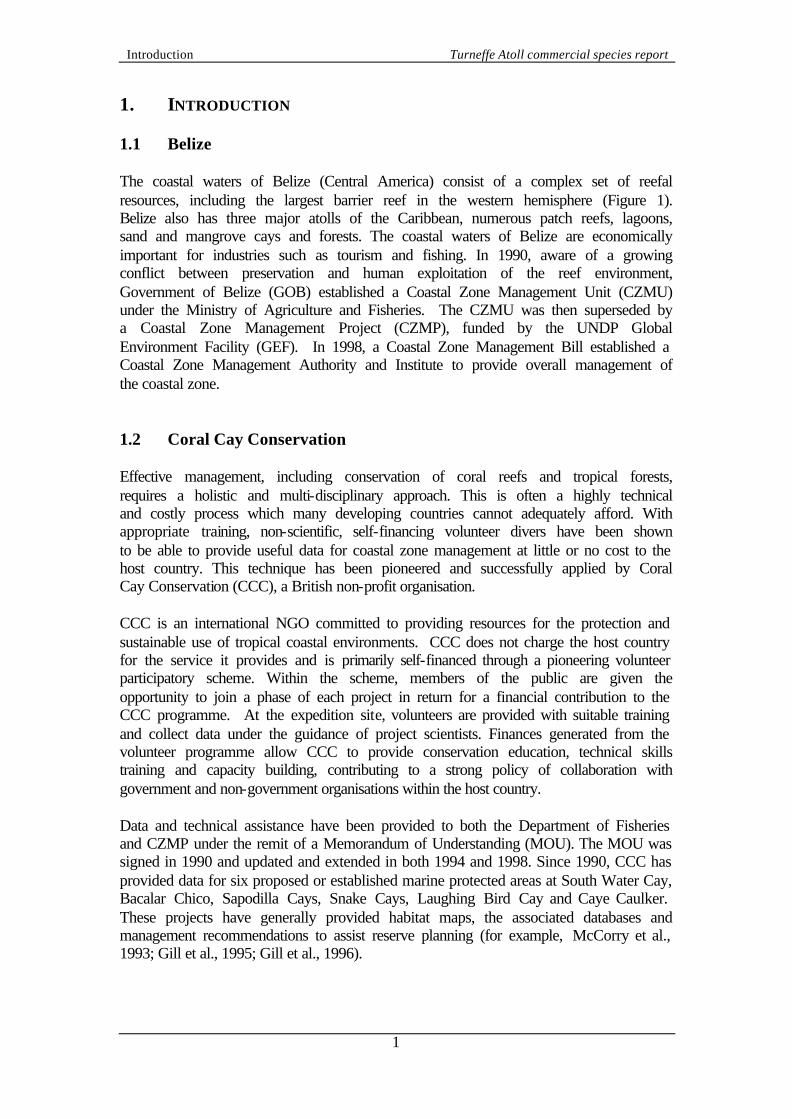
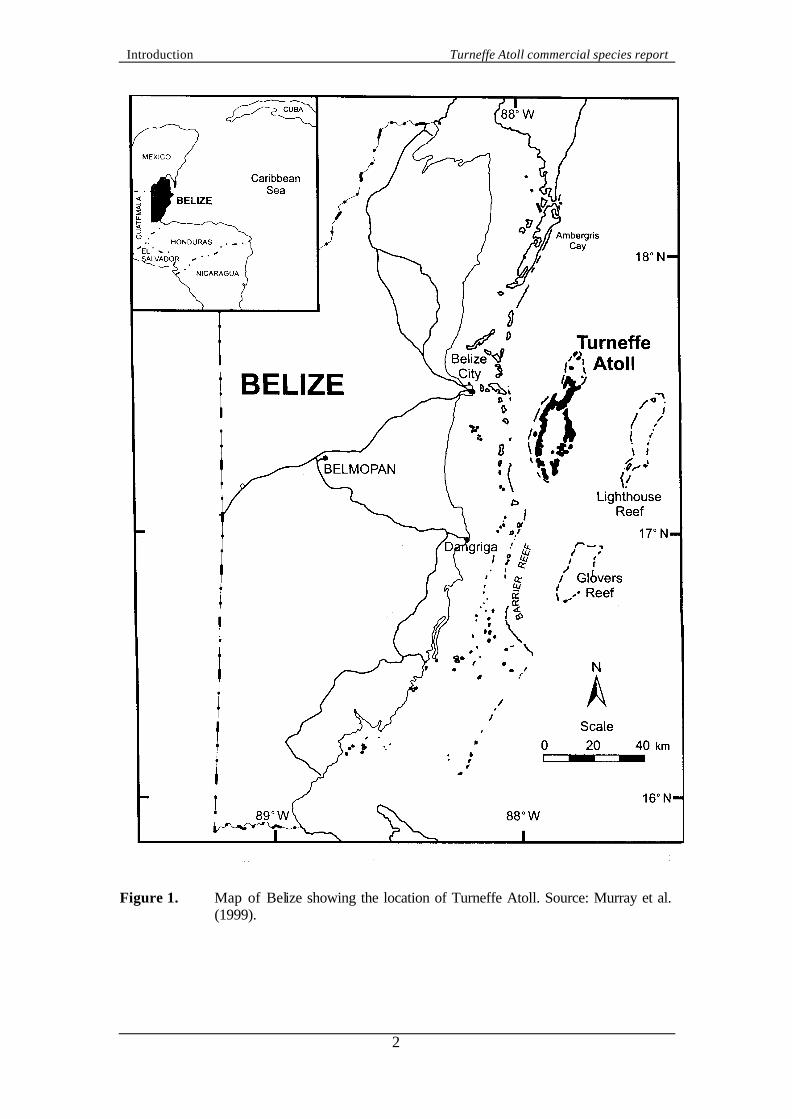
1. INTRODUCTION 1.1 Belize The coastal waters of Belize (Central America) consist of a complex set of reefal resources, including the largest barrier reef in the western hemisphere (Figure 1). Belize also has three major atolls of the Caribbean, numerous patch reefs, lagoons, sand and mangrove cays and forests. The coastal waters of Belize are economically important for industries such as tourism and fishing. In 1990, aware of a growing conflict between preservation and human exploitation of the reef environment, Government of Belize (GOB) established a Coastal Zone Management Unit (CZMU) under the Ministry of Agriculture and Fisheries. The CZMU was then superseded by a Coastal Zone Management Project (CZMP), funded by the UNDP Global Environment Facility (GEF). In 1998, a Coastal Zone Management Bill established a Coastal Zone Management Authority and Institute to provide overall management of the coastal zone. 1.2 Coral Cay Conservation Effective management, including conservation of coral reefs and tropical forests, requires a holistic and multi-disciplinary approach. This is often a highly technical and costly process which many developing countries cannot adequately afford. With appropriate training, non-scientific, self-financing volunteer divers have been shown to be able to provide useful data for coastal zone management at little or no cost to the host country. This technique has been pioneered and successfully applied by Coral Cay Conservation (CCC), a British non-profit organisation. CCC is an international NGO committed to providing resources for the protection and sustainable use of tropical coastal environments. CCC does not charge the host country for the service it provides and is primarily self-financed through a pioneering volunteer participatory scheme. Within the scheme, members of the public are given the opportunity to join a phase of each project in return for a financial contribution to the CCC programme. At the expedition site, volunteers are provided with suitable training and collect data under the guidance of project scientists. Finances generated from the volunteer programme allow CCC to provide conservation education, technical skills training and capacity building, contributing to a strong policy of collaboration with government and non-government organisations within the host country. Data and technical assistance have been provided to both the Department of Fisheries and CZMP under the remit of a Memorandum of Understanding (MOU). The MOU was signed in 1990 and updated and extended in both 1994 and 1998. Since 1990, CCC has provided data for six proposed or established marine protected areas at South Water Cay, Bacalar Chico, Sapodilla Cays, Snake Cays, Laughing Bird Cay and Caye Caulker. These projects have generally provided habitat maps, the associated databases and management recommendations to assist reserve planning (for example, McCorry et al., 1993; Gill et al., 1995; Gill et al., 1996).
Introduction Turneffe Atoll commercial species report
2
Figure 1. Map of Belize showing the location of Turneffe Atoll. Source: Murray et al.
(1999).
Introduction Turneffe Atoll commercial species report
3
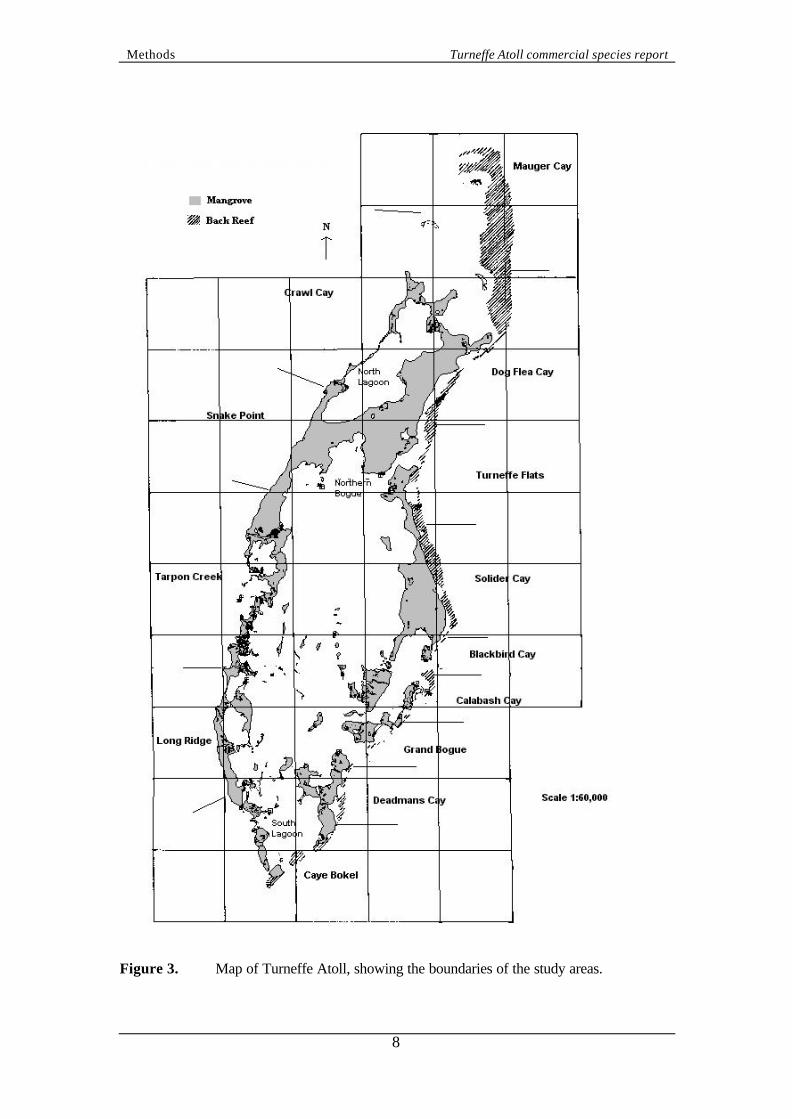
1.3 Turneffe Atoll project In 1993 the University College of Belize (UCB) entered into a working agreement with CCC to collaborate towards the establishment of a permanent, self-financing Marine Research Centre (MRC) of both regional and international standing. The field site was selected as Calabash Cay on Turneffe Atoll (Figure 1), the largest atoll in the Caribbean at approximately 330 km2 (UNEP/IUCN, 1988). Turneffe Atoll is completely surrounded by an extensive reef system that encompasses a complex central lagoon and extensive mangrove forested cays. The principle objectives of the MRC project were identified as protection of the terrestrial and marine resources of Turneffe Atoll, strengthening the capacity of UCB to undertake coastal marine research and training and providing technical assistance to the Department of Fisheries. In August 1994, the agreement between CCC and UCB was endorsed by the GOB through the signing of a MOU between the three lead agencies. A core component of this MOU was establishing and monitoring a management plan for Turneffe Atoll. Between January 1994 and early 1997, CCC volunteers carried out surveys around the whole atoll, which have resulted in an extensive database of baseline information. Analysis of these data and combination with aerial photographs has led to a Turneffe Atoll Habitat Map, the first draft of which was completed in August 1998. In order to provide important information on commercially important fish and invertebrates, between March 1997 and December 1998 this baseline database was complemented by quantitative surveys of these species. Within this study, commercially important fish species were classed as jacks (Carangidae), grunt (Haemulidae), snappers (Lutjanidae), groupers (Serranidae) plus barracudas (Sphyraenidae), mackerel (Scombridae), tarpon (Megalops atlanticus) and hogfish (Lachnolaimus maximus and Bodianus sp.). Evidence of the importance of the four key fish families is provided by data on whole fish prices in San Pedro (Ambergris Cay) in 1991 (R. Gonzalez pers. comm., cited in Polunin and Roberts, 1993). Snappers, groupers, grunts and jacks were all sold for between BZ$1.35 and BZ$2.25 per pound. Parrotfish are also fished in Belize but were excluded from this study because they were judged too difficult to count accurately because of their abundance and multiple colour phases. Commercially important invertebrate species were classed as lobster (Panulirus argus) and conch (Strombus gigas). 1.4 Fishing pressure in Belize 1.4.1 Overview Fishing has historically been a primary occupation for Belizeans and all fisheries are characterised by small-scale commercial operations (Perkins, 1983). Department of Fisheries statistics indicate that in 1998 there were approximately 350 boats and 1,900 fisherfolk but they are organised into five co-operatives and have significant political influence (McField et al., 1996). Marine products are highly export orientated and the wild-caught industry was worth approximately US$19.6 million in 1998, with 80% of the catch exported and 60% going to the United States of America. The dominant fisheries are lobster (mainly Panulirus argus) and conch (mainly Strombus gigas) but significant amounts of finfish are caught, concentrating on higher
Introduction Turneffe Atoll commercial species report
4
quality species such as groupers and snappers (Gibson et al., 1998). There are also small fisheries for turtles, shrimp and stone crabs. Most fishing is conducted in the shallow waters on and inside the barrier reef and on the shallow reefs and lagoons of the atolls (Perkins, 1983). There are direct threats to the populations of lobster, conch and grouper from over-fishing, with tourist demand a key factor. These fisheries were already considered close to their maximum sustainable yields in the early 1980’s (Perkins, 1983) but modelling populations is difficult because catch and effort data are not collected systematically (McField et al., 1996) and visits by illegal alien fisherfolk. There is anecdotal evidence of decreasing catch per unit effort (King, 1997). However, with the exception of shrimp trawling, since most fisheries are exploited with traditional equipment, indirect damage to benthic habitats is small scale and limited to breakage from anchors, skin divers, nets and discarded gear (Gibson et al., 1998). Use of SCUBA, poisons and explosives is prohibited. Within the Caribbean there is evidence of over-fishing of herbivorous fish contributing to increased coverage of macro-algae but evidence is equivocal in Belize and may be limited because of the concentration on higher value (piscivorous) species. 1.4.2 Lobster Lobsters have been harvested commercially in Belize since at least the 1920’s when it was largely controlled by foreign interests. By 1995 fisherfolk were extracting 363,000 kg of lobster with an export market of US$8.8 million (McField et al., 1996). In addition, an estimated 23-45 kg of undersized lobster are caught and consumed locally on Caye Caulker alone (King, 1997). Most lobsters are caught by either skin divers using a hook and stick or traps (Hartshorn et al., 1984). These traps are generally wooden and based on a 1920’s Canadian design but are increasingly made from oil drums (King, 1997). 1.4.3 Conch Conch is the second most valuable fishery in Belize with catches around 180,000 kg (Appeldoorn and Rolke, 1996) worth exports of US$1.15 million (McField et al., 1996). Most conch are taken by skin divers in the back reef and seagrass beds where the aggregating behaviour of individuals makes them susceptible to exploitation (Perkins, 1983). Appeldoorn and Rolke (1996) highlighted the low density of adults in shallow habitats and there is evidence of increased populations in marine protected areas, both indicating over-exploitation. However, catches appear to be relatively consistent and the paradox could be caused by a deep, unfished stock so that catch (shallow water) may be independent of the spawning stock (Appeldoorn and Rolke, 1996). 1.4.4 Finfish Finfish in Belize are generally caught for the domestic market and of the 114,000 kg caught in 1993-94 approximately 80% were consumed locally (McField et al., 1996). Hook-and-line fishing is dominant in Belize and this gear selects for piscivores so the catch is predominantly groupers and snappers (Koslow et al., 1994). There is also a seasonal fishery for estuarine species such as mullet (Mugil spp.) and some gill nets
Introduction Turneffe Atoll commercial species report
5
for sharks (McField et al., 1996). The shark fishery is over-exploited but a surplus-production model for finfish provides evidence that there is capacity for further expansion and current effort seems to be only 10% of levels that would maximise landings (Koslow et al., 1994). However, the authors advise that these results must be used with caution, particularly since it is difficult to model the effects of fishing on spawning aggregations which contributes a significant portion of the catch. At least six spawning aggregations are known in Belize, located at Rocky Point, Cay Glory, Gladden Entrance and the north-east corner of the three atolls (Carter and Sedberry, 1997). Fish are often caught before they spawn and some of the areas are thought to be over-exploited or no longer functional (McField et al., 1996). The small continental shelf may not be able to support an expanded, high-tech fishing industry. However, there is a rapid expansion of longlining by Asian fleets in the Caribbean and this poses a threat to stocks of tuna, billfish and pelagic gamefish (Davidson, 1990). Overall catches for Belize since 1987 are presented in Figure 3 and Table 1.
0
200
400
600
800
1000
1200
1400
1600
1800
2000
1987 1988 1989 1990 1991 1992 1993 1994 1995 1996
Year
Figure 2. Nominal catches from all fisheries in Belize. Dashed line represents mean
catch. Data source: FAO. 1996. Fishery statistics capture production. FAO Yearbook Volume 82.
Table 1. Belize ‘Flag of Convenience’ fishing statistics 1994-1997. Source: Adapted
from ICFTU, TUAC, ITF and Green Peace International, 1999. Year 1994 1995 1996 1997 % change (‘94-’97) Gross tonnes 38,785 72,809 89,977 119,988 209 No. of vessels 69 122 134 161 133
Threats to these fisheries arise from a variety of direct and indirect sources including:
Introduction Turneffe Atoll commercial species report
6
?? Over exploitation of stocks: species specific over exploitation causing effects such as depletion of large, fecund individuals or widespread depletion of stocks from commercial and artisanal activities.
?? Loss of habitat: reef damage or mangrove loss removes vital habitats for
spawning, growth, feeding and shelter. ?? Pollution: contaminants from both land-based and marine sources can reduce
water quality, which may directly and indirectly impact species. 1.4.5 Turneffe Atoll Certain sites around Turneffe are described as important for fisheries with, for example, Mauger Cay documented as a target fishing area (McField et al., 1996). Particular target species include Nassau and tiger groupers and red hinds (Epinephelus striatus, Mycteroperca tibris and E. guttatus). Pelagic species such as jacks (Carangidae), mackerel (Scombridae) and barracuda (Sphyraenidae) are also important seasonal catches. Furthermore, Caye Bokel has been identified as a spawning area for cubera and mutton snappers (Lutjanus cyanopterus and L. analis) and grouper (Serranidae) are thought to spawn on the north-eastern escarpment (McField et al., 1996; Carter and Sedberry, 1997). All these spawning stocks are exploited by fisherfolk. Further, quantitative details on fishing pressure on Turneffe (e.g. catches and sites used) seems limited. 1.5 Report outline This report aims to present the results of CCC’s commercially important fish and invertebrate surveys on Turneffe Atoll, an indication of the status of their populations and management recommendations. Specific aims of the report are to provide: ?? baseline densities for comparison with future studies; ?? habitat preferences of individual species to assist their management; ?? variations in densities around Turneffe Atoll to assist maximising the efficiency
of conservation initiatives; ?? management recommendations and suggested future research.

Methods Turneffe Atoll commercial species report
7
2. METHODS 2.1 Surveyors All data presented in this report were collected by CCC volunteers between March 1997 and December 1998. Volunteers had a week of intensive science training and testing (see Harborne, 1999) which enabled them to implement the survey protocols, including measuring given parameters and identifying species precisely and consistently (Mumby et al., 1995). Volunteer divers in Belize were co-ordinated by a Project Scientist (PS) and Science Officer (SO). The primary responsibilities of the PS and SO were to train CCC volunteers in marine life identification, survey techniques and other supporting skills. The PS and SO also co-ordinated and supervised subsequent surveys and data collection. 2.2 Study sites Data were collected within 13 ‘study areas’ (Figure 3) which were defined a priori to assist structuring the survey work. Furthermore, this facilitated data analysis at the scale of both the whole atoll and by individual study areas, the latter being an appropriate spatial scale for management decision-making (e.g. recommending as a no-fishing zone). 2.3 Survey protocol Standard CCC transects (Raines et al., 1993) have been used to describe the non-cryptic fish communities in each habitat present on Turneffe Atoll (Harborne and Taylor, 2000). However, this technique does not generate appropriate data for quantitatively assessing populations because of (i) the semi-quantitative scale it utilises and (ii) the variable distances of each survey. The survey protocol used in this study addressed these problems. Each survey team consisted of two buddy pairs (A and B). Buddy pair A was responsible for the fish census and pair B for a benthic survey (Figure 4). The benthic survey was included to ensure that each fish count could be related to a habitat type and Pair A led the survey to ensure fish were counted before they were disturbed. Each survey consisted of a 70 m transect along a depth contour of either 211, 18, 12 or 6 m to ensure that a range of habitat types were surveyed. Each transect was placed so that it did not traverse more than one benthic community type or geomorphological zone. Transects were organised as a series of ‘Sites’, each comprising of 12 transects (three replicates at four depths). Although general Site locations were chosen to ensure surveys around the whole atoll, replicates within a Site were randomly placed since they were started wherever the team descended from the boat (rather than finding a predetermined start point). Replicates within a Site were separated to ensure a particular transect was not re-surveyed by a subsequent team.
1 Occasionally 20 m and originally 24 m until CCC’s dive profiles were altered for safety reasons during 1997. However, because the escarpment around Turneffe Atoll generally begins at less than 20 m this did not significantly alter the reef zones being surveyed.
Methods Turneffe Atoll commercial species report
8
Figure 3. Map of Turneffe Atoll, showing the boundaries of the study areas.
Methods Turneffe Atoll commercial species report
9
Direction of travel (BUDDY PAIR A) Diver 1 Diver 2 Fish Fish 10m rope
(BUDDY PAIR B) Diver 3 Diver 4
Hard corals, gorgonians Algae and and sponges substratum
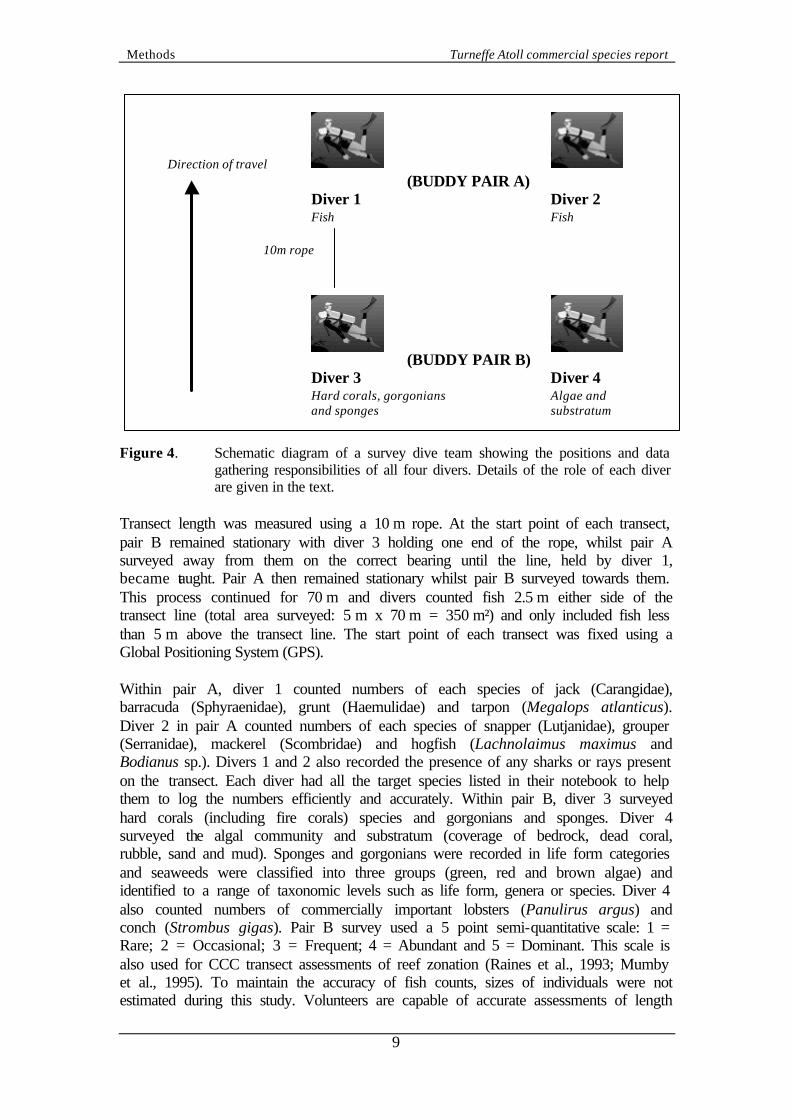
Figure 4. Schematic diagram of a survey dive team showing the positions and data gathering responsibilities of all four divers. Details of the role of each diver are given in the text.
Transect length was measured using a 10 m rope. At the start point of each transect, pair B remained stationary with diver 3 holding one end of the rope, whilst pair A surveyed away from them on the correct bearing until the line, held by diver 1, became taught. Pair A then remained stationary whilst pair B surveyed towards them. This process continued for 70 m and divers counted fish 2.5 m either side of the transect line (total area surveyed: 5 m x 70 m = 350 m²) and only included fish less than 5 m above the transect line. The start point of each transect was fixed using a Global Positioning System (GPS). Within pair A, diver 1 counted numbers of each species of jack (Carangidae), barracuda (Sphyraenidae), grunt (Haemulidae) and tarpon (Megalops atlanticus). Diver 2 in pair A counted numbers of each species of snapper (Lutjanidae), grouper (Serranidae), mackerel (Scombridae) and hogfish (Lachnolaimus maximus and Bodianus sp.). Divers 1 and 2 also recorded the presence of any sharks or rays present on the transect. Each diver had all the target species listed in their notebook to help them to log the numbers efficiently and accurately. Within pair B, diver 3 surveyed hard corals (including fire corals) species and gorgonians and sponges. Diver 4 surveyed the algal community and substratum (coverage of bedrock, dead coral, rubble, sand and mud). Sponges and gorgonians were recorded in life form categories and seaweeds were classified into three groups (green, red and brown algae) and identified to a range of taxonomic levels such as life form, genera or species. Diver 4 also counted numbers of commercially important lobsters (Panulirus argus) and conch (Strombus gigas). Pair B survey used a 5 point semi-quantitative scale: 1 = Rare; 2 = Occasional; 3 = Frequent; 4 = Abundant and 5 = Dominant. This scale is also used for CCC transect assessments of reef zonation (Raines et al., 1993; Mumby et al., 1995). To maintain the accuracy of fish counts, sizes of individuals were not estimated during this study. Volunteers are capable of accurate assessments of length
Methods Turneffe Atoll commercial species report
10
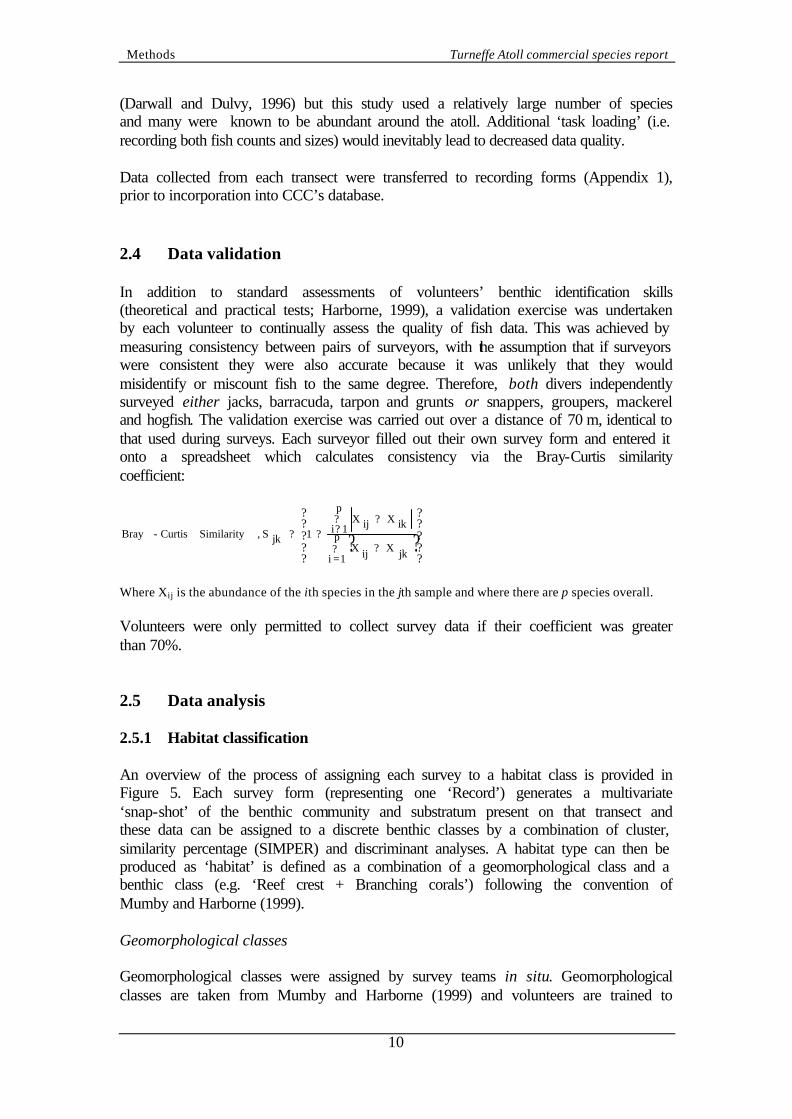
(Darwall and Dulvy, 1996) but this study used a relatively large number of species and many were known to be abundant around the atoll. Additional ‘task loading’ (i.e. recording both fish counts and sizes) would inevitably lead to decreased data quality. Data collected from each transect were transferred to recording forms (Appendix 1), prior to incorporation into CCC’s database. 2.4 Data validation In addition to standard assessments of volunteers’ benthic identification skills (theoretical and practical tests; Harborne, 1999), a validation exercise was undertaken by each volunteer to continually assess the quality of fish data. This was achieved by measuring consistency between pairs of surveyors, with the assumption that if surveyors were consistent they were also accurate because it was unlikely that they would misidentify or miscount fish to the same degree. Therefore, both divers independently surveyed either jacks, barracuda, tarpon and grunts or snappers, groupers, mackerel and hogfish. The validation exercise was carried out over a distance of 70 m, identical to that used during surveys. Each surveyor filled out their own survey form and entered it onto a spreadsheet which calculates consistency via the Bray-Curtis similarity coefficient:
? ????
?
?
???
?
?
? ?
??
??? p
1=i jkXijX
p
1i ikXijX1jkS ,Similarity Curtis-Bray
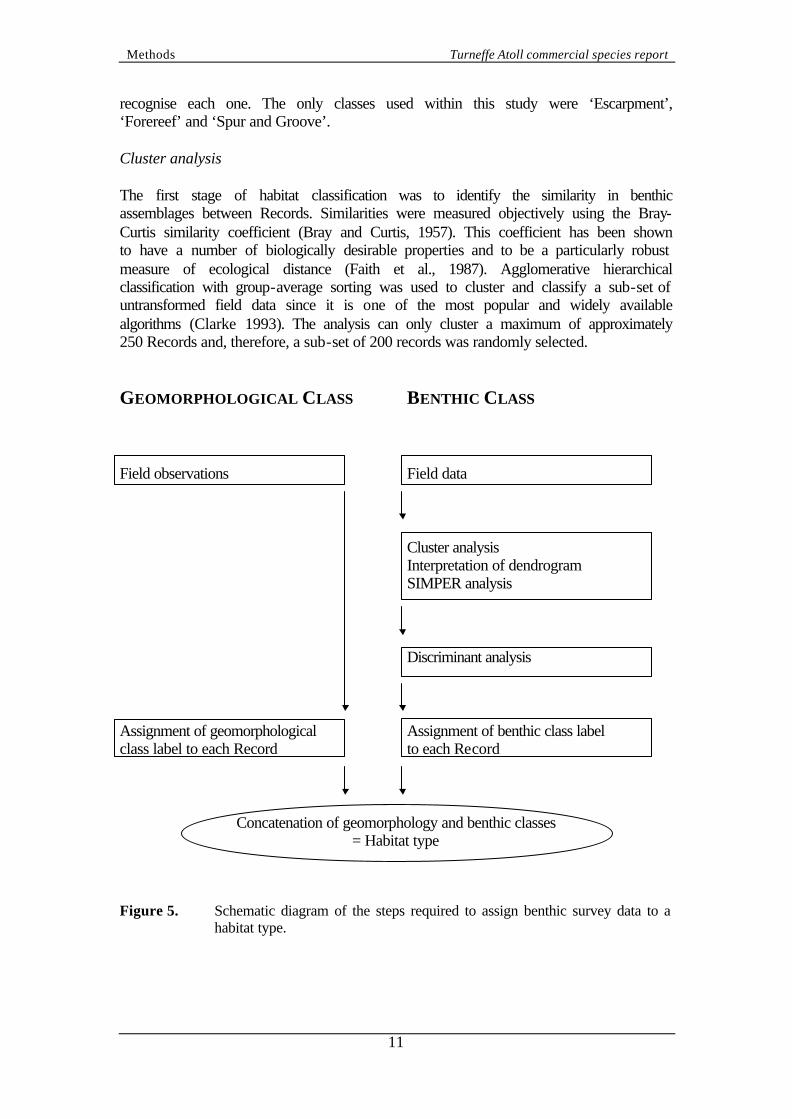
Where Xij is the abundance of the ith species in the jth sample and where there are p species overall. Volunteers were only permitted to collect survey data if their coefficient was greater than 70%. 2.5 Data analysis 2.5.1 Habitat classification An overview of the process of assigning each survey to a habitat class is provided in Figure 5. Each survey form (representing one ‘Record’) generates a multivariate ‘snap-shot’ of the benthic community and substratum present on that transect and these data can be assigned to a discrete benthic classes by a combination of cluster, similarity percentage (SIMPER) and discriminant analyses. A habitat type can then be produced as ‘habitat’ is defined as a combination of a geomorphological class and a benthic class (e.g. ‘Reef crest + Branching corals’) following the convention of Mumby and Harborne (1999). Geomorphological classes Geomorphological classes were assigned by survey teams in situ. Geomorphological classes are taken from Mumby and Harborne (1999) and volunteers are trained to
Methods Turneffe Atoll commercial species report
11
recognise each one. The only classes used within this study were ‘Escarpment’, ‘Forereef’ and ‘Spur and Groove’. Cluster analysis The first stage of habitat classification was to identify the similarity in benthic assemblages between Records. Similarities were measured objectively using the Bray-Curtis similarity coefficient (Bray and Curtis, 1957). This coefficient has been shown to have a number of biologically desirable properties and to be a particularly robust measure of ecological distance (Faith et al., 1987). Agglomerative hierarchical classification with group-average sorting was used to cluster and classify a sub-set of untransformed field data since it is one of the most popular and widely available algorithms (Clarke 1993). The analysis can only cluster a maximum of approximately 250 Records and, therefore, a sub-set of 200 records was randomly selected. GEOMORPHOLOGICAL CLASS BENTHIC CLASS Field observations Field data
Cluster analysis Interpretation of dendrogram SIMPER analysis
Discriminant analysis Assignment of geomorphological Assignment of benthic class label class label to each Record to each Record
Concatenation of geomorphology and benthic classes = Habitat type
Figure 5. Schematic diagram of the steps required to assign benthic survey data to a
habitat type.
Methods Turneffe Atoll commercial species report
12
Interpretation and refinement of dendrogram The dendrogram resulting from cluster analysis was then divided into separate ‘clusters’, each representing a distinct benthic class. Clusters were resolved up to a maximum similarity of 60%, since previous studies have indicated that separation of Records beyond this similarity reflects intra-habitat heterogeneity rather than inter-habitat differences. Any individual Records that were not included in a cluster were deleted removed for clarity and labelled as ‘Unknown’. SIMPER analysis Characteristic species or substratum categories of each cluster were then determined using Similarity Percentage (SIMPER) analysis (Clarke, 1993) within ‘PRIMER’ (Plymouth Routines in Multivariate Ecological Research) software. In order to highlight characteristic features of a given cluster, SIMPER calculates the average Bray-Curtis similarity between all pairs of intra-group samples (e.g. between all sites of the first cluster). Since the Bray-Curtis similarity is the algebraic sum of contributions from each species, average similarity between Records of the first cluster can be expressed in terms of average contribution from each species. The standard deviation provided a measure of how consistently a given species contributes to the similarity between Records. A good characteristic species contributed heavily to intra-habitat similarity and had a small standard deviation. Discriminant analysis A multivariate discriminant function (Hand, 1981) was established to assign Records not included in the original sub-set of clustered data to one of the clusters. Discriminant analysis used the raw benthic and substratum data of transects included in the dengrogram to predict the probability that each of the additional Records also belongs to one of the benthic classes (e.g. ‘there is an 80% probability that Record A is sufficiently similar to the Records in cluster X to also be placed into that class’). To ensure conservative data analysis, only Records that were assigned to a benthic class with a probability of greater than 70% were used and the remainder were classified as ‘Unknown’. Assignment of benthic class The results from SIMPER analysis were then used to assign benthic class labels to each cluster and hence each Record within the data set. Benthic classes used were taken from a regional classification scheme for the Caribbean (Mumby and Harborne, 1999). The benthic classes listed within this scheme are2:
2 Class characteristics are described in detail in Mumby et al. (1998).
Methods Turneffe Atoll commercial species report
13
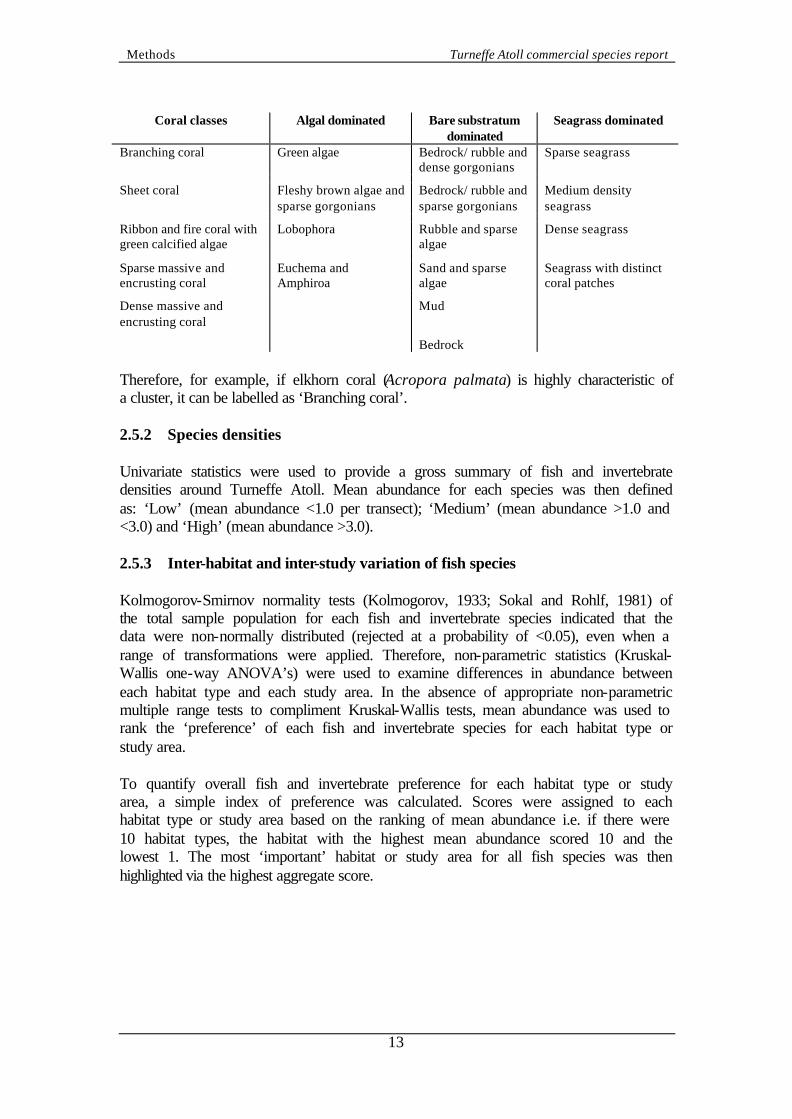
Coral classes Algal dominated Bare substratum
dominated Seagrass dominated
Branching coral Green algae Bedrock/ rubble and dense gorgonians
Sparse seagrass
Sheet coral Fleshy brown algae and
sparse gorgonians Bedrock/ rubble and sparse gorgonians
Medium density seagrass
Ribbon and fire coral with green calcified algae
Lobophora Rubble and sparse algae
Dense seagrass
Sparse massive and encrusting coral
Euchema and Amphiroa
Sand and sparse algae
Seagrass with distinct coral patches
Dense massive and encrusting coral
Mud
Bedrock Therefore, for example, if elkhorn coral (Acropora palmata) is highly characteristic of a cluster, it can be labelled as ‘Branching coral’. 2.5.2 Species densities Univariate statistics were used to provide a gross summary of fish and invertebrate densities around Turneffe Atoll. Mean abundance for each species was then defined as: ‘Low’ (mean abundance <1.0 per transect); ‘Medium’ (mean abundance >1.0 and <3.0) and ‘High’ (mean abundance >3.0). 2.5.3 Inter-habitat and inter-study variation of fish species Kolmogorov-Smirnov normality tests (Kolmogorov, 1933; Sokal and Rohlf, 1981) of the total sample population for each fish and invertebrate species indicated that the data were non-normally distributed (rejected at a probability of <0.05), even when a range of transformations were applied. Therefore, non-parametric statistics (Kruskal-Wallis one-way ANOVA’s) were used to examine differences in abundance between each habitat type and each study area. In the absence of appropriate non-parametric multiple range tests to compliment Kruskal-Wallis tests, mean abundance was used to rank the ‘preference’ of each fish and invertebrate species for each habitat type or study area. To quantify overall fish and invertebrate preference for each habitat type or study area, a simple index of preference was calculated. Scores were assigned to each habitat type or study area based on the ranking of mean abundance i.e. if there were 10 habitat types, the habitat with the highest mean abundance scored 10 and the lowest 1. The most ‘important’ habitat or study area for all fish species was then highlighted via the highest aggregate score.

Results Turneffe Atoll commercial species report
14
3. RESULTS 3.1 Data collection CCC’s survey programme generated a total 1099 transects. Figure 6 shows the depths at which the transects were conducted. Figure 6. Proportion of surveys at each depth around Turneffe Atoll. 3.2 Benthic data Cluster analysis of a subset of benthic data produced the dendrogram shown in Figure 7. Five clusters were highlighted from the 145 Records used. A total of 55 Records within the subset did not group with the five main clusters and were discarded.
6 m 27%
12 m 27%
18 m 24%
20-24 m22%

Results Turneffe Atoll commercial species report
15
Figure 7. Final dendrogram showing the five benthic clusters delineated by
cluster analysis. Y-axis represents Bray-Curtis similarity (%).
1
4
2
3
5
100 60 50 40 30 20 10 90 80 70

Results Turneffe Atoll commercial species report
16
Table 2 displays the key characteristic species and substratum categories of each benthic class, as highlighted by SIMPER analysis. These characteristic species facilitated the assignment of benthic class labels. These labels followed the classification scheme of Mumby and Harborne (1999). Table 2. Key characteristic species and substratum categories of the five benthic
classes identified during this study. ‘Cluster’ refers to the labels in Figure 7. Percentage contribution of each species or substratum category shown in parentheses.
Cluster
1 2 3 4 5 Benthic class label
Sand with sparse algae Bedrock/ rubble and sparse gorgonians
Bedrock/ rubble and dense gorgonians
Dense massive and encrusting coral
Sparse massive and encrusting coral
Most characteristic species and substratum categories Sand (65.7) Penicillus capitatus (9.2) Dictyota spp. (5.0) Thalassia testudinum (4.0) Halimeda incrassata (3.4) Udotea flabellum (3.2) Halimeda monile (2.0) Halimeda tuna (1.2) Halophila decipiens (1.1) Udotea wilsonii (1.0)
Sand (8.7) Rubble (4.8) Dead coral (4.8) Gorgonia ventalina (4.8) Dichocoenia stokesii (4.8) Sidastrea siderea (4.8) Branching plume (4.0) Montastraea annularis (4.0) Agaricia agricites (3.9) Bedrock (3.5)
Sand (8.0) Branching plume (7.2) Dictyota spp. (7.0) Montastraea annularis (6.1) Rubble (5.0) Gorgonia ventalina (4.8) Halimeda tuna (4.2) Porites asteroides (4.2) M. cavernosa (4.1) Branching rod (3.8)
Montastraea annularis (6.6)Branching plume (6.0) Branching rod (4.6) Agaricia agricites (4.5) Halimeda tuna (4.5) Sand (4.4) M. cavernosa (4.3) Dictyota spp. (4.3) Bedrock (3.9) Gorgonia ventalina (3.4)
Montastraea annularis (4.8) Sand (4.4) Branching plume (3.8) Bedrock (3.8) M. cavernosa (3.6) Gorgonia ventalina (3.5) Meandrina meandrites (3.2) Dictyota spp. (3.1) Branching rod (3.1) Agaricia agricites (3.0)
Table 2 shows that Cluster 1 was easily identifiable since it was dominated by sand. Clusters 2 and 3 were also characterised by a high proportion of sand and sparse algae, however, the highly characteristic gorgonian species (e.g. Gorgonia ventilina) and bedrock and rubble indicated ‘Bedrock/ rubble gorgonian’ classes. Note that often in gorgonian rich areas a thin layer of sand covered areas of bedrock and, therefore, ‘sand’ should actually be viewed as ‘sand/ bedrock mix’. Clusters 2 and 3 were distinguished by the density of gorgonians present (generally higher in cluster 3). Finally, clusters 4 and 5 were distinguishable by a diverse community, including abundant hard corals, particularly the reef builder Montastraea annularis. Clusters 4 and 5 were distinguished by the density of the coral community (higher in cluster 4). Following cluster and SIMPER analysis, the remaining Records were assigned to a benthic class via discriminant analysis. A total of 190 Records (17.3%) were discarded because the analysis did not assign them to one of the five benthic classes, representing a conservative approach to data analysis. Figure 8 shows the final proportion of transects in each of the five benthic classes. Figure 8. Distribution of Records between the five benthic classes identified on Turneffe
Atoll.
Bedrock/rubble and sparse gorgonians
4%
Sparse massive and encrusting coral49%
Dense massive and encrusting coral29%
Bedrock/rubble and dense gorgonians
10%
Sand and sparse algae8%
Results Turneffe Atoll commercial species report
17
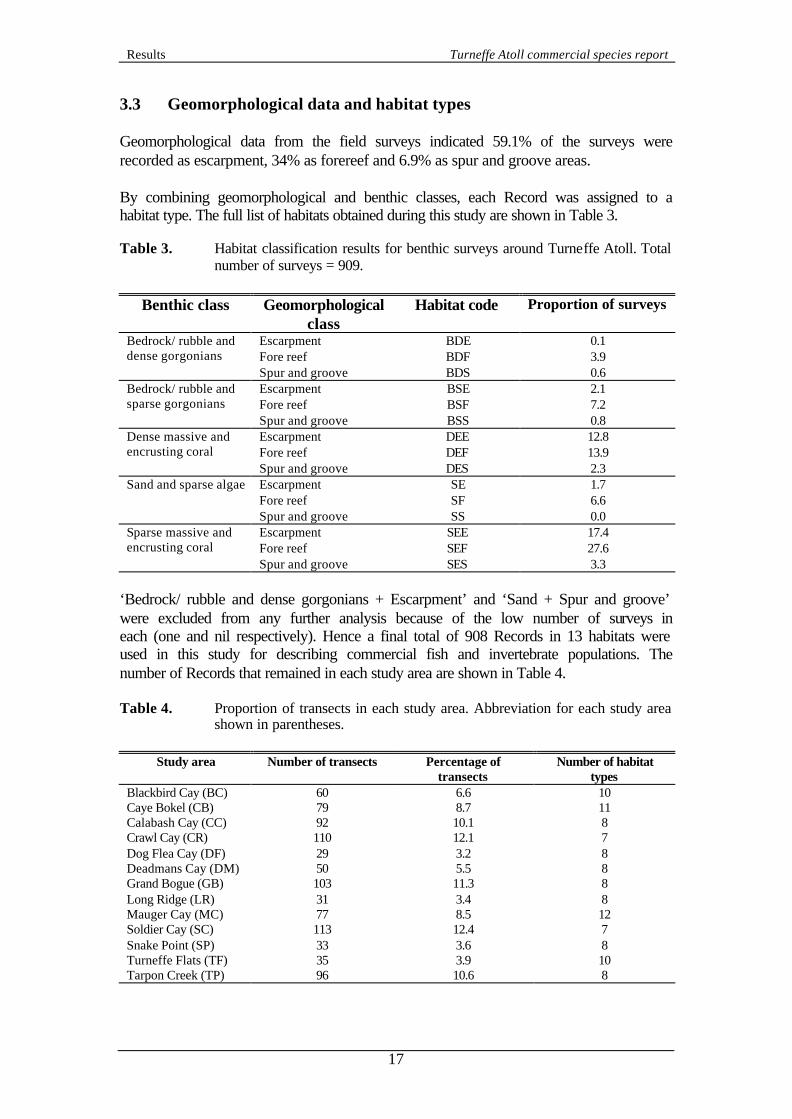
3.3 Geomorphological data and habitat types Geomorphological data from the field surveys indicated 59.1% of the surveys were recorded as escarpment, 34% as forereef and 6.9% as spur and groove areas. By combining geomorphological and benthic classes, each Record was assigned to a habitat type. The full list of habitats obtained during this study are shown in Table 3. Table 3. Habitat classification results for benthic surveys around Turneffe Atoll. Total
number of surveys = 909.
Benthic class Geomorphological class
Habitat code Proportion of surveys
Escarpment BDE 0.1 Fore reef BDF 3.9
Bedrock/ rubble and dense gorgonians
Spur and groove BDS 0.6 Escarpment BSE 2.1 Fore reef BSF 7.2
Bedrock/ rubble and sparse gorgonians
Spur and groove BSS 0.8 Escarpment DEE 12.8 Fore reef DEF 13.9
Dense massive and encrusting coral
Spur and groove DES 2.3 Escarpment SE 1.7 Fore reef SF 6.6
Sand and sparse algae
Spur and groove SS 0.0 Escarpment SEE 17.4 Fore reef SEF 27.6
Sparse massive and encrusting coral
Spur and groove SES 3.3 ‘Bedrock/ rubble and dense gorgonians + Escarpment’ and ‘Sand + Spur and groove’ were excluded from any further analysis because of the low number of surveys in each (one and nil respectively). Hence a final total of 908 Records in 13 habitats were used in this study for describing commercial fish and invertebrate populations. The number of Records that remained in each study area are shown in Table 4. Table 4. Proportion of transects in each study area. Abbreviation for each study area
shown in parentheses.
Study area Number of transects Percentage of transects
Number of habitat types
Blackbird Cay (BC) 60 6.6 10 Caye Bokel (CB) 79 8.7 11 Calabash Cay (CC) 92 10.1 8 Crawl Cay (CR) 110 12.1 7 Dog Flea Cay (DF) 29 3.2 8 Deadmans Cay (DM) 50 5.5 8 Grand Bogue (GB) 103 11.3 8 Long Ridge (LR) 31 3.4 8 Mauger Cay (MC) 77 8.5 12 Soldier Cay (SC) 113 12.4 7 Snake Point (SP) 33 3.6 8 Turneffe Flats (TF) 35 3.9 10 Tarpon Creek (TP) 96 10.6 8
Results Turneffe Atoll commercial species report
18
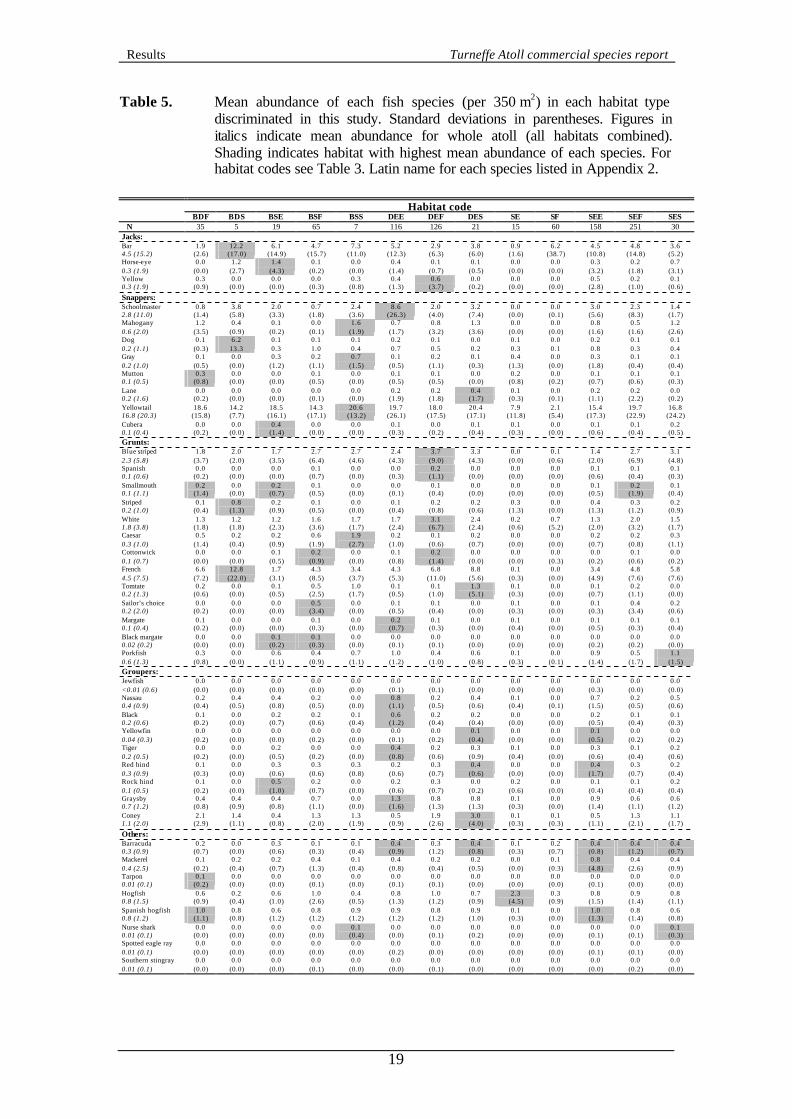
3.4 Fish data 3.4.1 Summary statistics Table 5 shows the mean abundance of each species surveyed during this study in each of the habitat types discriminated. All species were seen during the study, although the number of individuals varied from three for jewfish to 15,252 for yellowtail snappers. Distributions were also extremely patchy and all means have relatively high standard deviations. Shading within Table 5 provides a indication of which habitat was the most preferred (i.e. had the highest mean abundance) by each species. However, these apparent preference are not necessarily statistically significant because of large standard deviations and variable sample sizes of each habitat type. Table 5 provides evidence that coral or gorgonian rich habitats support higher fish populations than sand areas.
Results Turneffe Atoll commercial species report
19
Table 5. Mean abundance of each fish species (per 350 m2) in each habitat type discriminated in this study. Standard deviations in parentheses. Figures in italics indicate mean abundance for whole atoll (all habitats combined). Shading indicates habitat with highest mean abundance of each species. For habitat codes see Table 3. Latin name for each species listed in Appendix 2.
Habitat code
BDF BDS BSE BSF BSS DEE DEF DES SE SF SEE SEF SES N 35 5 19 65 7 116 126 21 15 60 158 251 30
Jacks: Bar 4.5 (15.2)
1.9 (2.6)
12.2 (17.0)
6.1 (14.9)
4.7 (15.7)
7.3 (11.0)
5.2 (12.3)
2.9 (6.3)
3.8 (6.0)
0.9 (1.6)
6.2 (38.7)
4.5 (10.8)
4.8 (14.8)
3.6 (5.2)
Horse-eye 0.3 (1.9)
0.0 (0.0)
1.2 (2.7)
1.4 (4.3)
0.1 (0.2)
0.0 (0.0)
0.4 (1.4)
0.1 (0.7)
0.1 (0.5)
0.0 (0.0)
0.0 (0.0)
0.3 (3.2)
0.2 (1.8)
0.7 (3.1)
Yellow 0.3 (1.9)
0.3 (0.9)
0.0 (0.0)
0.0 (0.0)
0.0 (0.3)
0.3 (0.8)
0.4 (1.3)
0.6 (3.7)
0.0 (0.2)
0.0 (0.0)
0.0 (0.0)
0.5 (2.8)
0.2 (1.0)
0.1 (0.6)
Snappers: Schoolmaster 2.8 (11.0)
0.8 (1.4)
3.8 (5.8)
2.0 (3.3)
0.7 (1.8)
2.4 (3.6)
8.6 (26.3)
2.0 (4.0)
3.2 (7.4)
0.0 (0.0)
0.0 (0.1)
3.0 (5.6)
2.3 (8.3)
1.4 (1.7)
Mahogany 0.6 (2.0)
1.2 (3.5)
0.4 (0.9)
0.1 (0.2)
0.0 (0.1)
1.6 (1.9)
0.7 (1.7)
0.8 (3.2)
1.3 (3.6)
0.0 (0.0)
0.0 (0.0)
0.8 (1.6)
0.5 (1.6)
1.2 (2.6)
Dog 0.2 (1.1)
0.1 (0.3)
6.2 13.3
0.1 0.3
0.1 1.0
0.1 0.4
0.2 0.7
0.1 0.5
0.0 0.2
0.1 0.3
0.0 0.1
0.2 0.8
0.1 0.3
0.1 0.4
Gray 0.2 (1.0)
0.1 (0.5)
0.0 (0.0)
0.3 (1.2)
0.2 (1.1)
0.7 (1.5)
0.1 (0.5)
0.2 (1.1)
0.1 (0.3)
0.4 (1.3)
0.0 (0.0)
0.3 (1.8)
0.1 (0.4)
0.1 (0.4)
Mutton 0.1 (0.5)
0.3 (0.8)
0.0 (0.0)
0.0 (0.0)
0.1 (0.5)
0.0 (0.0)
0.1 (0.5)
0.1 (0.5)
0.0 (0.0)
0.2 (0.8)
0.0 (0.2)
0.1 (0.7)
0.1 (0.6)
0.1 (0.3)
Lane 0.2 (1.6)
0.0 (0.2)
0.0 (0.0)
0.0 (0.0)
0.0 (0.1)
0.0 (0.0)
0.2 (1.9)
0.2 (1.8)
0.4 (1.7)
0.1 (0.3)
0.0 (0.1)
0.2 (1.1)
0.2 (2.2)
0.0 (0.2)
Yellowtail 16.8 (20.3)
18.6 (15.8)
14.2 (7.7)
18.5 (16.1)
14.3 (17.1)
20.6 (13.2)
19.7 (26.1)
18.0 (17.5)
20.4 (17.1)
7.9 (11.8)
2.1 (5.4)
15.4 (17.3)
19.7 (22.9)
16.8 (24.2)
Cubera 0.1 (0.4)
0.0 (0.2)
0.0 (0.0)
0.4 (1.4)
0.0 (0.0)
0.0 (0.0)
0.1 (0.3)
0.0 (0.2)
0.1 (0.4)
0.1 (0.3)
0.0 (0.0)
0.1 (0.6)
0.1 (0.4)
0.2 (0.5)
Grunts: Blue striped 2.3 (5.8)
1.8 (3.7)
2.0 (2.0)
1.7 (3.5)
2.7 (6.4)
2.7 (4.6)
2.4 (4.3)
3.7 (9.0)
3.3 (4.3)
0.0 (0.0)
0.1 (0.6)
1.4 (2.0)
2.7 (6.9)
3.1 (4.8)
Spanish 0.1 (0.6)
0.0 (0.2)
0.0 (0.0)
0.0 (0.0)
0.1 (0.7)
0.0 (0.0)
0.0 (0.3)
0.2 (1.1)
0.0 (0.0)
0.0 (0.0)
0.0 (0.0)
0.1 (0.6)
0.1 (0.4)
0.1 (0.3)
Smallmouth 0.1 (1.1)
0.2 (1.4)
0.0 (0.0)
0.2 (0.7)
0.1 (0.5)
0.0 (0.0)
0.0 (0.1)
0.1 (0.4)
0.0 (0.0)
0.0 (0.0)
0.0 (0.0)
0.1 (0.5)
0.2 (1.9)
0.1 (0.4)
Striped 0.2 (1.0)
0.1 (0.4)
0.8 (1.3)
0.2 (0.9)
0.1 (0.5)
0.0 (0.0)
0.1 (0.4)
0.2 (0.8)
0.2 (0.6)
0.3 (1.3)
0.0 (0.0)
0.4 (1.3)
0.3 (1.2)
0.2 (0.9)
White 1.8 (3.8)
1.3 (1.8)
1.2 (1.8)
1.2 (2.3)
1.6 (3.6)
1.7 (1.7)
1.7 (2.4)
3.1 (6.7)
2.4 (2.4)
0.2 (0.6)
0.7 (5.2)
1.3 (2.0)
2.0 (3.2)
1.5 (1.7)
Caesar 0.3 (1.0)
0.5 (1.4)
0.2 (0.4)
0.2 (0.9)
0.6 (1.9)
1.9 (2.7)
0.2 (1.0)
0.1 (0.6)
0.2 (0.7)
0.0 (0.0)
0.0 (0.0)
0.2 (0.7)
0.2 (0.8)
0.3 (1.1)
Cottonwick 0.1 (0.7)
0.0 (0.0)
0.0 (0.0)
0.1 (0.5)
0.2 (0.9)
0.0 (0.0)
0.1 (0.8)
0.2 (1.4)
0.0 (0.0)
0.0 (0.0)
0.0 (0.3)
0.0 (0.2)
0.1 (0.6)
0.0 (0.2)
French 4.5 (7.5)
6.6 (7.2)
12.8 (22.0)
1.7 (3.1)
4.3 (8.5)
3.4 (3.7)
4.3 (5.3)
6.8 (11.0)
8.8 (5.6)
0.1 (0.3)
0.0 (0.0)
3.4 (4.9)
4.8 (7.6)
5.8 (7.6)
Tomtate 0.2 (1.3)
0.2 (0.6)
0.0 (0.0)
0.1 (0.5)
0.5 (2.5)
1.0 (1.7)
0.1 (0.5)
0.1 (1.0)
1.3 (5.1)
0.1 (0.3)
0.0 (0.0)
0.1 (0.7)
0.2 (1.1)
0.0 (0.0)
Sailor’s choice 0.2 (2.0)
0.0 (0.2)
0.0 (0.0)
0.0 (0.0)
0.5 (3.4)
0.0 (0.0)
0.1 (0.5)
0.1 (0.4)
0.0 (0.0)
0.1 (0.3)
0.0 (0.0)
0.1 (0.3)
0.4 (3.4)
0.2 (0.6)
Margate 0.1 (0.4)
0.1 (0.2)
0.0 (0.0)
0.0 (0.0)
0.1 (0.3)
0.0 (0.0)
0.2 (0.7)
0.1 (0.3)
0.0 (0.0)
0.1 (0.4)
0.0 (0.0)
0.1 (0.5)
0.1 (0.3)
0.1 (0.4)
Black margate 0.02 (0.2)
0.0 (0.0)
0.0 (0.0)
0.1 (0.2)
0.1 (0.3)
0.0 (0.0)
0.0 (0.1)
0.0 (0.1)
0.0 (0.0)
0.0 (0.0)
0.0 (0.0)
0.0 (0.2)
0.0 (0.2)
0.0 (0.0)
Porkfish 0.6 (1.3)
0.3 (0.8)
0.0 (0.0)
0.6 (1.1)
0.4 (0.9)
0.7 (1.1)
1.0 (1.2)
0.4 (1.0)
0.6 (0.8)
0.1 (0.3)
0.0 (0.1)
0.9 (1.4)
0.5 (1.7)
1.1 (1.5)
Groupers: Jewfish <0.01 (0.6)
0.0 (0.0)
0.0 (0.0)
0.0 (0.0)
0.0 (0.0)
0.0 (0.0)
0.0 (0.1)
0.0 (0.1)
0.0 (0.0)
0.0 (0.0)
0.0 (0.0)
0.0 (0.3)
0.0 (0.0)
0.0 (0.0)
Nassau 0.4 (0.9)
0.2 (0.4)
0.4 (0.5)
0.4 (0.8)
0.2 (0.5)
0.0 (0.0)
0.8 (1.1)
0.2 (0.5)
0.4 (0.6)
0.1 (0.4)
0.0 (0.1)
0.7 (1.5)
0.2 (0.5)
0.5 (0.6)
Black 0.2 (0.6)
0.1 (0.2)
0.0 (0.0)
0.2 (0.7)
0.2 (0.6)
0.1 (0.4)
0.6 (1.2)
0.2 (0.4)
0.2 (0.4)
0.0 (0.0)
0.0 (0.0)
0.2 (0.5)
0.1 (0.4)
0.1 (0.3)
Yellowfin 0.04 (0.3)
0.0 (0.2)
0.0 (0.0)
0.0 (0.0)
0.0 (0.2)
0.0 (0.0)
0.0 (0.1)
0.0 (0.2)
0.1 (0.4)
0.0 (0.0)
0.0 (0.0)
0.1 (0.5)
0.0 (0.2)
0.0 (0.2)
Tiger 0.2 (0.5)
0.0 (0.2)
0.0 (0.0)
0.2 (0.5)
0.0 (0.2)
0.0 (0.0)
0.4 (0.8)
0.2 (0.6)
0.3 (0.9)
0.1 (0.4)
0.0 (0.0)
0.3 (0.6)
0.1 (0.4)
0.2 (0.6)
Red hind 0.3 (0.9)
0.1 (0.3)
0.0 (0.0)
0.3 (0.6)
0.3 (0.6)
0.3 (0.8)
0.2 (0.6)
0.3 (0.7)
0.4 (0.6)
0.0 (0.0)
0.0 (0.0)
0.4 (1.7)
0.3 (0.7)
0.2 (0.4)
Rock hind 0.1 (0.5)
0.1 (0.2)
0.0 (0.0)
0.5 (1.0)
0.2 (0.7)
0.0 (0.0)
0.2 (0.6)
0.3 (0.7)
0.0 (0.2)
0.2 (0.6)
0.0 (0.0)
0.1 (0.4)
0.1 (0.4)
0.2 (0.4)
Graysby 0.7 (1.2)
0.4 (0.8)
0.4 (0.9)
0.4 (0.8)
0.7 (1.1)
0.0 (0.0)
1.3 (1.6)
0.8 (1.3)
0.8 (1.3)
0.1 (0.3)
0.0 (0.0)
0.9 (1.4)
0.6 (1.1)
0.6 (1.2)
Coney 1.1 (2.0)
2.1 (2.9)
1.4 (1.1)
0.4 (0.8)
1.3 (2.0)
1.3 (1.9)
0.5 (0.9)
1.9 (2.6)
3.0 (4.0)
0.1 (0.3)
0.1 (0.3)
0.5 (1.1)
1.3 (2.1)
1.1 (1.7)
Others: Barracuda 0.3 (0.9)
0.2 (0.7)
0.0 (0.0)
0.3 (0.6)
0.1 (0.3)
0.1 (0.4)
0.4 (0.9)
0.3 (1.2)
0.4 (0.8)
0.1 (0.3)
0.2 (0.7)
0.4 (0.8)
0.4 (1.2)
0.4 (0.7)
Mackerel 0.4 (2.5)
0.1 (0.2)
0.2 (0.4)
0.2 (0.7)
0.4 (1.3)
0.1 (0.4)
0.4 (0.8)
0.2 (0.4)
0.2 (0.5)
0.0 (0.0)
0.1 (0.3)
0.8 (4.8)
0.4 (2.6)
0.4 (0.9)
Tarpon 0.01 (0.1)
0.1 (0.2)
0.0 (0.0)
0.0 (0.0)
0.0 (0.1)
0.0 (0.0)
0.0 (0.1)
0.0 (0.1)
0.0 (0.0)
0.0 (0.0)
0.0 (0.0)
0.0 (0.1)
0.0 (0.0)
0.0 (0.0)
Hogfish 0.8 (1.5)
0.6 (0.9)
0.2 (0.4)
0.6 (1.0)
1.0 (2.6)
0.4 (0.5)
0.8 (1.3)
1.0 (1.2)
0.7 (0.9)
2.3 (4.5)
0.3 (0.9)
0.8 (1.5)
0.9 (1.4)
0.8 (1.1)
Spanish hogfish 0.8 (1.2)
1.0 (1.1)
0.8 (0.8)
0.6 (1.2)
0.8 (1.2)
0.9 (1.2)
0.9 (1.2)
0.8 (1.2)
0.9 (1.0)
0.1 (0.3)
0.0 (0.0)
1.0 (1.3)
0.8 (1.4)
0.6 (0.8)
Nurse shark 0.01 (0.1)
0.0 (0.0)
0.0 (0.0)
0.0 (0.0)
0.0 (0.0)
0.1 (0.4)
0.0 (0.0)
0.0 (0.1)
0.0 (0.2)
0.0 (0.0)
0.0 (0.0)
0.0 (0.1)
0.0 (0.1)
0.1 (0.3)
Spotted eagle ray 0.01 (0.1)
0.0 (0.0)
0.0 (0.0)
0.0 (0.0)
0.0 (0.0)
0.0 (0.0)
0.0 (0.2)
0.0 (0.0)
0.0 (0.0)
0.0 (0.0)
0.0 (0.0)
0.0 (0.1)
0.0 (0.1)
0.0 (0.0)
Southern stingray 0.01 (0.1)
0.0 (0.0)
0.0 (0.0)
0.0 (0.0)
0.0 (0.1)
0.0 (0.0)
0.0 (0.0)
0.0 (0.1)
0.0 (0.0)
0.0 (0.0)
0.0 (0.0)
0.0 (0.0)
0.0 (0.2)
0.0 (0.0)
Results Turneffe Atoll commercial species report
20
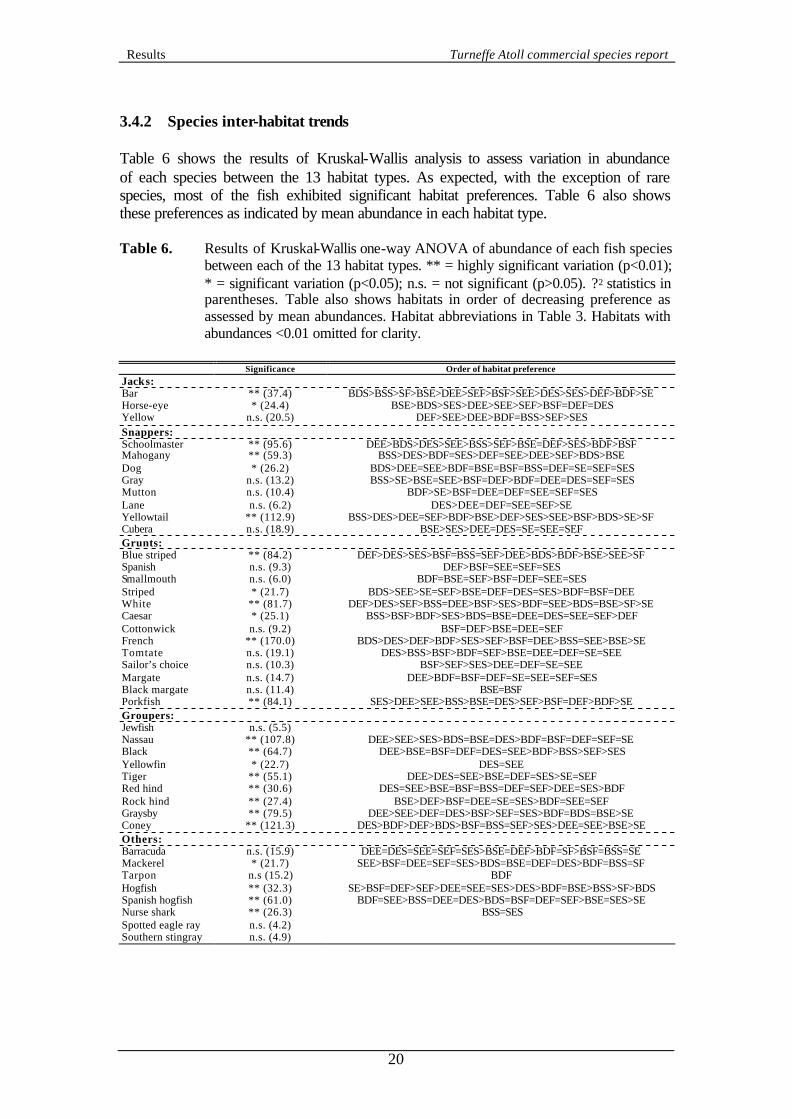
3.4.2 Species inter-habitat trends Table 6 shows the results of Kruskal-Wallis analysis to assess variation in abundance of each species between the 13 habitat types. As expected, with the exception of rare species, most of the fish exhibited significant habitat preferences. Table 6 also shows these preferences as indicated by mean abundance in each habitat type. Table 6. Results of Kruskal-Wallis one-way ANOVA of abundance of each fish species
between each of the 13 habitat types. ** = highly significant variation (p<0.01); * = significant variation (p<0.05); n.s. = not significant (p>0.05). ? 2 statistics in parentheses. Table also shows habitats in order of decreasing preference as assessed by mean abundances. Habitat abbreviations in Table 3. Habitats with abundances <0.01 omitted for clarity.
Significance Order of habitat preference
Jacks: Bar ** (37.4) BDS>BSS>SF>BSE>DEE>SEF>BSF>SEE>DES>SES>DEF>BDF>SE Horse-eye * (24.4) BSE>BDS>SES>DEE>SEE>SEF>BSF=DEF=DES Yellow n.s. (20.5) DEF>SEE>DEE>BDF=BSS>SEF>SES Snappers: Schoolmaster ** (95.6) DEE>BDS>DES>SEE>BSS>SEF>BSE=DEF>SES>BDF>BSF Mahogany ** (59.3) BSS>DES>BDF=SES>DEF=SEE>DEE>SEF>BDS>BSE Dog * (26.2) BDS>DEE=SEE>BDF=BSE=BSF=BSS=DEF=SE=SEF=SES Gray n.s. (13.2) BSS>SE>BSE=SEE>BSF=DEF>BDF=DEE=DES=SEF=SES Mutton n.s. (10.4) BDF>SE>BSF=DEE=DEF=SEE=SEF=SES Lane n.s. (6.2) DES>DEE=DEF=SEE=SEF>SE Yellowtail ** (112.9) BSS>DES>DEE=SEF>BDF>BSE>DEF>SES>SEE>BSF>BDS>SE>SF Cubera n.s. (18.9) BSE>SES>DEE=DES=SE=SEE=SEF Grunts: Blue striped ** (84.2) DEF>DES>SES>BSF=BSS=SEF>DEE>BDS>BDF>BSE>SEE>SF Spanish n.s. (9.3) DEF>BSF=SEE=SEF=SES Smallmouth n.s. (6.0) BDF=BSE=SEF>BSF=DEF=SEE=SES Striped * (21.7) BDS>SEE>SE=SEF>BSE=DEF=DES=SES>BDF=BSF=DEE White ** (81.7) DEF>DES>SEF>BSS=DEE>BSF>SES>BDF=SEE>BDS=BSE>SF>SE Caesar * (25.1) BSS>BSF>BDF>SES>BDS=BSE=DEE=DES=SEE=SEF>DEF Cottonwick n.s. (9.2) BSF=DEF>BSE=DEE=SEF French ** (170.0) BDS>DES>DEF>BDF>SES>SEF>BSF=DEE>BSS=SEE>BSE>SE Tomtate n.s. (19.1) DES>BSS>BSF>BDF=SEF>BSE=DEE=DEF=SE=SEE Sailor’s choice n.s. (10.3) BSF>SEF>SES>DEE=DEF=SE=SEE Margate n.s. (14.7) DEE>BDF=BSF=DEF=SE=SEE=SEF=SES Black margate n.s. (11.4) BSE=BSF Porkfish ** (84.1) SES>DEE>SEE>BSS>BSE=DES>SEF>BSF=DEF>BDF>SE Groupers: Jewfish n.s. (5.5) Nassau ** (107.8) DEE>SEE>SES>BDS=BSE=DES>BDF=BSF=DEF=SEF=SE Black ** (64.7) DEE>BSE=BSF=DEF=DES=SEE>BDF>BSS>SEF>SES Yellowfin * (22.7) DES=SEE Tiger ** (55.1) DEE>DES=SEE>BSE=DEF=SES>SE=SEF Red hind ** (30.6) DES=SEE>BSE=BSF=BSS=DEF=SEF>DEE=SES>BDF Rock hind ** (27.4) BSE>DEF>BSF=DEE=SE=SES>BDF=SEE=SEF Graysby ** (79.5) DEE>SEE>DEF=DES>BSF>SEF=SES>BDF=BDS=BSE>SE Coney ** (121.3) DES>BDF>DEF>BDS>BSF=BSS=SEF>SES>DEE=SEE>BSE>SE Others: Barracuda n.s. (15.9) DEE=DES=SEE=SEF=SES>BSE=DEF>BDF=SF>BSF=BSS=SE Mackerel * (21.7) SEE>BSF=DEE=SEF=SES>BDS=BSE=DEF=DES>BDF=BSS=SF Tarpon n.s (15.2) BDF Hogfish ** (32.3) SE>BSF=DEF>SEF>DEE=SEE=SES>DES>BDF=BSE>BSS>SF>BDS Spanish hogfish ** (61.0) BDF=SEE>BSS=DEE=DES>BDS=BSF=DEF=SEF>BSE=SES>SE Nurse shark ** (26.3) BSS=SES Spotted eagle ray n.s. (4.2) Southern stingray n.s. (4.9)

Results Turneffe Atoll commercial species report
21
3.4.3 Family inter-habitat trends Table 7 summarises the mean abundance, in each habitat type, of the four major families included in this study. Table 8 highlights the variation of abundances and habitat preferences of each of the families. Similarly to individual species, mean abundances for each family in each habitat are associated with high standard deviations. As with fish species, Table 8 shows that each family has significant variation in abundance between habitats. Table 7. Mean abundance of each fish family (per 350 m2) in each habitat type
discriminated in this study. Standard deviations in parentheses. Shading indicates habitat containing highest mean abundance of each family. For habitat codes see Table 3.
Habitat code
BDF BDS BSE BSF BSS DEE DEF DES SE SF SEE SEF SES N 35 5 19 65 7 116 126 21 15 60 158 251 30
Jacks (3 species)
2.1 (2.8)
13.4 (16.1)
7.5 (17.9)
4.8 (15.7
7.6 (10.7)
6.0 (13.3)
3.6 (7.2)
4.0 (6.2)
0.9 (1.6)
6.2 (38.7)
5.3 (11.9)
5.2 (15.0)
4.4 (6.4)
Snappers (8 species)
21.1 (15.8)
24.6 (19.2)
21.3 (19.8)
15.6 (17.5)
25.4 (14.2)
29.6 (35.5)
21.4 (18.8)
25.6 (23.2)
8.7 (12.2)
2.2 (5.4)
20.2 (18.6)
23.0 (26.4)
19.8 (25.0)
Grunts (13 species)
11.1 (7.6)
17.0 (21.5)
6.1 (7.3)
11.4 (15.9)
11.4 (8.3)
10.3 (10.6)
15.2 (19.1)
16.8 (11.0)
0.9 (1.4)
0.9 (5.8)
8.1 (7.4)
11.5 (15.4)
12.5 (11.0)
Groupers (9 species)
2.9 (2.9)
2.2 (0.8)
2.4 (3.0)
2.8 (2.9)
1.7 (2.1)
4.1 (3.1)
3.9 (3.2)
5.4 (4.1)
0.6 (0.9)
0.1 (0.3)
3.2 (3.4)
2.7 (2.9)
3.0 (2.8)
Table 8. Results of Kruskal-Wallis one-way ANOVA for variation of abundance of each
fish family between each of the 13 habitat types. ** = highly significant variation (p<0.01). ? 2 statistics in parentheses. Table also shows habitats in order of decreasing preference as assessed by mean abundances. Habitat abbreviations in Table 3. Habitats with abundances <0.01 omitted for clarity.
Significance Order of habitat preference
Jacks ** (45.9) BDS>BSS=BSE>SF>DEE>SEE>SEF>BSF>SES>DES>DEF>BDF>SE Snappers ** (138.4) DEE>DES>BSS>BDS>SEF>DEF>BSE>BDF>SEE>SES>BSF>SE>SF Grunts ** (194.1) BDS>DES>DEF>SES>SEF>BSS=BSF>BDF>DEE>SEE>BSE>SE=SF Groupers ** (160.0) DES>DEE>DEF>SEE>SES>BDF>BSF>SEF>BSE>BDS>BSS>SE>SF
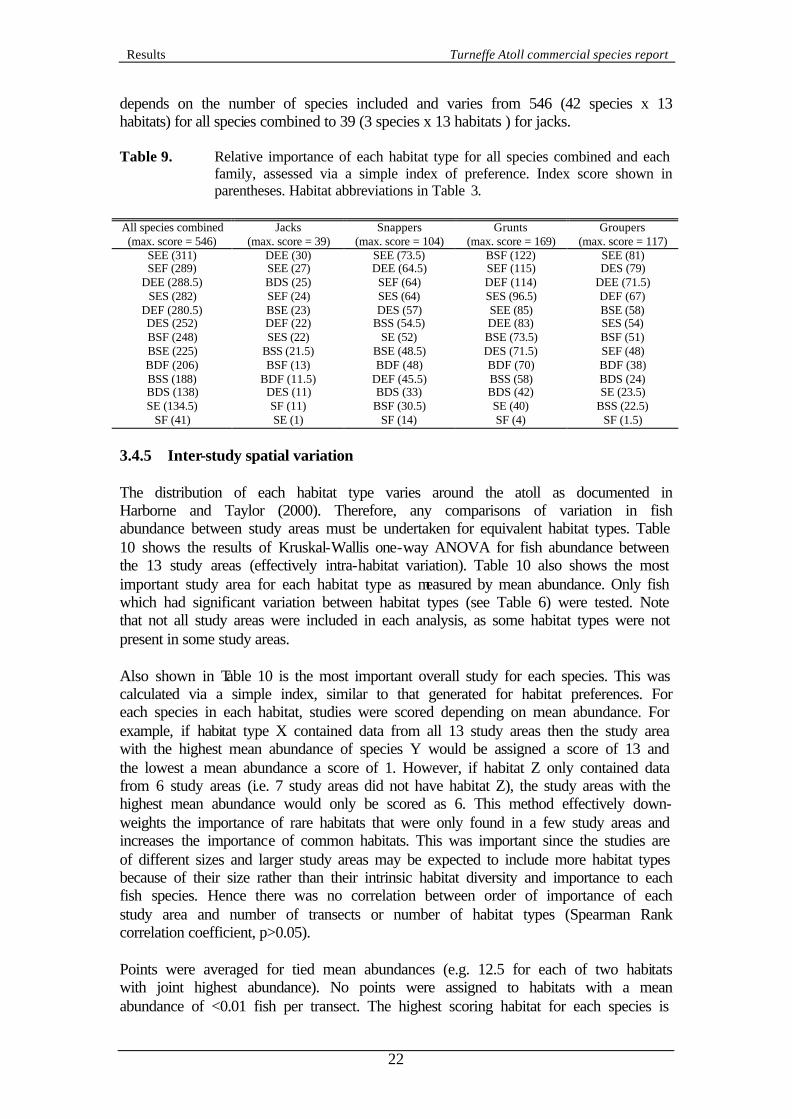
3.4.4 Summary of habitat preferences The relative importance of each habitat type for all the fish species was assessed by a simple index of preference. For each species, scores were assigned to each habitat on a scale of 13 (highest mean abundance) to 1 (lowest mean abundance). Points were averaged for tied mean abundances (e.g. 12.5 for each of two habitats with joint highest abundance). No points were assigned to habitats with a mean abundance of <0.01 fish per transect. Results are shown in Table 9. Although simple, this index provides a more sophisticated assessment of habitat preference than mean abundance for all species combined or each family since it incorporates information from each individual species. For example, the index highlights the overall importance of coral habitats, since they represent the top six scores. Gorgonian dominated habitats were less important than coral rich areas but were more important than sand patches. Table 9 also highlights variations in preference between individual families with, for example, ‘Bedrock/ rubble with sparse gorgonians’ having the highest score for grunts. Note that the maximum score
Results Turneffe Atoll commercial species report
22
depends on the number of species included and varies from 546 (42 species x 13 habitats) for all species combined to 39 (3 species x 13 habitats ) for jacks. Table 9. Relative importance of each habitat type for all species combined and each
family, assessed via a simple index of preference. Index score shown in parentheses. Habitat abbreviations in Table 3.
All species combined (max. score = 546)
Jacks (max. score = 39)
Snappers (max. score = 104)
Grunts (max. score = 169)
Groupers (max. score = 117)
SEE (311) DEE (30) SEE (73.5) BSF (122) SEE (81) SEF (289) SEE (27) DEE (64.5) SEF (115) DES (79)
DEE (288.5) BDS (25) SEF (64) DEF (114) DEE (71.5) SES (282) SEF (24) SES (64) SES (96.5) DEF (67)
DEF (280.5) BSE (23) DES (57) SEE (85) BSE (58) DES (252) DEF (22) BSS (54.5) DEE (83) SES (54) BSF (248) SES (22) SE (52) BSE (73.5) BSF (51) BSE (225) BSS (21.5) BSE (48.5) DES (71.5) SEF (48) BDF (206) BSF (13) BDF (48) BDF (70) BDF (38) BSS (188) BDF (11.5) DEF (45.5) BSS (58) BDS (24) BDS (138) DES (11) BDS (33) BDS (42) SE (23.5) SE (134.5) SF (11) BSF (30.5) SE (40) BSS (22.5)
SF (41) SE (1) SF (14) SF (4) SF (1.5)
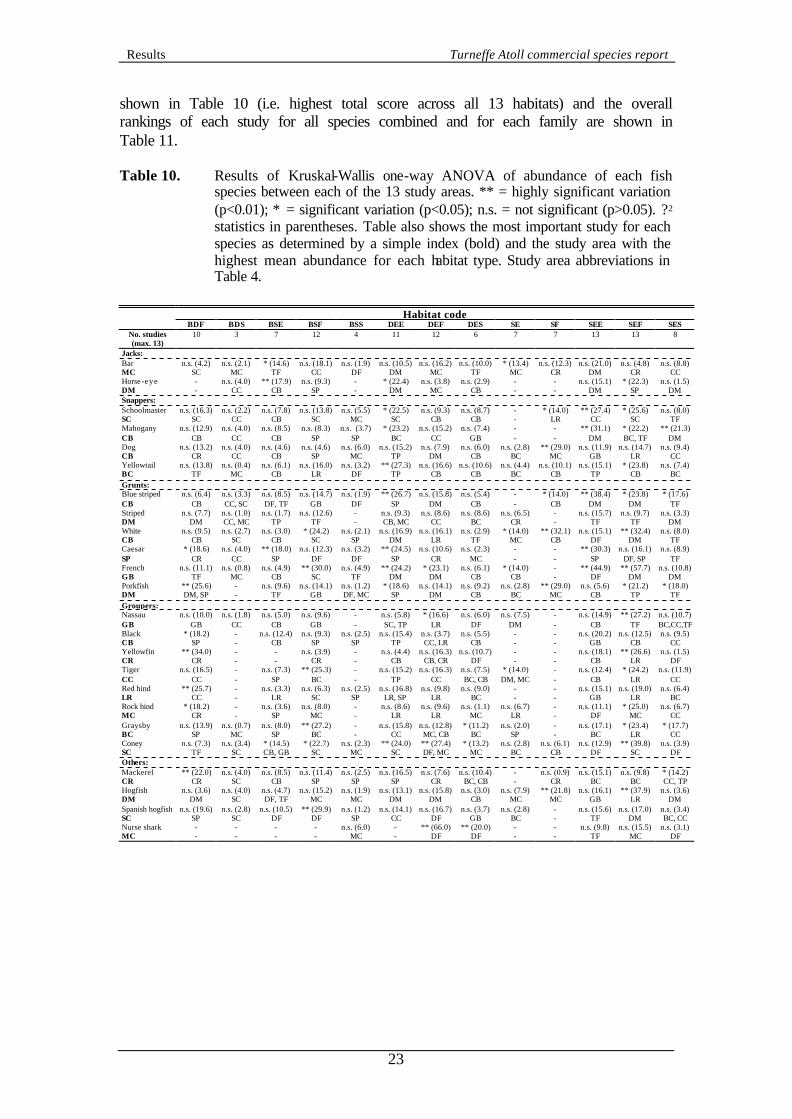
3.4.5 Inter-study spatial variation The distribution of each habitat type varies around the atoll as documented in Harborne and Taylor (2000). Therefore, any comparisons of variation in fish abundance between study areas must be undertaken for equivalent habitat types. Table 10 shows the results of Kruskal-Wallis one-way ANOVA for fish abundance between the 13 study areas (effectively intra-habitat variation). Table 10 also shows the most important study area for each habitat type as measured by mean abundance. Only fish which had significant variation between habitat types (see Table 6) were tested. Note that not all study areas were included in each analysis, as some habitat types were not present in some study areas. Also shown in Table 10 is the most important overall study for each species. This was calculated via a simple index, similar to that generated for habitat preferences. For each species in each habitat, studies were scored depending on mean abundance. For example, if habitat type X contained data from all 13 study areas then the study area with the highest mean abundance of species Y would be assigned a score of 13 and the lowest a mean abundance a score of 1. However, if habitat Z only contained data from 6 study areas (i.e. 7 study areas did not have habitat Z), the study areas with the highest mean abundance would only be scored as 6. This method effectively down-weights the importance of rare habitats that were only found in a few study areas and increases the importance of common habitats. This was important since the studies are of different sizes and larger study areas may be expected to include more habitat types because of their size rather than their intrinsic habitat diversity and importance to each fish species. Hence there was no correlation between order of importance of each study area and number of transects or number of habitat types (Spearman Rank correlation coefficient, p>0.05). Points were averaged for tied mean abundances (e.g. 12.5 for each of two habitats with joint highest abundance). No points were assigned to habitats with a mean abundance of <0.01 fish per transect. The highest scoring habitat for each species is
Results Turneffe Atoll commercial species report
23
shown in Table 10 (i.e. highest total score across all 13 habitats) and the overall rankings of each study for all species combined and for each family are shown in Table 11. Table 10. Results of Kruskal-Wallis one-way ANOVA of abundance of each fish
species between each of the 13 study areas. ** = highly significant variation (p<0.01); * = significant variation (p<0.05); n.s. = not significant (p>0.05). ? 2 statistics in parentheses. Table also shows the most important study for each species as determined by a simple index (bold) and the study area with the highest mean abundance for each habitat type. Study area abbreviations in Table 4.
Habitat code
BDF BDS BSE BSF BSS DEE DEF DES SE SF SEE SEF SES No. studies (max. 13)
10 3 7 12 4 11 12 6 7 7 13 13 8
Jacks: Bar MC
n.s. (4.2) SC
n.s. (2.1) MC
* (14.6) TF
n.s. (18.1) CC
n.s. (1.9) DF
n.s. (10.5) DM
n.s. (16.2) MC
n.s. (10.0) TF
* (13.4) MC
n.s. (12.3) CR
n.s. (21.0) DM
n.s. (4.8) CR
n.s. (8.8) CC
Horse -eye DM
- -
n.s. (4.0) CC
** (17.9) CB
n.s. (9.3) SP
- -
* (22.4) DM
n.s. (3.8) MC
n.s. (2.9) CB
- -
- -
n.s. (15.1) DM
* (22.3) SP
n.s. (1.5) DM
Snappers: Schoolmaster SC
n.s. (16.3) SC
n.s. (2.2) CC
n.s. (7.8) CB
n.s. (13.8) SC
n.s. (5.5) MC
* (22.5) SC
n.s. (9.3) CB
n.s. (8.7) CB
- -
* (14.0) LR
** (27.4) CC
* (25.6) SC
n.s. (8.0) TF
Mahogany CB
n.s. (12.9) CB
n.s. (4.0) CC
n.s. (8.5) CB
n.s. (8.3) SP
n.s. (3.7) SP
* (23.2) BC
n.s. (15.2) CC
n.s. (7.4) GB
- -
- -
** (31.1) DM
* (22.2) BC, TF
** (21.3) DM
Dog CB
n.s. (13.2) CR
n.s. (4.0) CC
n.s. (4.6) CB
n.s. (4.6) SP
n.s. (6.0) MC
n.s. (15.2) TP
n.s. (7.9) DM
n.s. (6.0) CB
n.s. (2.8) BC
** (29.0) MC
n.s. (11.9) GB
n.s. (14.7) LR
n.s. (9.4) CC
Yellowtail BC
n.s. (13.8) TF
n.s. (0.4) MC
n.s. (6.1) CB
n.s. (16.0) LR
n.s. (3.2) DF
** (27.3) TP
n.s. (16.6) CB
n.s. (10.6) CB
n.s. (4.4) BC
n.s. (10.1) CB
n.s. (15.1) TP
* (23.8) CB
n.s. (7.4) BC
Grunts: Blue striped CB
n.s. (6.4) CB
n.s. (3.3) CC, SC
n.s. (8.5) DF, TF
n.s. (14.7) GB
n.s. (1.9) DF
** (26.7) SP
n.s. (15.8) DM
n.s. (5.4) CB
- -
* (14.0) CB
** (38.4) DM
* (23.8) DM
* (17.6) TF
Striped DM
n.s. (7.7) DM
n.s. (1.0) CC, MC
n.s. (1.7) TP
n.s. (12.6) TF
- -
n.s. (9.3) CB, MC
n.s. (8.6) CC
n.s. (8.6) BC
n.s. (6.5) CR
- -
n.s. (15.7) TF
n.s. (9.7) TF
n.s. (3.3) DM
White CB
n.s. (9.5) CB
n.s. (2.7) SC
n.s. (3.0) CB
* (24.2) SC
n.s. (2.1) SP
n.s. (16.9) DM
n.s. (16.1) LR
n.s. (2.9) TF
* (14.0) MC
** (32.1) CB
n.s. (15.1) DF
** (32.4) DM
n.s. (8.0) TF
Caesar SP
* (18.6) CR
n.s. (4.0) CC
** (18.0) SP
n.s. (12.3) DF
n.s. (3.2) DF
** (24.5) SP
n.s. (10.6) CR
n.s. (2.3) MC
- -
- -
** (30.3) SP
n.s. (16.1) DF, SP
n.s. (8.9) TF
French GB
n.s. (11.1) TF
n.s. (0.8) MC
n.s. (4.9) CB
** (30.0) SC
n.s. (4.9) TF
** (24.2) DM
* (23.1) DM
n.s. (6.1) CB
* (14.0) CB
- -
** (44.9) DF
** (57.7) DM
n.s. (10.8) DM
Porkfish DM
** (25.6) DM, SP
- -
n.s. (9.6) TF
n.s. (14.1) GB
n.s. (1.2) DF, MC
* (18.6) SP
n.s. (14.1) DM
n.s. (9.2) CB
n.s. (2.8) BC
** (29.0) MC
n.s. (5.6) CB
* (21.2) TP
* (18.0) TF
Groupers: Nassau GB
n.s. (10.0) GB
n.s. (1.8) CC
n.s. (5.0) CB
n.s. (9.6) GB
- -
n.s. (5.8) SC, TP
* (16.6) LR
n.s. (6.0) DF
n.s. (7.5) DM
- -
n.s. (14.9) CB
** (27.2) TF
n.s. (10.7) BC,CC,TF
Black CB
* (18.2) SP
- -
n.s. (12.4) CB
n.s. (9.3) SP
n.s. (2.5) SP
n.s. (15.4) TP
n.s. (3.7) CC, LR
n.s. (5.5) CB
- -
- -
n.s. (20.2) GB
n.s. (12.5) CB
n.s. (9.5) CC
Yellowfin CR
** (34.0) CR
- -
- -
n.s. (3.9) CR
- -
n.s. (4.4) CB
n.s. (16.3) CB, CR
n.s. (10.7) DF
- -
- -
n.s. (18.1) CB
** (26.6) LR
n.s. (1.5) DF
Tiger CC
n.s. (16.5) CC
- -
n.s. (7.3) SP
** (25.3) BC
- -
n.s. (15.2) TP
n.s. (16.3) CC
n.s. (7.5) BC, CB
* (14.0) DM, MC
- -
n.s. (12.4) CB
* (24.2) LR
n.s. (11.9) CC
Red hind LR
** (25.7) CC
- -
n.s. (3.3) LR
n.s. (6.3) SC
n.s. (2.5) SP
n.s. (16.8) LR, SP
n.s. (9.8) LR
n.s. (9.0) BC
- -
- -
n.s. (15.1) GB
n.s. (19.0) LR
n.s. (6.4) BC
Rock hind MC
* (18.2) CR
- -
n.s. (3.6) SP
n.s. (8.0) MC
- -
n.s. (8.6) LR
n.s. (9.6) LR
n.s. (1.1) MC
n.s. (6.7) LR
- -
n.s. (11.1) DF
* (25.0) MC
n.s. (6.7) CC
Graysby BC
n.s. (13.9) SP
n.s. (0.7) MC
n.s. (8.0) SP
** (27.2) BC
- -
n.s. (15.8) CC
n.s. (12.8) MC, CB
* (11.2) BC
n.s. (2.0) SP
- -
n.s. (17.1) BC
* (23.4) LR
* (17.7) CC
Coney SC
n.s. (7.3) TF
n.s. (3.4) SC
* (14.5) CB, GB
* (22.7) SC
n.s. (2.3) MC
** (24.0) SC
** (27.4) DF, MC
* (13.2) MC
n.s. (2.8) BC
n.s. (6.1) CB
n.s. (12.9) DF
** (39.8) SC
n.s. (3.9) DF
Others: Mackerel CR
** (22.0) CR
n.s. (4.0) SC
n.s. (8.5) CB
n.s. (11.4) SP
n.s. (2.5) SP
n.s. (16.5) SP
n.s. (7.6) CR
n.s. (10.4) BC, CB
- -
n.s. (0.9) CR
n.s. (15.1) BC
n.s. (9.8) BC
* (14.2) CC, TP
Hogfish DM
n.s. (3.6) DM
n.s. (4.0) SC
n.s. (4.7) DF, TF
n.s. (15.2) MC
n.s. (1.9) MC
n.s. (13.1) DM
n.s. (15.8) DM
n.s. (3.0) CB
n.s. (7.9) MC
** (21.8) MC
n.s. (16.1) GB
** (37.9) LR
n.s. (3.6) DM
Spanish hogfish SC
n.s. (19.6) SP
n.s. (2.8) SC
n.s. (10.5) DF
** (29.9) DF
n.s. (1.2) SP
n.s. (14.1) CC
n.s. (16.7) DF
n.s. (3.7) GB
n.s. (2.8) BC
- -
n.s. (15.6) TF
n.s. (17.0) DM
n.s. (3.4) BC, CC
Nurse shark MC
- -
- -
- -
- -
n.s. (6.0) MC
- -
** (66.0) DF
** (20.0) DF
- -
- -
n.s. (9.8) TF
n.s. (15.5) MC
n.s. (3.1) DF
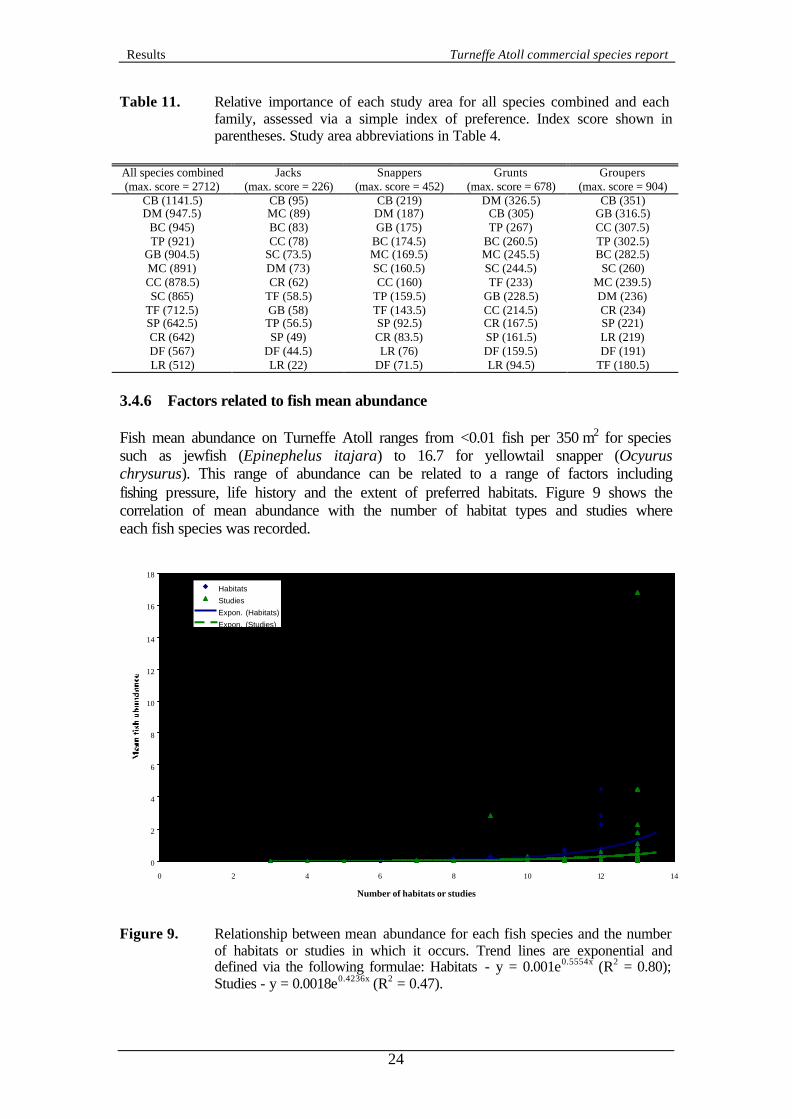
Results Turneffe Atoll commercial species report
24
Table 11. Relative importance of each study area for all species combined and each family, assessed via a simple index of preference. Index score shown in parentheses. Study area abbreviations in Table 4.
All species combined (max. score = 2712)
Jacks (max. score = 226)
Snappers (max. score = 452)
Grunts (max. score = 678)
Groupers (max. score = 904)
CB (1141.5) CB (95) CB (219) DM (326.5) CB (351) DM (947.5) MC (89) DM (187) CB (305) GB (316.5)
BC (945) BC (83) GB (175) TP (267) CC (307.5) TP (921) CC (78) BC (174.5) BC (260.5) TP (302.5)
GB (904.5) SC (73.5) MC (169.5) MC (245.5) BC (282.5) MC (891) DM (73) SC (160.5) SC (244.5) SC (260) CC (878.5) CR (62) CC (160) TF (233) MC (239.5) SC (865) TF (58.5) TP (159.5) GB (228.5) DM (236)
TF (712.5) GB (58) TF (143.5) CC (214.5) CR (234) SP (642.5) TP (56.5) SP (92.5) CR (167.5) SP (221) CR (642) SP (49) CR (83.5) SP (161.5) LR (219) DF (567) DF (44.5) LR (76) DF (159.5) DF (191) LR (512) LR (22) DF (71.5) LR (94.5) TF (180.5)
3.4.6 Factors related to fish mean abundance Fish mean abundance on Turneffe Atoll ranges from <0.01 fish per 350 m2 for species such as jewfish (Epinephelus itajara) to 16.7 for yellowtail snapper (Ocyurus chrysurus). This range of abundance can be related to a range of factors including fishing pressure, life history and the extent of preferred habitats. Figure 9 shows the correlation of mean abundance with the number of habitat types and studies where each fish species was recorded.
0
2
4
6
8
10
12
14
16
18
0 2 4 6 8 10 12 14
Number of habitats or studies
Habitats
Studies
Expon. (Habitats)
Expon. (Studies)
Figure 9. Relationship between mean abundance for each fish species and the number
of habitats or studies in which it occurs. Trend lines are exponential and defined via the following formulae: Habitats - y = 0.001e0.5554x (R2 = 0.80); Studies - y = 0.0018e0.4236x (R2 = 0.47).
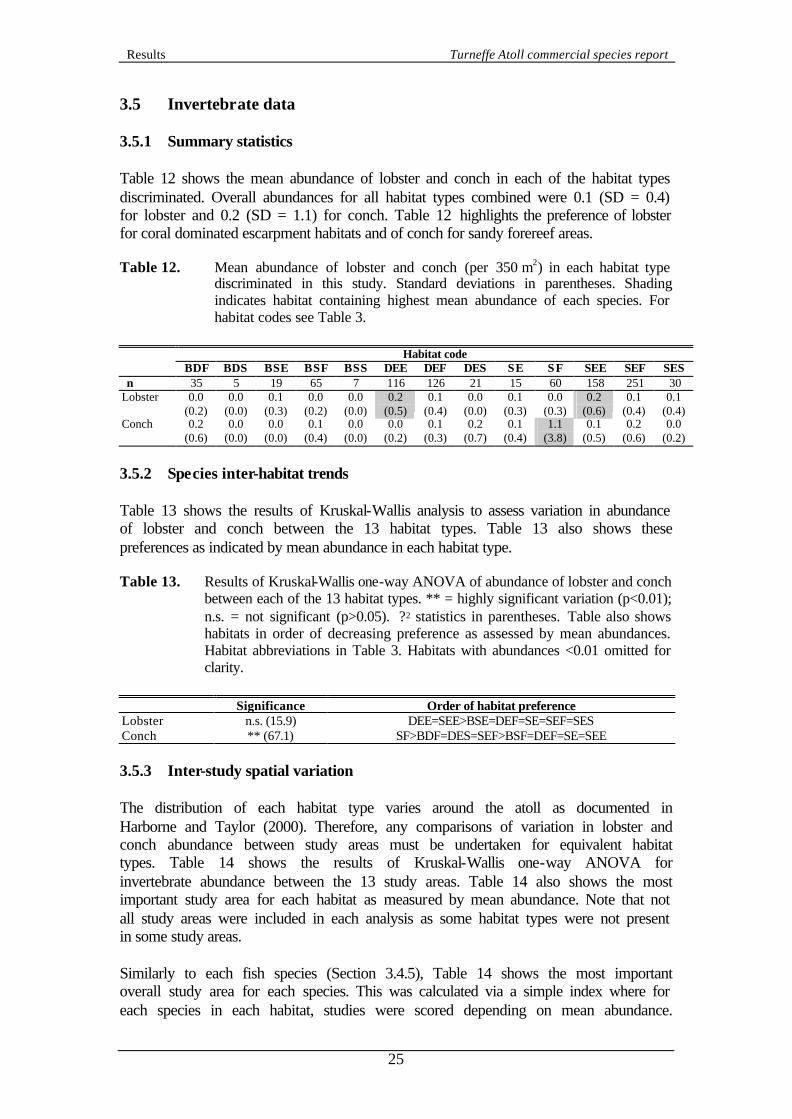
Results Turneffe Atoll commercial species report
25
3.5 Invertebrate data 3.5.1 Summary statistics Table 12 shows the mean abundance of lobster and conch in each of the habitat types discriminated. Overall abundances for all habitat types combined were 0.1 (SD = 0.4) for lobster and 0.2 (SD = 1.1) for conch. Table 12 highlights the preference of lobster for coral dominated escarpment habitats and of conch for sandy forereef areas. Table 12. Mean abundance of lobster and conch (per 350 m2) in each habitat type
discriminated in this study. Standard deviations in parentheses. Shading indicates habitat containing highest mean abundance of each species. For habitat codes see Table 3.
Habitat code
BDF BDS BSE BSF BSS DEE DEF DES SE SF SEE SEF SES n 35 5 19 65 7 116 126 21 15 60 158 251 30
Lobster 0.0 (0.2)
0.0 (0.0)
0.1 (0.3)
0.0 (0.2)
0.0 (0.0)
0.2 (0.5)
0.1 (0.4)
0.0 (0.0)
0.1 (0.3)
0.0 (0.3)
0.2 (0.6)
0.1 (0.4)
0.1 (0.4)
Conch 0.2 (0.6)
0.0 (0.0)
0.0 (0.0)
0.1 (0.4)
0.0 (0.0)
0.0 (0.2)
0.1 (0.3)
0.2 (0.7)
0.1 (0.4)
1.1 (3.8)
0.1 (0.5)
0.2 (0.6)
0.0 (0.2)
3.5.2 Species inter-habitat trends Table 13 shows the results of Kruskal-Wallis analysis to assess variation in abundance of lobster and conch between the 13 habitat types. Table 13 also shows these preferences as indicated by mean abundance in each habitat type. Table 13. Results of Kruskal-Wallis one-way ANOVA of abundance of lobster and conch
between each of the 13 habitat types. ** = highly significant variation (p<0.01); n.s. = not significant (p>0.05). ? 2 statistics in parentheses. Table also shows habitats in order of decreasing preference as assessed by mean abundances. Habitat abbreviations in Table 3. Habitats with abundances <0.01 omitted for clarity.
Significance Order of habitat preference
Lobster n.s. (15.9) DEE=SEE>BSE=DEF=SE=SEF=SES Conch ** (67.1) SF>BDF=DES=SEF>BSF=DEF=SE=SEE 3.5.3 Inter-study spatial variation The distribution of each habitat type varies around the atoll as documented in Harborne and Taylor (2000). Therefore, any comparisons of variation in lobster and conch abundance between study areas must be undertaken for equivalent habitat types. Table 14 shows the results of Kruskal-Wallis one-way ANOVA for invertebrate abundance between the 13 study areas. Table 14 also shows the most important study area for each habitat as measured by mean abundance. Note that not all study areas were included in each analysis as some habitat types were not present in some study areas. Similarly to each fish species (Section 3.4.5), Table 14 shows the most important overall study area for each species. This was calculated via a simple index where for each species in each habitat, studies were scored depending on mean abundance.
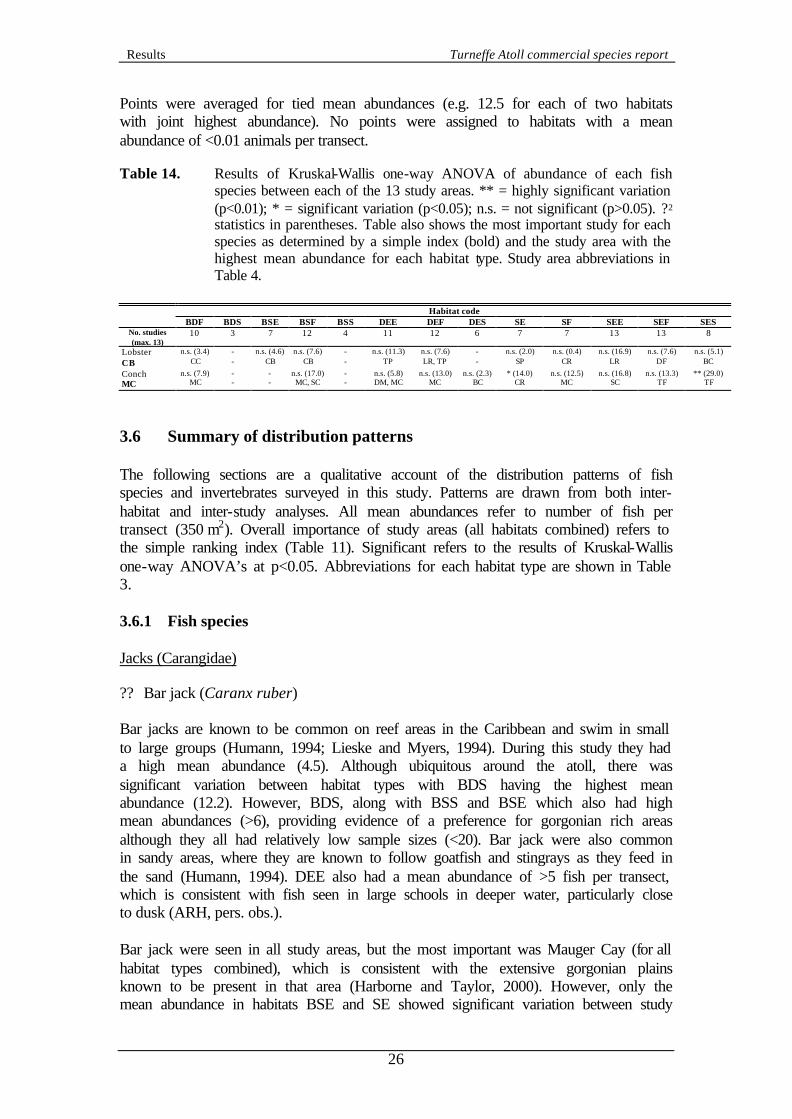
Results Turneffe Atoll commercial species report
26
Points were averaged for tied mean abundances (e.g. 12.5 for each of two habitats with joint highest abundance). No points were assigned to habitats with a mean abundance of <0.01 animals per transect. Table 14. Results of Kruskal-Wallis one-way ANOVA of abundance of each fish
species between each of the 13 study areas. ** = highly significant variation (p<0.01); * = significant variation (p<0.05); n.s. = not significant (p>0.05). ? 2 statistics in parentheses. Table also shows the most important study for each species as determined by a simple index (bold) and the study area with the highest mean abundance for each habitat type. Study area abbreviations in Table 4.
Habitat code
BDF BDS BSE BSF BSS DEE DEF DES SE SF SEE SEF SES No. studies (max. 13)
10 3 7 12 4 11 12 6 7 7 13 13 8
Lobster CB
n.s. (3.4) CC
- -
n.s. (4.6) CB
n.s. (7.6) CB
- -
n.s. (11.3) TP
n.s. (7.6) LR, TP
- -
n.s. (2.0) SP
n.s. (0.4) CR
n.s. (16.9) LR
n.s. (7.6) DF
n.s. (5.1) BC
Conch MC
n.s. (7.9) MC
- -
- -
n.s. (17.0) MC, SC
- -
n.s. (5.8) DM, MC
n.s. (13.0) MC
n.s. (2.3) BC
* (14.0) CR
n.s. (12.5) MC
n.s. (16.8) SC
n.s. (13.3) TF
** (29.0) TF
3.6 Summary of distribution patterns The following sections are a qualitative account of the distribution patterns of fish species and invertebrates surveyed in this study. Patterns are drawn from both inter-habitat and inter-study analyses. All mean abundances refer to number of fish per transect (350 m2). Overall importance of study areas (all habitats combined) refers to the simple ranking index (Table 11). Significant refers to the results of Kruskal-Wallis one-way ANOVA’s at p<0.05. Abbreviations for each habitat type are shown in Table 3. 3.6.1 Fish species Jacks (Carangidae) ?? Bar jack (Caranx ruber) Bar jacks are known to be common on reef areas in the Caribbean and swim in small to large groups (Humann, 1994; Lieske and Myers, 1994). During this study they had a high mean abundance (4.5). Although ubiquitous around the atoll, there was significant variation between habitat types with BDS having the highest mean abundance (12.2). However, BDS, along with BSS and BSE which also had high mean abundances (>6), providing evidence of a preference for gorgonian rich areas although they all had relatively low sample sizes (<20). Bar jack were also common in sandy areas, where they are known to follow goatfish and stingrays as they feed in the sand (Humann, 1994). DEE also had a mean abundance of >5 fish per transect, which is consistent with fish seen in large schools in deeper water, particularly close to dusk (ARH, pers. obs.). Bar jack were seen in all study areas, but the most important was Mauger Cay (for all habitat types combined), which is consistent with the extensive gorgonian plains known to be present in that area (Harborne and Taylor, 2000). However, only the mean abundance in habitats BSE and SE showed significant variation between study
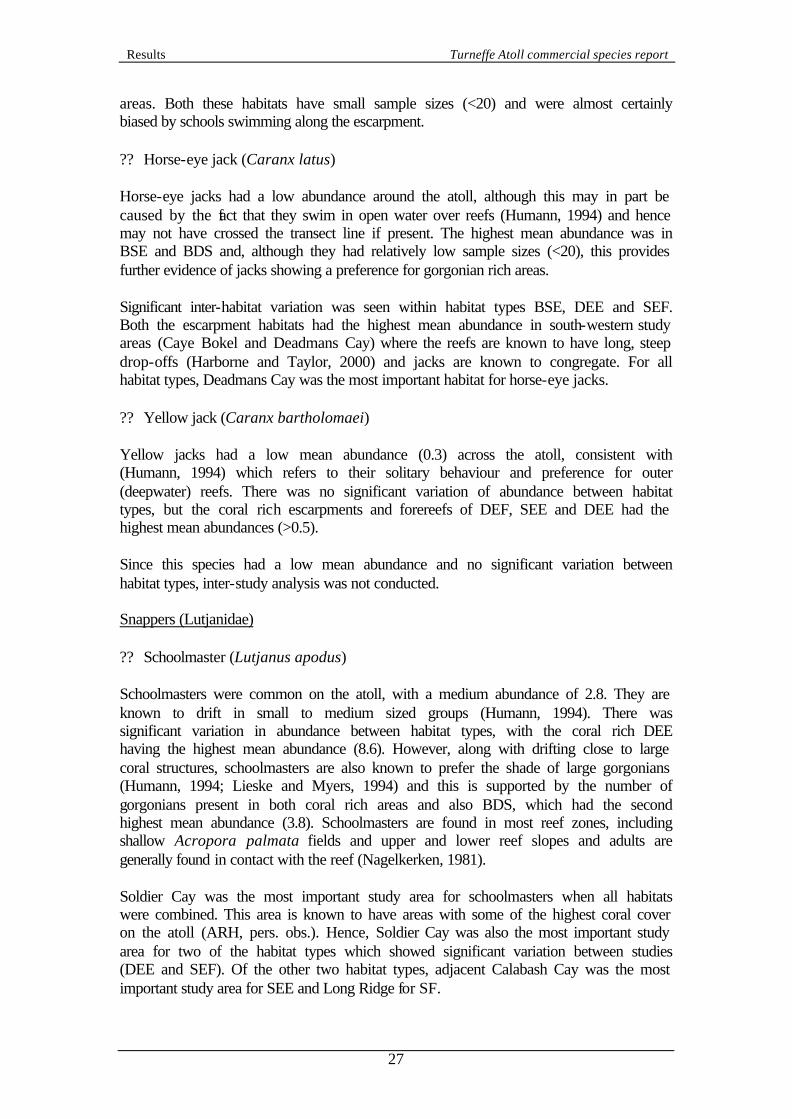
Results Turneffe Atoll commercial species report
27
areas. Both these habitats have small sample sizes (<20) and were almost certainly biased by schools swimming along the escarpment. ?? Horse-eye jack (Caranx latus) Horse-eye jacks had a low abundance around the atoll, although this may in part be caused by the fact that they swim in open water over reefs (Humann, 1994) and hence may not have crossed the transect line if present. The highest mean abundance was in BSE and BDS and, although they had relatively low sample sizes (<20), this provides further evidence of jacks showing a preference for gorgonian rich areas. Significant inter-habitat variation was seen within habitat types BSE, DEE and SEF. Both the escarpment habitats had the highest mean abundance in south-western study areas (Caye Bokel and Deadmans Cay) where the reefs are known to have long, steep drop-offs (Harborne and Taylor, 2000) and jacks are known to congregate. For all habitat types, Deadmans Cay was the most important habitat for horse-eye jacks. ?? Yellow jack (Caranx bartholomaei) Yellow jacks had a low mean abundance (0.3) across the atoll, consistent with (Humann, 1994) which refers to their solitary behaviour and preference for outer (deepwater) reefs. There was no significant variation of abundance between habitat types, but the coral rich escarpments and forereefs of DEF, SEE and DEE had the highest mean abundances (>0.5). Since this species had a low mean abundance and no significant variation between habitat types, inter-study analysis was not conducted. Snappers (Lutjanidae) ?? Schoolmaster (Lutjanus apodus) Schoolmasters were common on the atoll, with a medium abundance of 2.8. They are known to drift in small to medium sized groups (Humann, 1994). There was significant variation in abundance between habitat types, with the coral rich DEE having the highest mean abundance (8.6). However, along with drifting close to large coral structures, schoolmasters are also known to prefer the shade of large gorgonians (Humann, 1994; Lieske and Myers, 1994) and this is supported by the number of gorgonians present in both coral rich areas and also BDS, which had the second highest mean abundance (3.8). Schoolmasters are found in most reef zones, including shallow Acropora palmata fields and upper and lower reef slopes and adults are generally found in contact with the reef (Nagelkerken, 1981). Soldier Cay was the most important study area for schoolmasters when all habitats were combined. This area is known to have areas with some of the highest coral cover on the atoll (ARH, pers. obs.). Hence, Soldier Cay was also the most important study area for two of the habitat types which showed significant variation between studies (DEE and SEF). Of the other two habitat types, adjacent Calabash Cay was the most important study area for SEE and Long Ridge for SF.
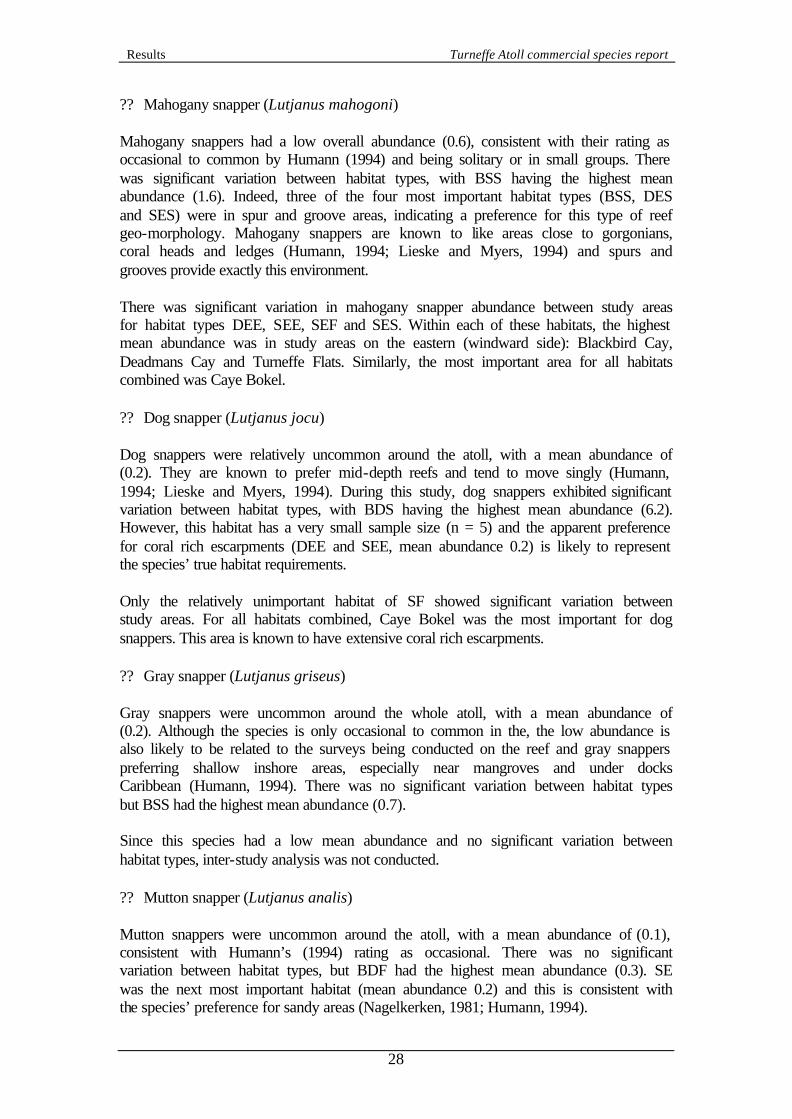
Results Turneffe Atoll commercial species report
28
?? Mahogany snapper (Lutjanus mahogoni) Mahogany snappers had a low overall abundance (0.6), consistent with their rating as occasional to common by Humann (1994) and being solitary or in small groups. There was significant variation between habitat types, with BSS having the highest mean abundance (1.6). Indeed, three of the four most important habitat types (BSS, DES and SES) were in spur and groove areas, indicating a preference for this type of reef geo-morphology. Mahogany snappers are known to like areas close to gorgonians, coral heads and ledges (Humann, 1994; Lieske and Myers, 1994) and spurs and grooves provide exactly this environment. There was significant variation in mahogany snapper abundance between study areas for habitat types DEE, SEE, SEF and SES. Within each of these habitats, the highest mean abundance was in study areas on the eastern (windward side): Blackbird Cay, Deadmans Cay and Turneffe Flats. Similarly, the most important area for all habitats combined was Caye Bokel. ?? Dog snapper (Lutjanus jocu) Dog snappers were relatively uncommon around the atoll, with a mean abundance of (0.2). They are known to prefer mid-depth reefs and tend to move singly (Humann, 1994; Lieske and Myers, 1994). During this study, dog snappers exhibited significant variation between habitat types, with BDS having the highest mean abundance (6.2). However, this habitat has a very small sample size (n = 5) and the apparent preference for coral rich escarpments (DEE and SEE, mean abundance 0.2) is likely to represent the species’ true habitat requirements. Only the relatively unimportant habitat of SF showed significant variation between study areas. For all habitats combined, Caye Bokel was the most important for dog snappers. This area is known to have extensive coral rich escarpments. ?? Gray snapper (Lutjanus griseus) Gray snappers were uncommon around the whole atoll, with a mean abundance of (0.2). Although the species is only occasional to common in the, the low abundance is also likely to be related to the surveys being conducted on the reef and gray snappers preferring shallow inshore areas, especially near mangroves and under docks Caribbean (Humann, 1994). There was no significant variation between habitat types but BSS had the highest mean abundance (0.7). Since this species had a low mean abundance and no significant variation between habitat types, inter-study analysis was not conducted. ?? Mutton snapper (Lutjanus analis) Mutton snappers were uncommon around the atoll, with a mean abundance of (0.1), consistent with Humann’s (1994) rating as occasional. There was no significant variation between habitat types, but BDF had the highest mean abundance (0.3). SE was the next most important habitat (mean abundance 0.2) and this is consistent with the species’ preference for sandy areas (Nagelkerken, 1981; Humann, 1994).
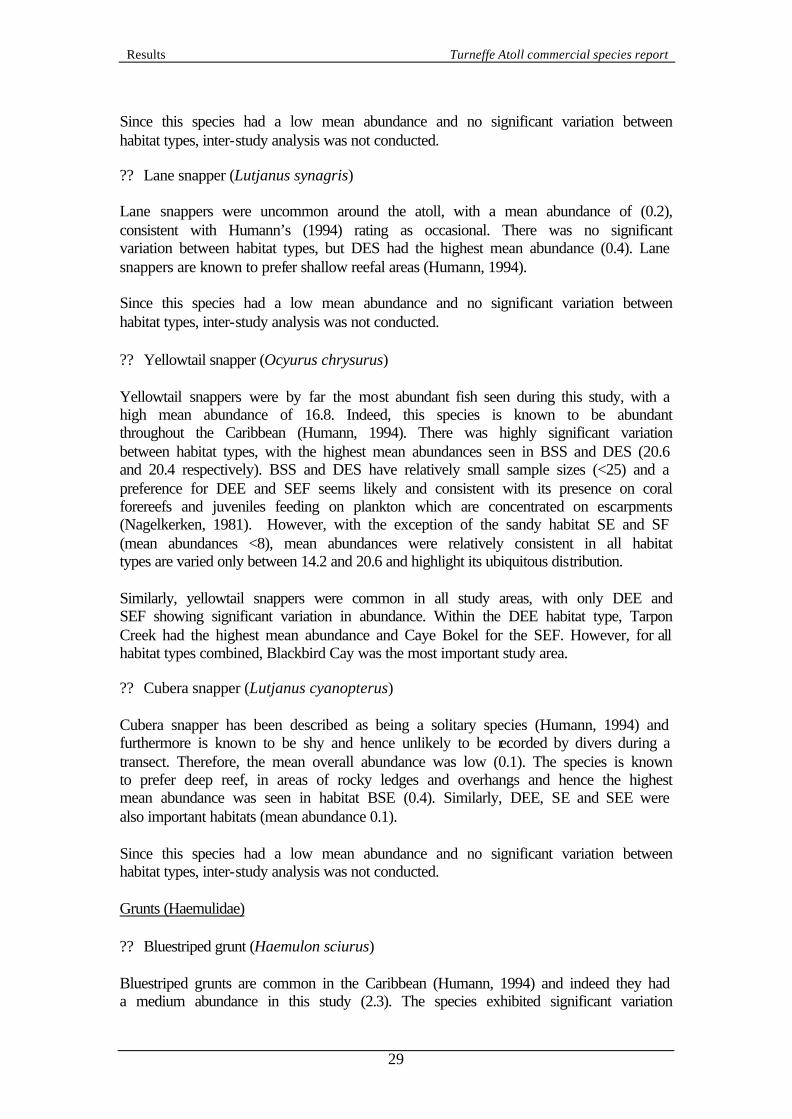
Results Turneffe Atoll commercial species report
29
Since this species had a low mean abundance and no significant variation between habitat types, inter-study analysis was not conducted. ?? Lane snapper (Lutjanus synagris) Lane snappers were uncommon around the atoll, with a mean abundance of (0.2), consistent with Humann’s (1994) rating as occasional. There was no significant variation between habitat types, but DES had the highest mean abundance (0.4). Lane snappers are known to prefer shallow reefal areas (Humann, 1994). Since this species had a low mean abundance and no significant variation between habitat types, inter-study analysis was not conducted. ?? Yellowtail snapper (Ocyurus chrysurus) Yellowtail snappers were by far the most abundant fish seen during this study, with a high mean abundance of 16.8. Indeed, this species is known to be abundant throughout the Caribbean (Humann, 1994). There was highly significant variation between habitat types, with the highest mean abundances seen in BSS and DES (20.6 and 20.4 respectively). BSS and DES have relatively small sample sizes (<25) and a preference for DEE and SEF seems likely and consistent with its presence on coral forereefs and juveniles feeding on plankton which are concentrated on escarpments (Nagelkerken, 1981). However, with the exception of the sandy habitat SE and SF (mean abundances <8), mean abundances were relatively consistent in all habitat types are varied only between 14.2 and 20.6 and highlight its ubiquitous distribution. Similarly, yellowtail snappers were common in all study areas, with only DEE and SEF showing significant variation in abundance. Within the DEE habitat type, Tarpon Creek had the highest mean abundance and Caye Bokel for the SEF. However, for all habitat types combined, Blackbird Cay was the most important study area. ?? Cubera snapper (Lutjanus cyanopterus) Cubera snapper has been described as being a solitary species (Humann, 1994) and furthermore is known to be shy and hence unlikely to be recorded by divers during a transect. Therefore, the mean overall abundance was low (0.1). The species is known to prefer deep reef, in areas of rocky ledges and overhangs and hence the highest mean abundance was seen in habitat BSE (0.4). Similarly, DEE, SE and SEE were also important habitats (mean abundance 0.1). Since this species had a low mean abundance and no significant variation between habitat types, inter-study analysis was not conducted. Grunts (Haemulidae) ?? Bluestriped grunt (Haemulon sciurus) Bluestriped grunts are common in the Caribbean (Humann, 1994) and indeed they had a medium abundance in this study (2.3). The species exhibited significant variation
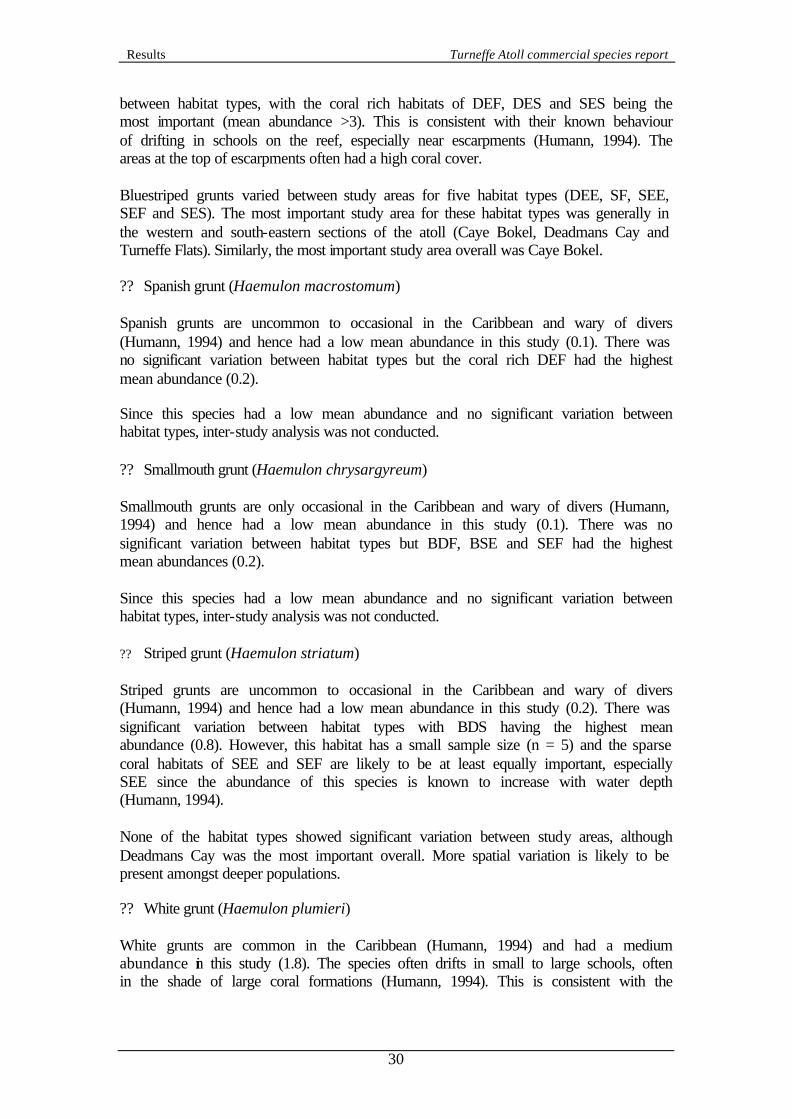
Results Turneffe Atoll commercial species report
30
between habitat types, with the coral rich habitats of DEF, DES and SES being the most important (mean abundance >3). This is consistent with their known behaviour of drifting in schools on the reef, especially near escarpments (Humann, 1994). The areas at the top of escarpments often had a high coral cover. Bluestriped grunts varied between study areas for five habitat types (DEE, SF, SEE, SEF and SES). The most important study area for these habitat types was generally in the western and south-eastern sections of the atoll (Caye Bokel, Deadmans Cay and Turneffe Flats). Similarly, the most important study area overall was Caye Bokel. ?? Spanish grunt (Haemulon macrostomum) Spanish grunts are uncommon to occasional in the Caribbean and wary of divers (Humann, 1994) and hence had a low mean abundance in this study (0.1). There was no significant variation between habitat types but the coral rich DEF had the highest mean abundance (0.2). Since this species had a low mean abundance and no significant variation between habitat types, inter-study analysis was not conducted. ?? Smallmouth grunt (Haemulon chrysargyreum) Smallmouth grunts are only occasional in the Caribbean and wary of divers (Humann, 1994) and hence had a low mean abundance in this study (0.1). There was no significant variation between habitat types but BDF, BSE and SEF had the highest mean abundances (0.2). Since this species had a low mean abundance and no significant variation between habitat types, inter-study analysis was not conducted. ?? Striped grunt (Haemulon striatum) Striped grunts are uncommon to occasional in the Caribbean and wary of divers (Humann, 1994) and hence had a low mean abundance in this study (0.2). There was significant variation between habitat types with BDS having the highest mean abundance (0.8). However, this habitat has a small sample size (n = 5) and the sparse coral habitats of SEE and SEF are likely to be at least equally important, especially SEE since the abundance of this species is known to increase with water depth (Humann, 1994). None of the habitat types showed significant variation between study areas, although Deadmans Cay was the most important overall. More spatial variation is likely to be present amongst deeper populations. ?? White grunt (Haemulon plumieri) White grunts are common in the Caribbean (Humann, 1994) and had a medium abundance in this study (1.8). The species often drifts in small to large schools, often in the shade of large coral formations (Humann, 1994). This is consistent with the

Results Turneffe Atoll commercial species report
31
observed preference for DEF, DES and SEF (mean abundance ?2.0). These preferences reflected significant variation between habitat types. Analysis of variation between study areas showed significant variation within the habitat types BSF, SE, SF and SEF. Within these habitat types, the most important study areas were those on the northern and southern ends of the atoll, and on the eastern side (Soldier Cay, Mauger Cay, Caye Bokel and Deadmans Cay). Overall, Caye Bokel was the most important study area for white grunts. ?? Caesar grunt (Haemulon carbonarium) Caesar grunts are uncommon to occasional in the Caribbean and very wary of divers (Humann, 1994) and hence had a low mean abundance in this study (0.3). There was significant variation between habitat types with BSS having the highest mean abundance (1.9). However, this habitat has a small sample size (n = 7) and the gorgonian rich forereef habitats of BDF and BSF are likely to be at least equally important (mean abundance of 0.5 and 0.6 respectively). Habitat types BDF, BSE, DEE and SEE showed significant variation between study areas and the most important habitat type was generally Snake Point. Similarly this study was the most important overall. ?? Cottonwick (Haemulon melanurum) Cottonwicks are uncommon to occasional in the Caribbean and wary of divers (Humann, 1994) and hence had a low mean abundance in this study (0.1). There was no significant variation between habitat types but DEF and BSF had the highest mean abundances (0.2). Since this species had a low mean abundance and no significant variation between habitat types, inter-study analysis was not conducted. ?? French grunt (Haemulon flavolineatum) French grunt, along with bar jack, was the second most abundant species in this study, with a high mean abundance of 4.5. The species is also common throughout the Caribbean (Humann, 1994). French grunts drift in small to large schools and prefer coral reefs (Humann, 1994), an observation that is supported by the high mean abundances in coral rich habitats DES and DEF (mean abundances of 8.8 and 6.8 respectively). There is also evidence that BDS is an important habitat (mean abundance 12.8) but this is based on a limited sample (n = 5). There was significant variation in abundance between habitat types. Numerous habitat types (BSF, DEE, DEF, SE, SEE and SEF) had significant variation between study areas, but the highest mean abundance for all these habitats were on the eastern side (Soldier Cay, Deadmans Cay and Dog Flea). Similarly, Grand Bogue was the most important study area overall.
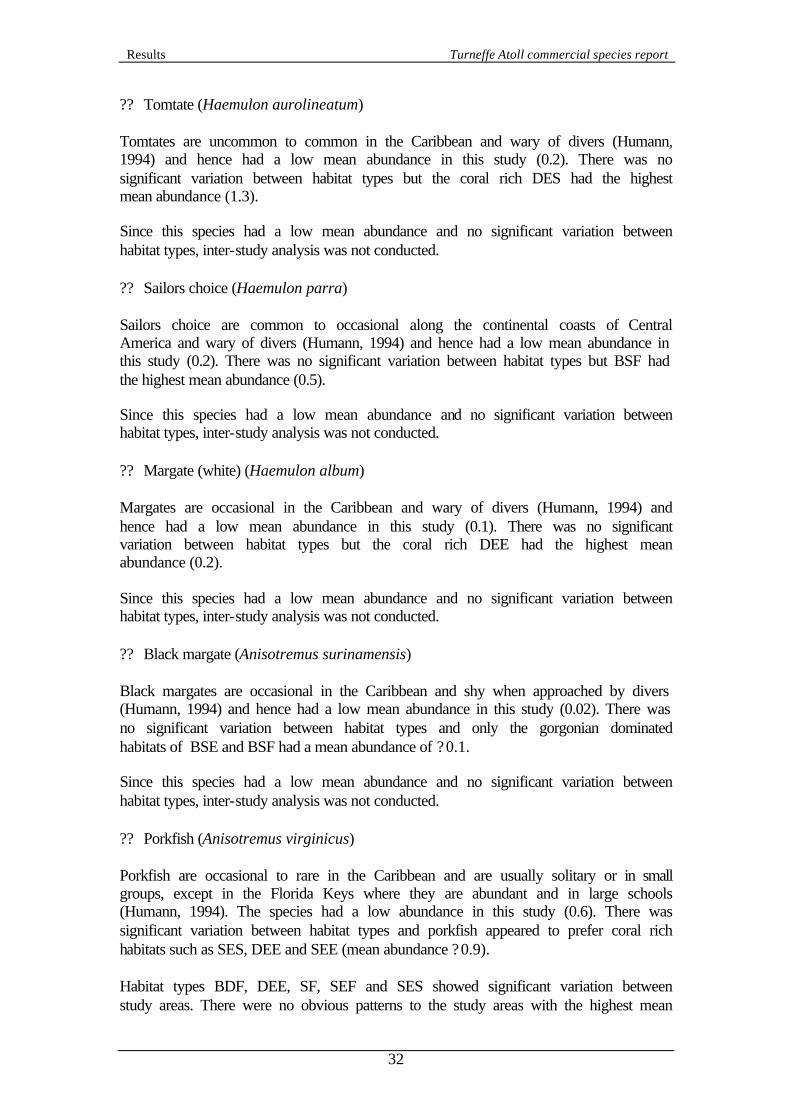
Results Turneffe Atoll commercial species report
32
?? Tomtate (Haemulon aurolineatum) Tomtates are uncommon to common in the Caribbean and wary of divers (Humann, 1994) and hence had a low mean abundance in this study (0.2). There was no significant variation between habitat types but the coral rich DES had the highest mean abundance (1.3). Since this species had a low mean abundance and no significant variation between habitat types, inter-study analysis was not conducted. ?? Sailors choice (Haemulon parra) Sailors choice are common to occasional along the continental coasts of Central America and wary of divers (Humann, 1994) and hence had a low mean abundance in this study (0.2). There was no significant variation between habitat types but BSF had the highest mean abundance (0.5). Since this species had a low mean abundance and no significant variation between habitat types, inter-study analysis was not conducted. ?? Margate (white) (Haemulon album) Margates are occasional in the Caribbean and wary of divers (Humann, 1994) and hence had a low mean abundance in this study (0.1). There was no significant variation between habitat types but the coral rich DEE had the highest mean abundance (0.2). Since this species had a low mean abundance and no significant variation between habitat types, inter-study analysis was not conducted. ?? Black margate (Anisotremus surinamensis) Black margates are occasional in the Caribbean and shy when approached by divers (Humann, 1994) and hence had a low mean abundance in this study (0.02). There was no significant variation between habitat types and only the gorgonian dominated habitats of BSE and BSF had a mean abundance of ?0.1. Since this species had a low mean abundance and no significant variation between habitat types, inter-study analysis was not conducted. ?? Porkfish (Anisotremus virginicus) Porkfish are occasional to rare in the Caribbean and are usually solitary or in small groups, except in the Florida Keys where they are abundant and in large schools (Humann, 1994). The species had a low abundance in this study (0.6). There was significant variation between habitat types and porkfish appeared to prefer coral rich habitats such as SES, DEE and SEE (mean abundance ?0.9). Habitat types BDF, DEE, SF, SEF and SES showed significant variation between study areas. There were no obvious patterns to the study areas with the highest mean
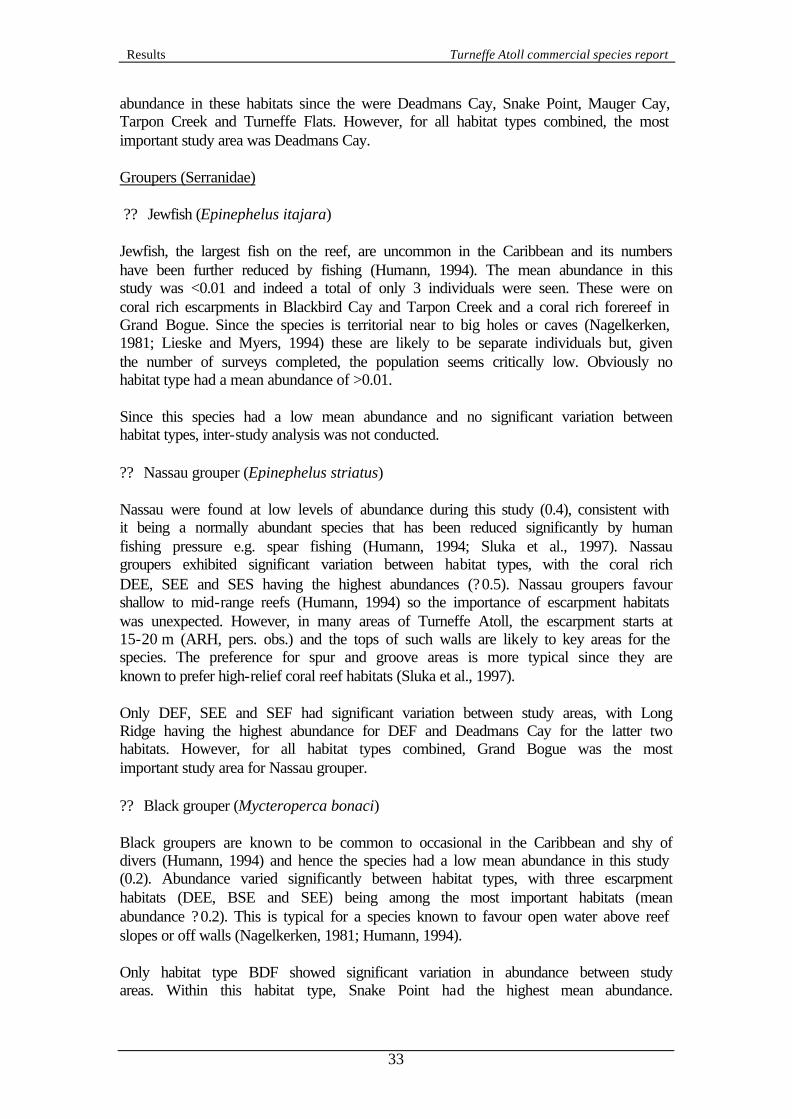
Results Turneffe Atoll commercial species report
33
abundance in these habitats since the were Deadmans Cay, Snake Point, Mauger Cay, Tarpon Creek and Turneffe Flats. However, for all habitat types combined, the most important study area was Deadmans Cay. Groupers (Serranidae) ?? Jewfish (Epinephelus itajara) Jewfish, the largest fish on the reef, are uncommon in the Caribbean and its numbers have been further reduced by fishing (Humann, 1994). The mean abundance in this study was <0.01 and indeed a total of only 3 individuals were seen. These were on coral rich escarpments in Blackbird Cay and Tarpon Creek and a coral rich forereef in Grand Bogue. Since the species is territorial near to big holes or caves (Nagelkerken, 1981; Lieske and Myers, 1994) these are likely to be separate individuals but, given the number of surveys completed, the population seems critically low. Obviously no habitat type had a mean abundance of >0.01. Since this species had a low mean abundance and no significant variation between habitat types, inter-study analysis was not conducted. ?? Nassau grouper (Epinephelus striatus) Nassau were found at low levels of abundance during this study (0.4), consistent with it being a normally abundant species that has been reduced significantly by human fishing pressure e.g. spear fishing (Humann, 1994; Sluka et al., 1997). Nassau groupers exhibited significant variation between habitat types, with the coral rich DEE, SEE and SES having the highest abundances (?0.5). Nassau groupers favour shallow to mid-range reefs (Humann, 1994) so the importance of escarpment habitats was unexpected. However, in many areas of Turneffe Atoll, the escarpment starts at 15-20 m (ARH, pers. obs.) and the tops of such walls are likely to key areas for the species. The preference for spur and groove areas is more typical since they are known to prefer high-relief coral reef habitats (Sluka et al., 1997). Only DEF, SEE and SEF had significant variation between study areas, with Long Ridge having the highest abundance for DEF and Deadmans Cay for the latter two habitats. However, for all habitat types combined, Grand Bogue was the most important study area for Nassau grouper. ?? Black grouper (Mycteroperca bonaci) Black groupers are known to be common to occasional in the Caribbean and shy of divers (Humann, 1994) and hence the species had a low mean abundance in this study (0.2). Abundance varied significantly between habitat types, with three escarpment habitats (DEE, BSE and SEE) being among the most important habitats (mean abundance ?0.2). This is typical for a species known to favour open water above reef slopes or off walls (Nagelkerken, 1981; Humann, 1994). Only habitat type BDF showed significant variation in abundance between study areas. Within this habitat type, Snake Point had the highest mean abundance.
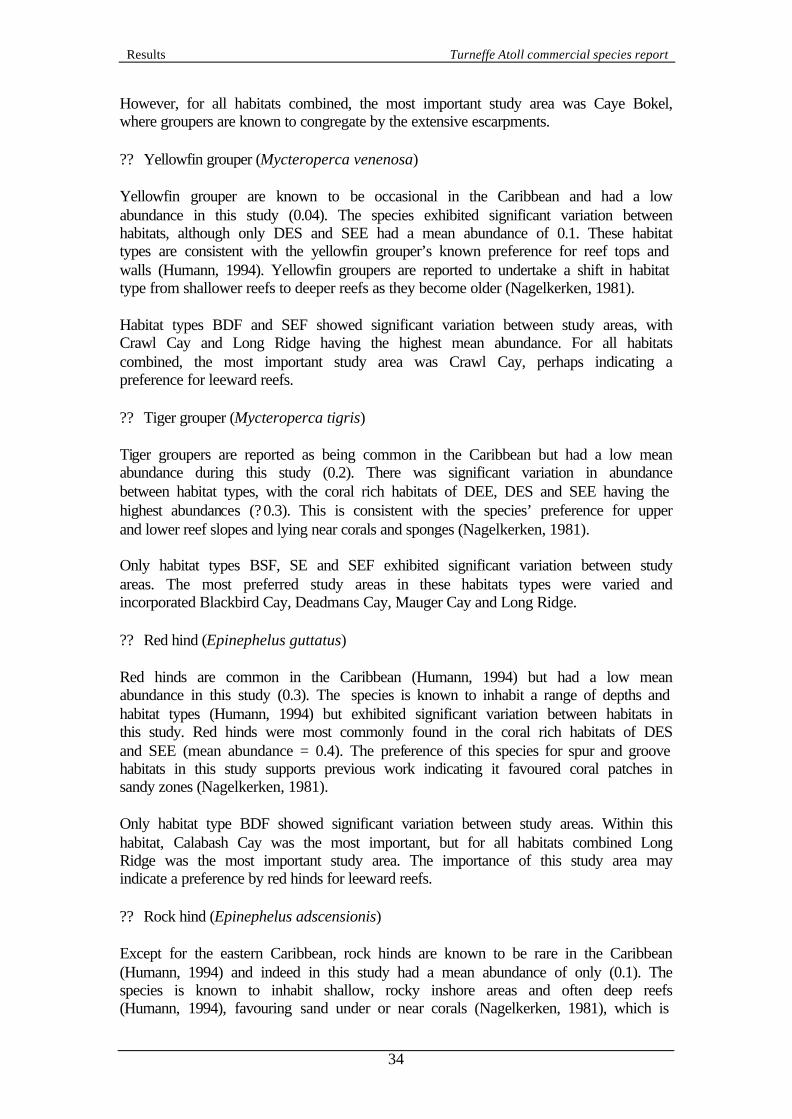
Results Turneffe Atoll commercial species report
34
However, for all habitats combined, the most important study area was Caye Bokel, where groupers are known to congregate by the extensive escarpments. ?? Yellowfin grouper (Mycteroperca venenosa) Yellowfin grouper are known to be occasional in the Caribbean and had a low abundance in this study (0.04). The species exhibited significant variation between habitats, although only DES and SEE had a mean abundance of 0.1. These habitat types are consistent with the yellowfin grouper’s known preference for reef tops and walls (Humann, 1994). Yellowfin groupers are reported to undertake a shift in habitat type from shallower reefs to deeper reefs as they become older (Nagelkerken, 1981). Habitat types BDF and SEF showed significant variation between study areas, with Crawl Cay and Long Ridge having the highest mean abundance. For all habitats combined, the most important study area was Crawl Cay, perhaps indicating a preference for leeward reefs. ?? Tiger grouper (Mycteroperca tigris) Tiger groupers are reported as being common in the Caribbean but had a low mean abundance during this study (0.2). There was significant variation in abundance between habitat types, with the coral rich habitats of DEE, DES and SEE having the highest abundances (?0.3). This is consistent with the species’ preference for upper and lower reef slopes and lying near corals and sponges (Nagelkerken, 1981). Only habitat types BSF, SE and SEF exhibited significant variation between study areas. The most preferred study areas in these habitats types were varied and incorporated Blackbird Cay, Deadmans Cay, Mauger Cay and Long Ridge. ?? Red hind (Epinephelus guttatus) Red hinds are common in the Caribbean (Humann, 1994) but had a low mean abundance in this study (0.3). The species is known to inhabit a range of depths and habitat types (Humann, 1994) but exhibited significant variation between habitats in this study. Red hinds were most commonly found in the coral rich habitats of DES and SEE (mean abundance = 0.4). The preference of this species for spur and groove habitats in this study supports previous work indicating it favoured coral patches in sandy zones (Nagelkerken, 1981). Only habitat type BDF showed significant variation between study areas. Within this habitat, Calabash Cay was the most important, but for all habitats combined Long Ridge was the most important study area. The importance of this study area may indicate a preference by red hinds for leeward reefs. ?? Rock hind (Epinephelus adscensionis) Except for the eastern Caribbean, rock hinds are known to be rare in the Caribbean (Humann, 1994) and indeed in this study had a mean abundance of only (0.1). The species is known to inhabit shallow, rocky inshore areas and often deep reefs (Humann, 1994), favouring sand under or near corals (Nagelkerken, 1981), which is
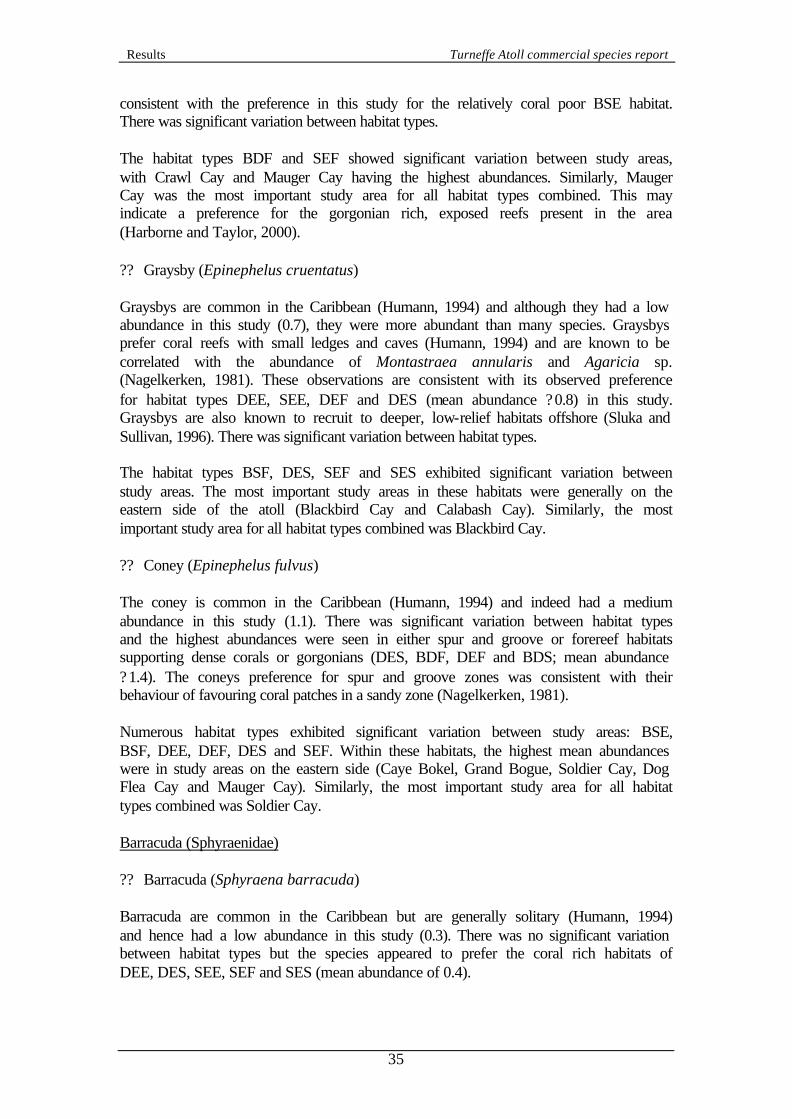
Results Turneffe Atoll commercial species report
35
consistent with the preference in this study for the relatively coral poor BSE habitat. There was significant variation between habitat types. The habitat types BDF and SEF showed significant variation between study areas, with Crawl Cay and Mauger Cay having the highest abundances. Similarly, Mauger Cay was the most important study area for all habitat types combined. This may indicate a preference for the gorgonian rich, exposed reefs present in the area (Harborne and Taylor, 2000). ?? Graysby (Epinephelus cruentatus) Graysbys are common in the Caribbean (Humann, 1994) and although they had a low abundance in this study (0.7), they were more abundant than many species. Graysbys prefer coral reefs with small ledges and caves (Humann, 1994) and are known to be correlated with the abundance of Montastraea annularis and Agaricia sp. (Nagelkerken, 1981). These observations are consistent with its observed preference for habitat types DEE, SEE, DEF and DES (mean abundance ?0.8) in this study. Graysbys are also known to recruit to deeper, low-relief habitats offshore (Sluka and Sullivan, 1996). There was significant variation between habitat types. The habitat types BSF, DES, SEF and SES exhibited significant variation between study areas. The most important study areas in these habitats were generally on the eastern side of the atoll (Blackbird Cay and Calabash Cay). Similarly, the most important study area for all habitat types combined was Blackbird Cay. ?? Coney (Epinephelus fulvus) The coney is common in the Caribbean (Humann, 1994) and indeed had a medium abundance in this study (1.1). There was significant variation between habitat types and the highest abundances were seen in either spur and groove or forereef habitats supporting dense corals or gorgonians (DES, BDF, DEF and BDS; mean abundance ?1.4). The coneys preference for spur and groove zones was consistent with their behaviour of favouring coral patches in a sandy zone (Nagelkerken, 1981). Numerous habitat types exhibited significant variation between study areas: BSE, BSF, DEE, DEF, DES and SEF. Within these habitats, the highest mean abundances were in study areas on the eastern side (Caye Bokel, Grand Bogue, Soldier Cay, Dog Flea Cay and Mauger Cay). Similarly, the most important study area for all habitat types combined was Soldier Cay. Barracuda (Sphyraenidae) ?? Barracuda (Sphyraena barracuda) Barracuda are common in the Caribbean but are generally solitary (Humann, 1994) and hence had a low abundance in this study (0.3). There was no significant variation between habitat types but the species appeared to prefer the coral rich habitats of DEE, DES, SEE, SEF and SES (mean abundance of 0.4).
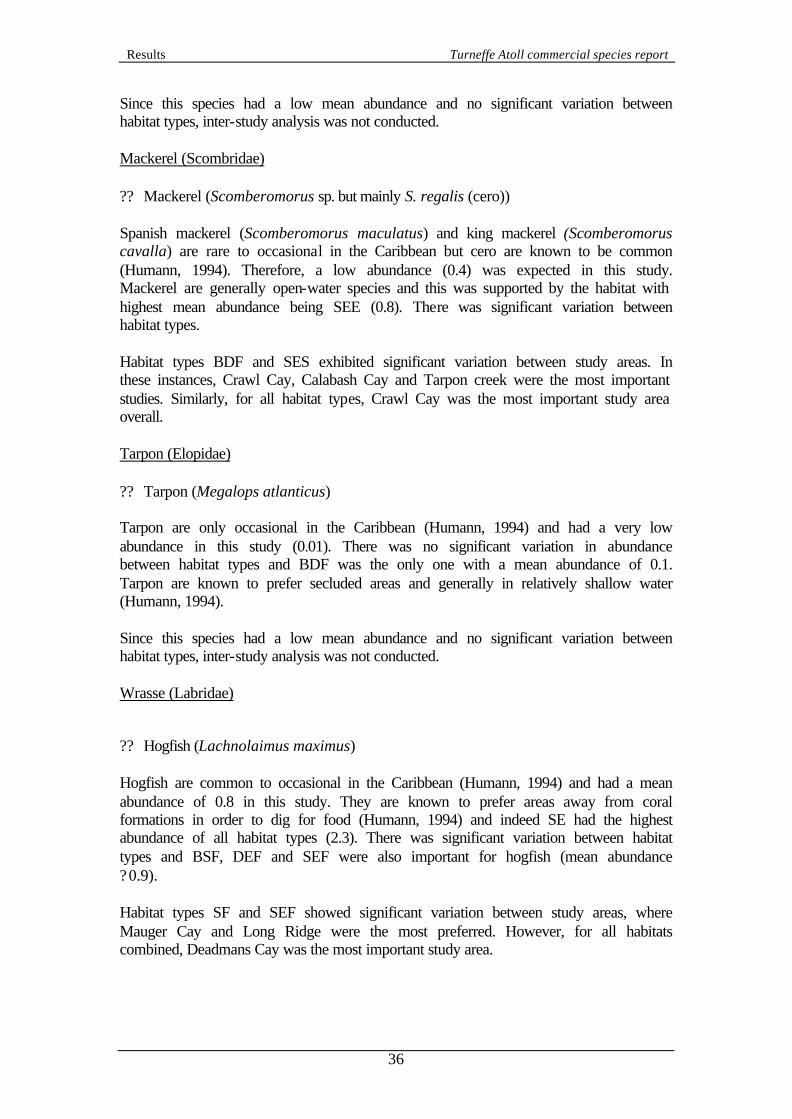
Results Turneffe Atoll commercial species report
36
Since this species had a low mean abundance and no significant variation between habitat types, inter-study analysis was not conducted. Mackerel (Scombridae) ?? Mackerel (Scomberomorus sp. but mainly S. regalis (cero)) Spanish mackerel (Scomberomorus maculatus) and king mackerel (Scomberomorus cavalla) are rare to occasional in the Caribbean but cero are known to be common (Humann, 1994). Therefore, a low abundance (0.4) was expected in this study. Mackerel are generally open-water species and this was supported by the habitat with highest mean abundance being SEE (0.8). There was significant variation between habitat types. Habitat types BDF and SES exhibited significant variation between study areas. In these instances, Crawl Cay, Calabash Cay and Tarpon creek were the most important studies. Similarly, for all habitat types, Crawl Cay was the most important study area overall. Tarpon (Elopidae) ?? Tarpon (Megalops atlanticus) Tarpon are only occasional in the Caribbean (Humann, 1994) and had a very low abundance in this study (0.01). There was no significant variation in abundance between habitat types and BDF was the only one with a mean abundance of 0.1. Tarpon are known to prefer secluded areas and generally in relatively shallow water (Humann, 1994). Since this species had a low mean abundance and no significant variation between habitat types, inter-study analysis was not conducted. Wrasse (Labridae) ?? Hogfish (Lachnolaimus maximus) Hogfish are common to occasional in the Caribbean (Humann, 1994) and had a mean abundance of 0.8 in this study. They are known to prefer areas away from coral formations in order to dig for food (Humann, 1994) and indeed SE had the highest abundance of all habitat types (2.3). There was significant variation between habitat types and BSF, DEF and SEF were also important for hogfish (mean abundance ?0.9). Habitat types SF and SEF showed significant variation between study areas, where Mauger Cay and Long Ridge were the most preferred. However, for all habitats combined, Deadmans Cay was the most important study area.

Results Turneffe Atoll commercial species report
37
?? Spanish hogfish (Bodianus rufus) Spanish hogfish are common to occasional in the Caribbean (Humann, 1994) and had a mean abundance of 0.8 in this study. Spanish hogfish prefer reef areas and the most preferred habitats in this study were BDF, SEE, BSS, DEE and DES (mean abundance ?0.9). There was significant variation in abundance between habitat types. Only habitat type BSF had significant variation between study areas, and Dog Flea Cay had the highest abundance. However, for all habitats combined, Soldier Cay was the most important study area. Carpet sharks (Rhincodontidae) ?? Nurse shark (Ginglymostoma cirratum) Nurse sharks were the only species of shark seen during this study and are the only species seen relatively regularly in Belize (ARH, pers. obs.). However, only 10 individuals were seen during this study (mean abundance 0.01). Although sample sizes were small, there was significant variation in abundance between habitats. Only BSS and SES had a mean abundance of ?0.1. This preference for the spur and groove geo-morphology is consistent with nurse shark’s known behaviour of lying on sand, under ledges and overhangs (Humann, 1994). Sample sizes were small for testing variation in abundance between study areas but it was significant in habitat types DEF and DES. In both cases, Dog Flea Cay was the most important study areas, where there are known to be numerous spur and groove zones (Harborne and Taylor, 2000). Similarly, Mauger Cay was the most important study area overall. Eagle rays (Myliobatidae) ?? Spotted eagle ray (Aetobatus narinari) Spotted eagle rays are common to occasional in the Caribbean and are known to cruise walls and sandy areas, occasionally in pairs or schools. Only six individuals were seen during the whole study (mean abundance 0.01). These six fish were seen on the escarpment at Calabash Cay and Deadmans Cay (a pair) and on forereef in Crawl Cay (two occasions) and Deadmans Cay. There was obviously no significant variation between habitat types or study areas. Stingrays (Dasyatidae) ?? Southern stingray (Dasyatis americana) Southern stingrays are common in the Caribbean and lie on the bottom in sandy areas (Humann, 1994). Only six individuals were seen during the whole study (mean abundance 0.01). These six fish were seen on the forereef at Mauger Cay, Soldier Cay and Caye Bokel (two pairs).
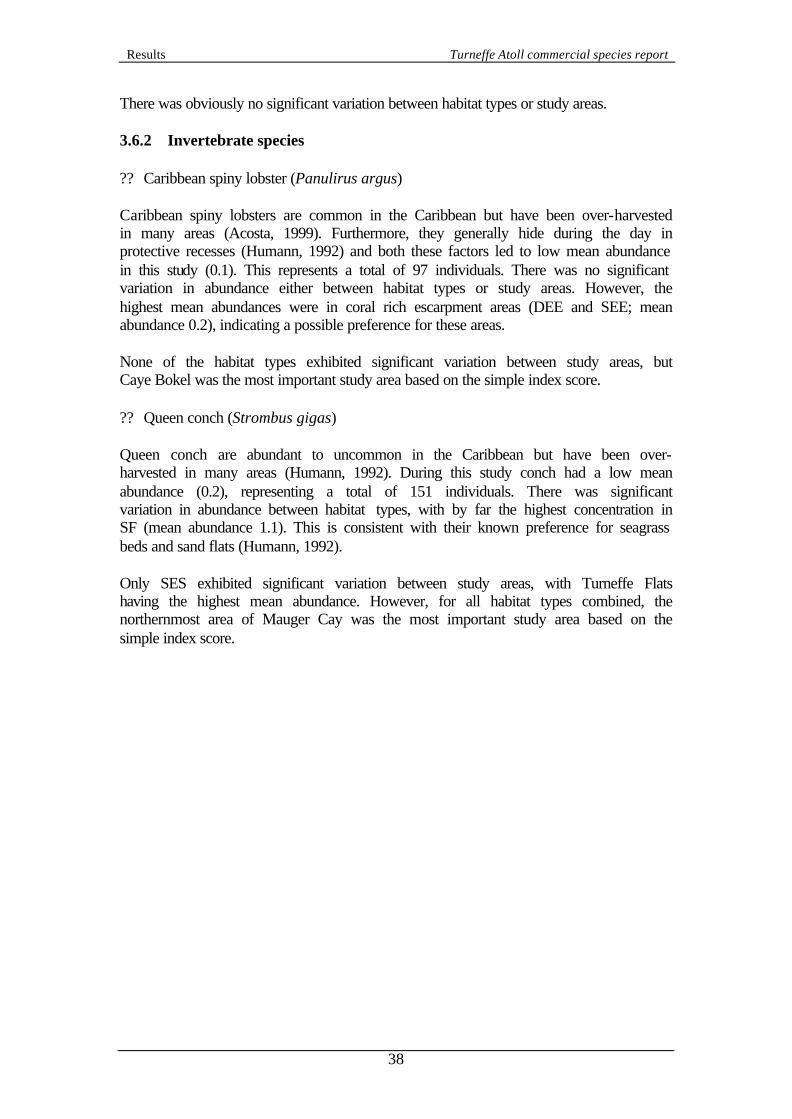
Results Turneffe Atoll commercial species report
38
There was obviously no significant variation between habitat types or study areas. 3.6.2 Invertebrate species ?? Caribbean spiny lobster (Panulirus argus) Caribbean spiny lobsters are common in the Caribbean but have been over-harvested in many areas (Acosta, 1999). Furthermore, they generally hide during the day in protective recesses (Humann, 1992) and both these factors led to low mean abundance in this study (0.1). This represents a total of 97 individuals. There was no significant variation in abundance either between habitat types or study areas. However, the highest mean abundances were in coral rich escarpment areas (DEE and SEE; mean abundance 0.2), indicating a possible preference for these areas. None of the habitat types exhibited significant variation between study areas, but Caye Bokel was the most important study area based on the simple index score. ?? Queen conch (Strombus gigas) Queen conch are abundant to uncommon in the Caribbean but have been over-harvested in many areas (Humann, 1992). During this study conch had a low mean abundance (0.2), representing a total of 151 individuals. There was significant variation in abundance between habitat types, with by far the highest concentration in SF (mean abundance 1.1). This is consistent with their known preference for seagrass beds and sand flats (Humann, 1992). Only SES exhibited significant variation between study areas, with Turneffe Flats having the highest mean abundance. However, for all habitat types combined, the northernmost area of Mauger Cay was the most important study area based on the simple index score.
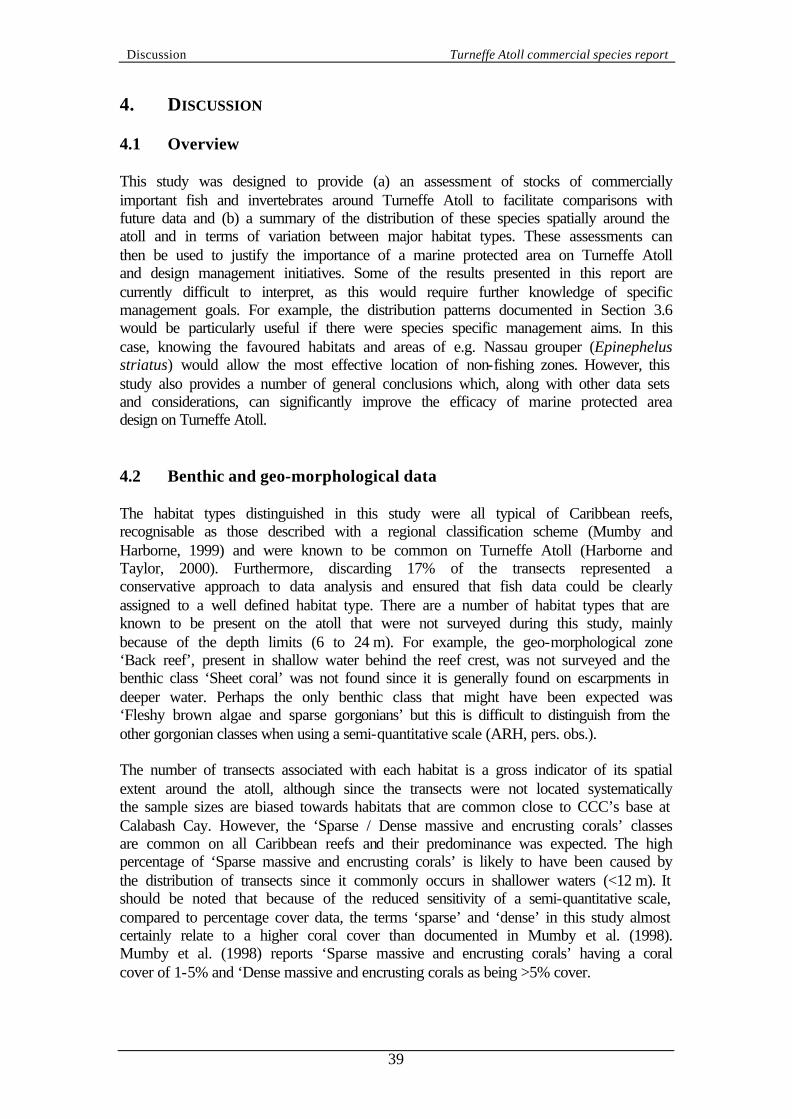
Discussion Turneffe Atoll commercial species report
39
4. DISCUSSION 4.1 Overview This study was designed to provide (a) an assessment of stocks of commercially important fish and invertebrates around Turneffe Atoll to facilitate comparisons with future data and (b) a summary of the distribution of these species spatially around the atoll and in terms of variation between major habitat types. These assessments can then be used to justify the importance of a marine protected area on Turneffe Atoll and design management initiatives. Some of the results presented in this report are currently difficult to interpret, as this would require further knowledge of specific management goals. For example, the distribution patterns documented in Section 3.6 would be particularly useful if there were species specific management aims. In this case, knowing the favoured habitats and areas of e.g. Nassau grouper (Epinephelus striatus) would allow the most effective location of non-fishing zones. However, this study also provides a number of general conclusions which, along with other data sets and considerations, can significantly improve the efficacy of marine protected area design on Turneffe Atoll. 4.2 Benthic and geo-morphological data The habitat types distinguished in this study were all typical of Caribbean reefs, recognisable as those described with a regional classification scheme (Mumby and Harborne, 1999) and were known to be common on Turneffe Atoll (Harborne and Taylor, 2000). Furthermore, discarding 17% of the transects represented a conservative approach to data analysis and ensured that fish data could be clearly assigned to a well defined habitat type. There are a number of habitat types that are known to be present on the atoll that were not surveyed during this study, mainly because of the depth limits (6 to 24 m). For example, the geo-morphological zone ‘Back reef’, present in shallow water behind the reef crest, was not surveyed and the benthic class ‘Sheet coral’ was not found since it is generally found on escarpments in deeper water. Perhaps the only benthic class that might have been expected was ‘Fleshy brown algae and sparse gorgonians’ but this is difficult to distinguish from the other gorgonian classes when using a semi-quantitative scale (ARH, pers. obs.). The number of transects associated with each habitat is a gross indicator of its spatial extent around the atoll, although since the transects were not located systematically the sample sizes are biased towards habitats that are common close to CCC’s base at Calabash Cay. However, the ‘Sparse / Dense massive and encrusting corals’ classes are common on all Caribbean reefs and their predominance was expected. The high percentage of ‘Sparse massive and encrusting corals’ is likely to have been caused by the distribution of transects since it commonly occurs in shallower waters (<12 m). It should be noted that because of the reduced sensitivity of a semi-quantitative scale, compared to percentage cover data, the terms ‘sparse’ and ‘dense’ in this study almost certainly relate to a higher coral cover than documented in Mumby et al. (1998). Mumby et al. (1998) reports ‘Sparse massive and encrusting corals’ having a coral cover of 1-5% and ‘Dense massive and encrusting corals as being >5% cover.
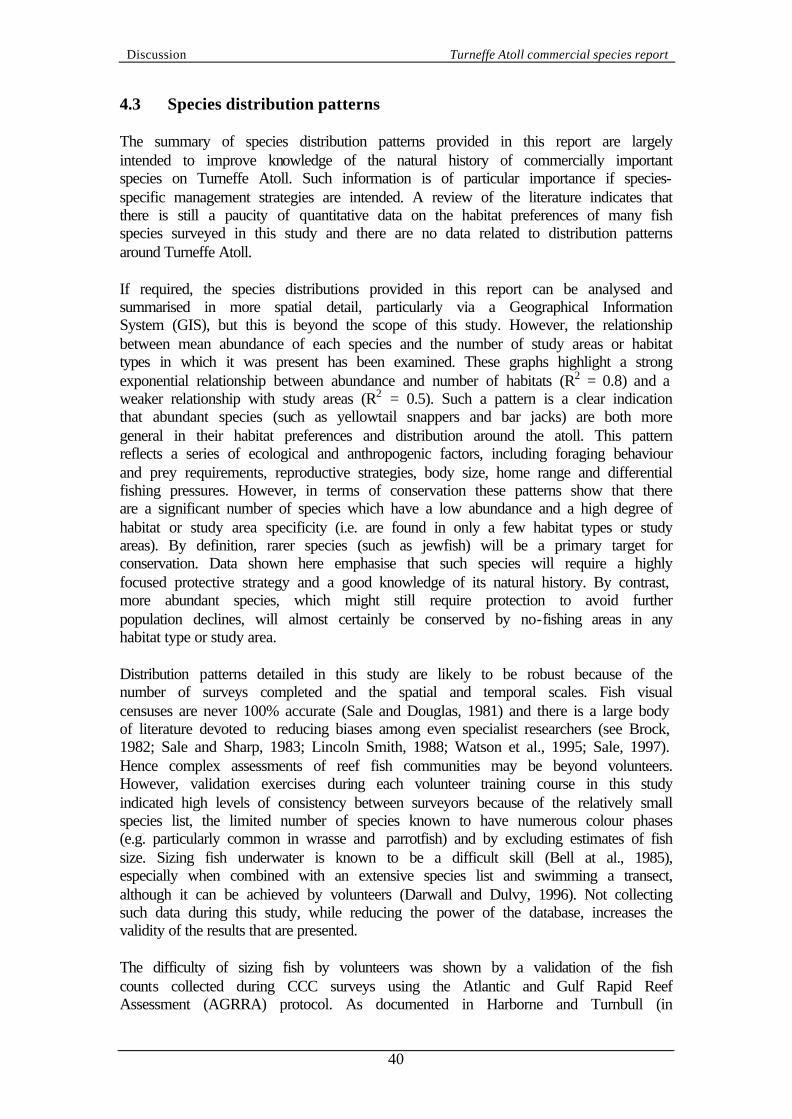
Discussion Turneffe Atoll commercial species report
40
4.3 Species distribution patterns The summary of species distribution patterns provided in this report are largely intended to improve knowledge of the natural history of commercially important species on Turneffe Atoll. Such information is of particular importance if species-specific management strategies are intended. A review of the literature indicates that there is still a paucity of quantitative data on the habitat preferences of many fish species surveyed in this study and there are no data related to distribution patterns around Turneffe Atoll. If required, the species distributions provided in this report can be analysed and summarised in more spatial detail, particularly via a Geographical Information System (GIS), but this is beyond the scope of this study. However, the relationship between mean abundance of each species and the number of study areas or habitat types in which it was present has been examined. These graphs highlight a strong exponential relationship between abundance and number of habitats (R2 = 0.8) and a weaker relationship with study areas (R2 = 0.5). Such a pattern is a clear indication that abundant species (such as yellowtail snappers and bar jacks) are both more general in their habitat preferences and distribution around the atoll. This pattern reflects a series of ecological and anthropogenic factors, including foraging behaviour and prey requirements, reproductive strategies, body size, home range and differential fishing pressures. However, in terms of conservation these patterns show that there are a significant number of species which have a low abundance and a high degree of habitat or study area specificity (i.e. are found in only a few habitat types or study areas). By definition, rarer species (such as jewfish) will be a primary target for conservation. Data shown here emphasise that such species will require a highly focused protective strategy and a good knowledge of its natural history. By contrast, more abundant species, which might still require protection to avoid further population declines, will almost certainly be conserved by no-fishing areas in any habitat type or study area. Distribution patterns detailed in this study are likely to be robust because of the number of surveys completed and the spatial and temporal scales. Fish visual censuses are never 100% accurate (Sale and Douglas, 1981) and there is a large body of literature devoted to reducing biases among even specialist researchers (see Brock, 1982; Sale and Sharp, 1983; Lincoln Smith, 1988; Watson et al., 1995; Sale, 1997). Hence complex assessments of reef fish communities may be beyond volunteers. However, validation exercises during each volunteer training course in this study indicated high levels of consistency between surveyors because of the relatively small species list, the limited number of species known to have numerous colour phases (e.g. particularly common in wrasse and parrotfish) and by excluding estimates of fish size. Sizing fish underwater is known to be a difficult skill (Bell at al., 1985), especially when combined with an extensive species list and swimming a transect, although it can be achieved by volunteers (Darwall and Dulvy, 1996). Not collecting such data during this study, while reducing the power of the database, increases the validity of the results that are presented. The difficulty of sizing fish by volunteers was shown by a validation of the fish counts collected during CCC surveys using the Atlantic and Gulf Rapid Reef Assessment (AGRRA) protocol. As documented in Harborne and Turnbull (in
Discussion Turneffe Atoll commercial species report
41
preparation), these counts, which included an extensive species list and assigning each individual to one of six size categories, were highly inconsistent between surveyors. However, the abundances recorded during the AGRRA surveys were regarded as reliable and were generally higher than those obtained during this study (Turnbull and Harborne, 2000a). However, this is to be expected since this study included a range of habitats, many of which have fewer fish than the coral rich forereef surveyed during the AGRRA study (e.g. ‘Sand with sparse algae’). Species which were less abundant during the AGRRA study are generally those that are known to prefer habitats not present at the survey site, such as Ocyurus chrysurus (yellowtail snapper) which are commonly seen on escarpments (Nagelkerken, 1981). Since this study incorporated a wider range of habitat types and more surveys, the values presented here should be viewed as the most accurate. In addition to not generating fish size data, a further limitation of this study was that fish are known to exhibit seasonal variations in spawning, food acquisition and fat storage (Robertson, 1991) and each study area could not be surveyed concurrently. For example, mackerel are pelagic species and seasonal migrants which travel widely (McField et al., 1996) and hence inter-study patterns could have been influenced by which studies were surveyed at which point during the migration cycle. Fish are also known to have diurnal behaviour patterns and during this study bar jack (Caranx ruber) were seen at dusk swimming in large shoals along escarpments. However, this variation seems unlikely to change the overall results and indeed the habitat preferences in this study appear to support the qualitative descriptions given by natural history and identification guides (e.g. Humann, 1994; Lieske and Myers, 1994) while providing much more quantitative information. Furthermore, these distribution patterns are unlikely to have changed since the end of CCC’s survey work (December 1998). Habitat preferences are largely governed by food and shelter requirements which are fixed on ecological times scales but can be altered by fishing pressure, which is relatively light around the atoll. Hurricane Mitch which affected Belize in late-1998 may have caused some changes in fish distribution by differentially altering reef integrity between study areas but further data are required to test this hypothesis. Finally, variation in annual recruitment of juvenile fish to the reef will affect abundances but the relationship between adults and number of recruits is complex and varies between species and spatially and temporally (see Caley et al., 1996 for a review). The supply of fish larvae is unequivocally an important factor in fishery conservation (Swearer et al., 1999; Cowen et al., 2000) but beyond the scope of this study. It should also be noted that Caribbean reefs have a true deep-reef fish fauna, some of which are commercially important, but are not documented in this study, although some of the juveniles of these species can be found at less than 50 m (Colin, 1974). Working on Glovers Atoll, Colin (1974) also found 60 species of reef fish between 50 and 305 m. There are also important, deepwater pelagic species that are commercially important but not included here.
Discussion Turneffe Atoll commercial species report
42
4.4 Status of fishery species on Turneffe Atoll 4.4.1 Fish Reefs in Belize are generally regarded as being relatively unaffected by anthropogenic impacts because of, for example, low population density and distance between the barrier reef and coastal development (Gibson et al., 1998). Impacts are particularly low for the three offshore atolls, including Turneffe Atoll, because of the limited land area for development and surrounding deep water which dilutes pollutants (Hall, 1994). Similarly, fishing pressure on the atoll reefs is relatively light and finfish are thought to be exploited below their maximum yield (Koslow et al., 1994). This combination of relatively low fishing pressure and healthy reefs seems to have maintained good fish populations on Turneffe Atoll and indeed Carter and Sedberry (1997) conclude that stocks are healthy throughout the country compared to other Caribbean nations. Despite having relatively healthy populations of commercially important fish, compared to other reefs in the Caribbean, there is still a need to manage remaining stocks on Turneffe Atoll. There is little quantitative information available on fishing on the atoll (e.g. catches and target species) but CCC’s own data does indicate that pressure is light, with only 160 fishing boats (generally artisanal) seen during over 1200 surveys (Turnbull and Harborne, 2000b). However, this database does not include information on larger boats fishing pelagic stocks in deeper water and fishing is likely to increase with increasing population and tourism. Furthermore, although it is difficult to assess what natural fish abundances should be present, there seems little doubt that, because of their low abundances, the larger species have been significantly exploited. This is consistent with other research which has established that piscivorous species (generally the largest individuals) are the most vulnerable fish category to impacts from heavy fishing pressure, followed by invertivores and then herbivores (e.g. McClanahan, 1995). Other studies have also shown that species at higher trophic levels, are generally good indicators of fishing pressure (Russ, 1991; Hastings and Botsford, 1999). Indeed Jennings et al. (1999) has shown that maximum size is a good indicator of vulnerability to fishing. Many of these species are characterised by long lives, with slow growth and later reproductive maturity, meaning that they are slower to recover from the impacts of fishing (McClanahan, 1995). During this study, for example, only three jewfish and 10 nurse sharks were seen in over 900 dives. Jewfish are the largest grouper found on the reef and a particular target for fishermen (Humann, 1994). Although there were higher numbers of other large groupers, species such as Nassau grouper are a valuable catch and populations are likely to be declining as they are in many areas of the Caribbean (Sluka et al., 1994; Roberts, 1995). There is some evidence for this trend in Belize from fishery statistics which show that grouper catches in 1994 were approximately 38,000 lbs compared to over 100,000 lbs in the 1950’s (McField et al., 1996), although catch per unit effort data are not available. Similarly, the shark fishery is almost certainly over-exploited. Shark are targeted for their highly valuable skin, fins, oil and meat and anecdotal reports indicate that there are fewer shark sightings now than previously (McField et al., 1996). In contrast, snappers are likely to be less susceptible to over-
Discussion Turneffe Atoll commercial species report
43
fishing because of their faster growth rates, shorter lives and younger age at sexual maturity (McField et al., 1996). However, for all species, this study provides previously unavailable baseline abundances for comparison with future data. Population dynamics will also be significantly affected by fishing of spawning grounds. Six spawning sites are known in Belize, including Mauger Cay (Carter and Sedberry, 1997). Fish are often caught before they spawn and some of the areas are thought to be over-exploited or no longer functional (McField et al., 1996). In addition, data are needed on populations of juvenile species in nursery areas to allow a full assessment of the Turneffe fin fishery. 4.4.2 Lobster Qualitative and quantitative data indicate that lobster populations have been significantly reduced throughout the Caribbean (Acosta, 1999). Although no temporal comparisons are possible, data from this study seems to support this trend with mean abundances generally less than or equal to 0.1 per survey and only 97 animals recorded in total. Only coral rich escarpments had abundances of 0.2, probably because fishermen are unable to fish these areas rather than a true habitat preference. Under Belizean law, lobsters can only be collected by skin divers (not SCUBA) and few fishermen are able to reach the deep walls. Lobster fishing is common on Turneffe and fishermen were often seen in back reef areas close to Calabash Cay (ARH, pers. obs.). Similarly to fish, Caye Bokel was the most important study area overall for lobsters, presumably because of the same factors (reef zonation and geomorphology, oceanography and primary productivity) and also spatial variation in fishing pressure. Similarly to fish counts, surveying lobsters has intrinsic inaccuracies, mainly caused by them remaining hidden in crevices during the day. However, while a few individuals were certainly missed, it seems unlikely that the actual abundances are dramatically higher. Further observations at night would be beneficial for increased data accuracy. In addition, further research is required to fully assess the fishery since lobsters have complex life histories, including an extensive pelagic larval phase and ontogenetic shifts in habitat requirements (Herrnkind and Butler, 1986; Acosta et al., 1997). For example, surveys are required in complex shelters where young lobsters shelter and mangroves where older juveniles are found. The full status of the lobster population at Turneffe is important since it is part of the country’s s most valuable fishery with 1995 exports of US$ 8.8 m (McField et al., 1996). 4.4.3 Conch Similarly to lobsters, conch data from this study supports the hypothesis that numbers have been affected by fishing. Only 151 individuals were seen in total, although the low abundances in coral rich areas were expected because of the species’ natural history. However, sandy forereef only had a mean abundance of just over one per transect and this was significantly influences by a count of 29 animals on one transect alone. A higher density was expected in gorgonian rich areas since Appeldoorn and Rolke (1996) documented the shift in the preferred habitat of conch as they got older
Discussion Turneffe Atoll commercial species report
44
from very sparse seagrass and algae to sparse and moderate seagrass and algae to gorgonian plains. The extensive gorgonian plains around the northern part of the atoll, combined with the lack of cays separating the reef from the seagrass beds, are likely to be a key factor in the preference of conch for the Mauger Cay study area. It is also important to note that further surveys are required in seagrass beds and patch reefs, known to be a key habitat for the species (Appeldoorn and Rolke, 1996), to assess the fishery fully. The full status of the conch population at Turneffe is important since it is part of the country’s second most valuable fishery with 1995 exports of US$ 1.15 m (McField et al., 1996). Qualitative reports that conch are being over-collected have been in existence since at least the early 1960’s (Stoddart, 1962). More quantitative conch abundance surveys have previously been conducted in Belize by the Fisheries Department and the CARICOM Fisheries Resource Assessment and Management Program (CFRAMP). This work was undertaken to estimate conch abundance and to identify juvenile nursery grounds throughout the coastal zone (Appeldoorn and Rolke, 1996) and should be combined with data from this study. The Fisheries Department and CFRAMP documented the abundance, size and age structure of conch in a range of habitats, along with their depth preferences and utilised fishery models to estimate a maximum sustainable yield. However, the study was unable to link conch density to accurate estimates of the extent of each habitat type and the confidence limits on population size were large. Conch are known to have specific habitat preferences and it is thought that food availability may be the most important factor (Weil and Laughlin, 1984). Adult conch feed on macroalgae and seagrass detritus (Randall, 1964; Stoner and Waite, 1991) and Stoner et al. (1994) correlated juvenile conch density to algal growth. Stoner et al. (1996) also suggested that tidal channels were important because of their role in determining larval recruitment patterns and nutrient cycling for food (Iverson et al., 1987; Stoner et al., 1994). 4.5 Relative importance of each habitat type In addition to habitat preferences for each species, this study presents a simple ranking index for overall preferences. Although relatively crude, this index is based on assigning a score using mean abundances and weights the contributions from each species. Further, more sophisticated indexes could be applied but are outside the scope of this report. Since the index is relatively crude, the final coefficients should be used only as guidelines. Index scores for all fish species combined provide unequivocal evidence for the importance of coral rich habitats. All six habitats characterised by high coral cover (‘Dense massive and encrusting corals’ and ‘Sparse massive and encrusting corals’ in three geomorphological zones) had higher scores than the five habitats dominated by gorgonians. Both the coral rich and gorgonian dominated habitats had higher scores than ‘Sand with sparse algae’ habitats. The results are consistent with a wealth of literature documenting the relationship between coral cover and rugosity and fish abundance (for example Luckhurst and Luckhurst, 1978; Bell and Galzin, 1984; Roberts and Ormond, 1987). Even the cover of a single coral species, such as elkhorn
Discussion Turneffe Atoll commercial species report
45
(Acropora palmata) has been shown to influence fish abundance (Lirman, 1999). This is intuitively obvious, since a coral rich forereef will offer more food and shelter than a sandy area. However, the conservation implication is that there is a clear link between maintaining high coral cover and healthy populations of commercially important fish species. Along with over-fishing, anthropogenic threats to reef health, including coral bleaching, hurricanes and decreasing water quality, will have effects on the fishery. Two ‘Sparse massive and encrusting coral’ habitats (SEE and SEF) had the highest scores, but given the proven relationship between coral cover and fish populations, it seems unlikely that these are truly preferable to ‘Dense massive and encrusting corals’. As discussed in Section 4.2, use of a semi-quantitative scale reduces the sensitivity of the data for distinguishing habitat types and hence benthos actually present on the transects may not be as dissimilar as the labels suggest. Furthermore, it is difficult to assess whether the fish differentiate between the two benthic classes and both may be treated equally within the home range. Combined with the crudeness of the index, the preference between ‘dense’ and ‘sparse’ areas may, therefore, contain a significant stochastic element. Such preferences will be further complicated by home range size, habitat size and the spatial arrangement of habitat types. For example, Chapman and Kramer (2000) showed that a 20 m wide area of sand and rubble was an effective barrier to movement between reefs. In contrast to differences between benthic classes, for all fish species combined, there seems little evidence of significant differences between geomorphological zones. This was not surprising since escarpments, sloping forereefs and spur and groove areas often occur in close proximity to each other. The only apparent trend was a preference for escarpments, which had the highest and third highest score among the six coral dominated habitats. Many of the fish surveyed in this study are piscivores and the relatively high numbers in this zone might be explained by the presence of numerous prey species, attracted to the high coral cover in intermediate depth zones (Sheppard, 1982) or the accessibility of plankton (Hobson, 1991). This preference was particularly apparent for jacks, which are known as strong-swimming predators of the open sea (Humann, 1994) and have relatively large home ranges (Chapman and Kramer, 2000). The two coral dominated escarpment habitats also had the highest scores for snappers, although this result probably reflected the very high numbers of yellowtails, which swim above reefs and over walls (Humann, 1994), rather than the preferences of other species. At the fish family level, the indexes also highlighted variations from the general pattern of coral rich habitats supporting the highest abundance of fish. While some of this variation is likely to have been caused by smaller sample sizes and hence less robust scores than for all species combined, these results also indicate actual habitat preferences. For example, ‘Bedrock / rubble with sparse gorgonians’ had the highest score for grunts and the top three scores were all forereef habitats. This reflects the preference seen for gorgonian rich areas at the level of individual species. Furthermore, grunts are nocturnal predators that leave the reef after sunset to forage in seagrass beds and sandy areas (Burke, 1995) and hence would not be expected to congregate on escarpments during the day, necessitating longer swims to the feeding grounds. Such results among families support the need for marine protected areas to include representative examples of every habitat type (for example Salm, 1984; Gray,
Discussion Turneffe Atoll commercial species report
46
1997). This requirement is made even more important by subtle preferences at the species level, ontogenetic shifts of habitat and prey preference within individual species (for example Eggleston et al., 1998) and the role of mangrove creeks, seagrass beds and sand-rubble zones as nursery habitats (Sedberry and Carter, 1993). However, while conserving representative habitats is ideal, there is evidence from Nassau groupers in the Central Bahamas that it is more important to protect reefs from fishing than to protect the ‘correct’ type of reef (Sluka et al., 1997). The desire to include representative examples of each habitat type in the design of a marine protected area for Turneffe Atoll will require use of a benthic habitat map, which is available via the use of aerial photography (Harborne and Taylor, 2000). However, there is also considerable scope for linking data from this study to the habitat map, within a GIS, to undertake much more sophisticated spatial analysis. Data gathered in this study are all spatially referenced and available in a GIS compatible database and could be integrated with the habitat map and indeed other available data sets. For example, work in Florida has used habitat maps and key oceanographic parameters to establish a Habitat Suitability Index and hence the geographic distribution of fish and invertebrate species by life stages (Rubec et al., 1998). Furthermore, remote sensing can be used for stock assessment. However, use of remote sensing in stock assessment has been limited and most studies are experimental and have focused on commercially important molluscs which are thought to have clear habitat preferences. Stock assessment relies on (a) that the specified habitats can be mapped using remote sensing and (b) the density and weight of the species can be determined per unit area of habitat. An estimation of the population can then be generated within a GIS via a summation of density in each habitat multiplied by the area of each habitat. This approach has been used for Trochus, a valuable source of mother-of-pearl, in New Caledonia (Bour et al., 1986; Bour, 1988). Generally fisheries stock assessment, and management, is inadequate on coral reefs since obtaining large data sets is often prohibitively expensive and time consuming meaning that the precision of population estimates is often low. Such a paucity of data may lead to an unsustainable fishery with significant ecological and economic consequences. One aim of this study was to generate a database that provides at least some of the data necessary for stock assessment. Data presented here also have the advantage of representing mean abundances in a series of habitat types, known to be an important factor controlling species distributions. Stock assessment is usually based on crude measures of the extent of ‘fishing grounds’, taking no account of habitat type (Appeldoorn and Rolke, 1996). Therefore, predicted population estimates often have large confidence intervals. Within the Caribbean, the use of remote sensing for assessing queen conch populations has also been investigated, for example a study by Stoner et al. (1996) who aimed to use Landsat TM to identify nursery areas on the Great Bahama Bank. This study predicted nursery habitats but although 90% of persistent aggregations were found in such a habitat only about 10% of the habitat was occupied by juvenile conch. Thus assessment of nursery areas from remotely sensed imagery would generate a gross overestimate. Furthermore, the habitat maps were seven years out of date and based on sparse data. Addition of further parameters to Stoner’s model within a GIS (Jones, 1996) did not significantly improve the assessment. A more
Discussion Turneffe Atoll commercial species report
47
sophisticated assessment for conch, along with lobster and fin fish, might be possible in Belize since this study classifies habitats that are visible with remote sensing and provides mean abundances per 350 m2. 4.6 Relative importance of each study area In addition to the simple index of habitat preference, the same technique was used to summarise the importance of each of the study areas for both all fish species combined and each individual family. The index has the same limitations when applied to study areas as when used for habitat types, i.e. it is relatively crude, but provides a general indication of preferences. Furthermore, it did display the key property of not being overly biased by the number of transects or habitat types in each study area. For all species combined, Caye Bokel was highlighted as the most important study area. Deadmans Cay was the second most important study area, indicating a clear preference of commercially important fish for the south and south-east sector of the atoll. This is consistent with the southern tip of the atoll (a dive site known as ‘The Elbow’) widely regarded as being an excellent area for high fish populations (Bradbury, 1994). The reasons for this high abundance in Caye Bokel are complex, possibly include spatial variation in fishing pressure and require further research. However, the southern tip of the atoll is an area of consistent currents and possibly upwelling from deeper water. Additional primary producers in the area from increased nutrients would encourage more herbivores and planktivores and subsequently their commercially important predators, although data are currently scarce. Perhaps more importantly, planktivores rely on currents to bring new prey items into the feeding area (Hobson, 1991). Reef geomorphology, zonation and the spatial arrangement of habitat types is also likely to be important. For example, the whole of Turneffe Atoll is within a wave regime modified by Lighthouse Reef (Gischler and Hudson, 1998). This modification is particularly apparent in the south of the atoll and the lower disturbance regime might increase habitat complexity via the intermediate disturbance hypothesis (Connell, 1978; demonstrated on Belizean reefs by Aronson and Precht, 1995). Caye Bokel has also been identified as an important spawning ground for mutton and cubera snappers (McField et al., 1996). For studies with lower scores than Caye Bokel and Deadmans Cay, the pattern of importance is less clear. Eastern (windward) study areas (e.g. Blackbird Cay, Grand Bogue and Calabash Cay) seem to be generally more important that western (leeward) sites. This pattern is likely to be a function of factors such as disturbance increasing habitat complexity and hence available ecological niches, variations in zonation caused by geological history and the increased nutrients available from wind driven mixing of the water column. However, there were exceptions to this pattern, including Tarpon Creek having the fourth highest score. This importance contrasts with the low score for Long Ridge, which is the study area directly south of Tarpon Creek. This area is sheltered from the prevailing wind and waves and may lack sufficient habitat complexity to support large numbers of commercially important species (disturbance too low). At the other end of the disturbance spectrum, it seems that the northern study areas (e.g. Dog Flea Cay, Crawl Cay and Snake Point) also generally have relatively poor fish populations. These study areas are not within the modified wave
Discussion Turneffe Atoll commercial species report
48
regime from Lighthouse Reef (Gischler and Hudson, 1998) and possibly the high disturbance levels have reduced habitat complexity. For example, the reefs at Dog Flea Cay lack an escarpment within CCC’s safe diving depths (28 m) and have relatively homogenous low relief spurs and grooves and a bedrock ‘gorgonian plain’. One exception to this overall trend was Mauger Cay, which had the sixth highest score. Reasons for its relatively high importance are again likely to be functions of zonation and habitat complexity and indeed the area is known as a spawning ground for groupers (Carter and Sedberry, 1997). It is possible that landscape ecology approaches within a GIS could be used to address these issues of spatial complexity of habitat types (Moss, 1988). Further data on relative fishing pressures around the atoll are also vital to fully interpret the results. As might be expected, the pattern of importance of the different study areas for all species combined was generally mirrored by those of individual families. However, there was variation with, for example, Mauger Cay being the second most important study area for jacks, although this is based on only two species. This preference for the tips of the atoll (the most important study area was Caye Bokel) may be a function of the east-west currents, compared to the north-south currents on the eastern and western sides, and their affects on prey densities. Equally, the apparent preference for habitats dominated by dense gorgonians, known to be present around the north of the atoll (Harborne and Taylor, 2000), is also likely to be an important factor. Jacks also seem to prefer the central section of the eastern side (Blackbird Cay, Calabash Cay and Soldier Cay) compared to south-eastern Deadmans Cay.
Conclusion and recommendations Turneffe Atoll commercial species report
49
5. CONCLUSION AND RECOMMENDATIONS This study has generated an extensive database on the abundance and distribution of commercially important fish and invertebrate species around Turneffe Atoll. It provides data on key habitats and areas of the atoll and previously unavailable information on the species’ natural history. Data are also important as a baseline for comparison with future surveys and will facilitate monitoring of population declines and recoveries. In summary, the main findings from this study are (1) a generally high abundance of commercially important species compared to many parts of the Caribbean but with evidence of decline, especially the biggest species and invertebrates (2) the importance of coral rich habitats for fish species and (3) the importance of the south and south-eastern sectors of the atoll for fish populations. However, fully assessing the status of the fishery on Turneffe Atoll will benefit from further research and data, all of which were beyond the scope of CCC’s work with volunteer divers. Recommendation 1: Priorities for future fisheries research on Turneffe Atoll should be: ?? Investigation of larval ecology, particularly the atoll’s role as a source or sink of
recruits e.g. the extent to which the atoll is ‘self-seeding’ as opposed to receiving larvae from other reefs in the region.
?? Status of juvenile fish and invertebrate populations in habitats not surveyed during this study (e.g. mangroves and seagrass beds).
?? Collection of analogous data for other species, particularly ecologically important species such as parrotfish (Scaridae).
?? Complimenting the existing database with an assessment of additional parameters e.g. biomass, fish size and age structures and community trophic structures.
?? Temporal dynamics and modelling of adult populations with respect to factors such as seasonal and annual variation.
?? Modelling of the role of commercially important fish species in the functional ecology of the atoll e.g. via the mass-balance trophic models constructed by the ‘ECOPATH’ software, which is available within ReefBase3.
Assessing the fishery on Turneffe Atoll and generating efficient management techniques also relies on data to document fishing pressure, including catches, species taken and sites used. These data are currently limited and more detailed monitoring would be extremely beneficial. Recommendation 2: Establish a programme to monitor fisherfolk on Turneffe Atoll. Such a programme should focus on species caught, weights landed, sites used and ideally catch per unit effort. Such a programme should incorporate both artisanal and commercial operations. Data presented in this report are all spatially referenced and could be integrated with other information available for the atoll with a GIS. These data can also be combined with a national GIS system.
3 http://www.isnar.org/iclarm/reefbase/
Conclusion and recommendations Turneffe Atoll commercial species report
50
Recommendation 3: Establish an integrated GIS, including data from this study and a series of additional coverages such as the benthic habitat map. These data layers could then be used for detailed spatial analysis. Recommendation 4: Examine the potential of extrapolating the habitat preferences documented in this study throughout Belize via the national habitat map. Despite the relatively healthy reefs and fish populations on Turneffe Atoll, there is a need to establish management initiatives. Such initiatives may be either preventative (i.e. protecting species before their stocks are threatened) or reactive (i.e. facilitating the recovery of significantly affected species). Both are required on the atoll and it seems that the latter is needed urgently for species such as conch, lobster and the larger groupers. Preventative or reactive measures can be achieved using the same approach since tropical areas represent complex multi-species fisheries that are generally managed as a whole. This is commonly via ‘no-take’ areas where fishing is excluded and there is an extensive body of literature dedicated to the theory of fisheries management on coral reefs (see Roberts and Polunin, 1991; Roberts and Polunin, 1993; Bohnsack, 1998 for summaries). It is intuitively apparent that establishing no-take zones to protect rare species will also conserve more abundant species. No-take zones also have the advantage that they can be effective without requiring growth and mortality statistics for each species that are necessary for conventional management options (Munro and Williams, 1985; see also Mahon, 1997). Protection from fishing has already been shown to increase the numbers of commercially important species compared to fished areas in Belize (e.g. Polunin and Roberts, 1993; Carter and Sedberry, 1997). Recommendation 5: No-take zones on Turneffe Atoll should integrate the following factors: ?? Importance of the south and south-eastern sectors of the reef. ?? Preference of many fish species for coral rich habitats. The corollary of this
consideration is to integrate measures to protect coral cover on the atoll, including avoiding damage from fishing traps, nets and boats.
?? Protection of areas incorporating each habitat type, including mangroves and seagrass beds, in order to allow for nursery areas, ontogenetic shifts and species that rely on non-coral rich habitats.
?? Consideration of species specific management may be required for particularly rare species, such as jewfish.
?? Spawning sites, known to be present in the north-eastern and southern sectors of the atoll should be carefully managed, ideally with seasonal closure of these areas to fishing. Establishing functioning spawning sites is a key consideration for establishing a sustainable fishery for species such as the Nassau grouper.
Turneffe Atoll is more remote than many other reefs in the Caribbean and seems to be in good condition. However, Bryant et al. (1998) estimate the threat to the atoll as ‘medium’. Although this threat is lower than many reefs in Central America, there is some cause for concern and pressure from fishing, development and diving, combined
Conclusion and recommendations Turneffe Atoll commercial species report
51
with effects from natural events such as coral bleaching, are likely to increase. A marine protected area for Turneffe Atoll has been proposed (Gibson, pers. com.) and this would help to maintain reef health. Such a reserve would also provide additional ecological and economic benefits, such as increased fish catches and income for local communities (Clark, 1996). Establishment of a marine protected area should not be assessed purely in terms of species abundance. Other natural and anthropogenic factors need to be incorporated, including local socio-economic needs such as artisanal fishing and tourist resorts. All the different and potentially conflicting factors need to be considered and discussed between stakeholders before any management plan can be developed. Tools such as GIS can be used to help manage a variety of biological, economic and political data. A participatory approach to decision making is crucial and workshops or public meetings can be used to provide an open forum for stakeholders. Such meetings can be further structured using management decision making software such as SimCoast4. Recommendation 6: Continue to aim to establish a multiple use marine protected area at Turneffe Atoll, with an integrated monitoring programme to measure its efficacy.
4 SimCoast is a fuzzy logic expert decision-making tool which functions in a workshop environment bringing together stakeholders and consultants to define, prioritise and incorporate the many, and potentially conflicting, user and resource systems (McGlade, 1995).

References Turneffe Atoll commercial species report
52
6. REFERENCES Acosta, C.A. 1999. Benthic dispersal of Caribbean spiny lobsters among insular habitats: implications for the conservation of exploited marine species. Conservation Biology 13: 603-612. Acosta, C.A., Matthews, T.R. and Butler IV, M.J. 1997. Temporal patterns and transport processes in recruitment of spiny lobster (Panulirus argus) postlarvae to south Florida. Marine Biology 129: 79-85. Appeldoorn, R.S. and Rolke, W. 1996. Stock abundance and potential yield of the queen conch resource in Belize. Report to CARICOM Fisheries Resource Assessment and Management Programme and Belize Fisheries Department. Aronson, R.B. and Precht, W.F. 1995. Landscape patterns of reef coral diversity: A test of the intermediate disturbance hypothesis. Journal of Experimental Marine Biology and Ecology 192: 1-14. Bell, J.D., Craik, G.J.S., Pollard, D.A. and Russell, B.C. 1985. Estimating length frequency distributions of large reef fish underwater. Coral Reefs 4: 41-44. Bell, J.D and Galzin, R. 1984. Influence of live coral cover on coral-reef fish communities. Marine Ecology Progress Series 15: 265-274. Bohnsack, J.A. 1998. Application of marine reserves to reef fisheries management. Australian Journal of Ecology 23: 298-304. Bour, W. 1988. SPOT images for coral reef mapping in New Caledonia. A fruitful approach for classic and new topics. Proceedings of the 6th International Coral Reef Symposium 2: 445-448 Bour, W., Loubersac, L. and Rual, P. 1986. Thematic mapping of reefs by processing of simulated SPOT satellite data: application of the Trochus niloticus biotope on Tetembia Reef (New Caledonia). Marine Ecology Progress Series 34: 243-249. Bradbury, A. 1994. Guide to Belize. Bradt Publications and The Globe Pequot Press. Bray, J.R. and Curtis, J.T. 1957. An ordination of the upland forest communities of Southern Wisconsin. Ecological Monographs 27: 325-349. Brock, R.E. 1982. A critique of the visual census method for assessing coral reef fish populations. Bulletin of Marine Science 32: 269-276. Bryant, D., Burke, L., McManus, J. and Spalding, M. 1998. Reefs at Risk. World Resources Institute. Caley, M.J., Carr, M.H., Hixon, M.A., Hughes, T.P., Jones, G.P. and Menge, B.A. 1996. Recruitment and the local dynamics of open marine populations. Annual Review of Ecology and Systematics 27:477–500.
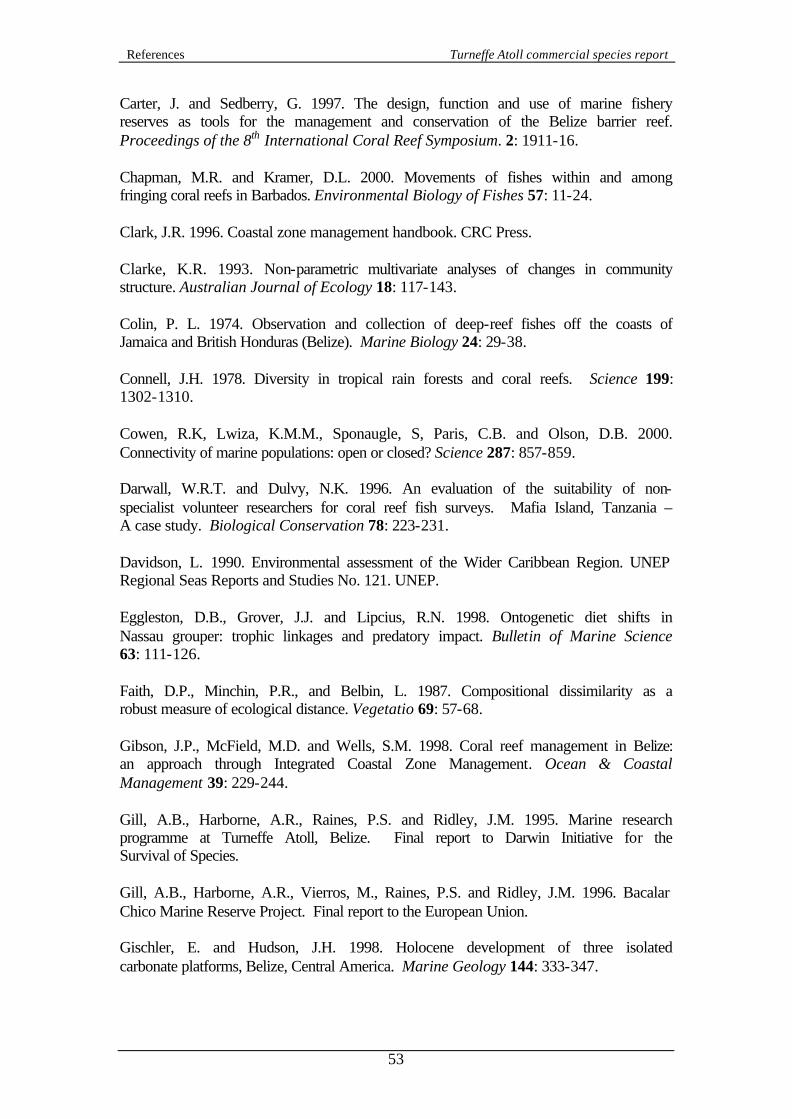
References Turneffe Atoll commercial species report
53
Carter, J. and Sedberry, G. 1997. The design, function and use of marine fishery reserves as tools for the management and conservation of the Belize barrier reef. Proceedings of the 8th International Coral Reef Symposium. 2: 1911-16. Chapman, M.R. and Kramer, D.L. 2000. Movements of fishes within and among fringing coral reefs in Barbados. Environmental Biology of Fishes 57: 11-24. Clark, J.R. 1996. Coastal zone management handbook. CRC Press. Clarke, K.R. 1993. Non-parametric multivariate analyses of changes in community structure. Australian Journal of Ecology 18: 117-143. Colin, P. L. 1974. Observation and collection of deep-reef fishes off the coasts of Jamaica and British Honduras (Belize). Marine Biology 24: 29-38. Connell, J.H. 1978. Diversity in tropical rain forests and coral reefs. Science 199: 1302-1310. Cowen, R.K, Lwiza, K.M.M., Sponaugle, S, Paris, C.B. and Olson, D.B. 2000. Connectivity of marine populations: open or closed? Science 287: 857-859. Darwall, W.R.T. and Dulvy, N.K. 1996. An evaluation of the suitability of non-specialist volunteer researchers for coral reef fish surveys. Mafia Island, Tanzania – A case study. Biological Conservation 78: 223-231. Davidson, L. 1990. Environmental assessment of the Wider Caribbean Region. UNEP Regional Seas Reports and Studies No. 121. UNEP. Eggleston, D.B., Grover, J.J. and Lipcius, R.N. 1998. Ontogenetic diet shifts in Nassau grouper: trophic linkages and predatory impact. Bulletin of Marine Science 63: 111-126. Faith, D.P., Minchin, P.R., and Belbin, L. 1987. Compositional dissimilarity as a robust measure of ecological distance. Vegetatio 69: 57-68. Gibson, J.P., McField, M.D. and Wells, S.M. 1998. Coral reef management in Belize: an approach through Integrated Coastal Zone Management. Ocean & Coastal Management 39: 229-244. Gill, A.B., Harborne, A.R., Raines, P.S. and Ridley, J.M. 1995. Marine research programme at Turneffe Atoll, Belize. Final report to Darwin Initiative for the Survival of Species. Gill, A.B., Harborne, A.R., Vierros, M., Raines, P.S. and Ridley, J.M. 1996. Bacalar Chico Marine Reserve Project. Final report to the European Union. Gischler, E. and Hudson, J.H. 1998. Holocene development of three isolated carbonate platforms, Belize, Central America. Marine Geology 144: 333-347.

References Turneffe Atoll commercial species report
54
Gray, J.S. 1997. Marine biodiversity: Patterns, threats and conservation needs. Biodiversity and Conservation 6: 153-175. Hall, M. 1994. Agricultural pollution on the coral reef in the Stann Creek district, Belize; an assessment of sources, effects and Government policy. Unpublished MSc thesis. Imperial College of Science, Technology and Medicine (University of London). Hand, D.J. 1981. Discrimination and classification. John Wiley & Sons, Chichester. Harborne, A.R. 1999. Caribbean science staff manual. Unpublished CCC report. Harborne, A.R. and Taylor, F. 2000. Summary of Coral Cay Conservation’s habitat mapping and description data from Turneffe Atoll, Belize. Unpublished CCC report. Harborne, A.R. and Turnbull, C.G. In preparation. Ability of non-professional researchers to collect quantitative data on the health of coral reefs. Hartshorn, G and 16 others. 1984. Belize country environmental profile. Robert Nicolait & Associates Ltd. Hastings, A. and Botsford, L. 1999. Equivalence in yield from marine reserves and traditional fisheries management. Science 284 (5419): 1537- 1538. Herrnkind, W.F. and Butler IV, M.J. 1986. Factors regulating postlarval settlement and juvenile microhabitat use by spiny lobsters Panulirus argus. Marine Ecology Progress Series 34: 23-30. Hobson, E.S. 1991. Trophic relationships of fishes specialized to feed on zooplankters above coral reefs. pp. 69-95 In: Sale, P.F. (ed.). The ecology of fishes on coral reefs. Academic Press, Inc. San Diego. Humman, P. 1992. Reef Creature Identification. Florida, Caribbean, Bahamas. New World Publications. Humann, P. 1994. Reef Fish Identification. Florida, Caribbean, Bahamas. New World Publications. ICFTU, TUAC, ITF and Green Peace International. 1999. Annex: FOC fishing fleet size and catches. Troubled waters. Fishing, pollution and FOC’s. International Confederation of Free Trade Unions, trade Union Advisory Committee to the OECD, International Transport Worker’s Federation, Green Peace International. Major group submission for the 1999 CSD thematic review: oceans and seas. Iversen, E.S., Rutherford, E.S., Bannerot, S.P. and Jory, D.E. 1987. Biological data on Berry Islands (Bahamas) queen conch, Strombus gigas, with mariculture and fisheries management implications. Fisheries Bulletin, US 85: 299-310.
References Turneffe Atoll commercial species report
55
Jennings, S., Reynolds, J.D. and Polunin, N.V.C. 1999. Predicting the vulnerability of tropical reef fishes to exploitation with phylogenies and life histories. Conservation Biology 13: 1466-1475. Jones, R.L. 1996. Spatial analysis of biological and physical features associated with the distribution of queen conch, S. gigas, nursery habitats. M.S. thesis, Florida Institute of Technology. Kolmogorov, A.N. 1933. Sulla determinazione empirica di una legge di distribuzione. Giornalle dell Instituto Italiano degli Attuari 4: 1-11. Koslow, J. A., Aiken, K., Auil, S. and Clementson, A. 1994. Catch and effort analysis of the reef fisheries of Jamaica and Belize. Fishery Bulletin 92(4): 737-747. King, T.D. 1997. Folk management and local knowledge: Lobster fishing and tourism at Caye Caulker, Belize. Coastal Management 25: 455-469. Lieske, E. and Myers, R. 1994. Coral reef fishes. HarperCollinsPublishers. Lincoln Smith, M.P. 1988. Effects of observer swimming speed on sample counts of temperate rocky reef fish assemblages. Marine Ecology Progress Series 43: 223-231. Lirman, D. 1999. Reef fish communities associated with Acropora palmata: relationships to benthic attributes. Bulletin of Marine Science 65: 235-252. Luckhurst, B.E. and Luckhurst, K. 1978. Analysis of the influence of substrate variables on coral reef fish communities. Marine Biology 49: 317-323. Mahon, R. 1997. Does fisheries science serve the needs of managers of small stocks in developing countries? Canadian Journal of Fisheries and Aquatic Science 54: 2207-2213. McClanahan, T.R. 1995. A coral reef ecosystem-fisheries model: impact of fishing intensity and catch selection on reef structure and processes. Ecological Modelling 80: 1-19 McCorry, D., Mumby, P.J., Raines, P.S. and Ridley, J.M. 1993. South Water Cay Marine Reserve draft management plan. CZMU/CCC. McField, M.D., Wells, S.M and Gibson, J.P. (eds). 1996. State of the Coastal Zone Report. Belize, 1995. Coastal Zone Management Programme and Government of Belize. McGlade, J. 1995. SIMCOAST. Interdisciplinary scientific methodologies for the sustainable use and management of coastal resource systems. Contributed paper at ASEAN-EU workshop, 13-15th September 1995, Penang, Malaysia. Moss, M.R. (ed.) 1988. Landscape ecology and management. Polyscience, USA.
References Turneffe Atoll commercial species report
56
Mumby, P.J and Harborne, A.R. 1999. Development of a systematic classification scheme of marine habitats to facilitate regional management and mapping of Caribbean coral reefs. Biological Conservation 88 : 155-163. Mumby, P.J., Harborne, A.R. and Raines, P.S. 1998. Classification scheme for marine habitats of Belize. Unpublished report to the UNDP/GEF Belize Coastal Zone Management Project. Mumby, P.J., Harborne, A.R., Raines, P.S. and Ridley, J.M. 1995. A critical assessment of data derived from Coral Cay Conservation volunteers. Bulletin of Marine Science 56: 737-751. Munro, J.L. and Williams, D.M. 1985. Assessment and management of coral reef fisheries: biological, environmental and socio-economic aspects. Proceedings of the 5th International Coral Reef Congress 4: 544-578. Murray, M.R., Zisman, S.A. and Minty, C.D. 1999. Soil-plant relationships and a revised classification of Turneffe Atoll, Belize. Atoll Research Bulletin 464: 1-32. Nagelkerken, W.P. 1981. Distribution and ecology of the groupers (Serranidae) and snappers (Lutjanidae) of the Netherlands Antilles. Foundation for Scientific Research in Surinam and the Netherlands Antilles, Natural History Series 3: 7-71. Perkins, J.S. 1983. The Belize Barrier Reef ecosystem: An assessment of its resources, conservation status and management. New York Zoological Society report. Polunin, N.V.C. and Roberts, C.M. 1993. Greater biomass and value of target coral reef fishes in two small Caribbean marine reserves. Marine Ecology Progress Series 100: 167-176. Raines, P.S., McCorry, D., Mumby, P.J. and Ridley, J.M. 1993. Coral Cay Conservation – survey techniques and their application in Belize. Proceedings of the 7th International Coral Reef Symposium 1: 122-126. Randall, J.E. 1964. Contributions to the biology of the queen conch, Strombus gigas. Bulletin of Marine Science of the Gulf and Caribbean 14: 246-295 Roberts, C.M. 1995. Rapid build-up of fish biomass in a Caribbean marine reserve. Conservation Biology 9: 815-826. Roberts, C.M. and Ormond, R.F.G. 1987. Habitat complexity and coral reef fish diversity and abundance on Red Sea fringing reefs. Marine Ecology Progress Series 41: 1-8. Roberts, C.M. and Polunin, N.V.C. 1991. Are marine reserves effective in management of reef fisheries? Reviews in Fish Biology and Fisheries. 1: 65-91. Roberts, C.M. and Polunin, N.V.C. 1993. Marine reserves: simple solutions to managing complex fisheries? Ambio 22: 363-368.
References Turneffe Atoll commercial species report
57
Robertson, D.R. 1991. The role of adult biology in the timing of spawning of tropical reef fishes. pp. 356-386 In: Sale, P.F. (ed.). The ecology of fishes on coral reefs. Academic Press, Inc. San Diego. Rubec, P.J., Coyne, M.S., McMichael Jr, R.H. and Monaco, M.E. 1998. Spatial methods being developed in Florida to determine essential fish habitat. Fisheries 23: 21-25. Russ, G.R. 1991. Coral reef fisheries: effects and yields. pp. 601-635 In: Sale, P.F. (ed.). The ecology of fishes on coral reefs. Academic Press, Inc. San Diego. Sale, P.F. 1997. Visual census of fishes: How well do we see what is there? Proceedings of 8th International Coral Reef Symposium 2: 1435-1440. Sale, P.F. and Douglas, W.A. 1981. Precision and accuracy of visual census technique for fish assemblages on coral patch reefs. Environmental Biology of Fishes 6: 333-339. Sale, P.F. and Sharp, B.J. 1983. Correction for bias in visual transect censuses of coral reef fishes. Coral Reefs 2: 37-42. Salm, R.V. 1984. Ecological boundaries for coral-reef reserves: principles and guidelines. Environmental Conservation 11: 209-215. Sedberry, G.R. and Carter, J. 1993. The fish community of a shallow tropical lagoon in Belize, Central America. Estuaries 16(2): 198-215. Sheppard, C.R.C. 1982. Coral populations on reef slopes and their major controls. Marine Ecology Progress Series 7: 83-115. Sluka, R., Chiappone, M. and Sullivan, K.M. 1994. Comparison of juvenile grouper populations in southern Florida and the central Bahamas. Bulletin of Marine Science 54: 871-880. Sluka, R., Chiappone, M., Sullivan, K.M. and Wright, R. 1997. Benefits of a marine fishery reserve for Nassau grouper Epinephelus striatus in the Central Bahamas. Proceedings of the 8th International Coral Reef Symposium. 2: 1961-1964. Sluka, R. and Sullivan, K.M. 1996. The influence of habitat on the size distribution of groupers in the upper Florida Keys. Environmental Biology of Fishes 47: 177-189. Sokal, R.R. and Rohlf, J. 1981. Biometry. W.H. Freeman and Co., San Francisco. Stoddart, D.R. 1962. Three Caribbean atolls: Turneffe Islands, Lighthouse Reef, and Glover’s Reef, British Honduras. Atoll Research Bulletin 87: 1-151. Stoner, A.W., Hanisak M.D., Smith N.P. and Armstrong R.A. 1994. Large-scale distribution of queen conch nursery habitats: implications for stock enhancement. Pages 169-189 in R. S. Appeldoorn and B. Rodriquez (eds). Queen conch biology, fisheries and mariculture. Fundac. Client. Los Roques, Caracas, Venezuela.
References Turneffe Atoll commercial species report
58
Stoner, A.W., Pitts P.A. and Armstrong R.A. 1996. Interaction of physical and biological factors in the large-scale distribution of juvenile queen conch in seagrass meadows. Bulletin of Marine Science 58(1): 217-233. Stoner, A.W. and Waite, J.M. 1991. Trophic biology of Strombus gigas in nursery habitats: diets and food sources in seagrass meadows. Journal of Mollusc Studies 57: 451-460. Swearer, S.E., Caselle, J.E., Lea, D.W. amd Warner, R.R. 1999. Larval retention and recruitment in an island population of coral-reef fish. Nature 402: 799-802. Turnbull, C.G and Harborne, A.R. 2000a. Summary of Coral Cay Conservation’s Atlantic and Gulf Rapid Reef Assessment data from Turneffe Atoll, Belize. Unpublished CCC report. Turnbull, C.G and Harborne, A.R. 2000b. Summary of Coral Cay Conservation’s oceanographic, climate and anthropogenic impact data from Turneffe Atoll, Belize. Unpublished CCC report. UNEP/IUCN. 1988. Coral reefs of the world. Volume 1: Atlantic and Eastern Pacific. UNEP Regional Seas Directories and Bibliographies. IUCN, Gland, Switzerland and Cambridge, UK / UNEP, Nairobi, Kenya. Watson, R.A., Carlos, G.M. and Samoilys, M.A. 1995. Bias introduced by the non-random movement of fish in visual transect surveys. Ecological Modelling 77: 205-214. Weil, E. and Laughlin, R. 1984. Biology, population dynamics, and reproduction of the queen conch, Strombus gigas Linne, in the Archipelago de Los Roques National Park. Journal of Shellfish Research 4: 45-62.