Embed Size (px)
Citation preview
www.elsevier.com/locate/still
Soil & Tillage Research 83 (2005) 9–24
DAYCENT model analysis of past and contemporary soil N2O
and net greenhouse gas flux for major crops in the USA
S.J. Del Grosso a,b,*, A.R. Mosier a, W.J. Parton b, D.S. Ojima b
a USDA/ARS, Fort Collins, CO 80521, USAb Natural Resource Ecology Laboratory, Colorado State University, Fort Collins, CO 80523, USA
Received 28 January 2004; received in revised form 11 January 2005
Abstract
The DAYCENT ecosystem model (a daily version of CENTURY) and an emission factor (EF) methodology used by the
Intergovernmental Panel on Climate Change were used to estimate direct and indirect N2O emission for major cropping systems
in the USA. The EF methodology is currently used for the USA greenhouse gas inventory but process based models, such as
DAYCENT, may yield more reliable results because they account for factors such as soil type, climate, and tillage intensity that
are ignored by EF. Comparison of mean annual soil N2O flux estimated by DAYCENT and EF with measured data for different
cropping systems yielded r2 values of 0.74 and 0.67, and mean deviations of �6 and +13%, respectively. At the national scale,
DAYCENT simulation of total N2O emission was �25% lower than estimated using EF. For both models, N2O emission was
highest in the central USA followed by the northwest, southwest, southeast, and northeast regions. The models simulated
roughly equivalent direct N2O emission from fertilized crops, but EF estimated greater direct N2O emission than DAYCENT for
N-fixing crops. DAYCENT and EF estimates of the gaseous component of indirect N2O emission (NO + NH3) differed little, but
DAYCENT estimated approximately twice the indirect emission from NO3 leaching since it included the contribution of N from
N-fixing crops while EF did not. DAYCENT simulations were also performed for no tillage cropping, pre-1940 crop
management, and native vegetation. DAYCENT-simulated N2O, CO2, and CH4 fluxes were converted to CO2–C equivalents
and combined with fuel use estimates to estimate net global warming potential (GWPnet). GWPnet for recent non-rice (Oryza
sativa L.) major cropping was 0.43 Mg C ha�1 yr�1 under conventional tillage and 0.29 Mg C ha�1 yr�1 under no tillage, for
pre-industrial cropping was 0.25 Mg C ha�1 yr�1, and for native systems was �0.15 Mg C ha�1 yr�1. Results from DAYCENT
suggest that conversion to no tillage at the national scale could mitigate �20% of USA agricultural emission or �1.5% of total
USA emission of greenhouse gases.
# 2005 Elsevier B.V. All rights reserved.
Keywords: Biogeochemical modeling; Global warming potential; Methane; Nitrous oxide; Regional analysis; Soil carbon
* Corresponding author. Tel.: +1 970 491 2195; fax: +1 970 491 1965.
E-mail address: [email protected] (S.J. Del Grosso).
0167-1987/$ – see front matter # 2005 Elsevier B.V. All rights reserved.
doi:10.1016/j.still.2005.02.007
S.J. Del Grosso et al. / Soil & Tillage Research 83 (2005) 9–2410
1. Introduction
1.1. Nitrogen gas emissions from agricultural soils
There has been concern regarding the environ-
mental effects of nitrogen (N) gases in the atmosphere
for many years (CAST, 1976; Rodhe, 1990). Nitrous
oxide (N2O) in the troposphere absorbs terrestrial
thermal radiation and thus contributes to greenhouse
warming of the atmosphere. On a mass basis, N2O is
about 300 times more potent than carbon dioxide
(CO2) in this respect, and it is increasing in atmo-
spheric concentration at the rate of 0.6–0.9 ppbv per
year (Albritton and Meira Filho, 2001; CMDL, 2002).
Nitrous oxide is also involved in the depletion of the
ozone layer in the stratosphere, which protects the
biosphere from the harmful effects of solar ultraviolet
radiation (Crutzen, 1981). It has been estimated that
doubling the concentration of N2O in the atmosphere
would result in a 10% decrease in the ozone layer, and
this would increase the ultraviolet radiation reaching
the earth by 20% (Crutzen and Ehhalt, 1977). With a
relatively long atmospheric lifetime for N2O of
approximately 114 years (Albritton and Meira Filho,
2001), there are justifiable reasons for concern. A
second important atmospheric gas is nitric oxide
(NO), which reacts with hydroxyl radicals in the
atmosphere. Hydroxyl radicals are necessary for the
removal of other greenhouse gases (GHG), such as
methane (CH4) (Williams et al., 1992). Atmospheric
NO can also be deposited on soils, incorporated into
the N cycle, and act as a secondary source for N2O
emission. A third reactive N gas is ammonia (NH3),
which affects visibility, aerosol chemistry, acid
deposition, health, and climate. Ammonia also affects
the capacity of soil to act as a sink for CH4 (Steudler
et al., 1989), which is also an important GHG.
Ammonia, like NO, has a short lifetime in the
atmosphere and provides a secondary source for the
formation of N2O, because it can be deposited on soils.
Globally, approximately 7 (6–13) Tg of N2O–N is
emitted to the atmosphere each year as a result of
human activities (Kroeze et al., 1999). The only
known process for its removal from the atmosphere is
reaction with excited singlet oxygen atoms (formed by
photolysis of ozone) in the stratosphere. The
concentration of N2O in the atmosphere is increasing
at the rate of 0.8 ppbv yr�1, which translates to an
atmospheric stock increase of �5 (4–6) Tg N yr�1.
Assuming that the stratospheric destruction of N2O is
12.3 (10–15) Tg N yr�1 then the total emission of N2O
from the biosphere is calculated as 17.2 (14–
21) Tg N yr�1 (Albritton and Meira Filho, 2001).
These estimates suggest that the bulk of emission
(�10 Tg N yr�1) comes from natural sources, with
oceans responsible for a third, and soils two-thirds of
these emissions. Although significant uncertainty
remains about the quantity of N2O emitted from
specific sources, agriculture, through soil emission,
biomass burning and animal production, is responsible
for an estimated 80% of anthropogenic emission
(Kroeze et al., 1999).
Currently the inventory of GHG emissions and
sinks in the USA includes an assessment of N2O
emission from agricultural soil based on the Good
Practice 2000 amendment of the IPCC (1997)
(USEPA, 2002). Calculation of N2O emission directly
from crop production systems is based on an emission
factor of 1.25 � 1% of total N applied (IPCC, 1997).
However, the IPCC (1997) guidelines for estimating
N2O emission from agricultural soils have a number of
limitations. The guidelines consider all agricultural
systems to be the same throughout the world and do
not take into account different crops, soils, climate and
management, all of which are known to affect
nitrification–denitrification and N2O production and
emission (Mosier et al., 1998). This methodology
assumes that cropped systems are in steady-state so
that the entire N cycle occurs during a calendar year,
i.e., N is not stored in the plant/soil system for >1 year.
However, N can be stored and cycled within the plant/
soil system for many years before it is harvested, lost
to the atmosphere, or leached as nitrate (NO3) into
groundwater (Follett, 2001a). This lag time between N
input and ultimate production of N2O (Bakken and
Bleken, 1998; Mosier and Kroeze, 2000) and an
interaction between weather patterns from year to year
(Dobbie et al., 1999), are likely confounding factors
that are not accounted for in the IPCC (1997)
methodology.
A recent compilation of measured N2O emission
suggests that a more appropriate median N2O emission
factor would be 0.9% of N applied (Bouwman et al.,
2002a; Laegried and Aastveit, 2002) instead of 1.25%
as used by IPCC (1997). Whatever emission factor is
used, however, it is clear that N2O emission varies

S.J. Del Grosso et al. / Soil & Tillage Research 83 (2005) 9–24 11
temporally and spatially and that any emission factor
used would have uncertainty of >50% (Mosier et al.,
1999; Lim et al., 1999). Yearly variations in N2O
emission are often greater than management-induced
variations (Clayton et al., 1997; Kaiser et al., 1998).
Along with emphasizing the need for appropriate field
research to evaluate the impacts of management on
agricultural N2O emission, Laegried and Aastveit
(2002) noted several factors other than N fertilization
that would impact N2O emissions:
� m
ixture of organic and inorganic fertilizers couldemit more N2O than inorganic fertilizers alone;
� c
rop type;� s
oil organic carbon enhances N2O emission;� p
oorly drained soils could emit more N2O thanwell-drained soils.
Uncertainty in indirect N2O emission from crop and
livestock production is even greater than for direct
emission (Mosier et al., 1998; Nevison, 2000; Groff-
man et al., 2000, 2002). Indirect N2O emission is from:
(1) NO3 leached into groundwater and subsequently,
denitrified to N2O and (2) NH3 and NOx emission
deposited onto aquatic and soil surfaces and converted
to N2O. Groffman et al. (2002) suggested that an in-
direct N2O emission requires knowledge not only of
the amount of N leaching or running off from fields, but
also the variation of N2O:N2 and N2O:NOx ratios re-
sulting from different soil, sediment and aquatic co-
nditions. They noted that while analyses of N flows in
agricultural watersheds are relatively common for
water quality purposes, N2O emission is rarely mea-
sured. Compared to the IPCC (1997) methodology,
process-based models should have greater potential to
reduce uncertainties for both direct and indirect N2O
emissions, because they could account for how clim-
ate, soil type, and N inputs affect both total N losses and
the proportion of losses that are in the form of N2O,
NOx, NH3, and N2 gasses, and NO3 leaching.
1.2. Net global warming potential (GWPnet)
Although N2O is a major contributor to GWP in
crop production systems, the entire suite of GHGs
(CO2, N2O, and CH4) needs to be considered. When
all GHGs are accounted, agriculture is responsible for
only a small portion (�8%) of total GHG emission in
the USA (USEPA, 2002). However, agriculture has
large potential to mitigate the increasing radiative
forcing of the atmosphere. Typical crop production
practices in the USA generate N2O and reduce the
potential of soil to absorb CH4 (Robertson et al.,
2000). Improved management could store C in soil
(Follett, 2001b) and decrease N2O emission (Kroeze
et al., 1999). Mitigation by agriculture could also
come from reducing fossil-fuel derived energy inputs,
decreasing CH4 emission and increasing soil CH4
oxidation. Lal (2004) estimated that C sequestration in
agricultural and degraded soils could offset 5–15% of
global CO2 emission. But management strategies
meant to sequester C should also be evaluated for their
effects on N2O and CH4 fluxes, and vice versa. For
example, drainage of rice paddies decreases CH4
emission (Wassmann et al., 2000), but increases N2O
emission (Bronson et al., 1997). The overall balance
between the net exchanges of these gases constitutes
the GWPnet of a crop or livestock production system.
Global warming potential is calculated in units of CO2
equivalents by using molecular stoichiometry and
assuming that N2O and CH4 have 296 and 23 times,
respectively, the atmospheric radiative forcing of CO2
on a per mass basis (Albritton and Meira Filho, 2001).
Methane is produced mainly through enteric fermen-
tation in livestock and through the handling of animal
manure in anaerobic lagoon systems (Prather et al.,
1995). Saturated agricultural soils are emitters of CH4
and drained soils are small sinks for atmospheric CH4
(Prather et al., 1995). Nitrous oxide, a soil-derived
GHG second in importance to CO2, is produced
through microbial processes of nitrification and
denitrification (Conrad, 1996). Nitrogen fertilizer
input to facilitate crop production accentuates N2O
production (Bouwman et al., 2002b).
The main components of GWP from cropping
systems are soil N2O emission, plant/soil system CO2
flux, soil CH4 flux, and CO2 emission from
agricultural inputs and farm equipment operation.
Emission of CO2 from inputs and equipment operation
include: (1) fuel used by farm machinery to plant, till,
harvest, irrigate, and apply amendments and (2) fuel
used to produce and transport lime, fertilizer,
pesticides and herbicides (West and Marland, 2002).
For agriculture in the USA, N2O and CH4 emissions
contribute the greatest portion to the total GWPnet,
which is estimated at 120 Tg C yr�1 (Fig. 1).

S.J. Del Grosso et al. / Soil & Tillage Research 83 (2005) 9–2412
Fig. 1. Anthropogenic greenhouse gas fluxes ((+) emission and (�)
sink) in the USA for 2000 (USEPA, 2002). Fuel CO2 includes
manufacturing and transport of farm amendments and operating
farm machinery. GWPnet is net global warming potential.
Robertson et al. (2000) provided an example of the
impact of tillage on GWP in a rainfed crop production
system in Michigan (Fig. 2). Fuel use contributed most
to GWPnet followed by N2O. With 10 years of no-till
cropping, C was sequestered in soil at
0.30 Mg C ha�1 yr�1. Methane uptake by soil did
not differ between tillage systems and contributed
little to GWPnet. As a result of the no-till system
storing C and conventional till being roughly soil C
neutral, GWPnet was 0.31 Mg C ha�1 yr�1 in the
conventional till system and 0.04 Mg C ha�1 yr�1 in
the no-till system. However, as soils become saturated
in organic matter the benefit of no-till in terms of C
storage is likely to decrease.
Fig. 2. Effect of tillage on net global warming potential (GWPnet) in
a long-term corn-soybean study in Michigan (Robertson et al.,
2000). Fuel CO2 includes manufacturing and transport of farm
amendments and operating farm machinery. CT = conventional
tillage, NT = no tillage. Differences between CT and NT are sig-
nificant only for soil CO2 and GWP net.
Regional and national assessments of N2O for the
USA by process-based models are limited (Li et al.,
1996; Mummey et al., 1998) and no process-based
models have been used for national GWP calculations.
Marland et al. (2003) calculated the impact of
converting croplands from conventional to no tillage
on GWPnet, but N2O emission was calculated with a
high emission factor of 2 � 1% of applied N. The
daily version of the ecosystem, process-based CEN-
TURY model (DAYCENT) was developed to permit
more realistic analyses of trace gas (CO2, CH4
oxidation, N2O, and NO) exchange between the soil
and the atmosphere on a daily basis. Our objective was
to use DAYCENT to estimate N2O emission and
GWPnet for regional and national scales under these
situations: (1) recent modern agriculture; (2) pre-1940
management; (3) native vegetation. Net GWP includes
crop/soil system CO2 flux, N2O emission, CH4 uptake,
and fuel CO2 costs of farm machinery operation and
production and transport of farm inputs. Direct N2O
emission as well as indirect emission from NO3
leaching and NO emission, were calculated. The
major crop production systems within each region
were used and changes in crop production manage-
ment with time were included. Changes in fertilizer
input, crop rotation, crop cultivars, and tillage
intensity were the most notable. Estimates of N2O
emission were compared between DAYCENT and
IPCC (1997) emission factor (EF) methodology.
Using DAYCENT, we estimated national N2O
emission and GWPnet for major cropping systems in
the USA under conventional and no tillage.
2. Model descriptions and testing
DAYCENT is the daily time step version of the
CENTURY (Parton et al., 1994) biogeochemical
model. DAYCENT (Del Grosso et al., 2001; Parton
et al., 1998) simulates fluxes of C and N between the
atmosphere, vegetation, and soil. Plant growth is
controlled by nutrient availability, water, and tem-
perature. Nutrient supply is a function of soil organic
matter (SOM) decomposition and external nutrient
additions. Daily maximum/minimum temperature and
precipitation, timing and description of management
events (e.g. fertilization, tillage, harvest), and soil
texture data are needed as model inputs. Key

S.J. Del Grosso et al. / Soil & Tillage Research 83 (2005) 9–24 13
submodels include plant production, SOM decom-
position, soil water and temperature by layer,
nitrification and denitrification, and CH4 oxidation.
Recent improvements in DAYCENT include the effect
of solar radiation on plant growth rates, increased
precision in the scheduling of management events, and
the option of simulating seed germination as a
function of soil temperature and harvest or senescence
as a function of growing degree days accumulated
since germination. Comparison of model results and
plot data have shown that DAYCENT reliably
simulates crop yield, SOM levels, and trace gas flux
for various native and managed systems (Del Grosso
et al., 2002).
IPCC (1997) guidelines assume that 1.25% of
unvolatilized N inputs are lost from soil as direct N2O
emission, 10% of N applied is released as NO + NH3,
and 30% of applied N is leached or runs off into
groundwater or surface waters. N inputs for calculat-
ing direct N2O emission include fertilizer and organic
amendments, N fixation, and plant residue that were
not removed during harvesting. N input from N-fixing
crops [soybean (Glycine max (L.) Merr.), alfalfa
(Medicago sativa L.)] is 3% of total aboveground dry
matter production. Residue N input for wheat
(Triticum aestivum L.), corn (Zea mays L.), and
soybean is 0.62, 0.58 and 2.3%, respectively, of total
aboveground-unharvested dry matter. The US Envir-
onmental Protection Agency has not included the
IPCC background N2O emission in calculations for
the USA, because the goal of the inventory has been to
estimate anthropogenic emission. We included the
IPCC background N2O emission of 1 kg N2O–
Table 1
Characteristics of data used for model testing
Site Crops Components eval
Iowa A Corn, soybean Grain yield, NO3
Iowa B Fertilized fallow/soybean N2O
Wisconsin A Corn, potato Grain yield, NO3
Wisconsin B Corn Grain yield, NO3
Michigan A Alfalfa Grain yield, N2O
Michigan B Corn, soybean, wheat Hay yield, N2O
Nebraska Wheat/fallow Grain yield, N2O
Colorado A Wheat/fallow N2O
Colorado B Irrigated corn N2O
Colorado C Irrigated barley N2O
Tennessee No till corn N2O
Ontario Corn Grain yield, N2O
N ha�1 yr�1 for EF estimates, because both measure-
ments and DAYCENT simulations represent total N2O
emission. Indirect N2O emission was defined as the
sum of 1% of NOx + NH3 gases emitted and 2.5% of
NO3 leached to surface or ground waters.
An important difference between EF methodology
and DAYCENT relates to assumptions regarding N
cycling. EF assumes that N added to a system in one
year completely cycles during that year, e.g. N added
as fertilizer or through fixation contributes to N2O
emission for that year, but cannot be stored in soil or
biomass and be recycled and contribute to N2O
emission in subsequent years. In contrast, DAYCENT
includes legacy effects such that N added to the system
in 1 year may be taken up by vegetation and returned
to the soil in organic form during that year, then re-
mineralized and emitted as N2O in following years. In
addition to previous year’s fertilizer additions, other
long-term management practices that affect current
SOM level (e.g., intensive cultivation, summer fallow)
also affect current N2O emission, because in models
such as DAYCENT, N from internal cycling (miner-
alization of SOM) contributes to N2O emission. Thus,
while EF estimates are influenced only by the current
year’s N inputs, DAYCENT emissions are also
influenced by management in previous years. In the
broader context, empirical models such as EF
methodology, and process-based models such as
DAYCENT, have distinct advantages and disadvan-
tages. Empirical models use easy to acquire input data
(e.g., total N inputs to cropped land) and are easy to
apply, requiring only spreadsheet calculations. Pro-
cess-based models require more detailed inputs (e.g.,
uated Time Source
leaching 1996–1999 Jaynes et al. (2001)
1979 Bremner et al. (1981)
leaching 1993–1994 Stites and Kraft (2001)
leaching 1992–1993 Andraski et al. (2000)
1991–1999 Robertson et al. (2000)
1991–1999 Robertson et al. (2000)
1993–1995 Kessavalou et al. (1998)
1993–1995 Mosier et al. (1997)
1992 Mosier et al. (1986)
1993 Mosier et al. (1986)
1993 Thornton and Valente (1996)
1998 Grant and Pattey (2003)
S.J. Del Grosso et al. / Soil & Tillage Research 83 (2005) 9–2414
crop specific N input rates) and large amounts of
computing time and programming expertise. Process-
based models can potentially yield more reliable
results, because they account for more of the key
controls, but results are limited by the quality of input
data and resources available for model evaluation and
application.
A variety of field data were used for model
validation of N2O emission, NO3 leaching, and crop
yield (Table 1). Land management and soil data
required for model inputs were from references in
Table 1, while daily weather data needed to drive
DAYCENT were obtained from the authors or from
weather stations close to the test sites. Input
parameters controlling crop growth rates, NO3
solubility, etc. were consistent for all the sites used
for model testing. The only model inputs changed for
different simulations were climate, soil physical
properties, crop rotation, and land management
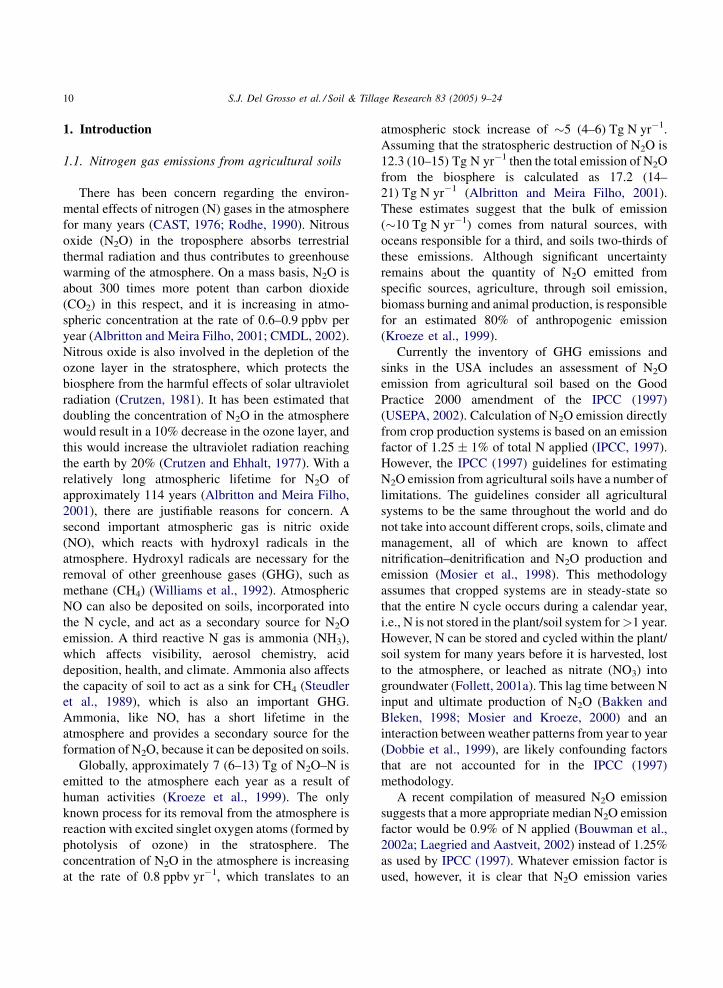
Fig. 3. Comparison of measured, DAYCENT-simulated, and IPCC emis
leaching, and (c) crop yield for sites described in Table 1.
schedules. Results in Fig. 3 are means for all years
and treatments reported in Table 1. Measured and
simulated output were evaluated using coefficient of
determination (r2), root mean square error (rmse), bias
and deviation. Bias was defined as the tendency for
model output to overestimate low values and under-
estimate high values. Bias was quantified by linear
regression of simulated versus measured values. Bias
was small when slope was near 1 and intercept was
near 0. Deviation was calculated as the difference
between simulated and measured values divided by
the measured value.
Both models captured major differences, but EF
over-estimated mean N2O for sites with low emission
and both models under-estimated N2O for two sites
with high emission (Fig. 3a). DAYCENT was within
33% of measured values for all data sets except
Colorado C. Across sites, DAYCENT under-estimated
N2O emission by 6% and EF methodology over-
sion factor (EF)-estimated (a) direct soil N2O emission, (b) NO3

S.J. Del Grosso et al. / Soil & Tillage Research 83 (2005) 9–24 15
estimated emission by 13%. Fig. 4a shows simulated
versus measured N2O emission for the different soils
and treatments (n = 21) represented in Fig. 3a.
Regressions indicated that EF was more biased than
DAYCENT.
Nitrate leaching was estimated with maximum
deviation <30% using DAYCENT, but under-esti-
mated by �50% at two of the three sites using EF
(Fig. 3b). Regression of simulated versus measured
NO3 leaching indicated that DAYCENT had little bias,
but EF under-estimated large values (Fig. 4b). The EF
underestimate of NO3 leaching may have been in part
due to the fact that only N from fertilizer and manure
were considered available for leaching, while DAY-
CENT considered the N derived from crop N-fixation
as well. Crop yield was relatively accurate when
predicted by DAYCENT (Fig. 3c, r2 = 0.90, maximum
deviation = 22%, rmse = 13%).
Fig. 4. Relationship of measured, DAYCENT-simulated, and IPCC
emission factor (EF)-estimated (a) N2O emission and (b) NO3
leaching for different conditions for the sites listed in Table 1.
3. Regional simulations
The contiguous USA was divided into 63 minor
agricultural regions as used by the Agricultural Sector
Model (McCarl et al., 1993). Each state in the
contiguous USA coincided with a minor region,
except that some states were divided into two or more
minor regions. The 63 minor regions were combined
into five major agricultural regions. Table 2 defines the
regions and describes major crops and areas in each.
Climate, soil, and land management data required to
run DAYCENT at the minor regional scale were
Table 2
Regional characteristics of DAYCENT simulations
Major regions Minor regions Crops simulated Crop area simulated
(Mha)
Northeast WI, MI, NY, VT, NH, ME,
RI, CT, MA, NJ, DE
Hay, corn, soybean 7.2
Central PA, WV, KY, TN, OH (3 zones),
IN (2 zones), IL (2 zones),
IA (4 zones) MO, MN
Corn, soybean, hay 47
Southeast VA, MD, NC, SC, GA, FL, AL,
MS, LA, AR
Corn, soybean, hay, rice, cotton 11
Southwest OK, TX (8 zones), NM, AZ, UT,
NV, CA (2 zones)
Corn, soybean, hay, rice, cotton,
wheat, sorghum
18.6
Northwest KS, NE, SD, ND, CO, WY, MT,
ID, OR, WA
Corn, soybean, hay, wheat, barley 39.4

S.J. Del Grosso et al. / Soil & Tillage Research 83 (2005) 9–2416
acquired from different sources. We used the Erosion-
Productivity Impact Calculator (EPIC; Sharpley and
Williams, 1990) model to obtain soil texture
classifications and 100 years of daily climate for
each minor region. Climate from EPIC was computer
generated, but constrained by actual climate. The data
set did not reflect any long-term changes in climate.
Soil physical properties needed for model input were
calculated from texture class and a hydraulic property
calculator (http://www.bsyse.wsu.edu/saxton/soil-
water/; Saxton et al., 1986). Land management data
for each minor region were compiled using modern
and historical records of crop yield, area, and inputs.
Native vegetation for each minor region was assumed
to be the potential vegetation from VEMAP (1995).
Crop area and yield data were downloaded from the
web site of the National Agricultural Statistics Service
of the United States Department of Agriculture (http://
www.nass.usda.gov:81/ipedb/).
Four sets of simulations were performed for each
minor region: (1) native vegetation (year 1 to plow
out); (2) historical agricultural practices (plow out to
1970); (3) modern agriculture (1971–2000) with
conventional tillage; (4) modern agriculture (1971–
2000) with no tillage. The 100-year cycle of computer-
generated modern climate was repeated to drive native
and historical simulations. Climate did not reflect
long-term climate change, but did contain inter-annual
variability. Plow out was assumed to occur between
1601 and 1850, depending on minor region. Simula-
tion of at least 1600 years of native vegetation was
needed to initialize SOM pools and to provide baseline
GHG flux levels to compare with agriculture.
Simulation of plow out and historical cropping were
needed to assess GHG fluxes for pre-1940 agriculture
and to establish modern SOM levels. Simulations for
modern agriculture (1971–2000) included a sufficient
number of crop rotations so that �80% of the reported
crop area in most minor regions was represented. For
example in Vermont, it was necessary to simulate hay
and corn, while in Louisiana, corn, soybean, and
cotton had to be included to cover �80% of the
cropped area. In some states (e.g., Florida), crops
simulated were <80% of total cropped area. For multi-
year rotations (e.g. corn/soybean, wheat/corn/fallow),
different simulations were performed where the initial
crop was varied but the sequence was not altered to
ensure that each crop was represented each year. In
cases where the same crop was grown in the same year
in two or more distinct rotations for a minor region,
average values for each output were calculated.
Simulations assumed conventional tillage until
1970, gradual improvement of cultivars, and gradual
increases in fertilizer application. Post 1970 organic N
amendments were not included, because EPIC, on
which DAYCENT runs were based, did not include
organic amendments. The model was not tuned for
different minor regions, i.e. the same parameters used
for the model validation described in the previous
section were used for the regional simulations. We did
not include cropping of histosols, which could be a
strong N2O source, and simulated only corn, soybean,
wheat, alfalfa and cotton cropping systems.
Ten years of model output were compiled for each
minor region for native condition (1591–1600), pre-
940 management (1921–1930), and modern agricul-
ture under conventional- and no-tillage management
(1991–2000). Annual mean and standard deviation for
each output variable were calculated. Climate data
used to run the model did not reflect real-time changes
in climate, so differences in means for the four
scenarios were due entirely to changes in vegetation
and land management. Standard deviations were
driven by inter-annual variability in climate data.
Model outputs were crop yield, net system CO2 flux,
direct N2O emission from soil, NO3 leaching, NH3
volatilization, NO emission, and CH4 oxidation. Net
system CO2 flux integrated C fixed by photosynthesis
in vegetation, litter, and soil and C lost through
respiration from litter and SOM. Results from
simulations of the 63 minor regions were summed
to obtain major regional and national totals. Using EF
methodology, N inputs from fertilizer, crop residue,
and N fixation were identical to those used to run
DAYCENT. The EF background direct N2O flux of
1 kg N2O–N ha�1 yr�1 was also included to be
consistent with site-level comparisons and because
DAYCENT simulated total N2O flux. For both
DAYCENT and EF, indirect N2O emission was
calculated by assuming that 2.5% of NO3 leached
was emitted as N2O from aquatic denitrification and
that 1% of NOx and NH3 emissions was deposited and
converted to N2O in soils. Raw DAYCENT output on a
per area basis and cumulative regional area for
different crops were multiplied to estimate total
annual emissions for the major regions and crops.
S.J. Del Grosso et al. / Soil & Tillage Research 83 (2005) 9–24 17
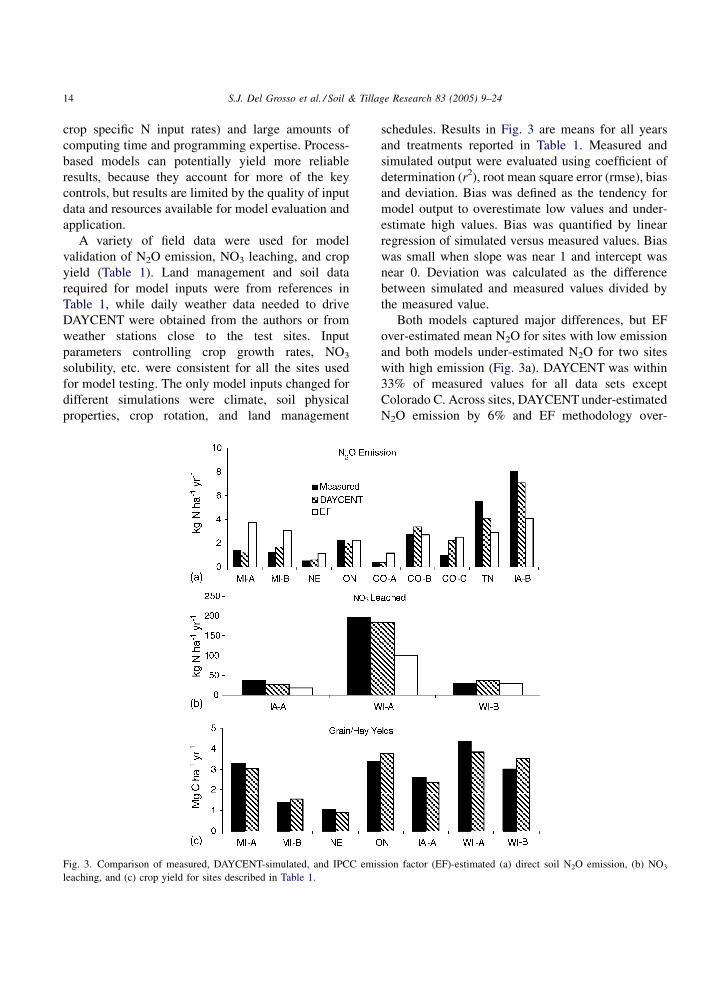
Fig. 5. Comparisons of measured and DAYCENT-simulated (a)
state and (b) regional level crop yields in the USA.
Fig. 6. Comparison of IPCC emission factor (EF)- and DAYCENT-
simulated (a) direct, (b) indirect, and (c) total N2O emissions for
major agricultural regions in the USA. Results are for major crops
(corn, soybean wheat, alfalfa, cotton) based on 10-year mean and
standard deviation in units of CO2–C equivalents.
4. Regional N2O emission and GWPnet
DAYCENT satisfactorily (r2 = 0.66, rmse = 39%)
simulated measured state-average crop yields
(Fig. 5a). Total yield for each major region was
simulated very well (regional r2 = 0.99, rmse = 7%)
by the model (Fig. 5b). Within major regions,
DAYCENT generally simulated lower direct and
higher indirect N2O emissions than EF (Fig. 6). Both
methods had the same relative ranking of N2O
emission from the five major regions, i.e., direct
and total N2O emissions were highest in central,
intermediate in northwest, southwest, and southeast,
and lowest in northeast. This ranking reflected the
cumulative agricultural area of each region (Table 2).
Standard deviations were relatively small for direct
and total N2O emissions, but large for indirect N2O
emission. Large variation in indirect N2O emission
was probably a result of NO3 leaching being a
significant component that has a non-linear response
to precipitation amount and distribution. Large
precipitation events over a short time period would
be necessary for significant NO3 leaching to occur.
Simulations sorted by crop-highlighted differences
between DAYCENT and EF methodology (Fig. 7).
Both methods estimated similar direct N2O emission
for fertilized crops (corn, cotton, wheat), but DAY-
CENT simulated lower direct N2O emission than EF
for N-fixing crops (alfalfa, soybean) (Fig. 7a). EF
methodology assumes that 1 kg N2O–N ha�1 yr�1
S.J. Del Grosso et al. / Soil & Tillage Research 83 (2005) 9–2418
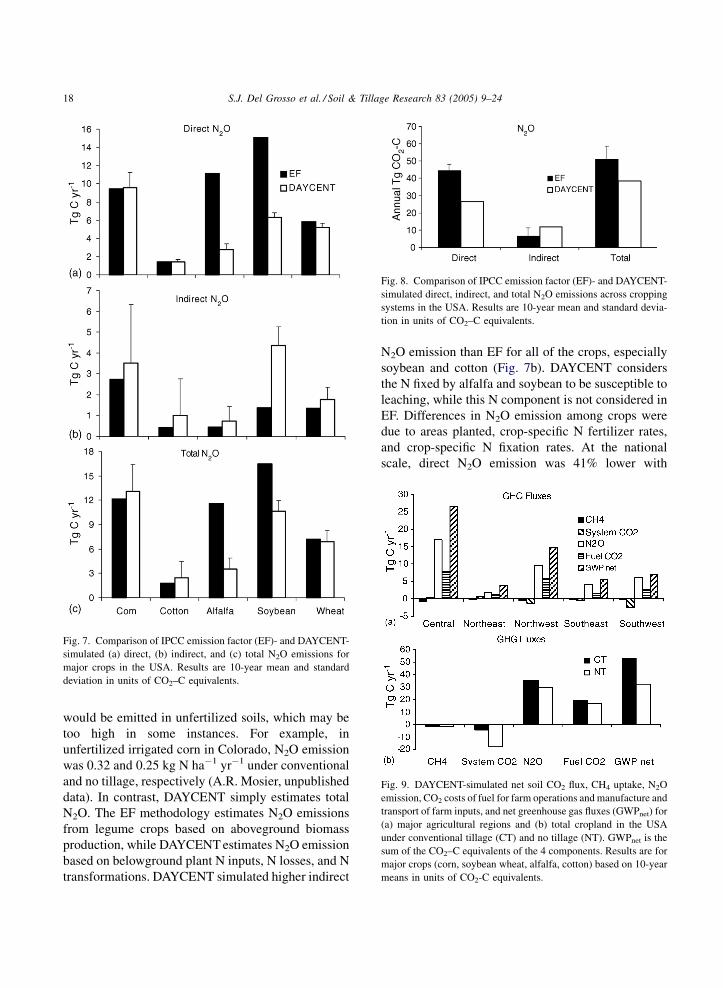
Fig. 7. Comparison of IPCC emission factor (EF)- and DAYCENT-
simulated (a) direct, (b) indirect, and (c) total N2O emissions for
major crops in the USA. Results are 10-year mean and standard
deviation in units of CO2–C equivalents.
Fig. 8. Comparison of IPCC emission factor (EF)- and DAYCENT-
simulated direct, indirect, and total N2O emissions across cropping
systems in the USA. Results are 10-year mean and standard devia-
tion in units of CO2–C equivalents.
Fig. 9. DAYCENT-simulated net soil CO2 flux, CH4 uptake, N2O
emission, CO2 costs of fuel for farm operations and manufacture and
transport of farm inputs, and net greenhouse gas fluxes (GWPnet) for
(a) major agricultural regions and (b) total cropland in the USA
under conventional tillage (CT) and no tillage (NT). GWPnet is the
sum of the CO2–C equivalents of the 4 components. Results are for
major crops (corn, soybean wheat, alfalfa, cotton) based on 10-year
means in units of CO2-C equivalents.
would be emitted in unfertilized soils, which may be
too high in some instances. For example, in
unfertilized irrigated corn in Colorado, N2O emission
was 0.32 and 0.25 kg N ha�1 yr�1 under conventional
and no tillage, respectively (A.R. Mosier, unpublished
data). In contrast, DAYCENT simply estimates total
N2O. The EF methodology estimates N2O emissions
from legume crops based on aboveground biomass
production, while DAYCENT estimates N2O emission
based on belowground plant N inputs, N losses, and N
transformations. DAYCENT simulated higher indirect
N2O emission than EF for all of the crops, especially
soybean and cotton (Fig. 7b). DAYCENT considers
the N fixed by alfalfa and soybean to be susceptible to
leaching, while this N component is not considered in
EF. Differences in N2O emission among crops were
due to areas planted, crop-specific N fertilizer rates,
and crop-specific N fixation rates. At the national
scale, direct N2O emission was 41% lower with

S.J. Del Grosso et al. / Soil & Tillage Research 83 (2005) 9–24 19
Fig. 10. DAYCENT-simulated (a) direct, (b) indirect, and (c) total
N2O emissions for modern cropping, pre-1940 management, and
native vegetation in the USA. Results are based on10-year means in
units of CO2–C equivalents.
Fig. 11. DAYCENT-simulated net system CO2 flux, CH4 uptake,
N2O emission, CO2 cost of fuel for farm operations and manufacture
and transport of farm inputs, and net greenhouse gas fluxes (GWPnet)
for modern cropping under conventional tillage (CT), modern
cropping under no tillage (NT), pre-1940 management, and native
vegetation in the USA. GWPnet is the sum of the CO2-C equivalents
of the four components. Values are 10-year means in units of CO2–C
equivalents.
DAYCENT than EF and indirect N2O emission was
�80% higher than EF (Fig. 8).
Net GWP varied among major regions due
primarily to areas of cropping (Fig. 9a). N2O emission
was the major contributor to GWPnet in all major
regions followed by fuel CO2. Estimates of fuel CO2
costs for corn, soybean, cotton, and wheat were
derived from West and Marland (2002) and alfalfa fuel
costs were assumed to be identical to soybean. Net
system CO2 flux was a sink in the southwest and a
source in the northeast. Agriculture in the southwest
was historically dominated by low C input dryland
cropping, but increases in irrigation has led to high C
input cropping in recent years to shift the region to a C
sink. All regions were a minor sink for CH4. The
central region, which includes the majority of corn and
soybean cropping in the USA, had the highest N2O
emission and GWPnet.
At a national level, DAYCENT simulated net
system CO2 flux as a minor sink under conventional
tillage and a strong sink under no tillage (Fig. 9b).
Agricultural soils were also a minor sink for CH4. Both
N2O emission and fuel CO2 were primary contributors
to agricultural systems in the USA acting as sources of
GWPnet. Net GWP under no tillage was �33% lower
than under conventional tillage, due to stronger net
system CO2 sink and slightly lower N2O emission and
fuel CO2 costs (Fig. 9b).
Comparisons of modern agriculture with historical
management were presented on a per area basis,
because estimates of agricultural land area before
�1950 were not considered reliable. In all regions,
modern agricultural soils had higher direct N2O
emission than pre-industrial agricultural systems
(Fig. 10). Modern agricultural N2O emission was
>2 times that of pre-1940 management and �6 times
that of native vegetation (Fig. 11). Modern agriculture
was either a minor or strong sink for net system CO2
depending upon tillage, while pre-industrial cropping
was a strong source, and native vegetation was a sink
(Fig. 11). Native soils were the largest CH4 sink and
S.J. Del Grosso et al. / Soil & Tillage Research 83 (2005) 9–2420
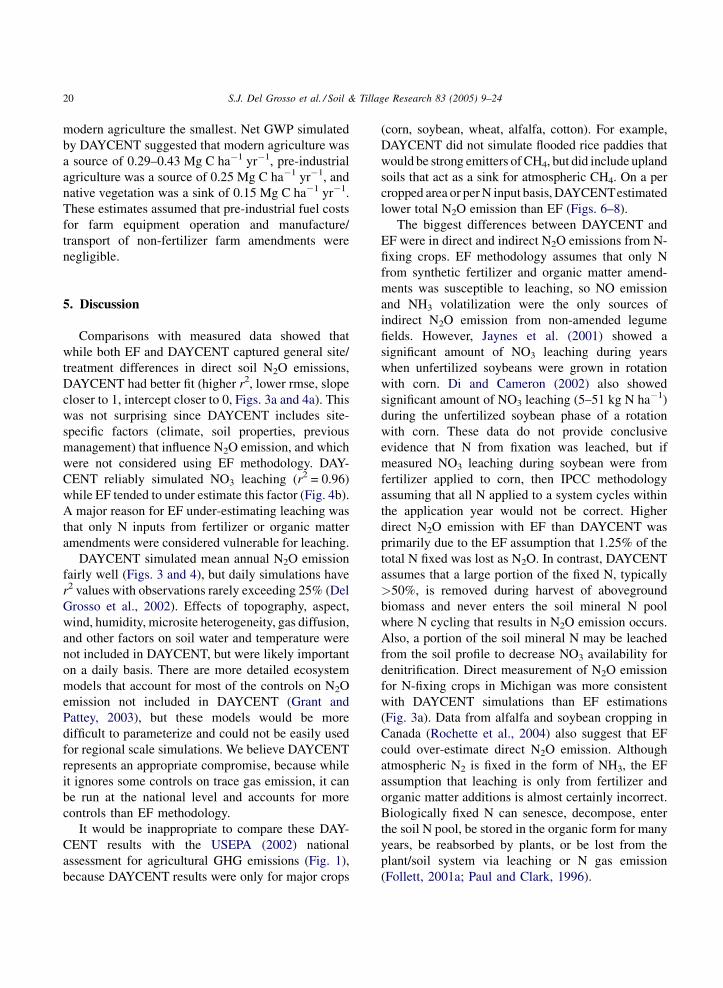
modern agriculture the smallest. Net GWP simulated
by DAYCENT suggested that modern agriculture was
a source of 0.29–0.43 Mg C ha�1 yr�1, pre-industrial
agriculture was a source of 0.25 Mg C ha�1 yr�1, and
native vegetation was a sink of 0.15 Mg C ha�1 yr�1.
These estimates assumed that pre-industrial fuel costs
for farm equipment operation and manufacture/
transport of non-fertilizer farm amendments were
negligible.
5. Discussion
Comparisons with measured data showed that
while both EF and DAYCENT captured general site/
treatment differences in direct soil N2O emissions,
DAYCENT had better fit (higher r2, lower rmse, slope
closer to 1, intercept closer to 0, Figs. 3a and 4a). This
was not surprising since DAYCENT includes site-
specific factors (climate, soil properties, previous
management) that influence N2O emission, and which
were not considered using EF methodology. DAY-
CENT reliably simulated NO3 leaching (r2 = 0.96)
while EF tended to under estimate this factor (Fig. 4b).
A major reason for EF under-estimating leaching was
that only N inputs from fertilizer or organic matter
amendments were considered vulnerable for leaching.
DAYCENT simulated mean annual N2O emission
fairly well (Figs. 3 and 4), but daily simulations have
r2 values with observations rarely exceeding 25% (Del
Grosso et al., 2002). Effects of topography, aspect,
wind, humidity, microsite heterogeneity, gas diffusion,
and other factors on soil water and temperature were
not included in DAYCENT, but were likely important
on a daily basis. There are more detailed ecosystem
models that account for most of the controls on N2O
emission not included in DAYCENT (Grant and
Pattey, 2003), but these models would be more
difficult to parameterize and could not be easily used
for regional scale simulations. We believe DAYCENT
represents an appropriate compromise, because while
it ignores some controls on trace gas emission, it can
be run at the national level and accounts for more
controls than EF methodology.
It would be inappropriate to compare these DAY-
CENT results with the USEPA (2002) national
assessment for agricultural GHG emissions (Fig. 1),
because DAYCENT results were only for major crops
(corn, soybean, wheat, alfalfa, cotton). For example,
DAYCENT did not simulate flooded rice paddies that
would be strong emitters of CH4, but did include upland
soils that act as a sink for atmospheric CH4. On a per
cropped area or per N input basis, DAYCENTestimated
lower total N2O emission than EF (Figs. 6–8).
The biggest differences between DAYCENT and
EF were in direct and indirect N2O emissions from N-
fixing crops. EF methodology assumes that only N
from synthetic fertilizer and organic matter amend-
ments was susceptible to leaching, so NO emission
and NH3 volatilization were the only sources of
indirect N2O emission from non-amended legume
fields. However, Jaynes et al. (2001) showed a
significant amount of NO3 leaching during years
when unfertilized soybeans were grown in rotation
with corn. Di and Cameron (2002) also showed
significant amount of NO3 leaching (5–51 kg N ha�1)
during the unfertilized soybean phase of a rotation
with corn. These data do not provide conclusive
evidence that N from fixation was leached, but if
measured NO3 leaching during soybean were from
fertilizer applied to corn, then IPCC methodology
assuming that all N applied to a system cycles within
the application year would not be correct. Higher
direct N2O emission with EF than DAYCENT was
primarily due to the EF assumption that 1.25% of the
total N fixed was lost as N2O. In contrast, DAYCENT
assumes that a large portion of the fixed N, typically
>50%, is removed during harvest of aboveground
biomass and never enters the soil mineral N pool
where N cycling that results in N2O emission occurs.
Also, a portion of the soil mineral N may be leached
from the soil profile to decrease NO3 availability for
denitrification. Direct measurement of N2O emission
for N-fixing crops in Michigan was more consistent
with DAYCENT simulations than EF estimations
(Fig. 3a). Data from alfalfa and soybean cropping in
Canada (Rochette et al., 2004) also suggest that EF
could over-estimate direct N2O emission. Although
atmospheric N2 is fixed in the form of NH3, the EF
assumption that leaching is only from fertilizer and
organic matter additions is almost certainly incorrect.
Biologically fixed N can senesce, decompose, enter
the soil N pool, be stored in the organic form for many
years, be reabsorbed by plants, or be lost from the
plant/soil system via leaching or N gas emission
(Follett, 2001a; Paul and Clark, 1996).
S.J. Del Grosso et al. / Soil & Tillage Research 83 (2005) 9–24 21
Although GWPnet was higher for modern agricul-
ture than pre-1940 management on a per area basis, on
a per yield basis modern emission could likely be
lower, because yield has more than doubled with
modern cropping. In contrast to other regions, direct
N2O emission was lower for pre-1940 management
than native vegetation in the southeast, because soils
were depleted in SOM from cotton cultivation
beginning in the 1700s. Excessive tillage and low C
input to soil with pre-industrial cotton production
resulted in SOM depletion, and subsequently lower
N2O emission. Indirect N2O emission was lower for
modern agriculture than pre-1940 management in the
southwest, because of the extent of irrigation. Higher
soil water content with irrigation increased N2O
emission and decreased NO emission. NO is an
important component of indirect N2O emission in the
southwest, because rainfall would not be sufficient to
leach NO3. Pre-1940 management was a strong net
system CO2 source (Fig. 11), because soils were
extensively plowed and relatively primitive cultivars
supplied low C inputs to the system. CH4 uptake was
highest for native vegetation, because conversion to
cropping generally inhibits the ability of soils to
oxidize CH4 (Bronson and Mosier, 1993). Modern
agriculture had less CH4 uptake than pre-1940
management, because irrigation increased and as soil
water content increases, CH4 diffusion from the
atmosphere to the soil decreases (Del Grosso et al.,
2000).
Differences in N2O emission simulated by DAY-
CENTand estimated by EF varied among regions. This
was related to the dominance of different crops in
major regions and the large disagreement between the
two methods for N-fixing crops (Fig. 7). Since soybean
and alfalfa were a smaller proportion of total crop area
in the southwest compared to most other major regions,
DAYCENT and EF produced similar results. Indirect
N2O emission with DAYCENT was higher than with
EF in all regions except the southwest, because
leaching was expected to form a larger proportion of
indirect emission with high rainfall.
Consideration of the form of N losses from a
system helps explain why EF had higher total N2O
emission than DAYCENT. The sum of direct N2O,
NO, NH3, and NO3 leaching was approximately equal
for both models. Compared to EF, DAYCENT
estimated lower direct N2O emission and higher
NO3 leaching, particularly for legumes. Only 2.5% of
NO3 leached was assumed to contribute to indirect
N2O emission, so higher NO3 leaching and less direct
N2O emissions led to lower total N2O emissions for
DAYCENT. The other major reason for higher direct
N2O emission for EF was background N2O emission
of 1 kg N2O–N ha�1, which was likely too high for at
least some crops.
6. Conclusions and future work
DAYCENT reliably simulated direct N2O emission
and NO3 leading, but EF did not. DAYCENT also
simulated state-level crop yields reasonably well
(r2 = 66%, rmse = 39%). Errors may have been
created by using coarse-scale climate and soil
conditions. A large discrepancy occurred between
EF and DAYCENT for N losses from N-fixing crops
due to different assumptions. Limited observations of
N2O emission and NO3 leaching suggest that EF may
over-estimate direct N2O emission and underestimate
NO3 leaching from legumes, although more data are
needed before definitive conclusions can be drawn.
The current national N2O assessment in the USA
considers N inputs and crops grown for single years in
isolation. However, there is evidence that previous
year’s cropping influences subsequent year’s N2O
emission. For example, N2O emission was higher from
irrigated corn following soybean than from corn
grown continuously, even though fertilizer input for
corn was identical (A.R. Mosier, unpublished data).
This evidence supports the suggestion by Bakken and
Bleken (1998) that N2O emission factors should be
based on multiple years and not based on the
assumption that the N that is applied to a system in
one year is entirely cycled during that year. DAY-
CENT and other process-based models could account
for the effects of previous land use on any given year’s
N2O emission by allowing for N storage in biomass,
litter, SOM, and mineral soil N. However, agricultural
statistics in the USA typically quantify areas for
different crops in isolation, not accounting for crop
rotations. Availability of rotation-based crop area
would provide an opportunity to increase confidence
in estimated N2O emission.
DAYCENT simulations of national GWPnet fluxes
from major crops in the USA were limited by the use

S.J. Del Grosso et al. / Soil & Tillage Research 83 (2005) 9–2422
of coarse spatial-scale (state or sub-state level)
computer-generated daily climate and coarse spa-
tial-scale soil data. Further DAYCENT simulations
using county-level data (including manure inputs)
need to be conducted. Real-time county-level climate
and county level soils data should improve model
agreement with measured crop yield and increase
confidence in DAYCENT-simulated GWPnet esti-
mates. Future simulations should cover more cropped
area, include pastures, and determine effects of
precision fertilizer application on GWPnet. Methodol-
ogies to quantify confidence intervals similar to those
presented by Ogle et al. (2003) need to be developed
and applied to means simulated by DAYCENT.
Acknowledgements
The research for this paper was supported by the
USA Environmental Protection Agency (EPA Project
#TGC04), The National Institute of Child Health and
Human Development (#1 R01 HD33554), and through
funds provided by the Cooperative State Research,
Education, and Extension Service, USA Department
of Agriculture, (Agreement #2001-38700-11092) to
the Consortium for Agricultural Soils Mitigation of
Greenhouse Gases (CASMGS).
References
Albritton, D.L. and L.G. Meira Filho, 2001. Technical Summary. In:
Houghton, J.I., Ding, Y., Griggs, D.J., Nogur, M., van der
Linden, P.J., Dai, X., Maskell, K., Johnson, C.A. (Eds.), Climate
Change 2001: The Scientific Basis. Contribution of Working
Group I to the Third Assessment Report of the Intergovern-
mental Panel on Climate Change Cambridge University Press.
Cambridge, United Kingdom and New York, USA, pp 21–83.
Andraski, T.W., Bundy, L.G., Brye, K.R., 2000. Crop management
and corn nitrogen rate effects on nitrate leaching. J. Environ.
Qual. 29, 1095–1103.
Bakken, L.R., Bleken, M.A., 1998. Temporal aspects of N-enrich-
ment and emission of N2O to the atmosphere. Nutr. Cycl.
Agroecost. 52, 107–212.
Bouwman, A.F., Boumans, L.J.M., Batjes, N.H., 2002a. Modeling
global N2O and NO emissions from fertilized fields.. Glob.
Biogeochem. Cycles 16 10.1029/2001GB001812.
Bouwman, A.F., Boumans, L.J.M., Batjes, N.H., 2002b. Emissions
of N2O and NO from fertilized fields: Summary of available
measurement data.. Glob. Biogeochem. Cycles 16 10.1029/
2001GB001811.
Bremner, J.M., Breitenbeck, G.A., Blackmer, A.M., 1981. Effect of
anhydrous ammonia fertilization on emission of nitrous oxide
from soils. J. Environ. Qual. 10, 77–80.
Bronson, K.F., Mosier, A.R., 1993. Nitrous oxide emissions and
methane consumption in wheat and corn-cropped systems in
Northeastern Colorado. In: Harper, L.A., Mosier, A.R., Dux-
bury, J.M., Rolston, D.E. (Eds.), Agricultural Ecosystem Effects
on Trace Gases and Global Climate Change, ASA Special
Publication 55. Am. Soc. Agron., Madison, WI, pp. 133–144.
Bronson, K.F., Neue, H.U., Singh, U., Abao Jr., E.B., 1997. Auto-
mated chamber measurements of methane and nitrous oxide in a
flooded rice soil. I. Residue, nitrogen and water management.
Soil Sci. Soc. Am. J. 61, 981–987.
CAST (Council for Agricultural Science and Technology), 1976.
Effect of increased nitrogen fixationon stratospheric ozone.
Report 53. Iowa State University, Ames, Iowa.
Clayton, H., McTaggart, I.P., Parker, J., Swan, L., Smith, K.A., 1997.
Nitrous oxide Emissions from fertilized grassland: a 2-year
study of the effects of N fertilizer form and environmental
conditions. Biol. Fertil. Soils 25, 252–260.
CMDL, 2002. Climate Monitoring and Diagnostic Laboratory
(CMDL) of the National Oceanographic and Atmospheric
Administration, Boulder, CO, USA. N2O data from: http://
ftp.cmdl.noaa.gov/hats/n2o/insituGcs/global/.
Conrad, R., 1996. Soil microorganisms as controllers of atmospheric
trace gases (H2, CO, CH4, OCS, N2O, and NO). Microbiol. Rev.
60, 609–640.
Crutzen, P.J., 1981. Atmospheric chemical processes of the
oxides of nitrogen including nitrous oxide. In: Delwiche, C.C.
(Ed.), Denitrification, Nitrification and Atmospheric Nitrous
Oxide. Wiley, New York, pp. 17–44.
Crutzen, P.J., Ehhalt, D.H., 1977. Effects of nitrogen fertilizers and
combustion on the stratospheric ozone layer. Ambio 6, 112–
117.
Del Grosso, S.J., Parton, W.J., Mosier, A.R., Ojima, D.S., Potter,
C.S., Borken, W., Brumme, R., Butterbach-Bahl, K., Crill, P.M.,
Dobbie, K., Smith, K.A., 2000. General CH4 oxidation model
and comparisons of CH4 oxidation in natural and managed
systems. Glob. Biogeochem. Cycles 14, 999–1019.
Del Grosso, S.J., Parton, W.J., Mosier, A.R., Hartman, M.D.,
Brenner, J., Ojima, D.S., Schimel, D.S., 2001. Simulated inter-
action of carbon dynamics and nitrogen trace gas fluxes using
the DAYCENT model. In: Schaffer, M., Ma, L., Hansen, S.
(Eds.), Modeling Carbon and Nitrogen Dynamics for Soil
Management.. CRC Press, Boca Raton, Florida, pp. 303–332.
Del Grosso, S.J., Ojima, D.S., Parton, W.J., Mosier, A.R., Peterson,
G.A., Schimel, D.S., 2002. Simulated effects of dryland crop-
ping intensification on soil organic matter and greenhouse gas
exchanges using the DAYCENT ecosystem model. Environ.
Pollut. 116, S75–S83.
Di, H.J., Cameron, K.C., 2002. Nitrate leaching in temperate
agroecosystems: sources, factors and mitigating strategies. Nutr.
Cycl. Agroecosyst. 46, 237–256.
Dobbie, K.E., McTaggart, I.P., Smith, K.A., 1999. Nitrous oxide
emissions from intensive agricultural systems: variations
between crops and seasons, key driving variables, and mean
emission factors. J. Geophys. Res. 104, 26891–26899.
S.J. Del Grosso et al. / Soil & Tillage Research 83 (2005) 9–24 23
Follett, R.F., 2001a. Nitrogen transformation and transport pro-
cesses. In: Follett, R.F., Hatfield, M.J. (Eds.), Nitrogen in the
Environment. Elsevier, Amsterdam, The Netherlands, pp. 17–
44.
Follett, R.F., 2001b. Soil management concepts and carbon seques-
tration in cropland soils. Soil Till. Res. 61, 77–92.
Grant, P.F., Pattey, E., 2003. Modeling variability in N2O emissions
from fertilized agricultural fields. Soil Biol. Biochem. 35, 225–
243.
Groffman, P.M., Gold, A.J., Addy, K., 2000. Nitrous oxide produc-
tion in riparian zones and its importance to national emission
inventories. Chemosphere-Glob. Chang. Sci. 2, 291–300.
Groffman, P.M., Gold, A.J., Kellogg, D.Q., Addy, K., 2002. Nitrous
oxide emissions derived from N leaching. In: Petersen, S.O.,
Olesen, J.E., (Eds.), DIAS Report, Plant Production no 81,
October 2002. Greenhouse Gas Inventories for Agriculture in
the Nordic Countries. Danish Ministry of Food, Agriculture and
Fisheries, pp. 143–155.
IPCC, 1997. Intergovernmental panel on climate change guidelines
for national greenhouse gas inventories. In: Agriculture: Nitrous
Oxide from Agricultural Soils and Manure Management,
OECD, Paris (Chapter 4).
Jaynes, D.B., Colvin, T.S., Karlen, D.L., Cambardella, C.A., Meek,
D.W., 2001. Nitrate loss in subsurface draining as affected by
nitrogen fertilizer rate. J. Environ. Qual. 30, 1305–1314.
Kaiser, E.A., Kohrs, K., Kueche, M., Schnug, E., Munch, J.C.,
Heinemeyer, O., 1998. Nitrous oxide release from arable soil:
Importance of N-fertilization, crops and temporal variation. Soil
Biol. Biochem. 30, 1553–1563.
Kessavalou, A., Mosier, A.R., Doran, J.W., Drijber, R.A., Lyon,
D.L., Heinemeyer, O., 1998. Fluxes of carbon dioxide, nitrous
oxide, and methane in grass sod and winter wheat-fallow tillage
management. J. Environ. Qual. 27, 1094–1104.
Kroeze, C., Mosier, A.R., Bouwman, A.F., 1999. Closing the global
N2O budget: a retrospective analysis 1500–1994. Glob. Biogeo-
chem. Cycles 13, 1–8.
Laegried, M., Aastveit, A.H., 2002. Nitrous oxide emissions from
field-applied fertilizers. In: Petersen, S.O., Olesen, J.E., (Eds.),
DIAS Report, Plant Production no. 81, October 2002. Green-
house Gas Inventories for Agriculture in the Nordic Countries.
Danish Ministry of Food, Agriculture and Fisheries, pp. 122–134.
Lal, R., 2004. Soil carbon sequestration impacts on global climate
change and food security. Science 304, 1623–1627.
Li, C., Narayanan, V., Harris, R.C., 1996. Model estimates of nitrous
oxide emissions from agricultural lands in the United States.
Glob. Biogeochem. Cycles 10, 297–306.
Lim, B., Boileau, P., Bonduki, Y., van Amstel, A.R., Janssen,
L.H.J.M., Oliveier, J.G.J., Kroeze, C., 1999. Improving the
quality of national greenhouse gas inventories. Environ. Sci.
Policy 2, 335–346.
Marland, G., West, T.O., Schlamadinger, B., Canella, L., 2003.
Managing soil organic carbon in agriculture: the net effect on
greenhouse gas emissions.. Tellus 55B, 613–621.
McCarl, B.A., Chang, C.C., Atwood, J.D., Nayda, W.I., 1993.
Documentation of ASM: The US Agricultural Sector Model,
Technical Report TR-93. Agricultural Experimental Station,
College Station, Texas.
Mosier, A.R., Guenzi, W.D., Schweizer, E.E., 1986. Soil losses of
dinitrogen and nitrous oxide from irrigated crops in northeastern
Colorado. Soil Sci. Soc. Am. J. 50, 344–348.
Mosier, A.R., Parton, W.J., Valentine, D.W., Ojima, D.S., Schimel,
D.S., Hienemeyer, O., 1997. N2O and CH4 fluxes in the Color-
ado shortgrass steppe: 2. Long-term impact of land use change.
Glob. Biogeochem. Cycles 11, 29–42.
Mosier, A.R., Kroeze, C., Nevison, C., Oenema, O., Seitzinger, S.,
van Cleemput, O., 1998. Closing the global atmospheric N2O
budget: nitrous oxide emissions through the agricultural nitrogen
cycle. Nutr. Cycl. Agroecosyst. 52, 225–248.
Mosier, A., Kroeze, C., Nevison, C., Oenema, O., Seitzinger, S., van
Cleemput, O., 1999. An overview of the revised 1996 IPCC
guidelines for national greenhouse gas inventory methodology
for nitrous oxide from agriculture. Environ. Sci. Policy 2, 325–
333.
Mosier, A., Kroeze, C., 2000. Potential impact on the global atmo-
spheric N2O budget of the increased nitrogen input required to
meet future global food demands. Chemosphere-Glob. Chang.
Sci. 2, 465–474.
Mummey, D.L., Smith, J.L., Bluhm, G., 1998. Assessment of
alternative management practices on N2O emissions from US
agriculture. Agric. Ecosyst. Environ. 70, 79–87.
Nevison, C., 2000. Review of the IPCC methodology for estimating
nitrous oxide emissions associated with agricultural leaching
and runoff. Chemosphere-Glob. Chang. Sci. 2, 493–500.
Ogle, S.M., Breidt, F.J., Eve, M.D., Paustian, K., 2003. Uncertainty
in estimating land use and management impacts on soil organic
carbon storage for US agricultural lands between 1982 and 1997.
Glob. Chang. Biol. 9, 1521–1542.
Parton, W.J., Ojima, D.S., Cole, C.V., Schimel, D.S., 1994. A general
model for soil organic matter dynamics: sensitivity to litter
chemistry, texture and management. In: Bryant, R.B., Arnold,
R.W. (Eds.), Quantitative Modeling of Soil Forming Processes.
Soil Sci. Soc. Am, Madison, WI, pp. 147–167.
Parton, W.J., Hartman, M.D., Ojima, D.S., Schimel, D.S., 1998.
DAYCENT: its land surface submodel—description and testing.
Glob. Planet. Chang. 19, 35–48.
Paul, E.A., Clark, F.E., 1996. Soil Microbiology and Biochemistry.
Academic Press, New York.
Prather, M.J., Derwent, R.D., Ehhalt, D., Fraser, P., Sanhueza, E.,
Zhou, X., 1995. Other trace gases and atmospheric chemistry. In:
Houghton, J.T., Meira Filho, L.G., Lee, J.B.H., Callander,
B.A., Haites, E., Harris, N., Maskell, K. (Eds.), Climate Change
1994. Cambridge University Press, Cambridge, UK, pp. 73–126.
Robertson, G.P., Paul, E.A., Harwood, R.R., 2000. Greenhouse gases
in intensive agriculture: Contributions of individual gases to the
radiative forcing of the atmosphere. Science 289, 1922–1925.
Rochette, P., Angers, D.A., Belanger, G., Chantigny, M.H., Prevost,
D., Levesque, G., 2004. Emissions of N2O from alfalfa and
soybean crops in eastern Canada. Soil Sci. Soc. Am. J. 68,
493–506.
Rodhe, H., 1990. A comparison of the contribution of various gases
to the greenhouse effect. Science 248, 1217–1219.
Saxton, K.E., Rawls, W.J., Romberger, J.S., Papendick, R.I., 1986.
Estimating generalized soil–water characteristics from texture.
Soil Sci. Soc. Am. J. 50, 1031–1036.
S.J. Del Grosso et al. / Soil & Tillage Research 83 (2005) 9–2424
Sharpley, A.N., Williams, J.R., 1990. EPIC-Erosion/Productivity
Impact Calculator: 1. Model Documentation. US Dept. Agric.
Tech. Bull. No. 1768.
Steudler, P.J., Bowden, R.D., Melillo, J.M., Aber, J.D., 1989.
Influence of nitrogen fertilization on methane uptake in tempe-
rate soils. Nature 341, 314–316.
Stites, W., Kraft, G.L., 2001. Nitrate and chloride loading to
groundwater from an irrigated north-central US sand-plain
vegetable field. J. Environ. Qual. 30, 1176–1184.
Thornton, F.C., Valente, R.J., 1996. Soil emissions of nitric oxide
and nitrous oxide from no-till corn. Soil Sci. Soc. Am. J. 60,
1127–1133.
USEPA, 2002. Inventory of US greenhouse gas emissions and sinks:
1990–2000. Washington D.C., USA.
VEMAP, 1995. Members (Melillo J.M., J. Borchers, J., Chaney, J.,
Fisher, H., Fox, S., Haxeltine, A., Janetos, A., Kicklighter, D.W.,
Kittel, T.G.F., McGuire, A.D., McKeown, R., Neilson, R.,
Nemani, R., Ojima, D.S., Painter, T., Pan, Y., Parton, W.J.,
Pierce, L., Pitelka, L., Prentice, C., Rizzo, B., Rosenbloom,
N.A., Running, S., Schimel, D.S., Sitch, S., Smith, T., Wood-
ward, I.), Vegetation/Ecosystem Modeling and Analysis Project
(VEMAP): Comparing biogeography and biogeochemistry
models in a continental-scale study of terrestrial ecosystem
responses to climate change and CO2 doubling. Glob. Biogeo-
chem. Cycles 9, pp. 407–437.
Wassmann, R., Lantin, R.S., Neue, H.U., Buendia, L.V., Corton,
T.M., Lu, Y.H., 2000. Characterization of methane emissions
from rice fields in Asia. 3. Mitigation options and future needs.
Nutr. Cycl. Agroecosyst. 58, 23–36.
West, T.O., Marland, G., 2002. A synthesis of carbon sequestration,
carbon emissions, and net carbon flux in agriculture: comparing
tillage practices in the United States. Agric. Ecosyst. Environ.
91, 217–232.
Williams, E.J., Hutchinson, G.L., Fehsenfeld, F.C., 1992. NOx and
N2O emissions from soil. Glob. Biogeochem. Cycles 6, 351–
388.


![0812 FAO - Country Responses to the Crisis[1]](https://img.pdfslide.net/doc/110x75/577d207d1a28ab4e1e93071e/0812-fao-country-responses-to-the-crisis1.jpg)