Embed Size (px)
Citation preview
Storage and handling
Fuel removal Installing
a Fuel-Handling Machine
Rubble removal & dose reduction
Storage and handling
Fuel debris retrieval
Capturing the status inside the PCV/ examining the fuel debris retrieval
method, etc. (Note 2)
Dismantling Design and
manufacturing of devices / equipment
Scenario development & technology consideration
(Note 2) The method employed to retrieve fuel debris for the first unit will be confirmed in FY2019.
Summary of Decommissioning and Contaminated Water Management October 26, 2017 Secretariat of the Team for Countermeasures for Decommissioning and Contaminated Water Treatment
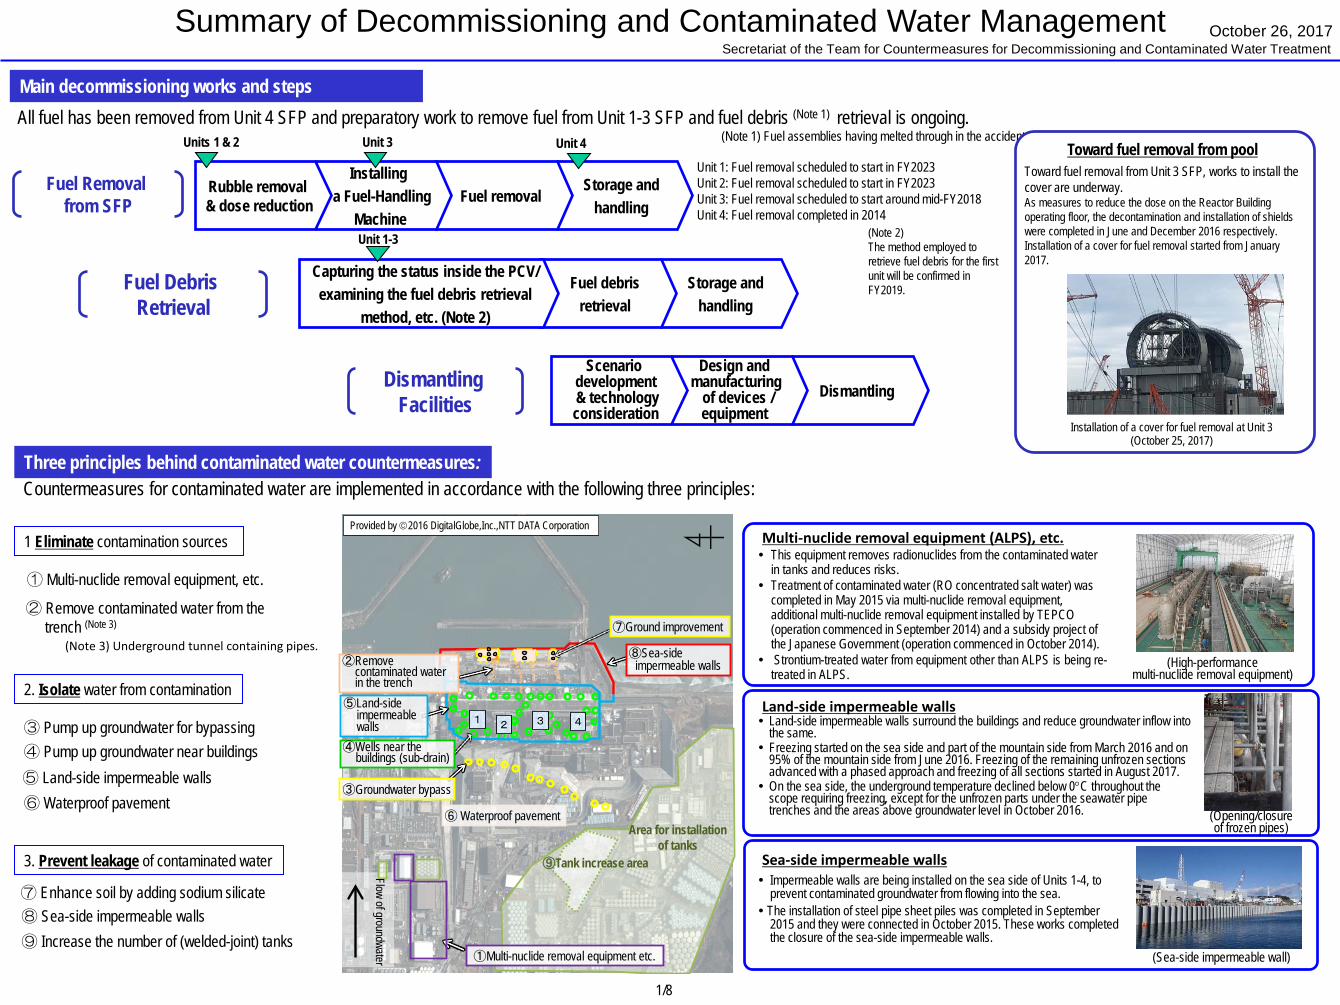
Main decommissioning works and steps All fuel has been removed from Unit 4 SFP and preparatory work to remove fuel from Unit 1-3 SFP and fuel debris (Note 1) retrieval is ongoing.
(Note 1) Fuel assemblies having melted through in the accident.
Fuel Removal from SFP
Fuel Debris Retrieval
Dismantling Facilities
Unit 4 Unit 3 Units 1 & 2
Unit 1-3
Three principles behind contaminated water countermeasures:
1 Eliminate contamination sources
2. Isolate water from contamination
3. Prevent leakage of contaminated water
① Multi-nuclide removal equipment, etc.
③ Pump up groundwater for bypassing ④ Pump up groundwater near buildings ⑤ Land-side impermeable walls ⑥ Waterproof pavement
⑦ Enhance soil by adding sodium silicate ⑧ Sea-side impermeable walls ⑨ Increase the number of (welded-joint) tanks
Multi-nuclide removal equipment (ALPS), etc. This equipment removes radionuclides from the contaminated water
in tanks and reduces risks. Treatment of contaminated water (RO concentrated salt water) was
completed in May 2015 via multi-nuclide removal equipment, additional multi-nuclide removal equipment installed by TEPCO (operation commenced in September 2014) and a subsidy project of the Japanese Government (operation commenced in October 2014).
Strontium-treated water from equipment other than ALPS is being re-treated in ALPS.
Land-side impermeable walls Land-side impermeable walls surround the buildings and reduce groundwater inflow into
the same. Freezing started on the sea side and part of the mountain side from March 2016 and on
95% of the mountain side from June 2016. Freezing of the remaining unfrozen sections advanced with a phased approach and freezing of all sections started in August 2017. On the sea side, the underground temperature declined below 0°C throughout the
scope requiring freezing, except for the unfrozen parts under the seawater pipe trenches and the areas above groundwater level in October 2016.
Sea-side impermeable walls Impermeable walls are being installed on the sea side of Units 1-4, to
prevent contaminated groundwater from flowing into the sea. The installation of steel pipe sheet piles was completed in September
2015 and they were connected in October 2015. These works completed the closure of the sea-side impermeable walls.
(High-performance multi-nuclide removal equipment)
(Sea-side impermeable wall)
② Remove contaminated water from the trench (Note 3)
(Note 3) Underground tunnel containing pipes.
1/8
Unit 1: Fuel removal scheduled to start in FY2023 Unit 2: Fuel removal scheduled to start in FY2023 Unit 3: Fuel removal scheduled to start around mid-FY2018 Unit 4: Fuel removal completed in 2014
Toward fuel removal from pool
Countermeasures for contaminated water are implemented in accordance with the following three principles:
(Opening/closure of frozen pipes)
Toward fuel removal from Unit 3 SFP, works to install the cover are underway. As measures to reduce the dose on the Reactor Building operating floor, the decontamination and installation of shields were completed in June and December 2016 respectively. Installation of a cover for fuel removal started from January 2017.
Stopper
FHM girder
1 3 42
Provided by 2016 DigitalGlobe,Inc.,NTT DATA Corporation
⑦Ground improvement
⑧Sea-side impermeable walls②Remove
contaminated water in the trench
③Groundwater bypass
④Wells near the buildings (sub-drain)
⑤Land-side impermeable walls
⑥ Waterproof pavementArea for installation
of tanks⑨Tank increase area
Flow of groundwater ①Multi-nuclide removal equipment etc.
Installation of a cover for fuel removal at Unit 3 (October 25, 2017)
Status of the land-side impermeable walls Preparation for installation of Unit 1 windbreak fences
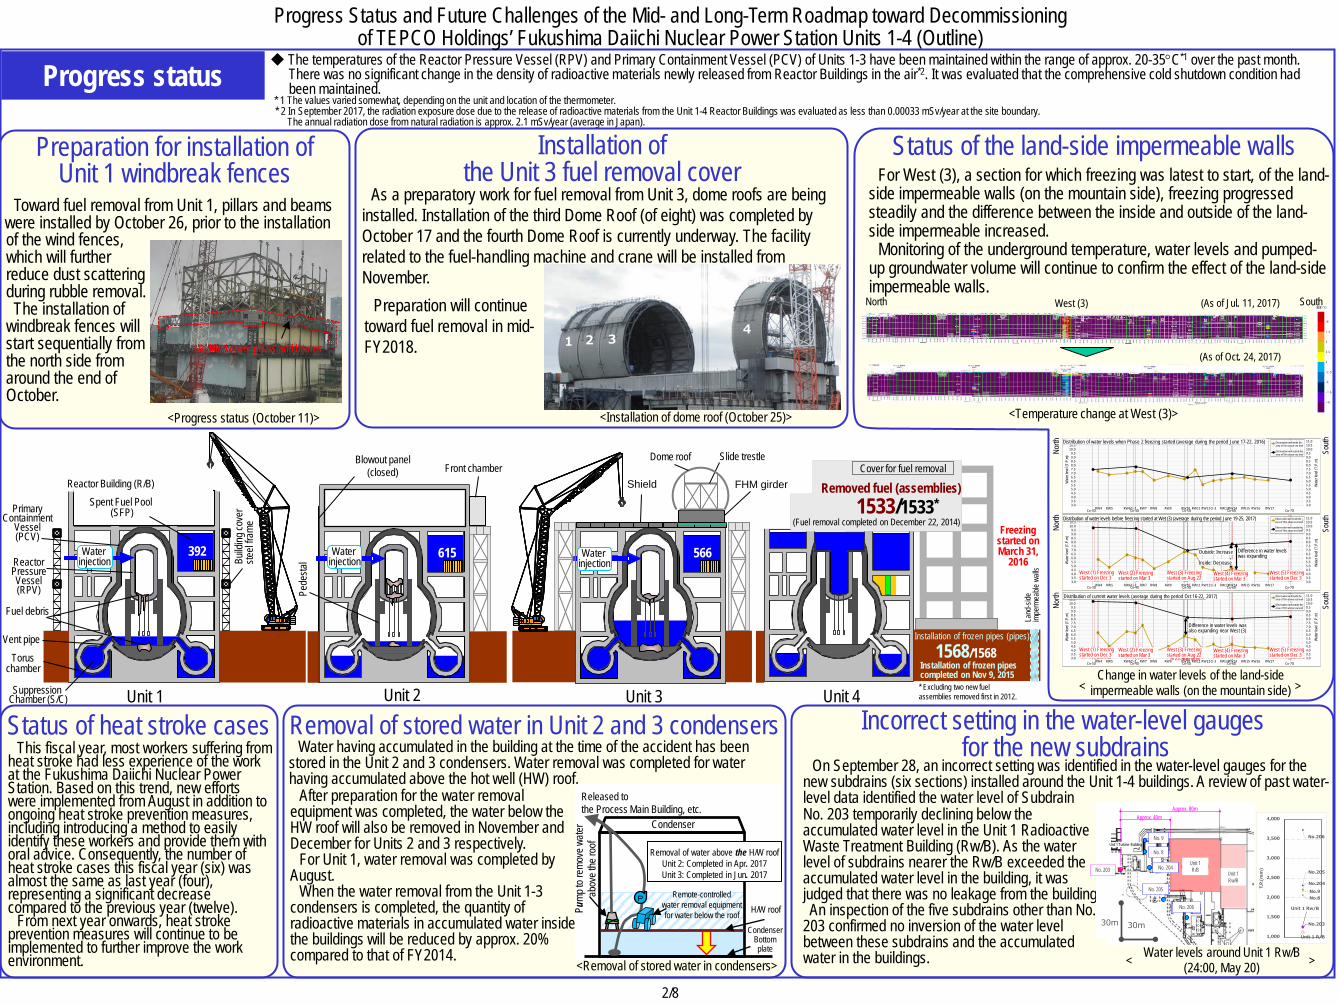
◆ The temperatures of the Reactor Pressure Vessel (RPV) and Primary Containment Vessel (PCV) of Units 1-3 have been maintained within the range of approx. 20-35°C*1 over the past month. There was no significant change in the density of radioactive materials newly released from Reactor Buildings in the air*2. It was evaluated that the comprehensive cold shutdown condition had been maintained.
* 1 The values varied somewhat, depending on the unit and location of the thermometer. * 2 In September 2017, the radiation exposure dose due to the release of radioactive materials from the Unit 1-4 Reactor Buildings was evaluated as less than 0.00033 mSv/year at the site boundary. The annual radiation dose from natural radiation is approx. 2.1 mSv/year (average in Japan).
2/8
クローラクレーン
安全第一 福島第一 安全第一 福島第一 安全第一 福島第一
構台
安全第一 福島第一 安全第一 福島第一 安全第一 福島第一
Installation of the Unit 3 fuel removal cover
Incorrect setting in the water-level gauges for the new subdrains
On September 28, an incorrect setting was identified in the water-level gauges for the new subdrains (six sections) installed around the Unit 1-4 buildings. A review of past water-level data identified the water level of Subdrain
Status of heat stroke cases
<Installation of dome roof (October 25)>
No. 203 temporarily declining below the accumulated water level in the Unit 1 Radioactive Waste Treatment Building (Rw/B). As the water level of subdrains nearer the Rw/B exceeded the accumulated water level in the building, it was judged that there was no leakage from the building. An inspection of the five subdrains other than No. 203 confirmed no inversion of the water level between these subdrains and the accumulated water in the buildings.
Removal of stored water in Unit 2 and 3 condensers
As a preparatory work for fuel removal from Unit 3, dome roofs are being installed. Installation of the third Dome Roof (of eight) was completed by October 17 and the fourth Dome Roof is currently underway. The facility related to the fuel-handling machine and crane will be installed from November.
Preparation will continue toward fuel removal in mid-FY2018.
For West (3), a section for which freezing was latest to start, of the land-side impermeable walls (on the mountain side), freezing progressed steadily and the difference between the inside and outside of the land-side impermeable increased.
Monitoring of the underground temperature, water levels and pumped-up groundwater volume will continue to confirm the effect of the land-side impermeable walls.
Change in water levels of the land-side impermeable walls (on the mountain side)
<Temperature change at West (3)>
After preparation for the water removal equipment was completed, the water below the HW roof will also be removed in November and December for Units 2 and 3 respectively.
For Unit 1, water removal was completed by August.
When the water removal from the Unit 1-3 condensers is completed, the quantity of radioactive materials in accumulated water inside the buildings will be reduced by approx. 20% compared to that of FY2014.
This fiscal year, most workers suffering from heat stroke had less experience of the work at the Fukushima Daiichi Nuclear Power Station. Based on this trend, new efforts were implemented from August in addition to ongoing heat stroke prevention measures, including introducing a method to easily identify these workers and provide them with oral advice. Consequently, the number of heat stroke cases this fiscal year (six) was almost the same as last year (four), representing a significant decrease compared to the previous year (twelve).
From next year onwards, heat stroke prevention measures will continue to be implemented to further improve the work environment.
Water having accumulated in the building at the time of the accident has been stored in the Unit 2 and 3 condensers. Water removal was completed for water having accumulated above the hot well (HW) roof.
< > Water levels around Unit 1 Rw/B (24:00, May 20)
(As of Jul. 11, 2017)
(As of Oct. 24, 2017)
<Removal of stored water in condensers>
Condenser
H/W roof
Released to the Process Main Building, etc.
Condenser Bottom plate
Removal of water above the H/W roof Unit 2: Completed in Apr. 2017 Unit 3: Completed in Jun. 2017
P
Pump
to re
move
wate
r ab
ove t
he ro
of
Remote-controlled water removal equipment for water below the roof
West (3)
Toward fuel removal from Unit 1, pillars and beams were installed by October 26, prior to the installation of the wind fences, which will further reduce dust scattering during rubble removal. The installation of windbreak fences will start sequentially from the north side from around the end of October.
<Progress status (October 11)>
Modified cover pillars and beams
North South
3.03.54.04.55.05.56.06.57.07.58.08.59.09.510.010.511.0
3.03.54.04.55.05.56.06.57.07.58.08.59.09.5
10.010.511.0
-260 240
水位
(T.P
.m)
水位
(T.P
.m)
10m盤内側観測井
10m盤外側観測井
Co-3D Co-4D Co-5D Co-6D Co-7DRW5RW4 RW6Ci-2 RW7 RW8 RW9 RW10 RW11 RW12Ci-3 RW13RW14 RW15 RW16 RW17
北 南
北 南
北
3.03.54.04.55.05.56.06.57.07.58.08.59.09.510.010.511.0
3.03.54.04.55.05.56.06.57.07.58.08.59.09.5
10.010.511.0
-260 240
水位
(T.P
.m)
水位
(T.P
.m)
10m盤内側観測井
10m盤外側観測井
Co-3D Co-4D Co-5D Co-6D Co-7DRW5RW4 RW6Ci-2 RW7 RW8 RW9 RW10 RW11 RW12Ci-3 RW13RW14 RW15 RW16 RW17
3.03.54.04.55.05.56.06.57.07.58.08.59.09.510.010.511.0
3.03.54.04.55.05.56.06.57.07.58.08.59.09.5
10.010.511.0
-260 240
水位
(T.P
.m)
水位
(T.P
.m)
10m盤内側観測井
10m盤外側観測井
Co-3D Co-4D Co-5D Co-6D Co-7DRW5RW4 RW6Ci-2 RW7 RW8 RW9 RW10 RW11 RW12Ci-3 RW13RW14 RW15 RW16 RW17
西側③近傍においても水位差拡大傾向
西側⑤12/3凍結開始
西側①12/3凍結開始
西側③8/22凍結開始
西側④3/3凍結開始
西側②3/3凍結開始
外側:上昇
内側:低下
水位差の拡大傾向
西側⑤12/3凍結開始
西側①12/3凍結開始
西側③8/22凍結開始
西側④3/3凍結開始
西側②3/3凍結開始
南
フェーズ2凍結開始時の水位分布(2016/6/17~6/22平均)
現状の水位分布(2017/10/16~10/22平均)
西③凍結開始前の水位分布(2017/6/19~6/25平均)
1 2 34
< >
Progress Status and Future Challenges of the Mid- and Long-Term Roadmap toward Decommissioning of TEPCO Holdings’ Fukushima Daiichi Nuclear Power Station Units 1-4 (Outline)
Progress status
Unit 1
Primary Containment
Vessel (PCV)
Reactor Pressure Vessel (RPV)
Fuel debris
Suppression Chamber (S/C)
Vent pipe Torus
chamber
Build
ing co
ver
steel
frame
Spent Fuel Pool (SFP)
Reactor Building (R/B)
Water injection
392
Front chamber
Unit 2
Water injection
Blowout panel (closed)
615
Pede
stal
Slide trestle Dome roof
Unit 3
Shield
Water injection
566
FHM girder
1533/1533* Removed fuel (assemblies)
(Fuel removal completed on December 22, 2014)
Cover for fuel removal
Unit 4
Land
-side
im
perm
eable
wall
s
Freezing started on March 31,
2016
1568/1568 Installation of frozen pipes (pipes)
Installation of frozen pipes completed on Nov 9, 2015
* Excluding two new fuel assemblies removed first in 2012.
No. 9
No. 8
No. 205
Unit 1Rw/B
No. 204No. 203
No. 206
Unit 1R/B
Approx. 40mApprox. 80m
30m 30m
Unit 1 Rw/B
Unit 1 R/B
No.8No.9
No.203
No.204
No.205
No.206
1,000
1,500
2,000
2,500
3,000
3,500
4,000
T.P.
(mm
)
Unit 1 Turbine Building
Distribution of water levels when Phase 2 freezing started (average during the period June 17-22, 2016)
Distribution of water levels before freezing started at Wet (3) (average during the period June 19-25, 2017)
Distribution of current water levels (average during the period Oct 16-22, 2017)
Outside: Increase
Inside: Decrease
Difference in water levels was expanding
West (1) Freezing started on Dec 3
West (2) Freezing started on Mar 3
West (3) Freezing started on Aug 22
West (4) Freezing started on Mar 3
West (5) Freezing started on Dec 3
Difference in water levels was also expanding near West (3)
Observation well inside the area of 10m above sea level
Observation well outside the area of 10m above sea level
Observation well inside the area of 10m above sea level
Observation well outside the area of 10m above sea level
Observation well inside the area of 10m above sea level
Observation well outside the area of 10m above sea level
South
So
uth
South
North
No
rth
North
Wate
r leve
l (T.
P.m)
W
ater le
vel (
T.P.
m)
Wate
r leve
l (T.
P.m)
Wate
r leve
l (T.
P.m)
W
ater le
vel (
T.P.
m)
Wate
r leve
l (T.
P.m)
West (1) Freezing started on Dec 3
West (2) Freezing started on Mar 3
West (3) Freezing started on Aug 22
West (4) Freezing started on Mar 3
West (5) Freezing started on Dec 3
3/8
MP-1
MP-2
MP-3 MP-4
MP-5
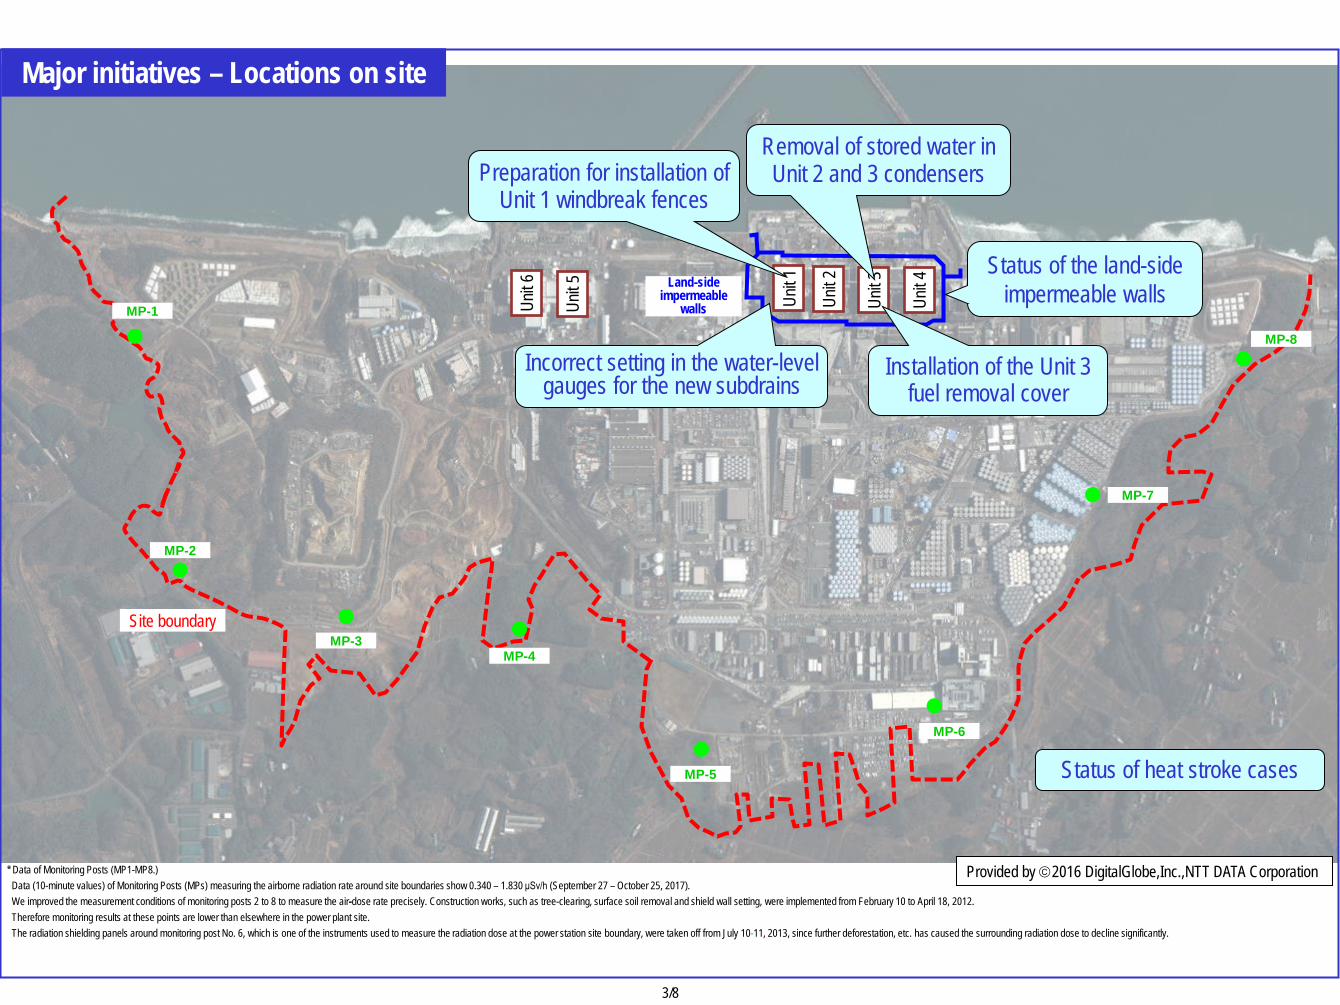
* Data of Monitoring Posts (MP1-MP8.) Data (10-minute values) of Monitoring Posts (MPs) measuring the airborne radiation rate around site boundaries show 0.340 – 1.830 μSv/h (September 27 – October 25, 2017). We improved the measurement conditions of monitoring posts 2 to 8 to measure the air-dose rate precisely. Construction works, such as tree-clearing, surface soil removal and shield wall setting, were implemented from February 10 to April 18, 2012. Therefore monitoring results at these points are lower than elsewhere in the power plant site. The radiation shielding panels around monitoring post No. 6, which is one of the instruments used to measure the radiation dose at the power station site boundary, were taken off from July 10-11, 2013, since further deforestation, etc. has caused the surrounding radiation dose to decline significantly.
MP-6
MP-7
MP-8
Status of heat stroke cases
Major initiatives – Locations on site
Site boundary
Provided by 2016 DigitalGlobe,Inc.,NTT DATA Corporation
Unit 1
Unit 2
Unit 3
Unit 4
Unit 6
Unit 5
Land-side impermeable
walls
Status of the land-side impermeable walls
Incorrect setting in the water-level gauges for the new subdrains
Removal of stored water in Unit 2 and 3 condensers Preparation for installation of
Unit 1 windbreak fences
Installation of the Unit 3 fuel removal cover

4/8
I. Confirmation of the reactor conditions 1. Temperatures inside the reactors
Through continuous reactor cooling by water injection, the temperatures of the Reactor Pressure Vessel (RPV) bottom and the Primary Containment Vessel (PCV) gas phase were maintained within the range of approx. 20 to 35°C for the past month, though it varied depending on the unit and location of the thermometer.
2. Release of radioactive materials from the Reactor Buildings
As of September 2017, the density of radioactive materials newly released from Reactor Building Units 1-4 in the air and measured at the site boundary was evaluated at approx. 3.2×10⁻¹² Bq/cm3 for Cs-134 and 1.8×10⁻¹¹ Bq/cm3 for Cs-137, while the radiation exposure dose due to the release of radioactive materials there was less than 0.00033 mSv/year.
Note: Different formulas and coefficients were used to evaluate the radiation dose in the facility operation plan and monthly report. The evaluation methods were
integrated in September 2012. As the fuel removal from the spent fuel pool (SFP) commenced for Unit 4, the radiation exposure dose from Unit 4 was added to the items subject to evaluation since November 2013. The evaluation has been changed to a method considering the values of continuous dust monitors since FY2015, with data to be evaluated monthly and announced the following month.
3. Other indices There was no significant change in indices, including the pressure in the PCV and the PCV radioactivity density
(Xe-135) for monitoring criticality, nor was any abnormality in the cold shutdown condition or criticality sign detected. Based on the above, it was confirmed that the comprehensive cold shutdown condition had been maintained and the
reactors remained in a stabilized condition. II. Progress status by each plan 1. Contaminated water countermeasures
To tackle the increase in accumulated water due to groundwater inflow, fundamental measures to prevent such inflow into the Reactor Buildings will be implemented, while improving the decontamination capability of water treatment and preparing facilities to control the contaminated water
Operation of the groundwater bypass ・ From April 9, 2014, the operation of 12 groundwater bypass pumping wells commenced sequentially to pump up
groundwater. The release started from May 21, 2014 in the presence of officials from the Intergovernmental Liaison Office for the Decommissioning and Contaminated Water Issue of the Cabinet Office. Up until October 24, 2017, 321,301 m³ of groundwater had been released. The pumped-up groundwater was temporarily stored in tanks and released after TEPCO and a third-party organization had confirmed that its quality met operational targets.
・ Pumps are inspected and cleaned as required based on their operational status.
Water Treatment Facility special for Subdrain & Groundwater drains ・ To reduce the level of groundwater flowing into the buildings, work began to pump up groundwater from wells
(subdrains) around the buildings on September 3, 2015. The pumped-up groundwater was then purified at dedicated facilities and released from September 14, 2015 onwards. Up until October 24, 2017, a total of 432,018 m³ had been drained after TEPCO and a third-party organization had confirmed that its quality met operational targets.
・ Due to the level of the groundwater drain pond rising after the sea-side impermeable walls were closed, pumping started on November 5, 2015. Up until October 24, 2017, a total of approx. 153,900 m3 had been pumped up. A volume of fewer than 10 m3/day is being transferred from the groundwater drain to the Turbine Buildings (average for the period September 21 - October 18, 2017).
・ On September 28, an incorrect setting was identified in the water-level gauges for the new subdrains (six sections) installed around the Unit 1-4 buildings. A review of past water-level data identified the water level of Subdrain No. 203 temporarily declining below the accumulated water level in the Unit 1 Radioactive Waste Treatment Building (Rw/B). As the water level of subdrains nearer the Rw/B exceeded the accumulated water level in the building, it was judged that there was no leakage from the building. An inspection of the five subdrains other than No. 203 confirmed no inversion of the water level between these subdrains and the accumulated water in the buildings.
・ As an enhancement measure, the treatment facility for subdrains and groundwater drains is being upgraded. Additional water collection tanks and temporary water storage tanks were installed and the installation of fences, pipes and ancillary facilities is also underway. The treatment capacity is being enhanced incrementally to accommodate the increasing volume of pumped-up groundwater during the high rainfall season (before measures: approx. 800 m3/day, from August 22: approx. 900 m3/day, after temporary storage tanks put into operation: approx. 1,200 m3/day and after water collection tanks put into operation: approx. 1,500m3/day).
・ To maintain the level of groundwater pumped up from subdrains, work to install additional subdrain pits and recover existing subdrain pits is underway. They will go into operation sequentially from a pit for which work is completed (the number of pits which went into operation: 6 of 15 additional pits, 0 of 4 recovered pits).
・ To eliminate the suspension of water pumping while cleaning the subdrain transfer pipe, the pipe will be duplicated. Installation of the pipe and ancillary facility is underway.
・ Since the subdrains went into operation, the inflow into buildings tended to decline to fewer than 150 m3/day when the subdrain water level declined below T.P. 3.0 m, while the inflow increased during rainfall.
0
10
20
30
40
50
60
70
80
90
100
7/21 7/31 8/10 8/20 8/30 9/9 9/19 9/29 10/9 10/19 10/29
℃
0
10
20
30
40
50
60
70
80
90
100
7/21 7/31 8/10 8/20 8/30 9/9 9/19 9/29 10/9 10/19 10/29
℃
2011 2012 2013 2014 2015 2016 2017
(Reference) * The density limit of radioactive materials in the air outside the surrounding monitoring area:
[Cs-134]: 2 x 10⁻⁵ Bq/cm³ [Cs-137]: 3 x 10⁻⁵ Bq/cm³
* Dust density around the site boundaries of Fukushima Daiichi Nuclear Power Station (actual measured values): [Cs-134]: ND (Detection limit: approx. 1 x 10⁻⁷ Bq/cm³) [Cs-137]: ND (Detection limit: approx. 2 x 10⁻⁷ Bq/cm³)
* Data of Monitoring Posts (MP1-MP8). Data of Monitoring Posts (MPs) measuring the airborne radiation rate around the site
boundary showed 0.340 – 1.830 μSv/h (September 27 - October 24, 2017) To measure the variation in the airborne radiation rate of MP2-MP8 more accurately,
environmental improvement (tree trimming, removal of surface soil and shielding around the MPs) was completed.
Reactor injection water temperature: Air temperature:
Unit 1
Unit 2
Unit 3
Unit 1
Unit 2
Unit 3
Reactor injection water temperature: Air temperature:
RPV bottom temperatures (recent quarter) * The trend graphs show part of the temperature data measured at multiple points.
PCV gas phase temperatures (recent quarter)
Annual radiation dose at site boundaries by radioactive materials (cesium) released from Reactor Building Units 1-4
Figure 1: Correlation between inflow such as groundwater and rainwater into buildings and the water level of Unit 1-4 subdrains
0
0.1
0.2
0.3
0.4
0.5
0.6
Exp
osur
e do
se (m
Sv/
year
)
1.7
0
100
200
300
400
500
600
700
800
1.5 2 2.5 3 3.5 4 4.5 5 5.5 6 6.5 7
Inflow
into
build
ing (m
3 /day
)Subdrain water level of Units 1-4 (TP.m)
Correlation diagram between subdrain water level and inflow into building (since Jan 29, 2015)
Jan 29 - Sep 16, 2015: Before subdrain operation start (10-day rainfall of less than 41mm)Jan 29 - Sep 16, 2015: Before subdrain operation start (10-day rainfall of 41 mm or more)From Sep 17, 2015: Subdrain full operation (10-day rainfall of less than 41mm)From Sep 17, 2015: Subdrain full operation (10-day rainfall of 41mm or more)
5/8
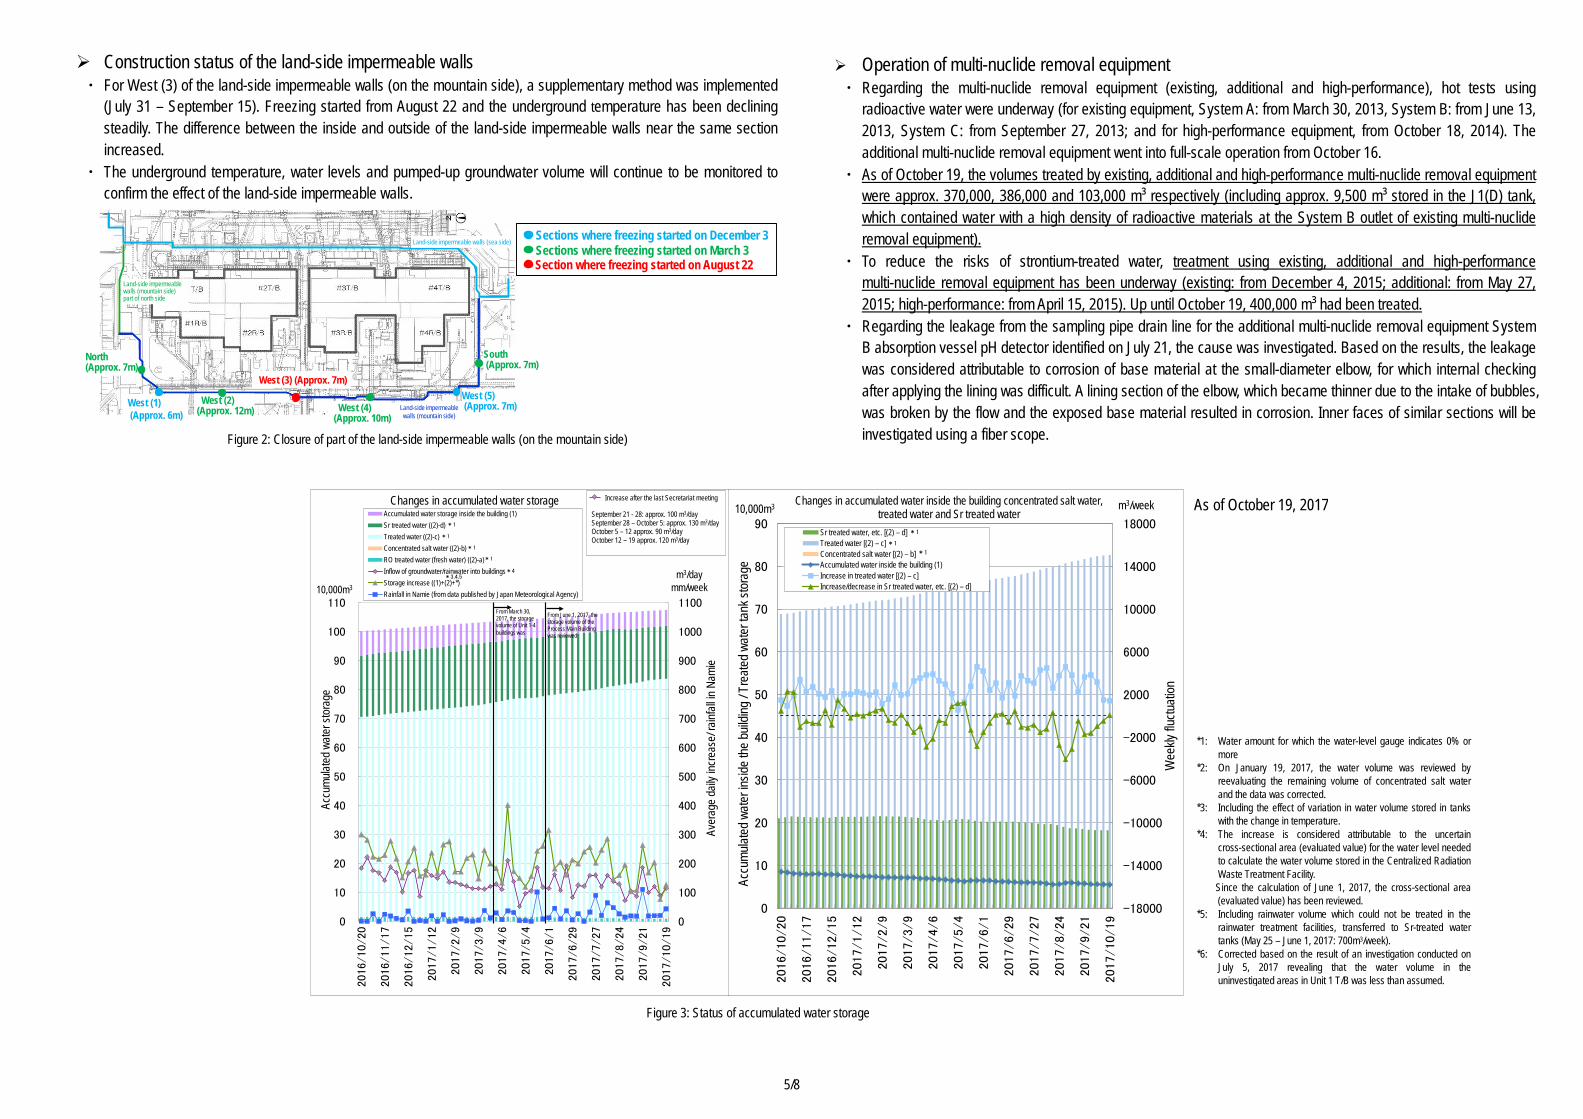
Construction status of the land-side impermeable walls ・ For West (3) of the land-side impermeable walls (on the mountain side), a supplementary method was implemented
(July 31 – September 15). Freezing started from August 22 and the underground temperature has been declining steadily. The difference between the inside and outside of the land-side impermeable walls near the same section increased.
・ The underground temperature, water levels and pumped-up groundwater volume will continue to be monitored to confirm the effect of the land-side impermeable walls.
Operation of multi-nuclide removal equipment ・ Regarding the multi-nuclide removal equipment (existing, additional and high-performance), hot tests using
radioactive water were underway (for existing equipment, System A: from March 30, 2013, System B: from June 13, 2013, System C: from September 27, 2013; and for high-performance equipment, from October 18, 2014). The additional multi-nuclide removal equipment went into full-scale operation from October 16.
・ As of October 19, the volumes treated by existing, additional and high-performance multi-nuclide removal equipment were approx. 370,000, 386,000 and 103,000 m³ respectively (including approx. 9,500 m³ stored in the J1(D) tank, which contained water with a high density of radioactive materials at the System B outlet of existing multi-nuclide removal equipment).
・ To reduce the risks of strontium-treated water, treatment using existing, additional and high-performance multi-nuclide removal equipment has been underway (existing: from December 4, 2015; additional: from May 27, 2015; high-performance: from April 15, 2015). Up until October 19, 400,000 m³ had been treated.
・ Regarding the leakage from the sampling pipe drain line for the additional multi-nuclide removal equipment System B absorption vessel pH detector identified on July 21, the cause was investigated. Based on the results, the leakage was considered attributable to corrosion of base material at the small-diameter elbow, for which internal checking after applying the lining was difficult. A lining section of the elbow, which became thinner due to the intake of bubbles, was broken by the flow and the exposed base material resulted in corrosion. Inner faces of similar sections will be investigated using a fiber scope.
Land-side impermeable walls (sea side)
Land-side impermeable walls (mountain side)
〇:未凍結箇所
West (1)(Approx. 6m)
West (5)(Approx. 7m)
North(Approx. 7m)
West (2)(Approx. 12m)
South(Approx. 7m)
West (4)(Approx. 10m)
West (3) (Approx. 7m)
Land-side impermeablewalls (mountain side)part of north side
Sections where freezing started on December 3Sections where freezing started on March 3Section where freezing started on August 22
Figure 2: Closure of part of the land-side impermeable walls (on the mountain side)
*1: Water amount for which the water-level gauge indicates 0% or more
*2: On January 19, 2017, the water volume was reviewed by reevaluating the remaining volume of concentrated salt water and the data was corrected.
*3: Including the effect of variation in water volume stored in tanks with the change in temperature.
*4: The increase is considered attributable to the uncertain cross-sectional area (evaluated value) for the water level needed to calculate the water volume stored in the Centralized Radiation Waste Treatment Facility. Since the calculation of June 1, 2017, the cross-sectional area (evaluated value) has been reviewed.
*5: Including rainwater volume which could not be treated in the rainwater treatment facilities, transferred to Sr-treated water tanks (May 25 – June 1, 2017: 700m3/week).
*6: Corrected based on the result of an investigation conducted on July 5, 2017 revealing that the water volume in the uninvestigated areas in Unit 1 T/B was less than assumed.
As of October 19, 2017
Figure 3: Status of accumulated water storage
0
100
200
300
400
500
600
700
800
900
1000
1100
0
10
20
30
40
50
60
70
80
90
100
110
2016/10/20
2016/11/17
2016/12/15
2017/1/12
2017/2/9
2017/3/9
2017/4/6
2017/5/4
2017/6/1
2017/6/29
2017/7/27
2017/8/24
2017/9/21
2017/10/19
Accumulated water storage inside the building (1)Sr treated water ((2)-d)Treated water ((2)-c)Concentrated salt water ((2)-b)RO treated water (fresh water) ((2)-a)Inflow of groundwater/rainwater into buildingsStorage increase ((1)+(2)+*)Rainfall in Namie (from data published by Japan Meteorological Agency)
Accu
mulat
ed w
ater s
torag
e
Aver
age d
aily i
ncre
ase/
rainf
all in
Nam
ie
10,000m3m3/day
mm/week
Changes in accumulated water storage
*1
*1
*1
*3,4,5*4
*1
Increase after the last Secretariat meeting
September 21 - 28: approx. 100 m3/daySeptember 28 – October 5: approx. 130 m3/dayOctober 5 – 12 approx. 90 m3/dayOctober 12 – 19 approx. 120 m3/day
From June 1, 2017, the storage volume of the Process Main Building was reviewed
From March 30, 2017, the storage volume of Unit 1-4 buildings was
-18000
-14000
-10000
-6000
-2000
2000
6000
10000
14000
18000
0
10
20
30
40
50
60
70
80
90
2016/10/20
2016/11/17
2016/12/15
2017/1/12
2017/2/9
2017/3/9
2017/4/6
2017/5/4
2017/6/1
2017/6/29
2017/7/27
2017/8/24
2017/9/21
2017/10/19
Sr treated water, etc. [(2) – d]Treated water [(2) – c]Concentrated salt water [(2) – b]Accumulated water inside the building (1)Increase in treated water [(2) – c]Increase/decrease in Sr treated water, etc. [(2) – d]
Accu
mula
ted w
ater
insid
e th
e bu
ilding
/ Tr
eate
d wa
ter t
ank s
tora
ge
10,000m3 Changes in accumulated water inside the building concentrated salt water, treated water and Sr treated water
Wee
kly flu
ctuat
ion
m3/week
*1
*1
*1
6/8
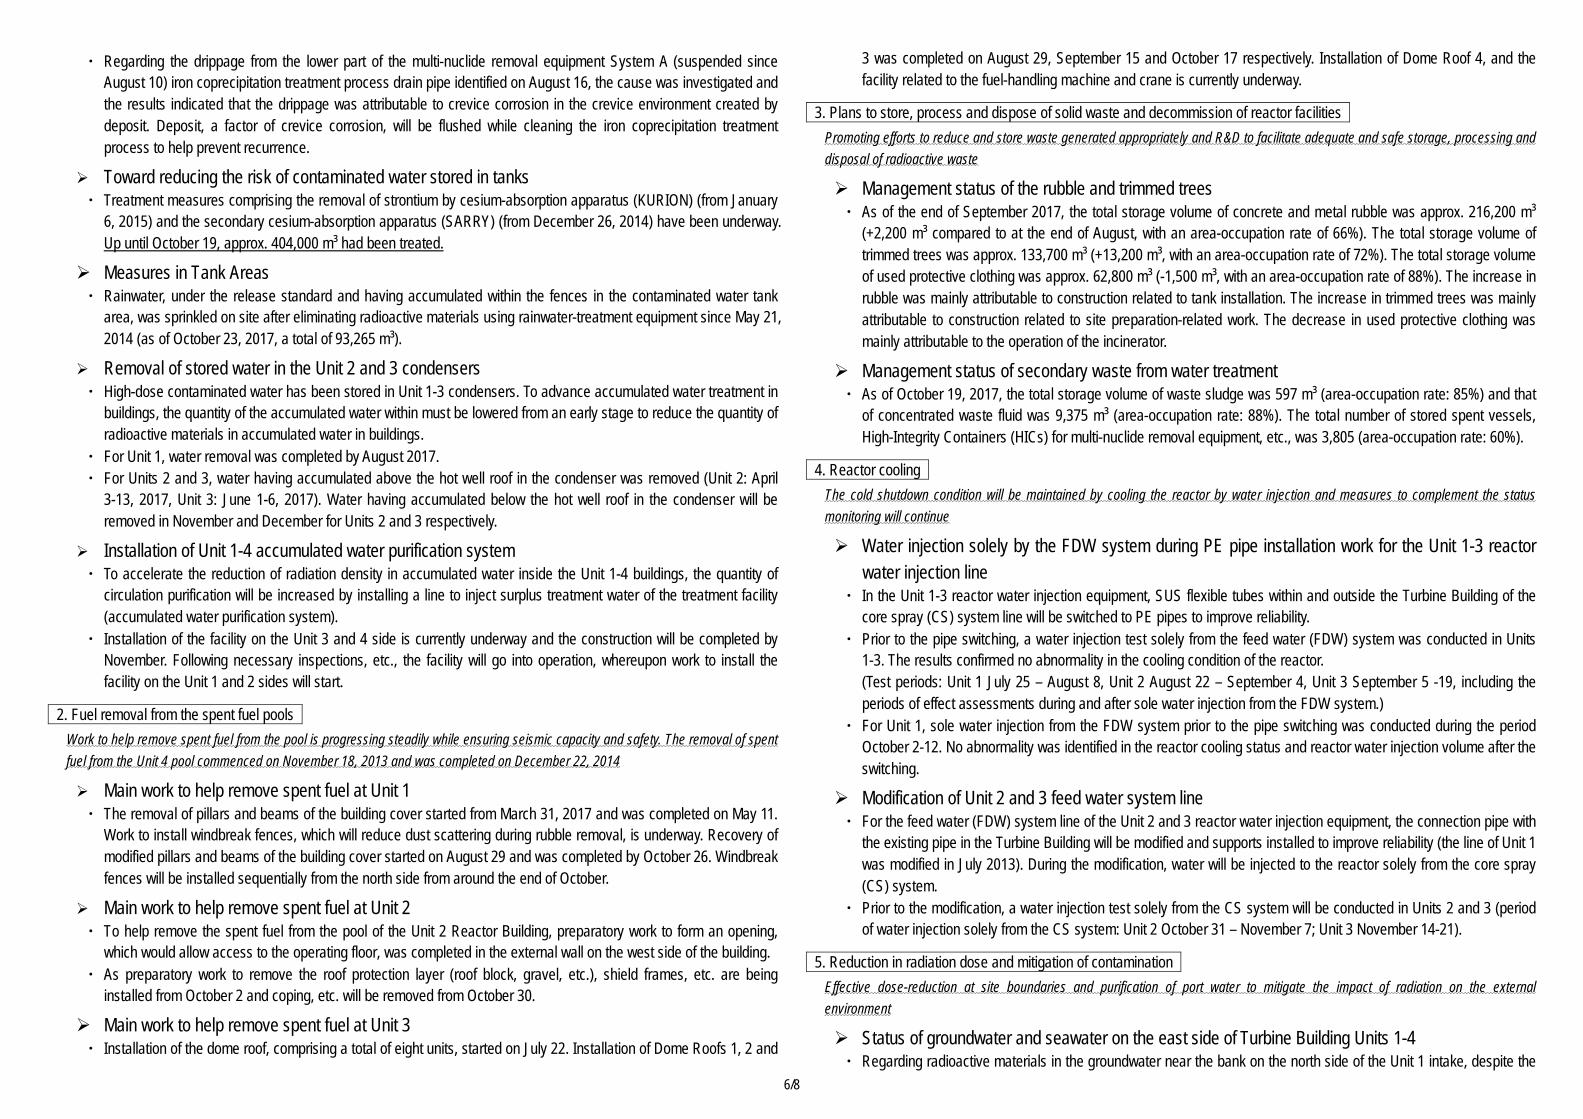
・ Regarding the drippage from the lower part of the multi-nuclide removal equipment System A (suspended since
August 10) iron coprecipitation treatment process drain pipe identified on August 16, the cause was investigated and the results indicated that the drippage was attributable to crevice corrosion in the crevice environment created by deposit. Deposit, a factor of crevice corrosion, will be flushed while cleaning the iron coprecipitation treatment process to help prevent recurrence.
Toward reducing the risk of contaminated water stored in tanks ・ Treatment measures comprising the removal of strontium by cesium-absorption apparatus (KURION) (from January
6, 2015) and the secondary cesium-absorption apparatus (SARRY) (from December 26, 2014) have been underway. Up until October 19, approx. 404,000 m³ had been treated.
Measures in Tank Areas ・ Rainwater, under the release standard and having accumulated within the fences in the contaminated water tank
area, was sprinkled on site after eliminating radioactive materials using rainwater-treatment equipment since May 21, 2014 (as of October 23, 2017, a total of 93,265 m³).
Removal of stored water in the Unit 2 and 3 condensers ・ High-dose contaminated water has been stored in Unit 1-3 condensers. To advance accumulated water treatment in
buildings, the quantity of the accumulated water within must be lowered from an early stage to reduce the quantity of radioactive materials in accumulated water in buildings.
・ For Unit 1, water removal was completed by August 2017. ・ For Units 2 and 3, water having accumulated above the hot well roof in the condenser was removed (Unit 2: April
3-13, 2017, Unit 3: June 1-6, 2017). Water having accumulated below the hot well roof in the condenser will be removed in November and December for Units 2 and 3 respectively.
Installation of Unit 1-4 accumulated water purification system ・ To accelerate the reduction of radiation density in accumulated water inside the Unit 1-4 buildings, the quantity of
circulation purification will be increased by installing a line to inject surplus treatment water of the treatment facility (accumulated water purification system).
・ Installation of the facility on the Unit 3 and 4 side is currently underway and the construction will be completed by November. Following necessary inspections, etc., the facility will go into operation, whereupon work to install the facility on the Unit 1 and 2 sides will start.
2. Fuel removal from the spent fuel pools Work to help remove spent fuel from the pool is progressing steadily while ensuring seismic capacity and safety. The removal of spent fuel from the Unit 4 pool commenced on November 18, 2013 and was completed on December 22, 2014
Main work to help remove spent fuel at Unit 1 ・ The removal of pillars and beams of the building cover started from March 31, 2017 and was completed on May 11.
Work to install windbreak fences, which will reduce dust scattering during rubble removal, is underway. Recovery of modified pillars and beams of the building cover started on August 29 and was completed by October 26. Windbreak fences will be installed sequentially from the north side from around the end of October.
Main work to help remove spent fuel at Unit 2 ・ To help remove the spent fuel from the pool of the Unit 2 Reactor Building, preparatory work to form an opening,
which would allow access to the operating floor, was completed in the external wall on the west side of the building. ・ As preparatory work to remove the roof protection layer (roof block, gravel, etc.), shield frames, etc. are being
installed from October 2 and coping, etc. will be removed from October 30.
Main work to help remove spent fuel at Unit 3 ・ Installation of the dome roof, comprising a total of eight units, started on July 22. Installation of Dome Roofs 1, 2 and
3 was completed on August 29, September 15 and October 17 respectively. Installation of Dome Roof 4, and the facility related to the fuel-handling machine and crane is currently underway.
3. Plans to store, process and dispose of solid waste and decommission of reactor facilities Promoting efforts to reduce and store waste generated appropriately and R&D to facilitate adequate and safe storage, processing and disposal of radioactive waste
Management status of the rubble and trimmed trees ・ As of the end of September 2017, the total storage volume of concrete and metal rubble was approx. 216,200 m³
(+2,200 m³ compared to at the end of August, with an area-occupation rate of 66%). The total storage volume of trimmed trees was approx. 133,700 m³ (+13,200 m³, with an area-occupation rate of 72%). The total storage volume of used protective clothing was approx. 62,800 m³ (-1,500 m³, with an area-occupation rate of 88%). The increase in rubble was mainly attributable to construction related to tank installation. The increase in trimmed trees was mainly attributable to construction related to site preparation-related work. The decrease in used protective clothing was mainly attributable to the operation of the incinerator.
Management status of secondary waste from water treatment ・ As of October 19, 2017, the total storage volume of waste sludge was 597 m³ (area-occupation rate: 85%) and that
of concentrated waste fluid was 9,375 m³ (area-occupation rate: 88%). The total number of stored spent vessels, High-Integrity Containers (HICs) for multi-nuclide removal equipment, etc., was 3,805 (area-occupation rate: 60%).
4. Reactor cooling The cold shutdown condition will be maintained by cooling the reactor by water injection and measures to complement the status monitoring will continue
Water injection solely by the FDW system during PE pipe installation work for the Unit 1-3 reactor water injection line
・ In the Unit 1-3 reactor water injection equipment, SUS flexible tubes within and outside the Turbine Building of the core spray (CS) system line will be switched to PE pipes to improve reliability.
・ Prior to the pipe switching, a water injection test solely from the feed water (FDW) system was conducted in Units 1-3. The results confirmed no abnormality in the cooling condition of the reactor. (Test periods: Unit 1 July 25 – August 8, Unit 2 August 22 – September 4, Unit 3 September 5 -19, including the periods of effect assessments during and after sole water injection from the FDW system.)
・ For Unit 1, sole water injection from the FDW system prior to the pipe switching was conducted during the period October 2-12. No abnormality was identified in the reactor cooling status and reactor water injection volume after the switching.
Modification of Unit 2 and 3 feed water system line ・ For the feed water (FDW) system line of the Unit 2 and 3 reactor water injection equipment, the connection pipe with
the existing pipe in the Turbine Building will be modified and supports installed to improve reliability (the line of Unit 1 was modified in July 2013). During the modification, water will be injected to the reactor solely from the core spray (CS) system.
・ Prior to the modification, a water injection test solely from the CS system will be conducted in Units 2 and 3 (period of water injection solely from the CS system: Unit 2 October 31 – November 7; Unit 3 November 14-21).
5. Reduction in radiation dose and mitigation of contamination Effective dose-reduction at site boundaries and purification of port water to mitigate the impact of radiation on the external environment
Status of groundwater and seawater on the east side of Turbine Building Units 1-4 ・ Regarding radioactive materials in the groundwater near the bank on the north side of the Unit 1 intake, despite the
7/8
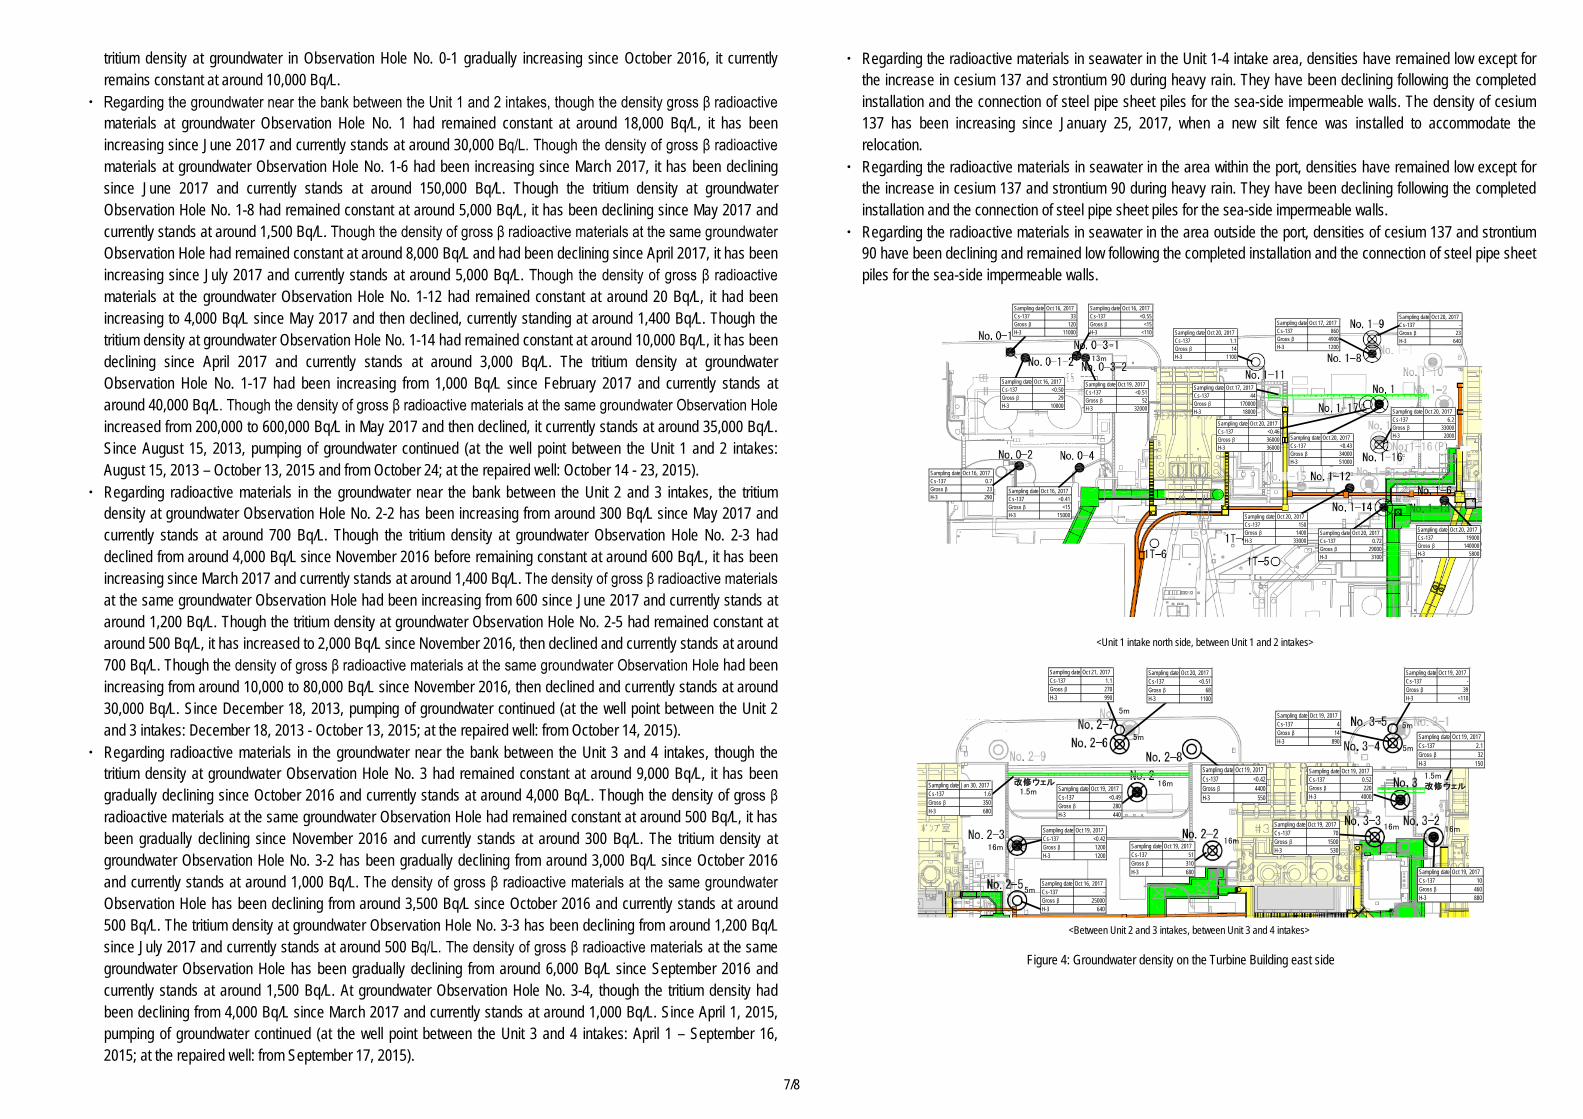
tritium density at groundwater in Observation Hole No. 0-1 gradually increasing since October 2016, it currently remains constant at around 10,000 Bq/L.
・ Regarding the groundwater near the bank between the Unit 1 and 2 intakes, though the density gross β radioactive materials at groundwater Observation Hole No. 1 had remained constant at around 18,000 Bq/L, it has been increasing since June 2017 and currently stands at around 30,000 Bq/L. Though the density of gross β radioactive materials at groundwater Observation Hole No. 1-6 had been increasing since March 2017, it has been declining since June 2017 and currently stands at around 150,000 Bq/L. Though the tritium density at groundwater Observation Hole No. 1-8 had remained constant at around 5,000 Bq/L, it has been declining since May 2017 and currently stands at around 1,500 Bq/L. Though the density of gross β radioactive materials at the same groundwater Observation Hole had remained constant at around 8,000 Bq/L and had been declining since April 2017, it has been increasing since July 2017 and currently stands at around 5,000 Bq/L. Though the density of gross β radioactive materials at the groundwater Observation Hole No. 1-12 had remained constant at around 20 Bq/L, it had been increasing to 4,000 Bq/L since May 2017 and then declined, currently standing at around 1,400 Bq/L. Though the tritium density at groundwater Observation Hole No. 1-14 had remained constant at around 10,000 Bq/L, it has been declining since April 2017 and currently stands at around 3,000 Bq/L. The tritium density at groundwater Observation Hole No. 1-17 had been increasing from 1,000 Bq/L since February 2017 and currently stands at around 40,000 Bq/L. Though the density of gross β radioactive materials at the same groundwater Observation Hole increased from 200,000 to 600,000 Bq/L in May 2017 and then declined, it currently stands at around 35,000 Bq/L. Since August 15, 2013, pumping of groundwater continued (at the well point between the Unit 1 and 2 intakes: August 15, 2013 – October 13, 2015 and from October 24; at the repaired well: October 14 - 23, 2015).
・ Regarding radioactive materials in the groundwater near the bank between the Unit 2 and 3 intakes, the tritium density at groundwater Observation Hole No. 2-2 has been increasing from around 300 Bq/L since May 2017 and currently stands at around 700 Bq/L. Though the tritium density at groundwater Observation Hole No. 2-3 had declined from around 4,000 Bq/L since November 2016 before remaining constant at around 600 Bq/L, it has been increasing since March 2017 and currently stands at around 1,400 Bq/L. The density of gross β radioactive materials at the same groundwater Observation Hole had been increasing from 600 since June 2017 and currently stands at around 1,200 Bq/L. Though the tritium density at groundwater Observation Hole No. 2-5 had remained constant at around 500 Bq/L, it has increased to 2,000 Bq/L since November 2016, then declined and currently stands at around 700 Bq/L. Though the density of gross β radioactive materials at the same groundwater Observation Hole had been increasing from around 10,000 to 80,000 Bq/L since November 2016, then declined and currently stands at around 30,000 Bq/L. Since December 18, 2013, pumping of groundwater continued (at the well point between the Unit 2 and 3 intakes: December 18, 2013 - October 13, 2015; at the repaired well: from October 14, 2015).
・ Regarding radioactive materials in the groundwater near the bank between the Unit 3 and 4 intakes, though the tritium density at groundwater Observation Hole No. 3 had remained constant at around 9,000 Bq/L, it has been gradually declining since October 2016 and currently stands at around 4,000 Bq/L. Though the density of gross β radioactive materials at the same groundwater Observation Hole had remained constant at around 500 Bq/L, it has been gradually declining since November 2016 and currently stands at around 300 Bq/L. The tritium density at groundwater Observation Hole No. 3-2 has been gradually declining from around 3,000 Bq/L since October 2016 and currently stands at around 1,000 Bq/L. The density of gross β radioactive materials at the same groundwater Observation Hole has been declining from around 3,500 Bq/L since October 2016 and currently stands at around 500 Bq/L. The tritium density at groundwater Observation Hole No. 3-3 has been declining from around 1,200 Bq/L since July 2017 and currently stands at around 500 Bq/L. The density of gross β radioactive materials at the same groundwater Observation Hole has been gradually declining from around 6,000 Bq/L since September 2016 and currently stands at around 1,500 Bq/L. At groundwater Observation Hole No. 3-4, though the tritium density had been declining from 4,000 Bq/L since March 2017 and currently stands at around 1,000 Bq/L. Since April 1, 2015, pumping of groundwater continued (at the well point between the Unit 3 and 4 intakes: April 1 – September 16, 2015; at the repaired well: from September 17, 2015).
・ Regarding the radioactive materials in seawater in the Unit 1-4 intake area, densities have remained low except for the increase in cesium 137 and strontium 90 during heavy rain. They have been declining following the completed installation and the connection of steel pipe sheet piles for the sea-side impermeable walls. The density of cesium 137 has been increasing since January 25, 2017, when a new silt fence was installed to accommodate the relocation.
・ Regarding the radioactive materials in seawater in the area within the port, densities have remained low except for the increase in cesium 137 and strontium 90 during heavy rain. They have been declining following the completed installation and the connection of steel pipe sheet piles for the sea-side impermeable walls.
・ Regarding the radioactive materials in seawater in the area outside the port, densities of cesium 137 and strontium 90 have been declining and remained low following the completed installation and the connection of steel pipe sheet piles for the sea-side impermeable walls.
<Unit 1 intake north side, between Unit 1 and 2 intakes>
Figure 4: Groundwater density on the Turbine Building east side
<Between Unit 2 and 3 intakes, between Unit 3 and 4 intakes>
13m
Sampling date Oct 19, 2017Cs-137 <0.51Gross β 52H-3 32000
Sampling date Oct 16, 2017Cs-137 33Gross β 120H-3 11000
Sampling date Oct 16, 2017Cs-137 0.7Gross β 23H-3 290
Sampling date Oct 16, 2017Cs-137 <0.55Gross β <15H-3 <110
Sampling date Oct 20, 2017Cs-137 <0.43Gross β 34000H-3 51000
Sampling date Oct 17, 2017Cs-137 860Gross β 4900H-3 1200
Sampling date Oct 20, 2017Cs-137 -Gross β 23H-3 640
Sampling date Oct 20, 2017Cs-137 <0.46Gross β 36000H-3 36000
Sampling date Oct 17, 2017Cs-137 44Gross β 170000H-3 18000
Sampling date Oct 16, 2017Cs-137 <0.41Gross β <15H-3 15000
Sampling date Oct 20, 2017Cs-137 0.72Gross β 29000H-3 3100
Sampling date Oct 20, 2017Cs-137 1.1Gross β 14H-3 1100
Sampling date Oct 20, 2017Cs-137 19000Gross β 140000H-3 5800
Sampling date Oct 16, 2017Cs-137 <0.50Gross β 29H-3 10000
Sampling date Oct 20, 2017Cs-137 150Gross β 1400H-3 33000
Sampling date Oct 20, 2017Cs-137 6.2Gross β 33000H-3 2000
1.5m
1.5m
16m16m
5m
5m
16m 16m
5m
5m
改修ウェル 改修ウェル16m
5m
Sampling date Oct 20, 2017Cs-137 <0.51Gross β 68H-3 1100
Sampling date Oct 16, 2017Cs-137 -Gross β 25000H-3 640
Sampling date Jan 30, 2017Cs-137 1.6Gross β 350H-3 680
Sampling date Oct 19, 2017Cs-137 51Gross β 310H-3 680
Sampling date Oct 19, 2017Cs-137 0.52Gross β 220H-3 4000
Sampling date Oct 19, 2017Cs-137 <0.42Gross β 1200H-3 1200
Sampling date Oct 19, 2017Cs-137 <0.49Gross β 280H-3 440
Sampling date Oct 19, 2017Cs-137 4Gross β 14H-3 890
Sampling date Oct 19, 2017Cs-137 10Gross β 460H-3 880
Sampling date Oct 19, 2017Cs-137 -Gross β 39H-3 <110
Sampling date Oct 19, 2017Cs-137 <0.42Gross β 4400H-3 550
Sampling date Oct 19, 2017Cs-137 70Gross β 1500H-3 530
Sampling date Oct 21, 2017Cs-137 1.1Gross β 270H-3 990
Sampling date Oct 19, 2017Cs-137 2.1Gross β 32H-3 150
8/8
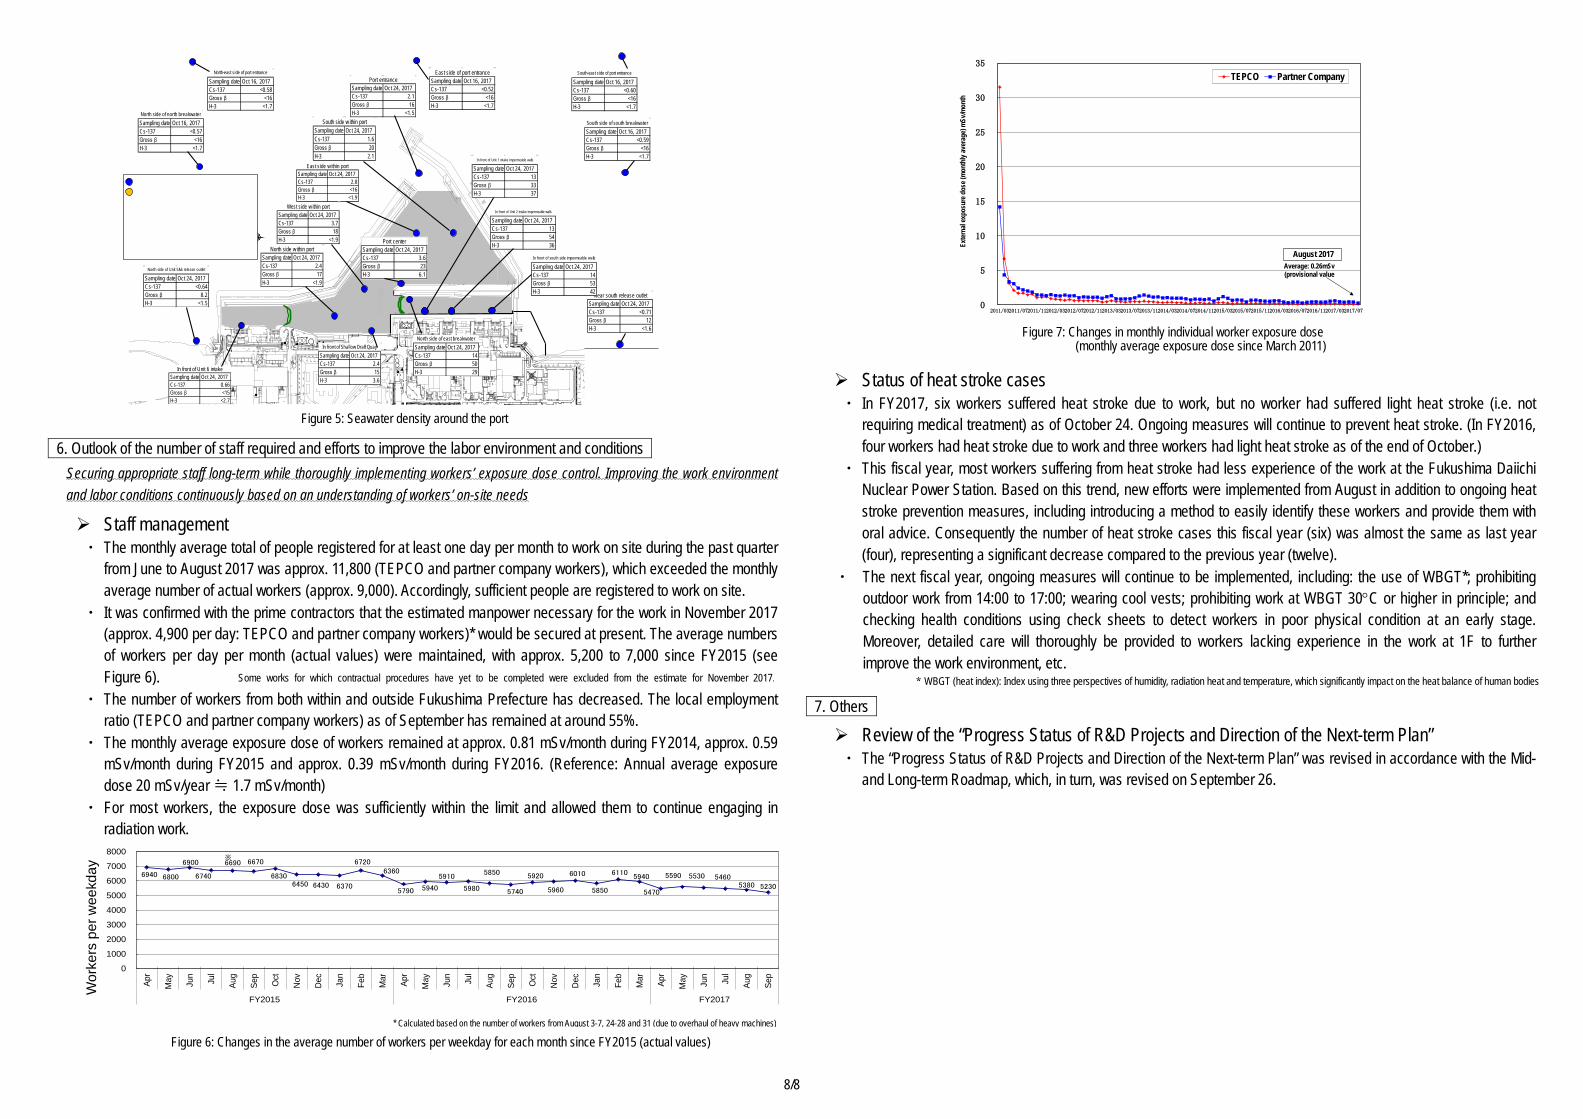
6. Outlook of the number of staff required and efforts to improve the labor environment and conditions Securing appropriate staff long-term while thoroughly implementing workers’ exposure dose control. Improving the work environment and labor conditions continuously based on an understanding of workers’ on-site needs
Staff management ・ The monthly average total of people registered for at least one day per month to work on site during the past quarter
from June to August 2017 was approx. 11,800 (TEPCO and partner company workers), which exceeded the monthly average number of actual workers (approx. 9,000). Accordingly, sufficient people are registered to work on site.
・ It was confirmed with the prime contractors that the estimated manpower necessary for the work in November 2017 (approx. 4,900 per day: TEPCO and partner company workers)* would be secured at present. The average numbers of workers per day per month (actual values) were maintained, with approx. 5,200 to 7,000 since FY2015 (see Figure 6).
・ The number of workers from both within and outside Fukushima Prefecture has decreased. The local employment ratio (TEPCO and partner company workers) as of September has remained at around 55%.
・ The monthly average exposure dose of workers remained at approx. 0.81 mSv/month during FY2014, approx. 0.59 mSv/month during FY2015 and approx. 0.39 mSv/month during FY2016. (Reference: Annual average exposure dose 20 mSv/year ≒ 1.7 mSv/month)
・ For most workers, the exposure dose was sufficiently within the limit and allowed them to continue engaging in radiation work.
Status of heat stroke cases ・ In FY2017, six workers suffered heat stroke due to work, but no worker had suffered light heat stroke (i.e. not
requiring medical treatment) as of October 24. Ongoing measures will continue to prevent heat stroke. (In FY2016, four workers had heat stroke due to work and three workers had light heat stroke as of the end of October.)
・ This fiscal year, most workers suffering from heat stroke had less experience of the work at the Fukushima Daiichi Nuclear Power Station. Based on this trend, new efforts were implemented from August in addition to ongoing heat stroke prevention measures, including introducing a method to easily identify these workers and provide them with oral advice. Consequently the number of heat stroke cases this fiscal year (six) was almost the same as last year (four), representing a significant decrease compared to the previous year (twelve).
・ The next fiscal year, ongoing measures will continue to be implemented, including: the use of WBGT*; prohibiting outdoor work from 14:00 to 17:00; wearing cool vests; prohibiting work at WBGT 30°C or higher in principle; and checking health conditions using check sheets to detect workers in poor physical condition at an early stage. Moreover, detailed care will thoroughly be provided to workers lacking experience in the work at 1F to further improve the work environment, etc.
7. Others
Review of the “Progress Status of R&D Projects and Direction of the Next-term Plan” ・ The “Progress Status of R&D Projects and Direction of the Next-term Plan” was revised in accordance with the Mid-
and Long-term Roadmap, which, in turn, was revised on September 26.
6940 6800
6900
6740
6690 6670
6830 6450 6430 6370
6720 6360
5790 5940
5910
5980
5850
5740
5920
5960
6010
5850
6110 5940
5470
5590 5530 5460 5380 5230
0
1000
2000
3000
4000
5000
6000
7000
8000
Apr
May Jun
Jul
Aug
Sep
Oct
Nov
Dec Jan
Feb
Mar Ap
r
May Jun
Jul
Aug
Sep
Oct
Nov
Dec Jan
Feb
Mar Ap
r
May Jun
Jul
Aug
Sep
FY2015 FY2016 FY2017
※
Some works for which contractual procedures have yet to be completed were excluded from the estimate for November 2017. * WBGT (heat index): Index using three perspectives of humidity, radiation heat and temperature, which significantly impact on the heat balance of human bodies
Figure 5: Seawater density around the port
Figure 6: Changes in the average number of workers per weekday for each month since FY2015 (actual values)
* Calculated based on the number of workers from August 3-7, 24-28 and 31 (due to overhaul of heavy machines)
Figure 7: Changes in monthly individual worker exposure dose (monthly average exposure dose since March 2011)
Sampling date Oct 24, 2017Cs-137 0.66Gross β <15H-3 <2.7
In front of Unit 6 intake
Sampling date Oct 24, 2017Cs-137 2.4Gross β 15H-3 3.6
In front of Shallow Draft Quay
Sampling date Oct 24, 2017Cs-137 2.8Gross β <16H-3 <1.9
East side w ithin port
Sampling date Oct 24, 2017Cs-137 3.7Gross β 18H-3 <1.9
West side w ithin port
Sampling date Oct 24, 2017Cs-137 2.4Gross β 17H-3 <1.9
North side w ithin port
Sampling date Oct 24, 2017Cs-137 1.6Gross β 20H-3 2.1
South side w ithin port
Sampling date Oct 24, 2017Cs-137 <0.64Gross β 8.2H-3 <1.5
North side of Unit 5&6 release outlet
Sampling date Oct 24, 2017Cs-137 <0.71Gross β 12H-3 <1.6
Near south release outlet
Sampling date Oct 24, 2017Cs-137 2.1Gross β 16H-3 <1.5
Port entrance
Sampling date Oct 16, 2017Cs-137 <0.57Gross β <16H-3 <1.7
North side of north breakwater
Sampling date Oct 16, 2017Cs-137 <0.58Gross β <16H-3 <1.7
North-east side of port entrance
Sampling date Oct 16, 2017Cs-137 <0.52Gross β <16H-3 <1.7
East side of port entranceSampling date Oct 16, 2017Cs-137 <0.60Gross β <16H-3 <1.7
South-east side of port entrance
Sampling date Oct 16, 2017Cs-137 <0.59Gross β <16H-3 <1.7
South side of south breakwater
Sampling date Oct 24, 2017Cs-137 14Gross β 50H-3 29
North side of east breakwater
Sampling date Oct 24, 2017Cs-137 13Gross β 33H-3 37
In front of Unit 1 intake impermeable walls
Sampling date Oct 24, 2017Cs-137 13Gross β 54H-3 36
In front of Unit 2 intake impermeable walls
Sampling date Oct 24, 2017Cs-137 14Gross β 53H-3 42
In front of south side impermeable walls
Sampling date Oct 24, 2017Cs-137 3.6Gross β 23H-3 6.1
Port center
Wor
kers
per
wee
kday
0
5
10
15
20
25
30
35
2011/032011/072011/112012/032012/072012/112013/032013/072013/112014/032014/072014/112015/032015/072015/112016/032016/072016/112017/032017/07
Exte
rnal
expo
sure
dos
e (m
onth
ly av
erag
e) m
Sv/m
onth
TEPCO Partner Company
August 2017Average: 0.26mSv (provisional value
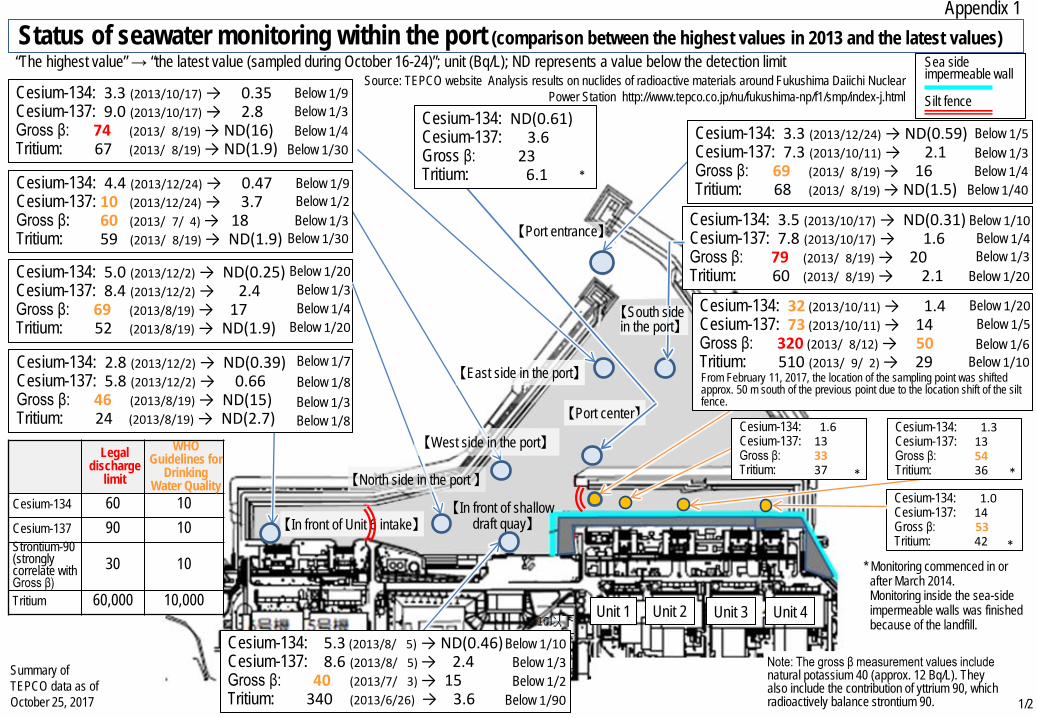
Cesium-134: 3.3 (2013/10/17) → 0.35 Cesium-137: 9.0 (2013/10/17) → 2.8 Gross β: 74 (2013/ 8/19) → ND(16) Tritium: 67 (2013/ 8/19) → ND(1.9)
Sea side impermeable wall Silt fence
Cesium-134: 4.4 (2013/12/24) → 0.47 Cesium-137: 10 (2013/12/24) → 3.7 Gross β: 60 (2013/ 7/ 4) → 18 Tritium: 59 (2013/ 8/19) → ND(1.9)
Cesium-134: 5.0 (2013/12/2) → ND(0.25) Cesium-137: 8.4 (2013/12/2) → 2.4 Gross β: 69 (2013/8/19) → 17 Tritium: 52 (2013/8/19) → ND(1.9)
Cesium-134: 2.8 (2013/12/2) → ND(0.39) Cesium-137: 5.8 (2013/12/2) → 0.66 Gross β: 46 (2013/8/19) → ND(15) Tritium: 24 (2013/8/19) → ND(2.7)
Cesium-134: 3.5 (2013/10/17) → ND(0.31) Cesium-137: 7.8 (2013/10/17) → 1.6 Gross β: 79 (2013/ 8/19) → 20 Tritium: 60 (2013/ 8/19) → 2.1
Below 1/10
Below 1/3 Below 1/20
Below 1/4 Below 1/30
Below 1/9
Below 1/3 Below 1/30
Below 1/20
Below 1/4 Below 1/20
Below 1/3 Below 1/8
Cesium-134: 3.3 (2013/12/24) → ND(0.59) Cesium-137: 7.3 (2013/10/11) → 2.1 Gross β: 69 (2013/ 8/19) → 16 Tritium: 68 (2013/ 8/19) → ND(1.5)
Below 1/5
Below 1/4 Below 1/40
Cesium-134: 32 (2013/10/11) → 1.4 Cesium-137: 73 (2013/10/11) → 14 Gross β: 320 (2013/ 8/12) → 50 Tritium: 510 (2013/ 9/ 2) → 29
Below 1/20 Below 1/5 Below 1/6
Below 1/10 From February 11, 2017, the location of the sampling point was shifted approx. 50 m south of the previous point due to the location shift of the silt fence.
Cesium-134: 1.0 Cesium-137: 14 Gross β: 53 Tritium: 42 *
* Monitoring commenced in or after March 2014.
Monitoring inside the sea-side impermeable walls was finished because of the landfill.
Status of seawater monitoring within the port (comparison between the highest values in 2013 and the latest values) “The highest value” → “the latest value (sampled during October 16-24)”; unit (Bq/L); ND represents a value below the detection limit
Summary of TEPCO data as of October 25, 2017
【East side in the port】
【West side in the port】
【North side in the port 】
【In front of Unit 6 intake】 【In front of shallow
draft quay】
Source: TEPCO website Analysis results on nuclides of radioactive materials around Fukushima Daiichi Nuclear Power Station http://www.tepco.co.jp/nu/fukushima-np/f1/smp/index-j.html
Appendix 1
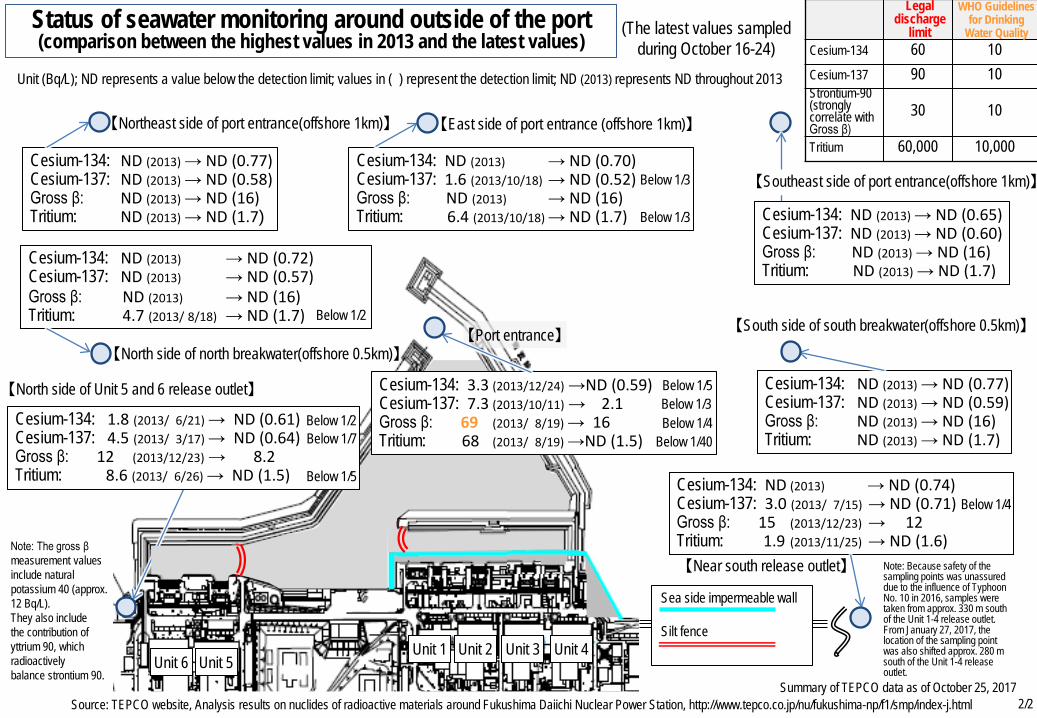
Note: The gross β measurement values include natural potassium 40 (approx. 12 Bq/L). They also include the contribution of yttrium 90, which radioactively balance strontium 90.
Legal discharge
limit
WHO Guidelines for
Drinking Water Quality
Cesium-134 60 10 Cesium-137 90 10 Strontium-90 (strongly correlate with Gross β)
30 10
Tritium 60,000 10,000
【Port center】
【South side in the port】
Cesium-134: ND(0.61) Cesium-137: 3.6 Gross β: 23 Tritium: 6.1
Below 1/7
*
1/2
【Port entrance】
Below 1/9 Below 1/3
Below 1/2
Below 1/3
Below 1/8
Below 1/3
Below 1/4
Unit 1 Unit 2 Unit 3 Unit 4
Unit 6 Unit 5
Cesium-134: 5.3 (2013/8/ 5) → ND(0.46) Cesium-137: 8.6 (2013/8/ 5) → 2.4 Gross β: 40 (2013/7/ 3) → 15 Tritium: 340 (2013/6/26) → 3.6
Below 1/10 Below 1/3
Below 1/90
Cesium-134: 1.3 Cesium-137: 13 Gross β: 54 Tritium: 36
Cesium-134: 1.6 Cesium-137: 13 Gross β: 33 Tritium: 37 * *
Below 1/2
【East side of port entrance (offshore 1km)】
【South side of south breakwater(offshore 0.5km)】
【North side of north breakwater(offshore 0.5km)】
Unit 1 Unit 2 Unit 3 Unit 4
Unit (Bq/L); ND represents a value below the detection limit; values in ( ) represent the detection limit; ND (2013) represents ND throughout 2013
Source: TEPCO website, Analysis results on nuclides of radioactive materials around Fukushima Daiichi Nuclear Power Station, http://www.tepco.co.jp/nu/fukushima-np/f1/smp/index-j.html
【North side of Unit 5 and 6 release outlet】
【Near south release outlet】
Status of seawater monitoring around outside of the port (comparison between the highest values in 2013 and the latest values)
Summary of TEPCO data as of October 25, 2017
【Northeast side of port entrance(offshore 1km)】
【Port entrance】
Sea side impermeable wall Silt fence
(The latest values sampled during October 16-24)
Cesium-134: ND (2013) → ND (0.77) Cesium-137: ND (2013) → ND (0.58) Gross β: ND (2013) → ND (16) Tritium: ND (2013) → ND (1.7)
Cesium-134: ND (2013) → ND (0.70) Cesium-137: 1.6 (2013/10/18) → ND (0.52) Gross β: ND (2013) → ND (16) Tritium: 6.4 (2013/10/18) → ND (1.7) Below 1/3
Below 1/3
Cesium-134: ND (2013) → ND (0.72) Cesium-137: ND (2013) → ND (0.57) Gross β: ND (2013) → ND (16) Tritium: 4.7 (2013/ 8/18) → ND (1.7) Below 1/2
Cesium-134: ND (2013) → ND (0.77) Cesium-137: ND (2013) → ND (0.59) Gross β: ND (2013) → ND (16) Tritium: ND (2013) → ND (1.7)
Cesium-134: ND (2013) → ND (0.74) Cesium-137: 3.0 (2013/ 7/15) → ND (0.71) Gross β: 15 (2013/12/23) → 12 Tritium: 1.9 (2013/11/25) → ND (1.6)
2/2
Unit 6 Unit 5
Below 1/4
Legal discharge
limit
WHO Guidelines for Drinking
Water Quality Cesium-134 60 10 Cesium-137 90 10 Strontium-90 (strongly correlate with Gross β)
30 10
Tritium 60,000 10,000
Note: The gross β measurement values include natural potassium 40 (approx. 12 Bq/L). They also include the contribution of yttrium 90, which radioactively balance strontium 90.
【Southeast side of port entrance(offshore 1km)】
Cesium-134: ND (2013) → ND (0.65) Cesium-137: ND (2013) → ND (0.60) Gross β: ND (2013) → ND (16) Tritium: ND (2013) → ND (1.7)
Note: Because safety of the sampling points was unassured due to the influence of Typhoon No. 10 in 2016, samples were taken from approx. 330 m south of the Unit 1-4 release outlet. From January 27, 2017, the location of the sampling point was also shifted approx. 280 m south of the Unit 1-4 release outlet.
Cesium-134: 3.3 (2013/12/24) →ND (0.59) Cesium-137: 7.3 (2013/10/11) → 2.1 Gross β: 69 (2013/ 8/19) → 16 Tritium: 68 (2013/ 8/19) →ND (1.5)
Cesium-134: 1.8 (2013/ 6/21) → ND (0.61) Cesium-137: 4.5 (2013/ 3/17) → ND (0.64) Gross β: 12 (2013/12/23) → 8.2 Tritium: 8.6 (2013/ 6/26) → ND (1.5)
Below 1/2 Below 1/7
Below 1/5
Below 1/5
Below 1/4 Below 1/40
Below 1/3
MP-6
MP-8
G
B C
F
F
F
0m 100m 500m 1000m
H3
Rubbbl
C
G3・G4・G5
J1
G7
K1
J5
MP-7
H5 H6
H8 E
H9 D
J2
K1 K2
H1
J3 J4
J6 J7
K3
J8
K4
J9
MP-4
MP-2
MP-3
MP-5
サブドレン他浄化設備等
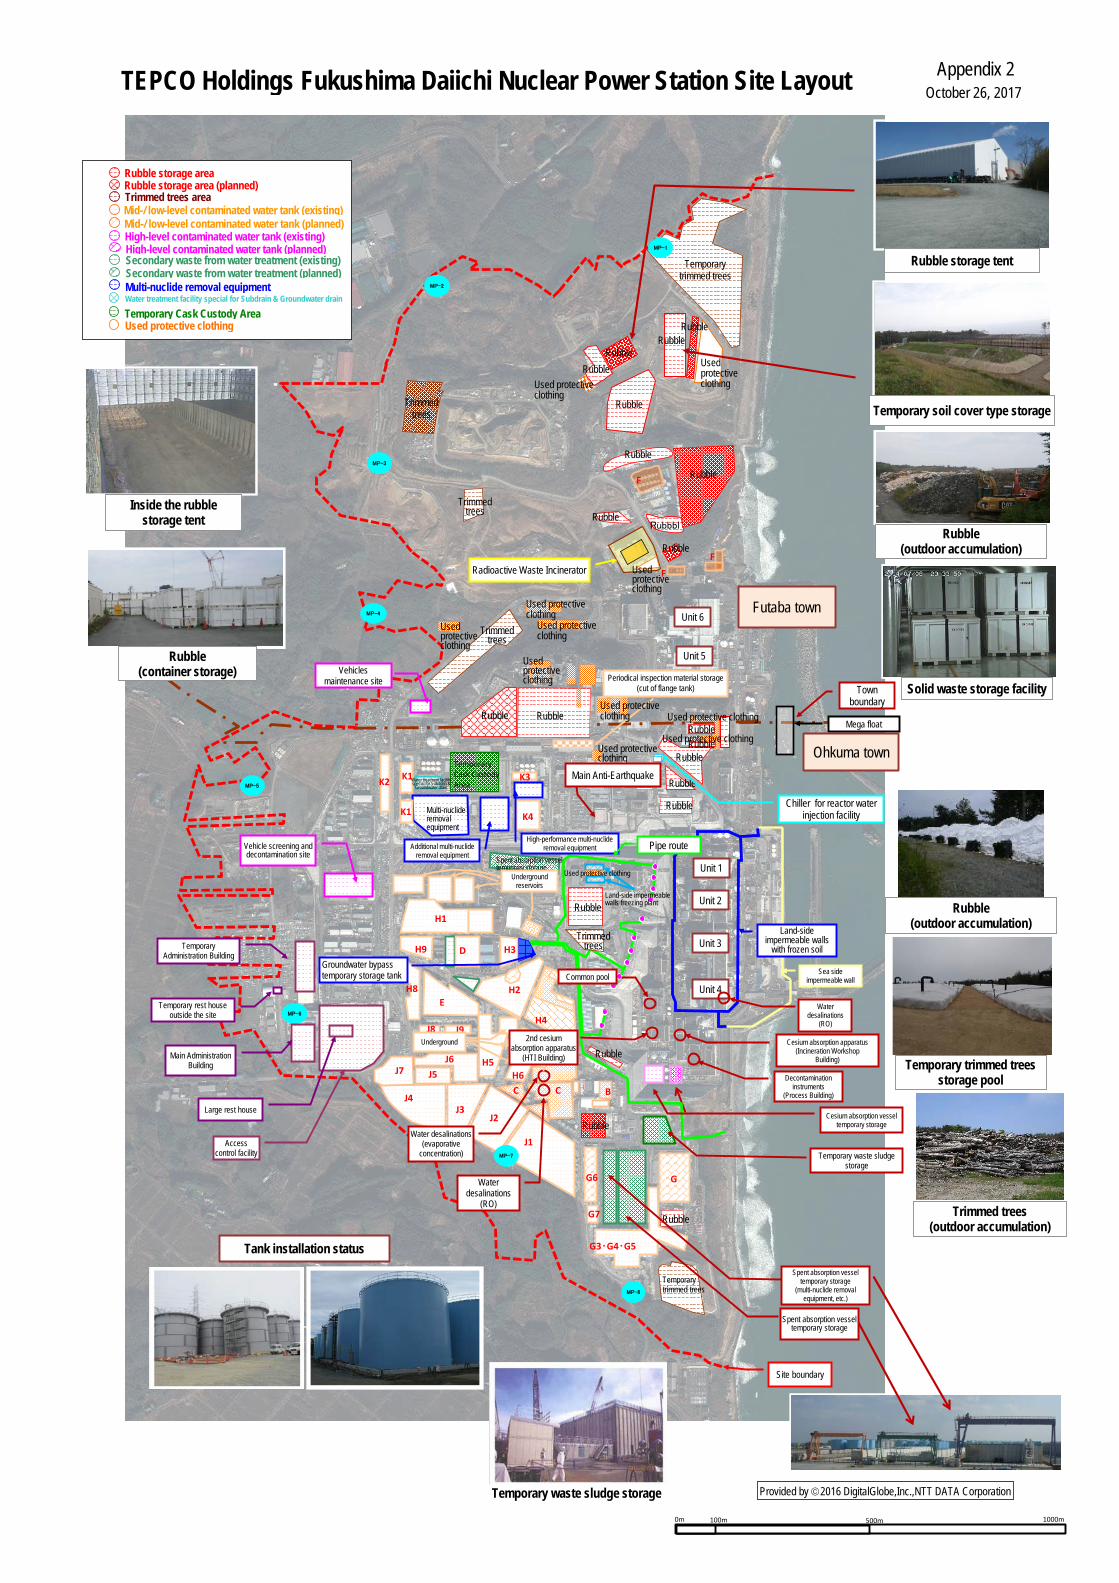
使用済保護衣等 Used protective clothing
Secondary waste from water treatment (existing) Secondary waste from water treatment (planned)
Rubble storage area
Trimmed trees area Mid-/ low-level contaminated water tank (existing)
High-level contaminated water tank (existing) Mid-/ low-level contaminated water tank (planned)
High-level contaminated water tank (planned)
Rubble storage area (planned)
Temporary Cask Custody Area
Multi-nuclide removal equipment Water treatment facility special for Subdrain & Groundwater drain
TEPCO Holdings Fukushima Daiichi Nuclear Power Station Site Layout
Inside the rubble storage tent
Rubble (container storage)
Appendix 2 October 26, 2017
Rubble (outdoor accumulation)
Rubble storage tent
Temporary soil cover type storage
Solid waste storage facility
Temporary trimmed trees storage pool
Rubble (outdoor accumulation)
Trimmed trees (outdoor accumulation)
Provided by 2016 DigitalGlobe,Inc.,NTT DATA Corporation
Tank installation status
Temporary waste sludge storage
Used protective clothing
Rubble
Used protective clothing
Rubble
Rubble
Rubble
Rubble
Rubble
Rubble
Rubble
Rubble
Used protective clothing
Radioactive Waste Incinerator
Trimmed trees
Trimmed trees
Futaba town Used protective clothing
Used protective clothing
Used protective clothing
Trimmed trees
Rubble
Used protective clothing
Used protective clothing
Rubble
Vehicles maintenance site Periodical inspection material storage
(cut of flange tank)
Used protective clothing Used protective clothing
Rubble
Used protective clothing
Rubble
Rubble
Rubble
Vehicle screening and decontamination site
Rubble
Unit 5
Unit 6
Town boundary
Mega float
Ohkuma town
Chiller for reactor water injection facility
Main Anti-Earthquake
High-performance multi-nuclide removal equipment Pipe route
Spent absorption vessel temporary storage
Underground reservoirs
Used protective clothing
Rubble Land-side impermeable walls freezing plant
Trimmed trees
Unit 1
Unit 2
Unit 3
Unit 4
Land-side impermeable walls
with frozen soil
Sea side impermeable wall
Water desalinations
(RO)
Cesium absorption apparatus (Incineration Workshop
Building)
Decontamination instruments
(Process Building)
Cesium absorption vessel temporary storage
Temporary waste sludge storage
Spent absorption vessel temporary storage
Site boundary
Rubble
Rubble
Temporary trimmed trees
Groundwater bypass temporary storage tank
Temporary Administration Building
Temporary rest house outside the site
Main Administration Building
Large rest house
Access control facility
Water desalinations (evaporative
concentration)
Water desalinations
(RO)
Underground
Temporary Cask Custody Area
Water treatment facility special for Subdrain &
Groundwater drain
Multi-nuclide removal equipment
Additional multi-nuclide removal equipment
Common pool
G
H4
Spent absorption vessel temporary storage
(multi-nuclide removal equipment, etc.)
MP-1
Temporary trimmed trees
H2
2nd cesium absorption apparatus
(HTI Building) Rubble
G6
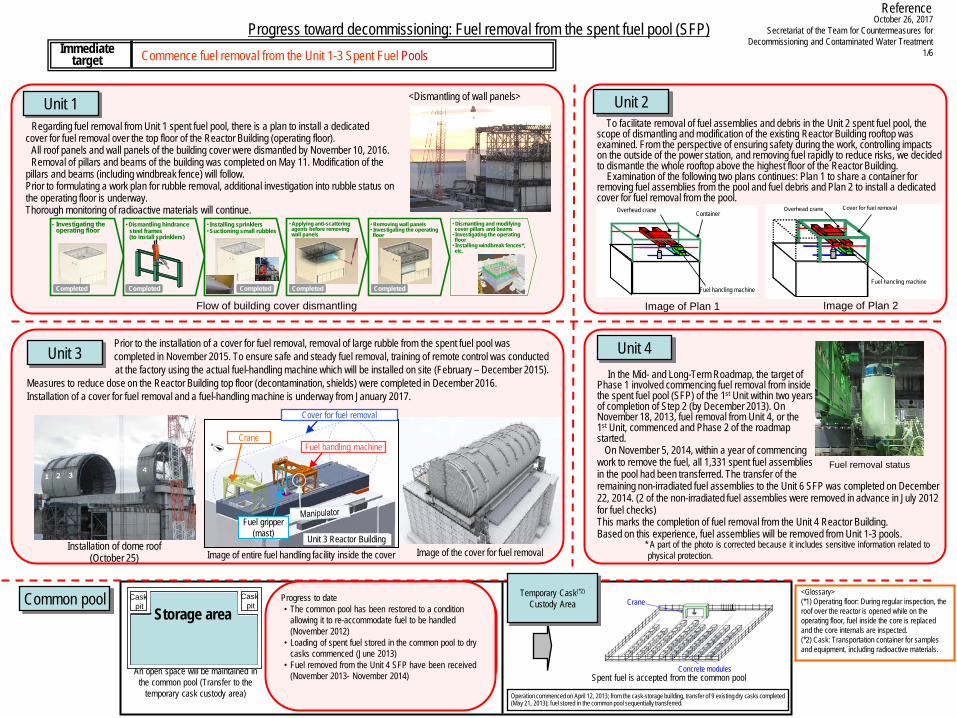
Regarding fuel removal from Unit 1 spent fuel pool, there is a plan to install a dedicated cover for fuel removal over the top floor of the Reactor Building (operating floor).
All roof panels and wall panels of the building cover were dismantled by November 10, 2016. Removal of pillars and beams of the building was completed on May 11. Modification of the
pillars and beams (including windbreak fence) will follow. Prior to formulating a work plan for rubble removal, additional investigation into rubble status on the operating floor is underway. Thorough monitoring of radioactive materials will continue.
To facilitate removal of fuel assemblies and debris in the Unit 2 spent fuel pool, the scope of dismantling and modification of the existing Reactor Building rooftop was examined. From the perspective of ensuring safety during the work, controlling impacts on the outside of the power station, and removing fuel rapidly to reduce risks, we decided to dismantle the whole rooftop above the highest floor of the Reactor Building. Examination of the following two plans continues: Plan 1 to share a container for removing fuel assemblies from the pool and fuel debris and Plan 2 to install a dedicated cover for fuel removal from the pool.
In the Mid- and Long-Term Roadmap, the target of Phase 1 involved commencing fuel removal from inside the spent fuel pool (SFP) of the 1st Unit within two years of completion of Step 2 (by December 2013). On November 18, 2013, fuel removal from Unit 4, or the 1st Unit, commenced and Phase 2 of the roadmap started. On November 5, 2014, within a year of commencing work to remove the fuel, all 1,331 spent fuel assemblies in the pool had been transferred. The transfer of the remaining non-irradiated fuel assemblies to the Unit 6 SFP was completed on December 22, 2014. (2 of the non-irradiated fuel assemblies were removed in advance in July 2012 for fuel checks) This marks the completion of fuel removal from the Unit 4 Reactor Building. Based on this experience, fuel assemblies will be removed from Unit 1-3 pools.
Prior to the installation of a cover for fuel removal, removal of large rubble from the spent fuel pool was completed in November 2015. To ensure safe and steady fuel removal, training of remote control was conducted
at the factory using the actual fuel-handling machine which will be installed on site (February – December 2015). Measures to reduce dose on the Reactor Building top floor (decontamination, shields) were completed in December 2016. Installation of a cover for fuel removal and a fuel-handling machine is underway from January 2017.
Unit 3 Unit 4
* A part of the photo is corrected because it includes sensitive information related to physical protection.
Unit 1 Unit 2
Image of Plan 1 Image of Plan 2 Flow of building cover dismantling
October 26, 2017 Secretariat of the Team for Countermeasures for
Decommissioning and Contaminated Water Treatment 1/6
Progress toward decommissioning: Fuel removal from the spent fuel pool (SFP) Commence fuel removal from the Unit 1-3 Spent Fuel Pools Immediate target
Reference
Common pool
An open space will be maintained in the common pool (Transfer to the
temporary cask custody area)
Progress to date ・ The common pool has been restored to the condition
whereby it can re-accommodate fuel to be handled (November 2012)
・ Loading of spent fuel stored in the common pool to dry casks commenced (June 2013)
・ Fuel removed from the Unit 4 spent fuel pool began to be received (November 2013) Spent fuel is accepted from the common pool
Temporary Cask(*2) Custody Area
Operation commenced on April 12, 2013; from the cask-storage building, transfer of 9 existing dry casks completed (May 21, 2013); fuel stored in the common pool sequentially transferred.
<Glossary> (*1) Operating floor: During regular inspection, the roof over the reactor is opened while on the operating floor, fuel inside the core is replaced and the core internals are inspected. (*2) Cask: Transportation container for samples and equipment, including radioactive materials.
Progress to date ・The common pool has been restored to a condition
allowing it to re-accommodate fuel to be handled (November 2012)
・Loading of spent fuel stored in the common pool to dry casks commenced (June 2013)
・Fuel removed from the Unit 4 SFP have been received (November 2013- November 2014)
Container
Fuel hancling machine
Overhead crane Overhead crane Cover for fuel removal
Fuel hancling machine
Image of the cover for fuel removal
Fuel removal status
N
3号機原子炉建屋
Cover for fuel removal
Fuel handling machine Crane
Fuel gripper (mast) Unit 3 Reactor Building
Image of entire fuel handling facility inside the cover
<Dismantling of wall panels>
Installation of dome roof (October 25)
- Investigating theoperating floor
・Dismantling hindrance steel frames(to install sprinklers)
・Installing sprinklers・Suctioning small rubbles
・Removing wall panels・Investigating the operating floor
・Dismantling and modifying cover pillars and beams・Investigating the operating floor・Installing windbreak fences*, etc.
・Applying anti-scatteringagents before removingwall panels
Completed Completed Completed Completed Completed
Cask pit Storage area
Cask pit
Concrete modules
Crane
1 2 34
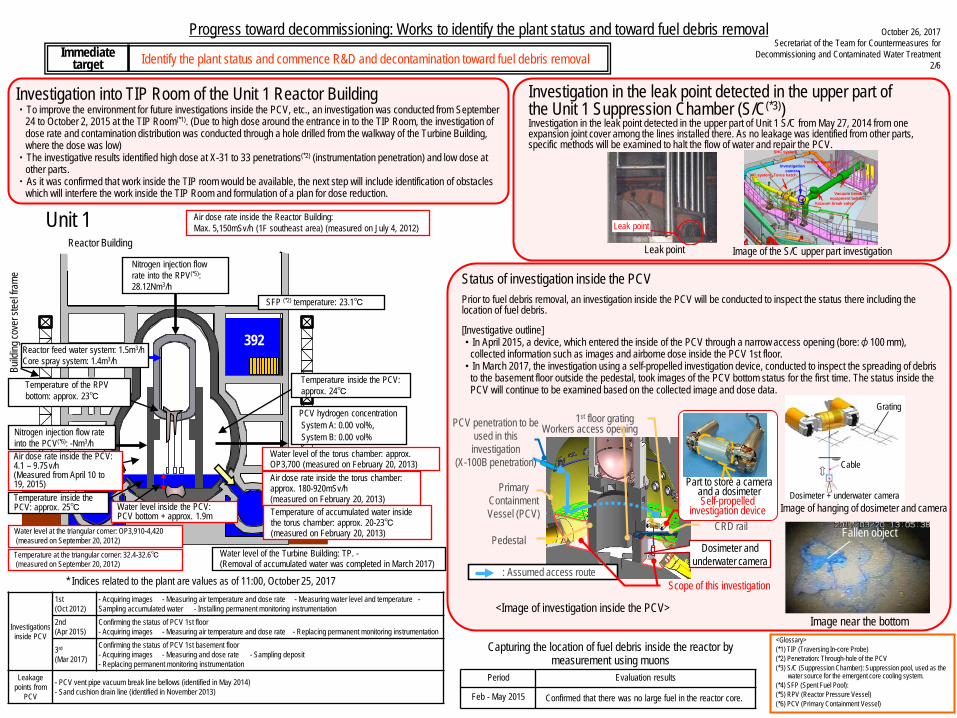
Progress toward decommissioning: Works to identify the plant status and toward fuel debris removal
Identify the plant status and commence R&D and decontamination toward fuel debris removal Immediate target
* Indices related to the plant are values as of 11:00, October 25, 2017
Unit 1
October 26, 2017 Secretariat of the Team for Countermeasures for
Decommissioning and Contaminated Water Treatment 2/6
Status of investigation inside the PCV Prior to fuel debris removal, an investigation inside the PCV will be conducted to inspect the status there including the location of fuel debris.
[Investigative outline] ・In April 2015, a device, which entered the inside of the PCV through a narrow access opening (bore:φ100 mm),
collected information such as images and airborne dose inside the PCV 1st floor. ・In March 2017, the investigation using a self-propelled investigation device, conducted to inspect the spreading of debris
to the basement floor outside the pedestal, took images of the PCV bottom status for the first time. The status inside the PCV will continue to be examined based on the collected image and dose data.
<Glossary> (*1) TIP (Traversing In-core Probe) (*2) Penetration: Through-hole of the PCV (*3) S/C (Suppression Chamber): Suppression pool, used as the
water source for the emergent core cooling system. (*4) SFP (Spent Fuel Pool): (*5) RPV (Reactor Pressure Vessel) (*6) PCV (Primary Containment Vessel)
Investigation in the leak point detected in the upper part of the Unit 1 Suppression Chamber (S/C(*3)) Investigation in the leak point detected in the upper part of Unit 1 S/C from May 27, 2014 from one expansion joint cover among the lines installed there. As no leakage was identified from other parts, specific methods will be examined to halt the flow of water and repair the PCV.
Image of the S/C upper part investigation Leak point
Leak point
Build
ing co
ver s
teel fr
ame
Air dose rate inside the torus chamber: approx. 180-920mSv/h (measured on February 20, 2013) Temperature of accumulated water inside the torus chamber: approx. 20-23℃ (measured on February 20, 2013)
Water level of the Turbine Building: TP. - (Removal of accumulated water was completed in March 2017)
Temperature at the triangular corner: 32.4-32.6℃ (measured on September 20, 2012)
Water level at the triangular corner: OP3,910-4,420 (measured on September 20, 2012)
Water level inside the PCV: PCV bottom + approx. 1.9m
Nitrogen injection flow rate into the RPV(*5): 28.12Nm3/h
Reactor Building
392
Investigation into TIP Room of the Unit 1 Reactor Building ・To improve the environment for future investigations inside the PCV, etc., an investigation was conducted from September
24 to October 2, 2015 at the TIP Room(*1). (Due to high dose around the entrance in to the TIP Room, the investigation of dose rate and contamination distribution was conducted through a hole drilled from the walkway of the Turbine Building, where the dose was low)
・The investigative results identified high dose at X-31 to 33 penetrations(*2) (instrumentation penetration) and low dose at other parts.
・As it was confirmed that work inside the TIP room would be available, the next step will include identification of obstacles which will interfere the work inside the TIP Room and formulation of a plan for dose reduction.
Investigations inside PCV
1st (Oct 2012)
- Acquiring images - Measuring air temperature and dose rate - Measuring water level and temperature - Sampling accumulated water - Installing permanent monitoring instrumentation
2nd (Apr 2015)
Confirming the status of PCV 1st floor - Acquiring images - Measuring air temperature and dose rate - Replacing permanent monitoring instrumentation
3rd (Mar 2017)
Confirming the status of PCV 1st basement floor - Acquiring images - Measuring and dose rate - Sampling deposit - Replacing permanent monitoring instrumentation
Leakage points from
PCV
- PCV vent pipe vacuum break line bellows (identified in May 2014) - Sand cushion drain line (identified in November 2013)
Vacuum break line
Torus hatch
Vacuum break valve
Investigation camera
Vacuum break equipment bellows
SHC system
AC system
Capturing the location of fuel debris inside the reactor by measurement using muons
Period Evaluation results
Feb - May 2015 Confirmed that there was no large fuel in the reactor core.
Temperature inside the PCV: approx. 25℃
Air dose rate inside the Reactor Building: Max. 5,150mSv/h (1F southeast area) (measured on July 4, 2012)
PCV hydrogen concentration System A: 0.00 vol%, System B: 0.00 vol%
SFP (*2) temperature: 23.1℃
Water level of the torus chamber: approx. OP3,700 (measured on February 20, 2013)
Air dose rate inside the PCV: 4.1 – 9.7Sv/h (Measured from April 10 to 19, 2015)
Nitrogen injection flow rate into the PCV(*6): -Nm3/h
Temperature of the RPV bottom: approx. 23℃
<Image of investigation inside the PCV>
Dosimeter + underwater camera
Cable
Grating
Image of hanging of dosimeter and camera
Image near the bottom
Fallen object
1st floor gratingPCV penetration to be used in this investigation
(X-100B penetration)
Primary Containment Vessel (PCV)
Pedestal
Scope of this investigation
CRD rail
Workers access opening
: Assumed access route
Dosimeter and underwater camera
Part to store a camera and a dosimeterSelf-propelled
investigation device
Reactor feed water system: 1.5m3/h Core spray system: 1.4m3/h
Temperature inside the PCV: approx. 24℃

Progress toward decommissioning: Works to identify the plant status and toward fuel debris removal
Identify the plant status and commence R&D and decontamination toward fuel debris removal Immediate target
* Indices related to plant are values as of 11:00, October 25, 2017
October 26, 2017 Secretariat of the Team for Countermeasures for
Decommissioning and Contaminated Water Treatment 3/6
Status of investigation inside the PCV Prior to fuel debris removal, an investigation inside the PCV will be conducted to inspect the status there including the location of fuel debris. [Investigative outline] ・A robot, injected from Unit 2 X-6 penetration(*1), will access the inside of the pedestal using the CRD rail.
[Progress status] ・As manufacturing of shields necessary for dose reduction around X-6 penetration was completed, a hole was
made in December 2016 at the PCV penetration from which a robot will be injected. ・On January 26 and 30, 2017, a camera was inserted from the PCV penetration to inspect the status of the
CRD replacement rail on which the robot will travel. On February 9, deposit on the access route of the self-propelled investigative device was removed and on February 16, the inside of the PCV was investigated using the device.
・The results of this series of investigations confirmed fallen and deformed gratings and a quantity of deposit inside the pedestal. The evaluation results of the collected information will be utilized in considering the policy for fuel debris removal.
<Glossary> (*1) Penetration: Through-hole of the PCV (*2) SFP (Spent Fuel Pool) (*3) RPV (Reactor Pressure Vessel) (*4) PCV (Primary Containment Vessel) (*5) Tracer: Material used to trace the fluid flow. Clay particles
Scope of investigation inside the PCV
Installation of an RPV thermometer and permanent PCV supervisory instrumentation (1) Replacement of the RPV thermometer ・ As the thermometer installed at the Unit 2 RPV bottom after the earthquake had broken in February 2014, it was excluded
from the monitoring thermometers. ・ On April 2014, removal of the broken thermometer failed and was suspended. Rust-stripping chemicals were injected and
the broken thermometer was removed on January 2015. A new thermometer was reinstalled on March. The thermometer has been used as a part of permanent supervisory instrumentation since April.
(2) Reinstallation of the PCV thermometer and water-level gauge ・Some of the permanent supervisory instrumentation for PCV could not be installed in the planned locations due to
interference with existing grating (August 2013). The instrumentation was removed on May 2014 and new instruments were reinstalled on June 2014. The trend of added instrumentation will be monitored for approx. one month to evaluate its validity.
・The measurement during the installation confirmed that the water level inside the PCV was approx. 300mm from the bottom.
Nitrogen injection flow rate into the PCV(*4): -Nm3/h
Temperature of the RPV bottom: approx. 28℃
Water level inside the PCV: PCV bottom + approx. 300mm
Water level of the Turbine Building: TP. 944 (as of 0:00, October 25, 2017)
Air dose rate inside the PCV: Max. approx. 70Sv/h
Temperature inside the PCV: approx. 32℃
Air dose rate inside the torus chamber: 30-118mSv/h(measured on April 18, 2012) 6-134mSv/h(measured on April 11, 2013)
Water level at the triangular corner: OP3,050-3,190 (measured on June 28, 2012)
Temperature at the triangular corner: 30.2-32.1℃ (measured on June 28, 2012)
Air dose rate inside the Reactor Building: Max. 4,400mSv/h (1F southeast area, upper penetration(*1) surface) (measured on November 16, 2011)
Reactor feed water system: 1.4m3/h Core spray system: 1.5m3/h
Reactor Building Nitrogen injection flow rate into the RPV(*3): 13.56Nm3/h
Unit 2
Investigative results on torus chamber walls ・The torus chamber walls were investigated (on the north side
of the east-side walls) using equipment specially developed for that purpose (a swimming robot and a floor traveling robot).
・At the east-side wall pipe penetrations (five points), “the status” and “existence of flow” were checked.
・A demonstration using the above two types of underwater wall investigative equipment showed how the equipment could check the status of penetration.
・Regarding Penetrations 1 - 5, the results of checking the sprayed tracer (*5) by camera showed no flow around the penetrations. (investigation by the swimming robot)
・Regarding Penetration 3, a sonar check showed no flow around the penetrations. (investigation by the floor traveling robot)
Swimming robot
Floor traveling robot
Penetration (3)
Image of the torus chamber east-side cross-sectional investigation
Penetrations investigated
T/B East-side wall
S/C
Underwater
Swimming robot
R/B 1st floor
Tracer
Sonar
(Investigative equipment insert point)
R/B torus room
615
Capturing the location of fuel debris inside the reactor by measurement using muons Period Evaluation results
Mar – Jul 2016 Confirmed the existence of high-density materials, which was considered as fuel debris, at the bottom of RPV, and in the lower part and the outer periphery of the reactor core. It was assumed that a large part of fuel debris existed at the bottom of RPV.
Fallen grating
Slot opening
Detorted grating
Flat bar
CRD rail end
Approx. 280 mm
Space between CRD railand platform
(approx. 150-40 mm)
CRD housing bracket
CRD lower part
PIP cable LPRM cable
CRD handling machineOpening to access
basementCRD platform
Pedestal
Slot
Flat bar
CRD rail end
(Reference) Inside the Unit 5 pedestal
PCV hydrogen concentration System A: 0.07vol% System B: 0.05vol%
Temperature inside the PCV: approx. 30℃
Water level of the torus chamber: approx. OP3,270 (measured on June 6, 2012)
SFP(*2) temperature: 22.5℃
Investigations inside PCV
1st (Jan 2012) - Acquiring images - Measuring air temperature 2nd (Mar 2012) - Confirming water surface - Measuring water temperature - Measuring dose rate 3rd (Feb 2013 – Jun 2014) - Acquiring images - Sampling accumulated water
- Measuring water level - Installing permanent monitoring instrumentation 4th (Jan – Feb 2017) - Acquiring images - Measuring dose rate - Measuring air temperature
Leakage points from PCV
- No leakage from torus chamber rooftop - No leakage from all inside/outside surfaces of S/C
Deformed grating
Front chamber
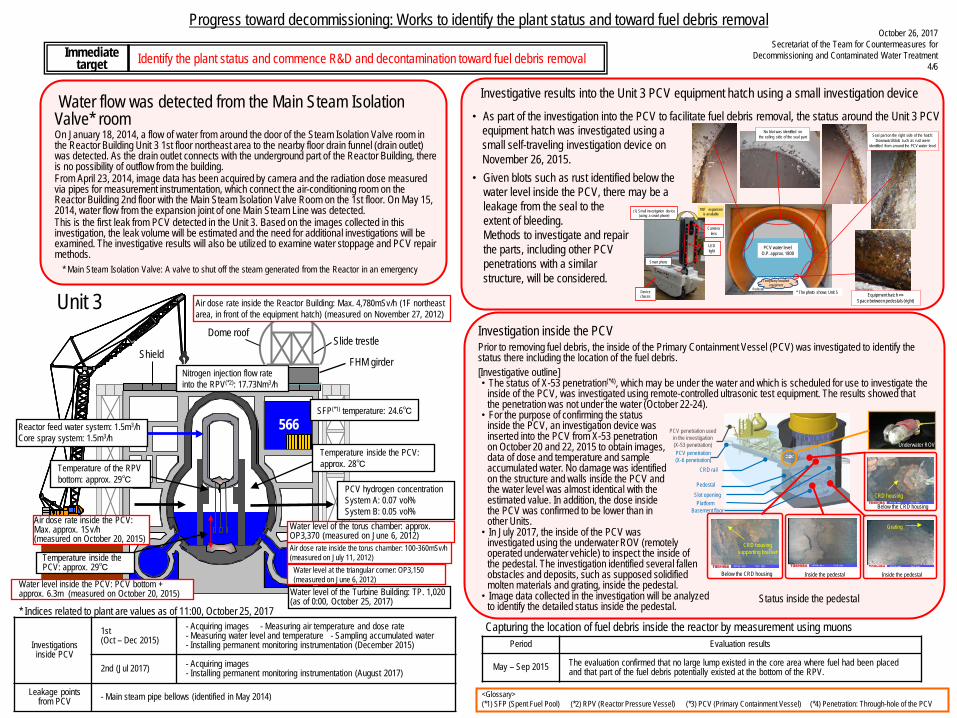
構台
安全第一 福島第一 安全第一 福島第一 安全第一 福島第一
Progress toward decommissioning: Works to identify the plant status and toward fuel debris removal
Identify the plant status and commence R&D and decontamination toward fuel debris removal Immediate target
* Indices related to plant are values as of 11:00, October 25, 2017
October 26, 2017 Secretariat of the Team for Countermeasures for
Decommissioning and Contaminated Water Treatment 4/6
* Main Steam Isolation Valve: A valve to shut off the steam generated from the Reactor in an emergency
Water flow was detected from the Main Steam Isolation Valve* room On January 18, 2014, a flow of water from around the door of the Steam Isolation Valve room in the Reactor Building Unit 3 1st floor northeast area to the nearby floor drain funnel (drain outlet) was detected. As the drain outlet connects with the underground part of the Reactor Building, there is no possibility of outflow from the building. From April 23, 2014, image data has been acquired by camera and the radiation dose measured via pipes for measurement instrumentation, which connect the air-conditioning room on the Reactor Building 2nd floor with the Main Steam Isolation Valve Room on the 1st floor. On May 15, 2014, water flow from the expansion joint of one Main Steam Line was detected. This is the first leak from PCV detected in the Unit 3. Based on the images collected in this investigation, the leak volume will be estimated and the need for additional investigations will be examined. The investigative results will also be utilized to examine water stoppage and PCV repair methods.
Visual check range
Blown out TIP room door Inaccessible area for robot
Investigation inside the PCV Prior to removing fuel debris, the inside of the Primary Containment Vessel (PCV) was investigated to identify the status there including the location of the fuel debris. [Investigative outline] ・The status of X-53 penetration(*4), which may be under the water and which is scheduled for use to investigate the
inside of the PCV, was investigated using remote-controlled ultrasonic test equipment. The results showed that the penetration was not under the water (October 22-24).
・For the purpose of confirming the status inside the PCV, an investigation device was inserted into the PCV from X-53 penetration on October 20 and 22, 2015 to obtain images, data of dose and temperature and sample accumulated water. No damage was identified on the structure and walls inside the PCV and the water level was almost identical with the estimated value. In addition, the dose inside the PCV was confirmed to be lower than in other Units.
・In July 2017, the inside of the PCV was investigated using the underwater ROV (remotely operated underwater vehicle) to inspect the inside of the pedestal. The investigation identified several fallen obstacles and deposits, such as supposed solidified molten materials and grating, inside the pedestal.
・Image data collected in the investigation will be analyzed to identify the detailed status inside the pedestal.
<Glossary> (*1) SFP (Spent Fuel Pool) (*2) RPV (Reactor Pressure Vessel) (*3) PCV (Primary Containment Vessel) (*4) Penetration: Through-hole of the PCV
Unit 3
Reactor feed water system: 1.5m3/h Core spray system: 1.5m3/h
PCV hydrogen concentration System A: 0.07 vol% System B: 0.05 vol%
Temperature of the RPV bottom: approx. 29℃
Temperature inside the PCV: approx. 28℃
Water level of the Turbine Building: TP. 1,020 (as of 0:00, October 25, 2017)
Water level inside the PCV: PCV bottom + approx. 6.3m (measured on October 20, 2015)
Water level at the triangular corner: OP3,150 (measured on June 6, 2012)
SFP(*1) temperature: 24.6℃
Water level of the torus chamber: approx. OP3,370 (measured on June 6, 2012) Air dose rate inside the torus chamber: 100-360mSv/h (measured on July 11, 2012)
566
Air dose rate inside the PCV: Max. approx. 1Sv/h (measured on October 20, 2015)
Investigative results into the Unit 3 PCV equipment hatch using a small investigation device ・ As part of the investigation into the PCV to facilitate fuel debris removal, the status around the Unit 3 PCV
equipment hatch was investigated using a small self-traveling investigation device on November 26, 2015.
・ Given blots such as rust identified below the water level inside the PCV, there may be a leakage from the seal to the extent of bleeding. Methods to investigate and repair the parts, including other PCV penetrations with a similar structure, will be considered.
Temperature inside the PCV: approx. 29℃
Temporary installed equipment
No blot was identified onthe ceiling side of the seal part
* The photo shows Unit 5
PCV water levelO.P. approx. 1800
Equipment hatch ⇔Space between pedestals (right)
Seal part on the right side of the hatch: Downward blots such as rust were
identified from around the PCV water level
Pedestal
LED light
Camera lens
(1) Small investigation dev ice(using a smart phone)
Device chassis
Smart phone
180°expansion is available
Shield FHM girder
Nitrogen injection flow rate into the RPV(*2): 17.73Nm3/h
Slide trestle
Status inside the pedestal
PCV penetration(X-6 penetration)
CRD rail
Pedestal
PlatformSlot opening
Basement floor
PCV penetration used in the investigation(X-53 penetration)
Inside the pedestal
Grating
Below the CRD housing
CRD housing
Underwater ROV
Inside the pedestalBelow the CRD housing
CRD housing supporting bracket
Dome roof
Air dose rate inside the Reactor Building: Max. 4,780mSv/h (1F northeast area, in front of the equipment hatch) (measured on November 27, 2012)
Period Evaluation results
May – Sep 2015 The evaluation confirmed that no large lump existed in the core area where fuel had been placed and that part of the fuel debris potentially existed at the bottom of the RPV.
Investigations inside PCV
1st (Oct – Dec 2015)
- Acquiring images - Measuring air temperature and dose rate - Measuring water level and temperature - Sampling accumulated water - Installing permanent monitoring instrumentation (December 2015)
2nd (Jul 2017) - Acquiring images - Installing permanent monitoring instrumentation (August 2017)
Leakage points from PCV
- Main steam pipe bellows (identified in May 2014)
Capturing the location of fuel debris inside the reactor by measurement using muons

Progress toward decommissioning: Work related to circulation cooling and accumulated water treatment line
Stably continue reactor cooling and accumulated water treatment, and improve reliability Immediate target
Reliability increase
Reactor Building
Turbine Building
Estimated leak route Legend
Strengthened materials, etc.
Condensate Storage tank
Buffer tank
Reactor water injection pump
October 26, 2017 Secretariat of the Team for Countermeasures for
Decommissioning and Contaminated Water Treatment 5/6
Reducing groundwater inflow by pumping sub-drain water Drainage of groundwater by operating the sub-drain
pump
Groundwater
To reduce groundwater flowing into the buildings, pumping-up of groundwater from wells (subdrains) around the buildings started on September 3, 2015. Pumped-up groundwater was purified at dedicated facilities and released after TEPCO and a third-party organization confirmed that its quality met operational targets.
Measures to pump up groundwater flowing from the mountain side upstream of the Building to reduce the groundwater inflow (groundwater bypass) have been implemented. The pumped up groundwater is temporarily stored in tanks and released after TEPCO and a third-party organization have confirmed that its quality meets operational targets. Through periodical monitoring, pumping of wells and tanks is operated appropriately. At the observation holes installed at a height equivalent to the buildings, the trend showing a decline in groundwater levels is checked. The analytical results on groundwater inflow into the buildings based on existing data showed a declining trend.
Preventing groundwater from flowing into the Reactor Buildings
Work to improve the reliability of the circulation water injection cooling system and pipes to transfer accumulated water. ・ Operation of the reactor water injection system using Unit 3 Condensate Storage Tank (CST) as a water
source commenced (from July 5, 2013). Compared to the previous systems, the reliability of the reactor water injection system was enhanced, e.g. by increasing the amount of water-source storage and enhancing durability.
・ To reduce the risk of contaminated-water leakage, the circulation loop was shortened by installing a reverse osmosis (RO) device in the Unit 4 Turbine Building within the circulation loop, comprising the transfer of contaminated water, water treatment and injection into the reactors. Operation of the installed RO device started from October 7 and 24-hour operation started from October 20. Installation of the new RO device inside the building shortened the circulation loop from approx. 3 to 0.8 km.
* The entire length of contaminated water transfer pipes is approx. 2.1km, including the transfer line of surplus water to the upper heights (approx. 1.3km).
Units 1-3 CST
New RO equipment
Storage tank (Temporary RO treated
water storage tank)
Outdoor transfer pipes shortened
Pumping well
Groundwater flow (Mountain side→sea side)
Unit 1 Unit 2
Unit 4
Completion of purification of contaminated water (RO concentrated salt water) Contaminated water (RO concentrated salt water) is being treated using seven types of equipment including the multi-nuclide removal equipment (ALPS). Treatment of the RO concentrated salt water was completed on May 27, 2015, with the exception of the remaining water at the tank bottom. The remaining water will be treated sequentially toward dismantling the tanks. The strontium-treated water from other facilities than the multi-nuclide removal equipment will be re-purified in the multi-nuclide removal equipment to further reduce risks.
Freezing plant
・Length: approx. 1,500m Land-side impermeable walls
To prevent the inflow of groundwater into the buildings, installation of impermeable walls on the land side is planned. Freezing started on the sea side and at a part of the mountain side from March 2016 and at 95% of the mountain side from June 2016. On the sea side, the underground temperature declined 0℃ or less throughout the scope requiring freezing except for the unfrozen parts under the sea-water pipe trenches and the areas above groundwater level in October 2016. Freezing started for two of seven unfrozen sections on the mountain side from December 2016, and four of the remaining five unfrozen sections from March 2017. Freezing of the remaining unfrozen section started in August 2017.
Installing land-side impermeable walls with frozen soil around Units 1-4 to prevent the inflow of groundwater into the building
Facilities improvement
Multi-nuclide removal
equipment, etc.
Storage tank (RO concentrated
salt water)
ここここここここここここここここここ
地下水
Accumulated water treatment (Kurion/Sarry)
ここここここここここここここここここ
Groundwater level
Salt treatment (RO
membrane) Storage tank
(strontium-treated water, etc.)
Mobile strontium-removal equipment,
etc.
Storage tank (treated water)
Via a groundwater bypass, reduce the groundwater level around the Building and groundwater inflow into the Building
Progress status of dismantling of flange tanks ・To facilitate replacement of flange tanks, dismantling of flange tanks started in H1 east/H2
areas in May 2015. Dismantling of all flange tanks was completed in H1 east area (12 tanks) in October 2015, in H2 area (28 tanks) in March 2016 and in H4 area (56 tanks) in May 2017 and in H3 B area (31 tanks) in September 2017. Dismantling of flange tanks in H5 and H6 areas is underway.
Start of dismantling in H1 east area After dismantling in H1 east area
上部透水層
難透水層
くみ上げ
揚水井下部透水層
難透水層
④サブドレン
地下水ドレン
地下水位
海水面
原子炉建屋
⑧海側遮水壁⑤陸側遮水壁 ⑤陸側遮水壁
③地下水バイパス⑥敷地舗装
雨
⑦水ガラス地盤改良
ウェルポイント
②トレンチ
くみ上げセシウム除去
淡水化
タービン建屋くみ上げ④サブドレン
くみ上げUpper permeable layer
Low-permeable layer
Water pumping
Groundwater level
Land-side impermeable wall
③Groundwater bypass
Water pumping
Water pumping Water pumping
④Sub-drain
Reactor building
Turbine building
④Sub-drain
⑤Land-side impermeable wall ⑤Land-side impermeable wall ⑧Sea-side impermeable wall
Rain
Groundwater drain Well point
②Trench
⑥Paved with asphalt
Cs/Sr removal desalination
⑦Ground improvement by sodium silicate
Sea level
New transfer line is installed from RO equipment to CST
#1 - 3R/B
♯1 - 44T/B
ConcentratedRadHTI SPT
Desalinationequipment
(ROequipment)
Storagetank
ROequipment
P
#1 - 3CST Treated water (backup)
Cs removal(SARRY,KURION)P
♯4T/B
Groundwater inflow
Transfer line
Drainage line
SPT receipt water tank
New transfer line from SPT to RO equipment and a drainage line of RO
waste water are installedNee RO equipment is installed on Unit 4 T/B
operation floor

A
B
F
C
D
E
G
H
I
J
L
M
N
O
T
U
Q
V
W
P
1st – 2nd solid waste storage facilities
H2
D
3rd – 8th solid waste storage facilities
9th solid waste storage facilities
AA
X
G Expanded
Main Anti-Earthquake Building
Main gate
Rubble storage area Trimmed trees storage area
Trimmed trees storage area (planned)Rubble storage area (planned)
Sludge storage areaSludge storage area (before operation)
Cesium absorption vessel storage area
Concentrated waste liquid storage areaUsed protective clothing storage area
Progress toward decommissioning: Work to improve the environment within the site
・ Reduce the effect of additional release from the entire power station and radiation from radioactive waste (secondary water treatment waste, rubble, etc.) generated after the accident, to limit the effective radiation dose to below 1mSv/year at the site boundaries.
・ Prevent contamination expansion in sea, decontamination within the site
Immediate targets
October 26, 2017 Secretariat of the Team for Countermeasures for Decommissioning
and Contaminated Water Treatment 6/6
Status of the large rest house
A large rest house for workers was established and its operation commenced on May 31, 2015. Spaces in the large rest house are also installed for office work and collective worker safety checks as well as taking rest. On March 1, 2016 a convenience store opened in the large rest house. On April 11, operation of the shower room started. Efforts will continue to improve convenience of workers.
Installation of sea-side impermeable walls To prevent the outflow of contaminated water into the sea, sea-side impermeable walls have been installed. Following the completed installation of steel pipe sheet piles on September 22, 2015, connection of these piles was conducted and connection of sea-side impermeable walls was completed on October 26, 2015. Through these works, closure of sea-side impermeable walls was finished and the contaminated water countermeasures have been greatly advanced.
Installation of steel pipe sheet piles for sea-side
impermeable wall
Installation of dose-rate monitors
To help workers in the Fukushima Daiichi Nuclear Power Station precisely understand the conditions of their workplaces, a total of 86 dose-rate monitors were installed by January 4, 2016. These monitors allow workers to confirm real time on-site dose rates at their workplaces. Workers are also able to check concentrated data through large-scale displays installed in the Main Anti-Earthquake Building and the access control facility.
Installation of Dose-rate monitor
Optimization of radioactive protective equipment
Based on the progress of measures to reduce environmental dosage on site, the site is categorized into two zones: highly contaminated area around Unit 1-4 buildings, etc. and other areas to optimize protective equipment according to each category aiming at improving safety and productivity by reducing load during work. From March 2016, limited operation started. From March and September 2017, the G Zone was expanded.
R zone(Anorak area)
Y zone(Coverall area)
Full-face mask Full-face or half-face masks *1 *2
Anorak on coverallOr double coveralls Coverall
G zone(General wear)
General*3 Dedicated on-site wear
Disposable disposable mask
*1 For works in buildings including water-treatment facilities [multi-nuclide removal equipment, etc.] (excluding site visits), wear a full-face mask.*2 For works in tank areas containing concentrated salt water or Sr-treated water (excluding works not handling concentrated salt water, etc., patrol, on-site investigation for work planning, and site visits) and works related to tank transfer lines, wear a full-face mask.*3 Specified light works (patrol, monitoring, delivery of goods brought from outside, etc.)
Main guard post
Registration center
H tank area
Shielded MCR
Unit 3 south side
Unit 3&4 slope
Unit 1&2 slope
Main Anti-EarthquakeBuilding
Former Welfare Building
Former Unit 5&6carry-in/outcontrol center
Unit 1 sea side(area 4m above sea level)
Unit 3 sea side (area 4m above sea level)
HT south side (area 10m above sea level)
Former Information Building (area 10m above sea level)
R zone [Anorak area]*1Y zone [Coverall area]*2 Continuous dust monitorG zone [General war area]*3
*1 Inside Unit 1-3 Reactor Buildings, Unit 1-4 Turbine Buildings, and areas of surrounding buildings that contain accumulated water *2 Y zones with yellow dot-lines are for works related to contamination such as handling concentrated salt water, etc., where the same protective equipment as in G zone is required for patrol or site visits for work planning. In addition to the area specified above, when engaging in works related to high-dose dust (dismantling of buildings, etc.) or works related to tank transfer lines such as concentrated salt water, etc. in G zone, the area is temporarily designated as Y zone.*3 In addition to the areas specified above, G zones also include a part of areas on the 2nd and 3rd floors of the common pool building.


![History of Camp Lejeune 2017 [Read-Only] - · PDF file•Montford Point/Camp Johnson ... •Contaminated water from the Hadnot Point ... •Contaminated water from HP water treatment](https://img.pdfslide.net/doc/110x75/5aa34c667f8b9ada698e1160/history-of-camp-lejeune-2017-read-only-montford-pointcamp-johnson-contaminated.jpg)