Embed Size (px)
Citation preview

Fisheries
Summary of the
2014 Annual Economic Report on the
EU Fish Processing Industry
This summary is part of the 2014 Annual Economic Report on the EU Fish Processing Industry (STECF 14-21)
EUROPEAN COMMISSION
Joint Research Centre Institute for the Protection and Security of the Citizen Maritime Affairs Unit Via Enrico Fermi 2749 21027 Ispra (VA) Italy
Contact STECF secretariat
E-mail stecf-secretariatjrceceuropaeu
Tel 0039 0332 789343
Fax 0039 0332 789658
httpsstecfjrceceuropaeuhome
httpipscjrceceuropaeu
httpwwwjrceceuropaeu
Directorate-General for Maritime Affairs and Fisheries Policy development and co-ordination Directorate Contact Structural policy and economic analysis Unit E-mail mare-a3eceuropaeu European Commission B-1049 Brussels
Legal Notice Neither the European Commission nor any person acting on behalf of the Commission is responsible for the use which might be made of this publication This report does not necessarily reflect the view of the European Commission and in no way anticipates the Commissionrsquos future policy in this area
copy European Union 2014
Reproduction is authorised provided the source is acknowledged
How to cite this report
Scientific Technical and Economic Committee for Fisheries (STECF) ndash The 2014 Annual Economic Report on the EU Fish Processing Industry (STECF-14-21)
JRC 93340 EUR 227029 EN ISBN 978-92-79-44714-3 ISSN 1831-9424 doi102788968527 (STECF-14-21) 2014 Publications Office of the European Union Luxembourg
Summary of the
2014 Annual Economic Report on the
EU Fish Processing Industry
This summary is part of the 2014 Annual Economic Report on the EU Fish Processing Industry (STECF 14-21)
1
KEY FINDINGS in 2012
Number of enterprises
The total number of enterprises in the European fish processing industry was 3454 in 2012 54 of which having less
than 10 employees 31 with between 11 and 49 employees and only 15 with more than 50 employees of which only
1 of enterprises have more than 250 employees
The total number of enterprises decreased by 5 over the reporting period although the number of firms employing 10
people or less decreased only by 2
Italy possessed the largest fish processing industry in 2012 in terms of number of firms (16 of the total) and the United
Kingdom in terms of people employed (16 of the total) Spain and United Kingdom followed in terms of number of
firms (respectively 14 and 11 of the total) Spain and France in terms of employment (respectively 15 and 13 of
the total)
Employment
Total employment of the European fish processing industry amounted to 120249 workers in 2012 (20 less than direct
employment generated by the EU fleet in the same year) and the average annual wage was equal to euro28581 per FTE
(almost 60 more than the average annual wage of the EU fisheries catching sector)
Employment decreased 5 between 2008 and 20121 while the average wage increased by 16 Over the same period
labour productivity increased by 23
Most of the EU employment in 2012 is to be found in enterprises with less than 10 employees (52) and only 14 of it
in companies with more than 50 employees
The share of employment by gender has remained stable over the years (45 of male vs 55 of female in average) In
some countries employment was spread almost evenly between men and women in 2012 both in terms of number of
employees and FTEs However at country level some significant decrease in female employment can be observed
Income generated production costs and profitability
The amount of income generated by the European fish processing industry in 2012 increased by 2 compared to 2011
(euro279 billion of which 98 was made up of turnover) Compared to 2008 this increase was 11
Total production costs also increased by 4 in 2012 (from euro237 in 2011 to euro245 billion)
The major cost items are purchase of fish and other raw material for production (53-57 of income and 63-65 of costs
in 2012) other operational costs (17-19 of income) and labour costs (10-11 of income) while energy expenses
represent only 2-3 of income
Despite the increase in production costs the EU fish processing sector was profitable in 2012 and generated euro64 billion
in Gross Value Added (GVA) euro17 billion of earnings before interest2 and tax and a net profit of euro16 billion3
The UK fish processing industry generated the highest GVA in absolute terms in 2012 (27 of the EU total) followed by
the Spanish (20) and French (17) industries
Among the countries for which net profit was calculated the UK industry generated the highest net profit in absolute
terms in 2012 (66 of the estimated total) followed by the French (14) and Italian (6) industries
1 Without data from Croatia and Greece due to incomplete time series
2 Without data from Portugal and Spain due to missing data
2
Economic performance
The available data shows a generally unsatisfactory economic performance as a proportion of total income (also in
relative terms) during the period 2008-2012 However they suggest an improvement in economic performance3 over the
years In 2012 GVA and net profit generated by the EU fish processing industry (considering the MS for which data was
available) were respectively 17 and 83 higher than in 2008 Compared to 2011 both indicators fell significantly (-3
for GVA and -5 for net profit) but net profit much less than from 2010 to 2011
Performance indicators as a share of income fell from 2010 to 2011 and GVA also fell in 2012 GVA as a proportion of
income declined from 24 to 23 in 2012 while net profit as a share of income was stable at 6
Economic analysis of national data reveals a much differentiated economic performance by country The Croatian
Cypriot German and Greek fish processing industries made net losses in 2012 while all the other MS generated a net
profit ranging from euro3 million for Slovenia to more than euro1 billion for the United Kingdom
For 2012 the situation shows overall a mixed picture with countries with decreasing and many other countries with
increasing net profits and only a few countries reported overall losses
Trends and drivers for change
The high percentage of the costs of raw material (compared to the overall costs) is expected to increase in the future
These costs are not expected to be offset by the improvements in efficiency (eg via innovations)
The high dependency on imports from foreign countries will continue to leave the companies very vulnerable to
developments on the world markets
The increasing demand for certified fish may reduce the availability of raw material andor increase its price even more
The improvement in fish stocks in Europe could potentially increase the volume of landings in the future but this could
take some time Until then there continues to be potential vulnerability in the availability of raw materials Given that
the landing obligation will probably lead to higher landings this could potentially improve the volume of raw material
available to the fish processing industry However what the value of these landings will be remains to be seen
The discard ban will probably lead to higher landings which may improve the volume of raw material available to the
fish processing industry however what the value of these landings will be remains to be seen
Future expectation index4
Data from 2008 shows a positive expectation of the industry regarding EU-wide figures while 2009 obviously reflects the
economic crises (less positive expectations) In 2009 and 2010 expectations of the producers already turned into more
optimistic scenarios again
The distinct decrease of the 2012 EU overall FEI (still positive) may be caused by a hold-up phenomenon meaning that
companies are waiting with new investment until the new EU fisheries funds regulations are clear and in force
Trends diverge from country to country This could however partially be explained by a relocation of the industry to
another country In Germany for example stable negative expectations are clearly visible (resulting in disinvestment in
the fish processing sector) at the same time investments are made by German companies into new facilities abroad
This disinvestment decreases the German FEI but increases the FEI of the country into which the investment was made
3 Gross value added earnings before interest operating costs cash flow and net profits
4 The Future Expectation Indicator (FEI) has been created in order to give information about the future expectations of the
companies in the sector It is the difference of net investment minus depreciation divided by total assets Despite the low data coverage (60-80) more trends could be identified at a EU-level
3
1 Total enterprises and employment of the European fish processing industry
Overall the countries of the European Union5 are forming one of the main fish importing and processing regions in the world The EU as a whole is by far the largest importer of fish and fisheries products in the world6 The demand for fish products in the EU is much larger than what can be provided by the European fishing fleet and indeed the EU is a net importer of fish and fish products (in 2012 its seafood trade balance was equal to -33438 million tonnes of seafood corresponding to -euro14111 billion) The access to the world market is therefore of great importance The economic crisis from 2008 influenced the economic performance of the industry which has deteriorated during the reporting period and especially from 2010 to 2011 In 2012 the situation is diverse some countries show improvements others a decreasing trend
According to Member States DCF data submissions the total number of enterprises in the European fish processing industry sector in 2012 was around 34 thousand 54 of which have less than 10 employees and another 31 with the number of employees between 11 and 49 (Table 1) Over the reporting period the total number of enterprises decreased by 5 All size categories shrunk in number especially the one with 50-249 employees (-14)
According to the data submitted by MS the number of workers employed in the European fish processing industry in 2012 was 120249 Omitting Croatia and Greece from the trend analyses the total number of people employed in the sector shrank continuously from 2008 to 2011 (by 5 over the entire period) while it increased slightly the year after (by 03)
Contrarily to the total number of employees the total FTEs reduced from 2011 to 2012 This can be expained by an increase of the part-time employment (the higher the ratio of FTE to total employed the higher the full-time employment) or an increased use of seasonal work
The average number of FTEs per enterprise showed a slight increase over the period 2008 and 2012 The average wage measured as cost of labour per FTE shows an improvement by 5 from 2011 to 2012 and of 16 over the whole reporting period Labour productivity measured as gross value added per FTE improved 23 from 2008 to 2012 but it declined slightly from 2011 to 2012
5 Although Belgium delivered data this year it was decided not to include it in the EU overview as there are still data quality
problems For Croatia and Greece data for 2011 and 2012 were delivered but they were excluded from the analysis of trends (as no data is available for 2008-2010) Nevertheless whenever possible Croatian and Greek figures were included in order to provide the most comprehensive possible overview of the industry at least for 2011 and 2012 For this reason in the tables presenting trends along with EU totals not including Croatia and Greece (on which trend rates are calculated) 2011 and 2012 totals ldquowith Croatia and Greecerdquo are also shown (see as an example table 1) 6 According to FAO data it contributed around 40 of the total value of world imports in 2010
4
Table 1 European fish processing industry sector overview 2008-2012
Variable 2008 2009 2010 2011 2012
2011
(with Greece
and Croatia)
2012
(with Greece
and Croatia)
Δ to
2011
Develop
trend
Structure (number)
Total enterprises 3463 3406 3451 3390 3287 3560 3454 -3 -5
lt=10 employees 1801 1779 1844 1865 1771 1867 1882 1 -2
11-49 employees 1092 1134 1112 1033 1026 1039 1066 3 -6
50-249 employees 476 422 413 411 410 421 425 1 -14
gt=250 employees 76 78 77 76 76 76 77 1 0
Employment (number)
Total employees 122280 117641 117465 116175 116554 119953 120249 0 -5
FTE 112744 108209 108747 108159 107423 111574 110709 -1 -5
Indicators
FTE per enterprise 326 318 315 319 327 313 321 2 0
Average wage (thousand euro) 251 265 269 277 291 272 286 5 16
Labour productivity (thousand euro) 480 602 680 599 590 592 578 -2 23
Unpaid work () 12 24 27 12 26 12 26 115 127
Note Employment figures not available for all MS (refer to Table 2 for details)
Table 2 shows the EU employment trend by country and gender Only for 3 countries of those that submitted data employment is spread almost evenly between men and women in 2012 both in terms of number of employees and FTEs For all the others there is a clear preponderance of either male or female employees For example in the UK Ireland and Finland male employment is higher than female employment while in Portugal and Poland men are less than 35 of the total number of workers
At EU level the share of employment by gender has remained stable over the years (45 of male vs 55 of female in average) However at country level some specific trend can be observed For example in Spain the percentage of male employees increased every year over the reporting period (from 43 to 47 in 2012) except in 2010
5
Table 2 Employment in the European fish processing industry by country and gender 2008-2012
Tota
l
Mal
e
Fem
ale
Tota
l
Mal
e
Fem
ale
Tota
l
Mal
e
Fem
ale
Tota
l
Mal
e
Fem
ale
Tota
l
Mal
e
Fem
ale
Tota
l
Mal
e
Fem
ale
Tota
l
Mal
e
Fem
ale
Tota
l
Mal
e
Fem
ale
Tota
l
Mal
e
Fem
ale
Tota
l
Mal
e
Fem
ale
Bulgaria 937 46 54 937 46 54 817 46 54 817 46 54 317 38 62 317 38 62 325 49 51 325 49 51 252 33 67 252 33 67
Croatia 1273 54 46 1150 57 43 1365 55 45 1231 57 43
Cyprus 56 43 57 43 40 60 43 60 40 43 60 40 66 56 44 68 57 43 72 57 43 75 57 43 56 64 36 56 64 36
Denmark 4379 49 51 4147 49 51 4227 50 50 3596 53 47 3791 52 48 3235 54 46 3704 53 47 3043 53 47 3409 53 47 2999 54 46
Estonia 1936 35 65 1864 35 65 1847 35 65 1746 35 65 1887 35 65 1861 35 65 1847 40 60 1813 40 60 1861 35 65 1816 35 65
Finland 961 56 44 682 57 43 880 58 42 742 58 42 885 61 39 742 61 39 870 60 40 777 60 40 930 61 39 781 61 39
France 15672 44 56 15202 46 54 15590 44 56 14983 46 54 15612 45 55 15139 46 54 15964 45 55 15662 46 54 16184 45 55 15971 46 54
Germany 8441 50 50 7995 7566 52 48 7212 7031 51 49 6786 6780 54 46 6544 7010 55 45 6664
Greece 2505 49 51 2265 52 48 2330 50 50 2055 52 48
Ireland 2867 70 30 2596 70 30 3020 70 30 2633 71 29 3064 70 30 2677 71 29 3200 70 30 2761 70 30 3342 67 33 2678 67 33
Italy 5425 52 48 4572 52 48 5285 52 48 4454 52 48 5950 52 48 5015 52 48 6109 52 48 5149 52 48 6197 52 48 5223 52 48
Latvia 5792 37 63 5592 37 63 4684 38 62 4174 38 62 5015 36 64 4681 38 62 5393 34 66 4998 34 66 5781 34 66 5357 34 66
Lithuania 5013 32 68 2912 29 71 4489 29 71 2949 27 73 4351 33 67 3053 33 67 4445 35 65 3614 42 58 4451 33 67 3536 34 66
Malta 56 95 5 40 90 10 131 90 10 116 88 12 19 68 32 15 80 20 32 50 50 28 54 46 56 73 27 53 74 26
Netherlands 2953 2335 3453 2775 3218 2506 3253 2537 3567 2469
Poland 16105 34 66 15580 34 66 15931 32 68 15351 32 68 15983 32 68 15348 32 68 15788 33 67 15108 33 67 15972 33 67 15088 34 66
Portugal 6664 36 64 6561 36 64 6815 36 64 6738 36 64 7277 36 64 6916 36 64 7314 33 67 6913 33 67 6823 32 68 6308 32 68
Romania 513 40 60 503 40 60 572 40 60 564 40 60 1598 43 57 1591 43 57 1181 52 48 1178 52 48 780 50 50 780 50 50
Slovenia 250 42 58 211 42 58 223 42 58 210 41 59 266 41 59 234 42 58 379 42 58 351 42 58 354 42 58 306 42 58
Spain 19737 37 63 19095 39 61 19331 45 55 18449 46 54 18581 39 61 17590 41 59 18390 43 57 17702 43 57 18324 47 53 17399 47 53
Sweden 2165 55 45 1773 1991 56 44 1736 2007 55 45 1807 2126 57 43 1837 2135 57 43 1831
United Kingdom 22358 57 43 20104 59 41 20746 57 43 18922 60 40 20547 59 41 19166 60 40 19003 58 42 17745 59 41 19070 57 43 17855 58 42
Total 122280 44 56 112744 45 55 117641 45 55 108209 46 54 117465 44 56 108747 45 55 119953 45 55 111574 46 54 120249 45 55 110709 46 54
Note the shares by gender at tota l level are ca lculated excluding The Netherlands Sweden and Germany for which data were not avai lable for the entire time series
2012
Employees FTE
2010
Employees FTE
2011
Employees FTEEmployees FTE
2008 2009
Employees FTE
6
As shown in Table 3 based on DCF data in 2012 Italy possessed the biggest fish processing industry in terms of number of enterprises with 16 of the total EU figures
In the same year 16 of all the sectorrsquos employees were employed in the UK Spain and the United Kingdom followed in terms of number of firms (respectively 14 and 11 of the total) Spain France and Poland in terms of employment (Spain 15 the other two 13 of the total)
Table 3 also presents trends in number of enterprises and employment level by Member State over the period 2008-2012 highlighting those changes in the structure of the fish processing industry have diverged across Member States Employment in the fish processing industry increased for several countries (eg Netherlands and Finland) it decreased for others (eg Denmark and Portugal) In general terms changes in number of enterprises fluctuated between -52 for Bulgaria and +43 for Italy (-5 at EU level) and in the number of employees between -73 for Bulgaria and +52 for Romania (-5 for the EU total)
As already mentioned the ratio FTEtotal employees provide an indication of the main type of employment (the lower the ratio the higher the share of part-time employment) The Dutch fish processing industry appears to have the highest level of part-time employment (FTEtotal employees = 69) followed by the Lithuanian and Danish ones On the other hand several countries such as Romania and Bulgaria employ mostly full-time workers
The increase in the total number of firms is not always coupled with growth at the employment level and viceversa This can be explained by the fact that in some countries the number of small businesses increased over the reference period and the larger businesses decreased while the opposite has happened in other MS For example in Malta France and The Netherlands the total number of employees increased over the period 2008-2012 even if the total number of enterprises shrank while the employment contracted in Estonia even if the number of firms rose
Figure 1 shows that although the distribution of enterprises by size category is highly differentiated by country for most MS the number of firms with less than 10 employees constituted at least half of the total number of enterprises in 2012 In all MS most of the other enterprises belong to the categories ldquo11 ndash 49rdquo and ldquo50 ndash 249rdquo employees while the firms with more than 250 workers are generally a minority
7
Table 3 European fish processing industry sector overview by country 2012
Country FTE of EU
total
Δ to
2011
Develop
trend
Total
employees
of EU
total
Δ to
2011
Develop
trend
Number of
enterprises
of EU
total
Δ to
2011
Develop
trend
Bulgaria 252 0 -22 -73 252 0 -22 -73 10 0 -70 -52
Croatia 1231 1 7 1365 1 7 20 1 11
Cyprus 56 0 -25 30 56 0 -22 0 4 0 -20 -20
Denmark 2999 3 -1 -28 3409 3 -8 -22 106 3 -1 -9
Estonia 1816 2 0 -3 1861 2 1 -4 61 2 11 22
Finland 781 1 1 15 930 1 7 -3 146 4 2 2
France 15971 14 2 5 16184 13 1 3 295 9 -2 -10
Germany 6664 6 2 -17 7010 6 3 -17 250 7 -6 -11
Greece 2055 2 -9 2330 2 -7 147 4 -3
Ireland 2678 2 -3 3 3342 3 4 17 164 5 -2 -5
Italy 5223 5 1 14 6197 5 1 14 537 16 1 43
Latvia 5357 5 7 -4 5781 5 7 0 101 3 0 6
Lithuania 3536 3 -2 21 4451 4 0 -11 33 1 -3 -11
Malta 53 0 89 33 56 0 75 0 6 0 -25 -14
Netherlands 2469 2 -3 6 3567 3 10 21 84 2 -5 -17
Poland 15088 14 0 -3 15972 13 1 -1 196 6 -4 4
Portugal 6308 6 -9 -4 6823 6 -7 2 180 5 -3 -15
Romania 780 1 -34 55 780 1 -34 52 14 0 -36 8
Slovenia 306 0 -13 45 354 0 -7 42 15 0 7 25
Spain 17399 16 -2 -9 18324 15 0 -7 487 14 -5 -15
Sweden 1831 2 0 3 2135 2 0 -1 223 6 2 4
United Kingdom 17855 16 1 -11 19070 16 0 -15 375 11 -5 -28
EU 110709 100 -1 120249 100 0 3454 100 -3
EU (without Greece
and Croatia)107423 -1 -5 116554 0 -5 3287 -3 -5
8
Figure 1 Number of firms by country 2012
Data on crew costs and employment suggest that the average wage per FTE varies substantially by MS (Figure 2) with the Danish fish processing industry paying the highest salaries on average (euro570 thousand) followed by the French the Swedish industries (respectively euro513 thousand and euro502 thousand)
Labour productivity in 2012 ranged from euro85 thousand for Croatia to euro1728 thousand for Malta However for almost all countries it was smaller than euro80 thousand
Figure 2 Average salary and labour productivity by country 2012
As mentioned before under the EU data collection framework MS are requested to provide the number of enterprises and the turnover attributed to fish processing for enterprises that carry out fish processing but not as a main activity This is one of the main differences in comparison to the data collection for the Structural Business Statistics (SBS) as industry sector companies have to deliver data under the SBS (under NACE code
9
1020) only if they undertake fish processing as main activity In cases where companies have only minor parts of their business in fish processing they will deliver data under a different NACE code and the fish processing activity will not be included in the overall numbers from EUROSTAT Table 4 gives an overview by country of the number of enterprises which carry out fish processing but not as the main activity based on the 2014 DCF data delivery The table also shows how much these firms contribute to the total number of firms processing fish (firms processing fish as their main activity plus those processing fish not as their main activity)
In 2012 872 companies were reported to carry out fish processing not as their main activity However taking into account that only 18 out of the 23 country participating in the DCF framework reported data on this type of enterprises (2012 figures were not available for Belgium Bulgaria France Germany and Portugal) as well as the inherent difficulties in collecting the information this number can be expected to be much higher Nonetheless there has been a progressive increase in reporting this data from 2001 when only 8 countries reported information on companies processing fish not as main activity
It can be also observed that there is a high variability across MS in terms of the contribution of the firms processing fish as a secondary activity to the total number of enterprises For example while for Latvia and Denmark they represent less than 5 of the total for Cyprus and Romania they are the majority
Table 4 Number of enterprises carrying out fish processing not as a main activity by country 2012
Country 2008 of total
enterprises 2009
of total
enterprises 2010
of total
enterprises 2011
of total
enterprises 2012
of total
enterprises
Δ to
2011
Develop
trend
Croatia 24 57 24 55 0
Cyprus 13 72 12 80 10 67 14 74 9 69 -36 -31
Denmark 3 3 6 5 5 4 5 4 5 5 0 67
Estonia 12 19 13 20 13 20 12 18 11 15 -8 -8
Finland 22 13 49 26 56 28 27 16 27 16 0 23
France 115 27 111 27
Germany 95 27 80 23
Greece 21 12 7 5 -67
Ireland 16 9 16 9 25 13 22 12 29 15 32 81
Italy 162 30 177 30 233 30 227 30 231 30 2 43
Latvia 4 4 4 4 2 2 2 2 2 2 0 -50
Lithuania 2 5 2 6 2 6 3 8 3 8 0 50
Malta 0 0 0 0 0 0 0 0 2 25
Netherlands 398 82 451 84 97 52 64 43 -34
Poland 52 22 59 23 64 25 66 24 61 24 -8 17
Portugal 29 12 38 16
Romania 30 70 30 70 43 70 29 57 24 63 -17 -20
Slovenia 8 40 8 38 8 38 7 33 6 29 -14 -25
Spain 1 0 0 0 0 0 0 0 0 0 0 0
Sweden 87 29 98 31 95 30 108 33 120 35 11 38
United Kingdom 647 55 423 48 353 46 353 47 247 40 -30 -62
10
2 Economic performance of the European fish processing industry sector
The amount of income generated by the European fish processing industry in 2012 was almost euro279 billion 98 of which was made up of turnover (Table 5) This represents a 2 increase compared to 2011 Income subsidies7 amounted to 02-05 of the total income during the entire reporting period
According to Member States DCF data submissions total production costs amounted to almost euro245 and euro237 billion respectively in 2012 and 2011 meaning that 4 more was spent in 2012 to generate an amount of income 2 higher than the previous year Purchase of fish and other raw material for production is the dominant cost item accounting for 63-65 of the total costs (53-57 of income) during the period 2008-2012 (Table 5) Most of the remaining costs consist of other operational costs (17-19 of income) and labour costs (11-12 of income) while energy expenses represent only 3 of the total (2-3 of income)
The income structure is quite homogeneous across countries with the turnover having been more than 95 of the total income for all MS in 2012 except Cyprus Lithuania Bulgaria Romania and Croatia (their turnover respectively contributed 85 84 74 70 and 60 of the total income)
The sector received relatively small amounts of income subsidies with 02 of income in 2008 and 05 in 2012 This is an increase from euro59 to euro126 million (without Greece and Croatia) from 2008 to 2012
The production costs ranged from 80 and 100 of the total income for most countries in 2012 (Table 6) However for some countries the costincome ratio was quite far from the average (04 for Romania and 01 for Bulgaria between 068 and 078 for Portugal Malta the UK and Cyprus)
7 DCF data on subsidies include only direct income subsidies (ie subsidies which have a direct impact on the income) for example
subsidies on products (subsidies payable to producers in respect of their production) and import subsidies Investment subsidies are excluded More information is available in the 2012 final report of the Planning Group on Economic Issues (PGECON) available at httpdatacollectionjrceceuropaeudocuments10213488770PGECON_2012_final_reportpdfversion=10
11
Table 5 Economic performance of the European fish processing industry sector 2008-2012
Variable 2008 2009 2010 2011 2012
2011
(with Greece
and Croatia)
2012
(with Greece
and Croatia)
Δ to
2011
Develop
ttend
Income (million euro)
Turnover 246998 244216 267688 265277 271017 268419 273825 2 10
Other income 4056 3072 4756 4011 4085 4375 4361 0 1
Subsidies 590 557 565 697 1265 757 1319 74 114
Total Income 249548 246078 272637 269702 275931 273267 279070 2 11
Expenditure (million euro)
Purchase of fish and other raw
material for production 141465 129634 143136 150484 157568 152064 159191 5 11
Wages and salaries of staff 27991 28103 28624 29676 30439 30091 30812 2 9
Imputed value of unpaid labour 253 521 607 270 823 286 830 191 225
Energy costs 5884 5642 6533 6365 6871 6527 7040 8 17
Other operational costs 47511 45131 48447 47377 46894 47857 47580 -1 -1
Total production costs 223104 209030 227347 234172 242595 236825 245453 4 9
Capital Costs (million euro)
Depreciation of capital 3555 3765 4414 4230 3944 4467 4084 -9 11
Financial costs net 3464 2969 3260 2429 1810 2644 2086 -21 -48
Extraordinary costs net 149 188 -10 12 517 27 547 1959 248
Capital Value (million euro)
Total value of assets 107301 108398 121828 112488 115386 113910 122241 7 8
Net Investments 7704 5104 7521 8359 6482 8579 6723 -22 -16
Debt 70872 67129 70352 65695 66701 68292 70380 3 -6
Performance Indicators (million euro)
Gross Value Added 54098 65115 73955 64779 63334 66062 63940 -3 17
Operating Cash Flow 26443 37048 45290 35529 33337 36443 33617 -8 26
Earning before interest and tax 10838 20811 28465 17842 17246 18518 17385 -6 59
Net Profit 8871 19066 25920 16517 16197 16978 16061 -5 83
Capital productivity () 393 481 506 457 438 456 419
Return on Investment () 112 211 256 174 163 175 155
Financial Position () 661 619 578 584 578 582 576
Future Expectation Indicator () 17 -04 15 30 12 30 12
Along with the income structure Figure 3 shows the structure of costs of the fish processing industry by country and gives an overview of the contribution of the main cost items to the total production costs As shown in the table the cost structure is fairly similar across MS Purchase of fish and other raw materials for production is by far the most important component of the total costs for most MS followed by other operational costs and labour costs Energy costs play a very minor role (4 of the total in average)
12
Table 6 Cost structure of the European fish processing industry sector by country 2012
Raw
materia l
Wages and
sa laries
Other
operational
costs
Energy costsUnpaid
labour
Croatia 81 101 27 19 48 6 00
Germany 2025 99 63 12 23 2 00
Netherlands 746 96 74 14 10 1 00
Poland 1857 95 73 8 18 1 00
Finland 253 95 73 12 13 1 04
Sweden 591 95 61 16 23 1 00
France 4722 94 44 17 33 6 01
Ireland 629 94 74 11 13 2 06
Denmark 1907 94 62 9 28 2 01
Estonia 138 93 67 14 17 3 00
Italy 2387 92 73 9 13 4 04
Lithuania 316 91 69 10 19 2 00
Latvia 213 90 60 15 20 4 00
Greece 205 88 69 11 15 6 04
Slovenia 27 85 41 19 35 5 01
Spain 3738 81 73 12 13 2 01
Cyprus 7 78 77 12 6 5 00
United Kingdom 3927 77 70 14 13 2 14
Malta 21 72 85 4 9 3 02
Portugal 736 68 83 10 2 4 07
Romania 17 39 79 14 4 2 08
Bulgaria 1 10 12 59 11 17 10
Cost i tems as a share of tota l costs ()
Tot Costs
(mi l l ion euro)
Tot coststot
Income ()
Note The percentage value reported for Slovenia refers to total production cost as a share of turnover (instead of income) because costs reported by Slovenia are attributable to fish processing only while total income includes also income from processing activities other than fish processing
Table 7 gives an overview by country of the contribution of the turnover generated by the firms undertaking fish processing not as a main activity to the total turnover generated by fish processing (turnover generated by the firms processing fish as their main activity plus the turnover generated by the firms processing fish not as their main activity)
For the countries for which data are available (data for Denmark are not presented for confidentiality reasons) the analysis reveals a mixed picture For some countries for example The Netherlands and Cyprus firms processing fish not as a main activity make a large contribution to the overall turnover of the industry coming from fish processing For others such as Lithuania and Estonia total turnover is almost entirely generated by firms undertaking fish processing as a main activity
13
Table 7 Percentage of turnover of enterprises with fish processing not as main activity 2008-2012
Country2008
(million euro)
of total
turnover
2009
(million euro)
of total
turnover
2010
(million euro)
of total
turnover
2011
(million euro)
of total
turnover
2012
(million euro)
of total
turnover
Δ to
2011
Develop
trend
Croatia 313 41 243 34 -22
Cyprus 98 71 87 64 76 36 81 49 57 44 -29 -41
Estonia 11 1 12 1 11 1 20 1 47 3 141 347
Finland 103 6 1288 40 1471 38 812 24 835 24 3 713
France 6831 14 6942 13
Germany 300 1 500 2
Greece 32 1 11 0 -66
Ireland 506 8 529 9 275 5 115 2 222 3 94 -56
Italy 2527 8 1914 8 2281 8 1984 8 2223 8 12 -12
Latvia 00 0 00 0 00 0 00 0 00 0 0 0
Lithuania 27 1 37 2 34 1 37 1 31 1 -18 13
Malta 00 0 00 0 00 0 00 0 00 0
Netherlands 23383 77 26709 79 28798 78 25483 77 -12
Poland 1094 7 624 4 837 5 887 5 1140 6 29 4
Portugal 1949 15 1349 11
Romania 934 77 1038 76 69 1 29 6 43 12 46 -95
Slovenia 144 33 129 33 53 16 44 11 21 6 -53 -85
Spain 28 0 00 0 00 0 00 0 00 0 0 0
Sweden 734 12 801 15 966 15 971 14 1119 15 15 52
United Kingdom 6223 13 5065 9 5113 9 5667 10 6545 12 15 5
The sector accounted for approximately euro64 billion of Gross Value Added (GVA) in 2012 (Table 8) This shows the importance of the fish processing industry in Europe compared to the fishing fleet (euro34 billion of GVA8)
The amount of operating cash flow generated by the EU fish processing sector in 2012 was euro34 billion Earnings before interest and tax and Net Profit were respectively euro17 billion and euro16 billion
DCF data suggest a clear deterioration of the economic performance from 2011 to 2012 In 2012 GVA Operating Cash Flow Earnings before interest and tax and Net Profit were respectively 3 8 6 and 5 less than in 2011 (with Croatia and Greece) However with respect to 2008 the value of these indicators increased by 17 26 59 and 83 respectively (excluding from the analysis Croatia and Greece for which only 2011 and 2012 data are available)
Figure 5 presents trends in performance indicators as a proportion of total income from 2008 to 2012 Data show a generally unsatisfactory economic performance of the European fish processing industry also in relative terms In addition they reveal an improvement from 2009 to 2010 followed by a fall in 2011 and an additional sligly decrease in 2012 The GVA to income ratio increased from 26 to 27 from 2009 to 2010 and then declined to 24 in 2011 and to 23 in 2012 while net profit as a share of income went up from 8 to 10 in 2010 then down to 6 in 2011 and remained almost stable in 2012
8 Estimate based on DCF data
14
Table 8 Economic performance of the European fish processing industry sector by country 2012
Country
Gross Value
Added
(million euro)
of EU
total
Δ to
2011
Develop
trend
Operating
Cash Flow
(million euro)
of EU
total
Δ to
2011
Develop
trend
Earning
before int
and tax
(million euro)
of EU
total
Δ to
2011
Develop
trend
Net Profit
(million euro)
of EU
total
Δ to
2011
Develop
trend
Bulgaria 92 01 8 -8 87 03 32 0 87 05 37 2 83 05 32 5
Croatia 105 02 -78 0 -05 00 -101 0 -80 -05 -126 0 -123 -08 -147 0
Cyprus 27 00 176 -18 19 01 142 -28 -04 00 94 -116 -06 00 91 -129
Denmark 2939 46 -9 15 1230 37 -13 127 875 00 -18 -105 782 49 -18 382
Estonia 286 04 31 16 99 03 114 54 54 03 822 84 46 03 2864 158
Finland 443 07 6 34 133 04 -5 41 75 04 -18 27 56 03 -23 54
France 10874 170 15 21 2792 83 38 -7 2124 122 122 -12 2197 137 116 -10
Germany 2676 42 -18 -26 265 08 -72 -71 -143 -08 -125 -129 -277 -17 -163 -190
Greece 501 08 -38 0 285 08 -44 0 219 13 -41 -13 -01 -107 0
Ireland 1108 17 17 -59 384 11 130 -80 226 13 829 -87 189 12 2232 -89
Italy 3942 62 46 40 1951 58 137 257 1294 74 525 1313 981 61 1633 331
Latvia 559 09 78 3 247 07 424 9 186 11 4029 30 163 10 1069 32
Lithuania 613 10 -30 -15 312 09 -47 -36 245 14 -54 -41 256 16 -52 -24
Malta 92 01 111 43 84 02 116 64 81 05 141 145 80 05 158 235
Netherlands 1369 21 -5 -4 338 10 -11 -40 164 09 -15 -59 208 13 -11 -56
Poland 2418 38 -2 -4 958 28 -11 -13 546 31 -21 -30 475 30 43 -1
Portugal 4216 66 -17 -16 3492 104 -19 -19
Romania 291 05 -47 35 266 08 -46 33 258 15 -45 32 258 16 -45 94
Slovenia 102 02 -47 -12 50 01 -56 -33 37 02 -62 -40 30 02 -67 -21
Spain 12765 200 -4 7 8655 257 -6 12
Sweden 1224 19 13 28 313 09 56 70 180 10 144 198 128 08 41 143
United Kingdom 17297 271 -10 89 11661 347 -14 171 10961 630 -14 200 10548 657 -15 222
EU 63940 100 -3 33617 100 -8 17385 100 -6 16061 100 -5
EU (without Greece
and Croatia) 63334 99 17 33337 99 26 17246 99 59 16197 83
15
Figure 3 Economic performance of the European fish processing industry sector in absolute terms (top figure) and in relation to income (bottom figure)
Analysis of DCF data at national level reveals a very different economic performance across Member State (Table 8) The Croatian Cypriot German and Greek fish processing industries together contributing a bit more than 5 to the European Gross Value Added of the sector made net losses in 2012 All the other MS generated a net profit ranging from euro 30 million for Slovenia to euro10548 million for the United Kingdom
The UK fish processing industry generated the highest GVA in absolute terms in 2012 (27 of the EU total) followed by the Spain (20) and France (17) ones In relative terms the Bulgarian fish processing industry generated the highest level of GVA in relation to income (95) followed by the Romanian (67) and Slovenian (32) industries
16
Among the countries for which net profit was calculated9 the UK industry generated the highest net profit in absolute terms in 2012 (66 of the estimated total) followed by the French (14) and the Italian (5) ones In relative terms net profit (as a share of income) ranged from -15 for Croatia to 86 for Bulgaria
When comparing the economic performance of the last two years of the reporting period the data reveal a differentiated picture by countries GVA trend rates ranged between -78 for Croatia (from euro477 to euro105 million) and +176 for Cyprus (from -euro35 to euro27 million) leading to an overall GVA decrease of 3 Variations were much more pronounced in terms of net profit with ten countries out of ten for which data are available showing in 2012 an improvement compared to the previous year
Figure 4 Economic performance of the European fish processing industry sector by country 2012
9 Net profit was not calculated for Portugal and Spain due to missing data
17
Figure 5 Economic performance of the European fish processing industry sector by country (indicators in relation to income) 2012
3 Trends and drivers for change outlook for the industry
Dependency on raw materials and imports
Main drivers of the economic situation of the industry are still the high percentage of the costs of raw material compared to the overall costs and the high dependency on imports from foreign countries This leaves the companies very vulnerable to developments in the world markets The EU member states report a diverse situation as in some countries the economic situation of the industry improved while in others not This is due to the increasing costs for raw material which seems to be a stronger effect than improvements in efficiency (eg via innovations) Although several countries expected improvements in fish stocks and increased landings for 2012 such a development is not visible and more countries now expect more problems due to decreased catches (lower quotas to reach MSY) Therefore the vulnerability due to the high dependency on world markets is not reduced Fish production from aquaculture may increase over the next decade but experts are expecting that the regulatory setting and the structure of the industry prevents an increase in production There is also a vertical integration between aquaculture and processing activities observable (eg in Italy almost 70 of the production) This may improve the overall position of the companies and reduces the vulnerability
Another main driver for the industry is the dependency on specific species and sources Especially small or very specialized companies (like the industry for canned sardines in Portugal) depend on domestic landings which are often influenced by fisheries management decisions (like in- or decreasing quotas) As the improvement in the fish stocks in European waters are not that significant yet and in several cases quotas are reduced to reach MSY the small companies depending on domestic landings are still in a vulnerable situation
18
Several countries reported ongoing outsourcing of activities to other member states (eg Denmark Germany and Italy in case of the tuna industry) which leads to increasing investments there (eg Baltic States Poland) For these member states eg in the case of Poland this means that they increased their exports substantially
Increased consumer demand for certified products
Over the last years the wholesale sector increasingly requested certified products as consumers demand shifted towards certified products aiming to ensure sustainable fisheries This also means that the processing companies have to be certified Additionally there is a price pressure of wholesalers towards the processing industry Together with increasing prices for raw material this forms a great risk for future economic performance The increasing demand for certified products can reduce the availability of raw material in some parts of the year or increases prices for raw material even more This development is especially visible in the Netherlands Germany and Sweden
As the list of countries with an increasing demand for certified products shows this is basically a development in the Northern part of the EU In the countries around the Mediterranean a different development is taking place Consumers have lower purchasing power than before and move from high-valued products to low-valued products (eg Greece) However there are first signs of improvement in Spain which increased its exports to substitute for lower domestic demand In other countries around the Mediterranean Sea there may be a similar development but exports may further increase There is additionally in many countries a shift to processed products compared to fresh fish in the past However this is not only the case for fish products but for food products in general
Exchange rate
Another main driver could be the exchange rate between currencies in Europe (eg Polnish Zloty to the Euro) and to currencies outside Europe A weaker Euro would lead to higher prices in Europe and may increase the potential for exports
In many MS especially in the new MS joining the EU since 2004 a lot of public money was spent to invest in modern processing facilities However in some other MS like Germany investment was too low in the last years to renew the capital stock There were investments in other countries like Poland but this not fully explains this situation
Economic crisis
In many countries of the European Union the fish processing sector suffered from the economic crisis in 2008 They reported a strong decrease in income and profits Then in 2010 many countries reported an improved situation compared to the previous year and in fact the overall net profit generated by the European fish processing industry increased 45 In 2011 the situation deteriorated again and many countries reported lower net profit This could be an effect of increasing fish prices as the FAO fish price index shows For 2012 the situation shows a mixed picture with countries with decreasing and many other countries with increasing net profits as only a few countries reported overall losses
For example in Estonia and Ireland the situation improved substantially while in Germany and Croatia it continued to deteriorate From 2011 to 2012 there was again a pronounced decline in the economic condition of the European fish processing industry (-5 in net profit) However with the only exceptions of four countries (Croatia Cyprus Germany and Greece) all MS showed positive net profits still a decrease for many but fewer MS with losses
In several countries there is a shift in consumption habits from high to low value products (like in Greece)
19
Outlook
The future economic performance of the sector is at risk due to the price pressure of wholesalers as well as the increasing prices for raw material Vertical integration (such as between aquaculture and processing activities which is the case for 70 of the production in Italy) may somewhat improve the overall position of the companies and reduce their vulnerability of imported goods
With less purchasing power people are not able to buy high-valued products anymore and this will increase the demand for low valued products further This may be also a reason why parts of the industry in a country improve while others see decreasing activity and overall this leads to a decrease in basic economic indicators
The improvement in fish stocks in Europe will most likely increase landings in the future but it may take more time than expected in the last years Reason for that is the move towards MSY which may make a slower increase or sharper decrease in quotas necessary to reach MSY at the latest by 2020 Also the discard ban will probably lead to higher landings instead of discarding the fish at sea This may improve the accessibility of the fish processing industry on domestic landings and may also keep prices on a relatively low level
4 Summary of National Chapters
Belgium
In 2012 the fish processing industry in Belgium consisted of about 240 enterprises with an estimated turnover of euro826 million employing around 2500 people (2200 full-time equivalents) Activity of the Belgian fish processing industry includes the production of fresh and frozen fillets smoked fish pickled seafood and prepared dishes
Belgium is a net importer of seafood products mainly from the Netherlands France Germany Denmark and Great Britain The raw materials for the processing industry are purchased on the global market for fish and fish products and the dependency on domestic landing is rather limited The sector is dominated by small and middle-sized enterprises The employees are mostly male and the overall number has increased over the years The purchase of fish and other raw material was the most important expenditure and made up for 57 of the total income in 2012 The value of unpaid labour in the Belgian fish processing industry is insignificant Subsidies represented less than 1 of the total income in 2012
The profitability was positive in 2012 but the economic performance of the sector is relatively low The Gross Value Added reached euro207 million in 2012 (25 of total income) which was an increase of 30 compared to 2011 A decrease of production costs was observed between 2011 and 2012 resulting in an increase in operating cash flow of the sector Investments have increased between 2011 and 2012 denoting positive expectations for the future of the industry in 2012 All in all the sector seems to have become more profitable despite the financial crisis
Bulgaria
In 2012 Bulgaria processing industry registered a decrease of the number of processing units from 33 in 2011 to 21 in 2012 Also the staff number decreased from 325 in 2011 to 252 in 2012 Female counted for 67 and male for 33 with a similar number for FTE unpaid labour being insignicicant The turnover decreased from euro77 million to euro72 million bit total income increased from euro89 million to euro97 million due to an increase of
20
other income by 96 in 20122011 The processing sector is dependent on the imports the processing sector is not well linked with the domestic aquaculture but is using a significant quantity of the national fleet
No additional preliminary data are available to have the opportunity for trends and developments remarks but as a general remark a slight increase could be asummed
Croatia
Republic of Croatia had 18 companies in 2011 and 20 companies in the year 2012 with the main activity in fish processing industry Most of these companies have a multitude of other activities in which they are involved outside of fish processing but the main source of revenue and traffic comes from processing Most of the enterprises belong to the category of 50-249 employees and that segment has the most significant impact on overall fish processing industry in Croatia
Total number of employees in the fish processing industry was 1273 in 2011 and 1365 employees in 2012 which is trend indicator of processing intensity From the total number of employees in 2011 that is increasing for 95 male employees in 2012 for 129 employees Except the number of employees increased was FTE and average salary however these indicators placed in a worse position because labor productivity
Economic indicators are mostly negative If we compare those two reference years (2011 and 2012) it is easy to see that almost all the indicators decreased especially other operating costs The part that shows better indication for the future is the total asset value and net investment Exactly from these indicators is expected further development and stagnation in the growth of costs
Market in Croatia is not developed and there is a lot space for improvement Fish is usually sold directly to customers such as farms fish processors or resellers who then placed the fish overseas Exports were higher than imports in the economic sense in both of the reference year although in volume terms somewhat higher were imports (in 2012) Croatia exported mostly in Spain Italy outside the EU in Japan imported from Spain Norway and Italy The largest part of the import comes from fresh fish as well as export The most imported species were Herring and in export Bluefin tuna
Trends show that the doors are opened now to the new markets after the Croatian accession to the European Union and that all together with modernization of processing facilities business development and unification of the company in a unique policy of product placement there are signs for the continued successful growth for enterprises and the entire Croatian fish processing industry
Cyprus
The Cypriot processed seafood sector is comprised of 4 enterprises in 2012 The number of enterprises has decreased in 2012 relative to 2011 thus total employment has also decreased during 2012 Total income generated by the Cypriot seafood processing sector in 2012 is euro87 million Euros and remained the same since 2011 Nevertheless income generated by seafood processing activities decreased during 2012 The 9 enterprises not included in the sector (ie seafood processing is not the main activity) generated turnover of
21
euro57 million Euros attributed to seafood processing activities in 2012 while euro81 million Euros where generated in 2011
Production costs accounted for 78 of the total income of the sector in 2012 raw material costs being the most important part of the production cost accounted for 60 of the total income Wages and salaries other operational costs and energy costs accounted for 9 5 and 4 of the total income respectively Capital costs of the sector have increased by 47 in 2012 As financial costs have decreased during 2012 depreciation of capital represents the vast majority of the capital costs
The performance indicators for the 20112012 period suggest positive performance of the sector and recovery from higher losses during 2011 nevertheless euro27 millionsmillion of GVA generated in 2012 are deteriorated by the relatively high depreciation of capital resulting in negative EBIT and net loses for the sector For the five year period (20082012) the sector has expanded both in terms of turnover generated by seafood processing activities and in terms of total income Nevertheless when turnover generated by seafood processing activities both in the sector and from companies not included in the sector is accounted for total turnover rose during 2010 (at euro213 million Euro) to decrease in 2012 to a level ((euro131 million Euro) lower than the 2008 level ((euro137 million Euro)
The Cypriot trade balance of fishery products (including aquaculture) is negative both in volume and value terms Import volume appears to have declined since 2009 and remained relatively stable since Export volume varies over the five years period In terms of value imports are relatively stable during the five years period On the contrary export value has significantly declined in 2009 and is slowly recovering since then The vast majority of Cypriot exports of fishery products since 2009 are mainly comprised of aquaculture products (gilthead seabream and seabass)
In 2013 the Cypriot financial crisis is expected to negatively affect the sector as the purchasing power of the Cypriots is expected to decline On top rising imports of low valued processed fish such as pugnacious are also expected displace the products of the sector from the Cypriot market
Denmark
Profitability of the national sector and main trends
The profitability of the Danish processing sector has been increasing from 2008 to 2011 From 2011 to 2012 the profitability decreases however the net profit of the industry is still positive The enterprises have reduced the number of employees from 2008 to 2012 to increase the competitiveness and profitability of the sector partly due to the economic crisis This has resulted in a more competitive sector increasing income reducing costs and wages and thereby increasing the economic viability of the sector Overall the Danish industry has decreased in terms of numbers of enterprises (-9) and Full time employees (28) The industry has outsourced some of their activities to countries with lower salary costs In particular the salmon industry has outsourced activities to Poland
In Denmark the most important segment is the fish meal and -oil industry which accounted for 64 of the total volume and 33 of the total value in 2012 The fish meal and fish oil factories are very important to the Danish industry and are closely linked to the fleet fishing fish for reduction The salmon processing industry is
22
the most important segment processing fish for human consumption in terms of value This industry is dependent on the large Norwegian aquaculture industry and most of the import are processed and exported to other EU countries
The segmentation on numbers of employees show that the segment with 50-249 employees dominate the overall results even though it only contains 18 of the number of enterprises However the smaller segments with 0-10 and 11-49 show a higher growth in GVA from 2011 to 2012
New developments trends and outlook
In 2013 the profitability in the Danish fish processing sector for consumption and for processing of fishmeal are expected to increase compared to 2012 The decrease in the number of enterprises and employees are also expected to continue Furthermore the positive trend since 2008 showing an increasing GVA and net profit is expected to continue owing to increasing labour productivity and due to higher prices of fish and a larger volume processed
Companies with fish processing not as main activity
The Danish industry is very ldquopurerdquo Only very few companies are processing fish outside the NACE group 1020 Statistics Denmark have identified between 3 and 6 companies from 2008 to 2012 Unfortunately the total income cannot be presented due to confidentiality reasons owing to the fact that one enterprise cover more than 80 of the total income
Estonia
In 2012 there were 61 enterprises whose main activity was fish processing in Estonia of which 85 accounted for micro- and small enterprises The turnover of these 61 enterprises was over euro143 million 2012 showed continued recovery in economic activities and strengthening of competition in the Estonian fish processing industry sector Compared to the previous year the total number of enterprises and turnover increased each 11 in 2012 Also the economic performance indicators (eg GVA OCF EBIT net profit) underwent the rise The main factors that influenced those performance indicators were increase in total income and decrease in share of production costs to total income The total number of employees in the Estonian fish processing industry was 1861 in 2012 of which 35 were male and 65 female Compared to 2011 the number of FTEs maintained the same level in 2012 Additionally there were also 11 enterprises that carried out fish processing but not as a main activity in Estonia Their turnover attributed to fish processing was approximately euro47 million
The fish processing sector in Estonia is largely dependent on exports The share of exported fish products was around 73 in 2012 Baltic herring and sprat caught by trawlers from the Baltic Sea are the most important local raw material for the Estonian fish processing enterprises Due to its small size the fish markets and processing enterprises do not depend on domestic aquaculture production
According to preliminary data the number of microenterprises whose main activity is fish processing decreases somewhat in 2013 However the growth in total production value is expected in 2013 At the end of 2013 Russia imposes import restrictions for several companies
23
Finland
There were 173 fish processing enterprises operating in Finland in 2012 of which 146 companies were processing fish as their main activity These main activity enterprises generated a total turnover of euro265 million The gross value added of processing industry was euro44 million and the net profit euro56 million in 2012 The Finnish fish processing enterprises used 80 million kg of fish as raw material 53 million kg were domestic fish and 27 million kg were imported in 2013The processing industry employed 781 FTEs or 930 persons
The fish processing industry in Finland is highly concentrated in the sense that 10 companies with the highest turnover produced around 76 of the total revenue generated by the industry in 2012 The main species used in Finnish processing were Baltic herring (31 million kg) salmon (24 million kg) and rainbow trout (18 million kg) in 2013 Most of the raw material is processed to deep frozen (Baltic herring and sprat) or fresh products (fillets etc) The main processing products are (hot and cold) smoked products of rainbow trout salmon and herring There is also a notable production of salted rainbow trout
The Finnish seafood trade balance is significantly negative Finland imported seafood with value of little less than euro300 million and exported seafood worth of around euro40 million creating a negative trade balance of euro250 million
Increasing costs and fluctuations of the price of raw materials (fish) are affecting the profitability of the industry The decrease of salmon prices affected favorably the profitability of the industry in 2012 while automatizing of salmon processing has also increased the profits
France
The structure of the French seafood processing industry has remained relatively stable between 2008 and 2012 Although the number of enterprises was slightly reduced from 327 to 295 during this period the industry created 512 jobs and employs now 16184 people The total turnover of the industry is estimated to euro486 billion in 2012 However according to the French data collection office FranceAgriMer the turnover of these companies for seafood production is only euro382 billion (786 of total turnover) The French fish processing industry is highly concentrated in 2012 the 15 companies (5) which employ more than 250 persons cumulated 57 of the total income The sector still includes numerous very small companies (in 2012 45 of the companies employ less than 10 persons) but their number shows the faster decreasing rate (-17 between 2008 and 2012)
The economic performances of the fish processing sector are improving While the turnover remained stable between 2011 and 2012 the net profit increased from euro1019 million to euro2197 million which seems to be mainly due to the decrease of operational costs The net profit represents now 4 of the turnover its higher level since 2008 when it reached 6 Investments have increased from euro803 million to euro1709 million over the period which may denote positive expectations from the future of the industry The average salary has increased by 286 since 2008 Female employees still represent the majority of the workers (54) and the proportion of part-time jobs is marginal and decreasing However part-time jobs concern also male employees now
The activity of the French fish processing industry covers a wide range of products fresh and refrigerated fish fillets the production of prepared dishes with fish crustaceans and molluscs smoked salmon prepared or
24
conserved crustaceans and molluscs surimi and canned fish from which 42 is canned tuna The French seafood processing industry is heavily reliant on imported raw material salmon shrimp and white fish (cod and pollock) are the main imported species used by the processing industry The cost of raw material has continuously increased since 2008 and raw material alone explains 93 of the increase of total production costs at the end of the period
The trade deficit of France for seafood products increased by 245 between 2008 and 2012 mainly due to a decrease of exports volume by 186 and an increase of imports value by 174 over the period French international trade of seafood products concerns mainly EU member States extra-EU trade represent less than 40 of imports and less than 25 of exports During the period 2008-2012 the trade deficit in value increased mainly between 2008 and 2009 for fresh products (+61 in value) and between 2009 and 2010 for frozen products (+29) prepared or preserved products (+11) and dried salted or smoked fish (+51) Since 2011 the context of economic crisis and the rise of the aquatic products prices attributable to the growth of the international demand have weighed on the French households demand This context of a sluggish internal demand and increasing prices for raw material may lead the French processing industry to face more competition from imported products
Germany
The fish processing sector in Germany is dominated by the large companies 75 of employees and about 83 of total turnover belong to the companies with 50 and more employees The fish processing industry is facing serious economic problems Price increases in the raw material sector and the market power of the supermarket chains led to losses of the overall sector in 2012
About 90 of fish in Germany is imported from other countries with a share of about half and half between EU and no-EU countries The seafood trade balance is increasing negative The main species imported to Germany are salmon pollack herring and miscellaneous tunas In terms of categories frozen and prepared and preserved products stand for about 70 of the imports and 80 of the exports Fresh fish only stand for about 10 to 15 of total imports
Consumption figures per head show stable per-head consumption of around almost 15 kg per year Most fish is consumed by older and higher income households
The future outlook for the German fish processing industry seems currently not to be too optimistically Figures about investment compared to depreciation show a stable trend to disinvestment or at least less physical capital in the sector This could reflect the transfer of production capacities to other countries eg Poland
Greece
The Greek fishery processing sector comprised in 2012 147 SMErsquos that do fish processing a number that has dropped by 5 since 2011 due to the continuing financial crisis but also due to company absorption especially by the largest subsector (50-249 employees) which had the biggest decrease of 25 in terms of SME number Approximately 73 of the SMErsquos are small enterprises employing less than 10 persons The turnover of the sector decreased in 2012 13 corresponding to turnover of euro2683 million in 2011 These enterprises employed 2330 persons or 2055 in terms of full-time equivalent employment (FTE) The number of full-time
25
employees was decreased by 210 FTErsquos in 2012 compared to the number detected in 2011 FTE per enterprise is estimated at 140 (149 was in 2011) Net profit of the sector decreased 107 in 2012 compared to the previous year Thus average wages and salaries of staff decreased as well during the same period approximately 17 and reached to euro10900 in 2012 from the amount of euro13200 in 2011
Therefore if someone is asked to justify the current underperformance of the fish processing industry in Greece in economic and social indicators could provide the following arguments The ongoing for the fifth consecutive year financial crisis reflects to low available cash flow due to limited access especially in the case of small companies to bank financing and loaning and due to low net profit or yearly economic losses These two factors prevent the much desired completion of trade agreements for fish and raw material purchases successful application of marketing strategies and implementation of new investments The added to the above continuous rise of the fish and raw material prices and energy costs lead also to increased cost of production
The Greek fish processing enterprises may apply income from subsidies as investment from the European Union The aim of this investment subsidy is to develop new infrastructure in general but also new mechanical equipment in terms to producing high quality and high nutritional value processed fishery products and to modernise the existed processing lines for producing high added value traditional fishery delicatessen
Ireland
There were 164 fish processing enterprises in Ireland in 2012 The number of fish processing enterprises has decreased by 5 since 2008 The total turnover of the Irish fish processing industry in 2012 was euro6565 million which is an increase of 18 from 2011
In 2012 there were approximately 2678 FTErsquos employed in the fish processing industry which was made up of 1797 Male FTErsquos and 881 Female FTErsquos Male employees represent around 67 of the total employees and the proportion of malefemale employees has been relatively constant over time Investment in the seafood industry has led to an increase in the numbers employed through the provision of grant aid in specific schemes and programmes
In 2012 Ireland imported 114469 tonnes of Seafood with a value of euro179 million which was an increase of 171 from 2008 when 42284 tonnes of Seafood were imported
For the same period exports amounted to 260159 Tonnes with a value of euro511 million This was an increase of euro125 million or 32 from 2011 driven by higher unit prices for Irish Seafood and a large increase in the volumes of seafood exported During 2012 exports to EU countries represented 70 of total Irish seafood exports Irish seafood exports to Russia Egypt South Korea and Asia continued to grow
In terms of economic performance the estimated Gross Value Added (GVA) Operating Cash Flow Earnings before Interest and Tax and Net Profit for the Irish processing sector in 2012 were euro1108 million euro384million euro226 million and euro189 million respectively
26
Italy
The turnover of the Italian processing sector amounted in 2012 to 2557 billion euro while the total value of production (turnover + subsidies + other income) amounted to euro2582 million Turnover represents about 99 of the total value of production If looking at the trend the main income items appear to have increased compared to 2011 +12 for turnover and +35 for subsidies The Italian fish processing industry is characterized by a double-face organization on the market on the one hand there is the so-called modern sector with a few large industrial companies and on the other hand there is the traditional sector highly atomized and formed mainly by micro small and medium-sized enterprises many of which are organized on a family basis Indeed 70 of enterprises is represented by micro-enterprises with less than 10 employees
The number of people employed in the sector was equal to 6197 people consisting in 5223 FTE The Italian fish processing industry is a very concentrated sector the main segment is the canning sector with the most important products being canned and preserved tunas in the 2012 the production of canned tuna was equal to 665 thousand tonnes in volume and euro148 billion in value Beside the tuna sector there is also a significant number of companies processing anchovies sardines and shellfish
The Italian fish processing sector is highly dependent on imports as far as the supply of raw material In general Italy is to be considered a net importer of fish products Indeed the Italian seafood markets has been characterised in the last decades from a substantial increase in the total demand for fish products mainly due to the increase in the per capita consumption (higher propensity to consume fish proteins higher focus on more healthy products higher life standards) and by an increase of total population The role of imports has been and is still fundamental in satisfing the domestic demand taking into account a national apparent consumption very much higher than domestic production (from fishery and acquaculture) This has become mainly evident since the mid lsquo90s when the increase in imports has been pushed by the decrease in domestic production Taking into account the importance of the canned tuna products the sector continues to record a strong dependence on imports of frozen tuna and tuna loins Canned tuna is confirmed also as the main export product
Latvia
Fish processing is very important for Latvian agriculture and for employment especially in the coastal areas The processing sector in Latvia is fully based on the local natural resources But North Sea and North East Atlantic Herring and Scomber imported from Norway were used for raw material for the production of canned fish In the most cases fish processing enterprises are situated in the coastal regions There were 5781 persons of total employment in 2012 In the most cases in the segment with less than 10 employees fish processing is a family business There were 101 registered economic active fish processing enterprises in 2012 with the total turnover 2388 million Euros
Fish processing production has important share in total Latvian export and supplies domestic market Export of fish production was to 53 countries and import from 44 countries in 2012 The export of fish production mainly is made Baltic Sea and the Atlantic Ocean catches obtained by the Latvian fishing vessels External trade balance for fisheries products in 2012 was 301 million euros
The subsidies increased extremely in 16 times from 2008 to 2012 Total profit for the fish processing industry which showed 124 million euros in 2008 changed to total loss of 17 million euros in 2011 The main reason of
27
loss in processing industry is the negative impact of global economic crisis to economic situation in Latvia The economic situation improved in 2012 and Net Profit has a significant increase by 32 between 2008 and 2012 and was 168 million euro in 2012 The investments also increase significantly in 3 times for the same period and were 207 million euro in 2012 Several fish processing companies due to availability of the EFF have benefited from the good investment possibilities that have been used for modernization and obtaining of new processing equipment to diversify products improve quality of the production and increase productivity
Lithuania
In 2012 Lithuanian fish processing industry consisted of 33 enterprises whose main activity was fish processing For such part of industry population changed insignificantly compare to 2011 In 2012 the total income of Lithuanian processing industry consisting of turnover from processing and other income was euro3476 million with 10 annual increase The higher total income was a result of increased in other income whereas turnover from fish processing declined by 5 Lithuanian processing industry is highly dependent from imported raw material In 2012 imported raw material in terms of volume accounted for 97 of the total amount used in manufacturing process The structure of production by type has remained almost constant from year to year with the majority of supply as surimi products (29) following by smoked fish (20) and canned production (11) The significant part of production from processing industry also comes as frozen cod fillets and prepared salted products from Atlantic herring mostly salted fillets and in brine During 2012 in terms of value 714 of production was exported Export market consisted from 97 of EU countries 17 of CIS countries and 13 other countries The main commodities for export were surimi salted and smoked salmon production prepared and preserved fishery products In 2012 Lithuanian processing industry employed 4451 employees by gender consisting from 67 of female and 33 of male corresponding to 2974 and 1477 employees respectively The number of employed females in 2012 increased by 3 compare to 2011 whereas number of employed male decline by 5 Taking into consideration the long term cost structure purchase of raw material took a largest part in total cost structure and increased year by year finally reaching 70 of total costs in 2012 In 2012 Lithuanian fish processing industry generated 613 million Euros of Gross Value Added (GVA) and euro256 million net profit Vertical integration of fishery production covering higher production value chain and increasing value of produced raw material is one of trends of fishery sector developments especially at small scale aquaculture enterprises providing production for local regional market
Malta
During 2012 the number of enterprises in the Maltese fish processing industry was reduced to six from eight in 2011 Such decrease can also be reflected in total turnover of the processing sector For 2012 the total turnover has decreased by 215 from 2011 while turnover for 2012 has increased from 2010 by 285 It should also be noted that 67 of the enterprises in Maltarsquos fish processing industry belong to the smallest enterprise segment (le10 employees)
The year 2012 compared to 2011 demonstrated a significant increase of 89 in FTE employees in the processing sector that mainly concerned new male employees (160 increase of FTE male employees 7 of FTE male employees) Although in 2011 there were no indication of unpaid labour within the industry in 2012 37500 euro were reported as imputed value of unpaid labour This reflects an increase in number of workers within the processing industry
28
Despite the fact that the total turnover for 2012 has decreased by 22 the enterprises managed to increase their net profits by 158 from 2011 Similar increase can also be reflected in gross value added (111) operating cash flow (116) and earnings before interest and tax (141) Total value of assets has increased by 50 while debt has also increased by 51 when comparing it to 2011 The 2012 performance indicators demonstrate 1189 capital productivity 1053 return of investment 74 financial position and 1063 future expectation indicator
During 2012 4 enterprises were categorised under segment 1 (enterprises employing less than 10 employees) while the other 2 enterprises were categorised under segment 2 (enterprises employing between 11 and 49 employees) Since 2008 none of the enterprises in the Maltese fish processing industry sector has employed more than 49 employees The economic performance of the Maltese fish processing industry sector is improving under both segments
The Maltese fish processing sector is mostly represented by enterprises whose main products are preserving and processing of tuna shrimps other marine fish and other products The processed seafood is mainly exported to the Great Britian and Italy In recent years the trend in processing sardines has been decreasing while the trend for processing shrimps has been increasing
Due to change in demand and production in 2012 some enterprises in the Maltese fishing process industry have replaced their old equipment with the latest technology Such modernization is helping these enterprises to diversify their products improve quality of the production and increase productivity Hence the Maltese fish processing enterprises will be able to beat the challenges of foreign competition
The Netherlands
In 2012 there were 84 fish processing companies in the Netherlands with a turnover of euro775 million The Netherlands is an important trading hub for the transport of fish to other EU countries The reliance of the Dutch processing industry on domestic catches has become less important because of declining catches of some of these domestic species and the increasing import of other seafood products Most enterprises in the Dutch fish processing industry are small and have less than 10 employees In 2012 the total income showed a decrease of 4 compared to 2011 even as the production cost The cost for the purchase of raw material is the main contributor to the growth in the total production cost which was 5 lower in 2012 compared to 2011 Compared to 2008 there is a 10 increase in the cost of raw material Important drivers for the Dutch processing industry are sustainability certification and the reform of the Common Fisheries Policy and Common Market Organisation The fish processing industry is getting more familiar with the trading business and it is expected that trading will grow in the coming years
Poland
Fish processing industry in Poland is strong and still developing It has the ability of generating profits for the companies and jobs and incomes for the involved workers In 2012 the turnover increased to euro193 billion by 7 compared to the previous year and 29 compared to 2008 Turnover created nearly the whole total income (99) As a result of increase in turnover and reduction of financial costs (about 80) net profit increased to 475 million Euros by 43 compared to the previous year The level of other economic and financial indicators of fish processing (GVA -euro2418 million OCF -euro958 million EBIT-euro546 million) shows that the sector in 2012 was in a safe financial and economic situation
29
The average number of employees was 15972 representing an increase of 1 compared to the previous year As in previous years the majority of the employed (67) were women and the number of female employees increased by 1 compared to the previous year and did not change compared to 2008 Most employees worked full-time and FTE amounted to 15088
The volume of production slightly increased to 4106 thousand tonnes (by 130 compared to 2011) The prepared and preserved fish had share of 486 of the total production smoked fish 204 frozen fish filets and fish meat covered 169 fresh or chilled fish filets and fish meat 55 salted fish 46 and other inedible fish products 39
In 2012 as in previous years a key driver of fish processing sector development was of foreign trade of raw material and final products Imports played a dominant role in the supply of raw materials because of limited ability to harvest fish from the Baltic Sea and limited production of aquaculture Exports of fish and fish products amounted to 230 thousand tonnes with a value of euro104 billion which represent an increase by 13 and 36 compared to 2008
Most of projects which modernized fish processing technologies and manufacturing process were funded from the European fisheries fund (EFF) on the basis of operational program ldquoSustainable development of fisheries sector and coastal fishing areas 2007-2013rdquo About 75 of the available allocation for subsidies for investment in fish processing was contracted in 2012
Further development of the fish processing industry in Poland is expected and exports and investment will be the factor that accelerates the pace of development
Portugal
Portuguese domestic market is a large final consumer for fish and fish products the biggest within the EU in per capita consumption with around 57 Kgpersonyear
In 2012 Fish Processing Industry in Portugal consisted of 180 enterprises 91 of which were small enterprises with less than 11 employees Most enterprises are located in the north (61) and centre (66) of the country All together these enterprises employed 6823 people and production amounted to 212 thousand tonnes and a total income of euro1078 million
Female employees represent about two thirds of total employees
Production in 2012 Frozen industry ndash 1059 thousand tonnes Salting and drying ndash 614 thousand tonnes Cannery and preparation ndash 447 thousand tonnes
The Portuguese fish processing industry still has an enormous dependency on imports in order to fulfil the demand for the huge per capita consumption This dependency will continue to grow in the near future mainly due to restrictions on catches imposed by quota regulation Only the canning sector still depend on domestic production (mainly for sardine and mackerel) while the salting and drying sector depends almost exclusively on imports Dependency of cannery in imports will probably grow as the sardine catches reduce substantially (from 55 thousand tonnes in 2011 to 15 thousand tonnes in 2014) The industry will remain profitable although the expected increase in fish prices will put pressure in its profitability
30
The Portuguese Trade Balance for fish and fisheries and aquaculture products is typically negative with total imports of about twice the total amount of exports In 2012 this deficit was of about 180 thousand tonnes or euro690 million These figures partially recovered from 2011 to 2012 in volume (-201 to -181 thousand tonnes) but get a negative increase in value (-euro641 to -euro690 thousand) Frozen products gives the biggest share to this reality (-131 thousand tonnes -euro410 thousand tonnes) Dried and salted products also get big responsibility on the negative result (-53 thousand tonnes-euro233 million)
In general some stability on structure and economic results is expected in the future
Romania
In 2012 there were reported data for 14 enterprises whose main activity was fish processing in Romania of which 64 accounted as small and micro-enterprises a smaller number than 2012 The turnover was decreased amounting only over euro304 million 2012 showed continued in a concentration of specialized processors mainly in the segment 11-49 employees ndash 50 Processing industry sector was facing competition from the big supermarket chains and imports Compared to the previous year the total number of enterprises and turnover decreased by 36 as number and 32 as turnover in 2012 Also the economic performance indicators (eg GVA OCF EBIT net profit) underwent the trend The main factors that influenced those performance indicators were decrease in total income and decrease in share of production costs to total income but only by 11 The total number of employees was 780 in 2012 of which 497 were male and 503 female Compared to 2011 the number of FTEs maintained the same descendent trend in 2012 Additionally there were also 24 reporting data enterprises that carried out fish processing but not as a main activity in Romania Their turnover attributed to fish processing was approximately euro43 million
The fish processing sector in Romania is largely dependent on import Sprat caught by trawlers and Rapa whelk are the most important local raw material for the Romania fish processing enterprises and exporters The fish markets and processing enterprises are well linked with domestic aquaculture production
According to preliminary data the microenterprises whose main activity is fish processing decreases but a slight increase in total production is expected in 2013
Slovenia
In 2012 there were 15 companies in the Slovenian fish processing sector Between 2008 and 2012 the number of companies increased by 25 In 2012 Slovenia had 10 companies with less than 10 employees two companies with 11-49 employees and three companies with 50-249 employees Among them are 6 companies with fish processing as not main activity These companies generate euro21 million of turnover from fish processing which representing 65 of all turnover from fish processing activities
In 2012 the turnover was euro323 million Between 2008 and 2012 the turnover of Slovenian fish processing industry increased by 11
The value of raw material decreased by 32 from 2008 to 2012 and amounted euro112 million in 2012
In the Slovenian fish processing sector was 354 employees in 2012 With respect to the gender of those in employment women are predominated with 206 employees According to the FTE there were 306 FTE
31
employees in 2012 Among them were 178 women and 128 men The level of employment increased between 2008 and 2012 with total employed increasing by 42 whiles the number of FTEs increased by 45 over the period
Slovenian seafood trade balance is significantly negative Slovenian fish processing industry mainly depends on imports of raw materials The raw material for fish processing industry is traded from all over the world but most of the raw material comes from the EU The largest Slovenian seafood import partners in 2012 were Italy Spain and Croatia Concerning export in the same year the largest partners were Austria Croatia and Bosnia and Herzegovina
Slovenia consumes around 9 kg of fish per year per capita which is well below the European average of 223 kg However fish consumption per capita in Slovenia is growing due to increasing awareness of healthy lifestyles So in the future we can expect further development of the fisheries processing industry in Slovenia and therefore higher revenues from this sector Because of the increased number of enterprises in the future and resulting increased competition we can expect a fall in prices of fish products and thus lower profits
Spain
The Spanish fish processing industry keeps being an important source of employment and welfare for the coastal communities Despite a decrease in activity between 2008 and 2011 mainly due to the impacts of the financial crisis signs of recovery and increased efficiency can be observed in 2012
The industry however has shown to be profitable in all the observed period according to Income and other economic indicators Large companies over 250 employees have leaded the economic evolution of the total industry Significant increases in labor productivity result from more capital intensive processes allowing economies of scale On the contrary medium size companies has significantly reduced their contribution to the GVA and operating cash flow A significant redistribution of the activity from smaller to large size companies appears to be happening and may be explained by the intensification of the production processes in the larger companies
Certain segments of the seafood processing industry like cannery are as well the main engines behind the trade flows in the international trade of fish and shellfish products whether on the side of imports or exports Besides being a net fish importer country in general the negative trade balances are quite different in absolute value when disaggregating the different categories of commodities
Sweden
The fish processing industry sector in Sweden is very heterogeneous with small family businesses processing their own landings as well as larger enterprises with large scale industrial production Total income as well as turnover has increased during the period but not as much as the main production cost (purchase of raw material)
The purchase of raw material for production accounts to 60 of the total production costs and the industry imports approximately 70 of all of its raw material This makes the industry dependent on prices of raw material tariff quotas and changes in exchange rates Most of the indicators show an increase for the industry
32
as a whole since gross value added (GVA) return on investment (ROI) and EBIT (earnings before interest and taxes) all were higher in 2012 compared to 2008
To a large extent the Swedish processing industry uses different certifications like the MSC ASC and the Swedish KRAV certification Non-certified products are hard to place on the market since consumer awareness has increased In recent years demand has increased for highly processed products that are almost ready to eat since most consumer prefer food that are almost ready to eat easy to cook and healthy at the same time
Changes in the exchange rate of the Swedish krona (SEK) are of great importance of the processing industries economic performance If the data was converted into SEK a different development (percentage change) would have been shown especially for 2009 when the Swedish krona was weak
United Kingdom
The UK fish processing industry has decreased in size in recent years the latest available DCF data suggests that the sector consisted of approx 375 businesses in 2012 whose majority of turnover was attributed to fish processing a decrease of around 28 compared with 2008 figures Underlying the recent contraction in industry size was a further pronounced decline in the number of businesses with 10 or fewer FTEs This grouprsquos shares of industry income and employment of have also decreased The total number of FTEs employed by those companies was around 17855 in 2011 a decrease of around 11 from 2008 With the disproportionate decline seen in the number of businesses in the smallest size category average enterprise size has been increasing and was 48 in 2012
The combined turnover of those companies (turnover from all activities not just processing activity) was approx euro75 billion euro in 2012 which was around 23 higher than in 2008 (in nominal terms) but 1 lower than in 2011 Since 2010 a combination of lower turnover and higher operating costs particularly raw material costs has placed additional financial pressure on the industry resulting in tighter (albeit overall still healthy) profit margins Processing companies have also been combating a number of other difficulties such as difficult access to trade and longer-term credit post-crisis increasing fuel and energy costs etc
HOW TO OBTAIN EU PUBLICATIONS
Free publications
bull one copy
via EU Bookshop (httpbookshopeuropaeu)
bull more than one copy or postersmaps
from the European Unionrsquos representations (httpeceuropaeurepresent_enhtm)
from the delegations in non-EU countries
(httpeeaseuropaeudelegationsindex_enhtm)
by contacting the Europe Direct service (httpeuropaeueuropedirectindex_enhtm)
or calling 00 800 6 7 8 9 10 11 (freephone number from anywhere in the EU) () () The information given is free as are most calls (though some operators phone boxes or hotels may charge you)
Priced publications
bull via EU Bookshop (httpbookshopeuropaeu)
Priced subscriptions
bull via one of the sales agents of the Publications Office of the European Union
(httppublicationseuropaeuothersagentsindex_enhtm)
[Ca
talo
gu
e n
um
be
r]
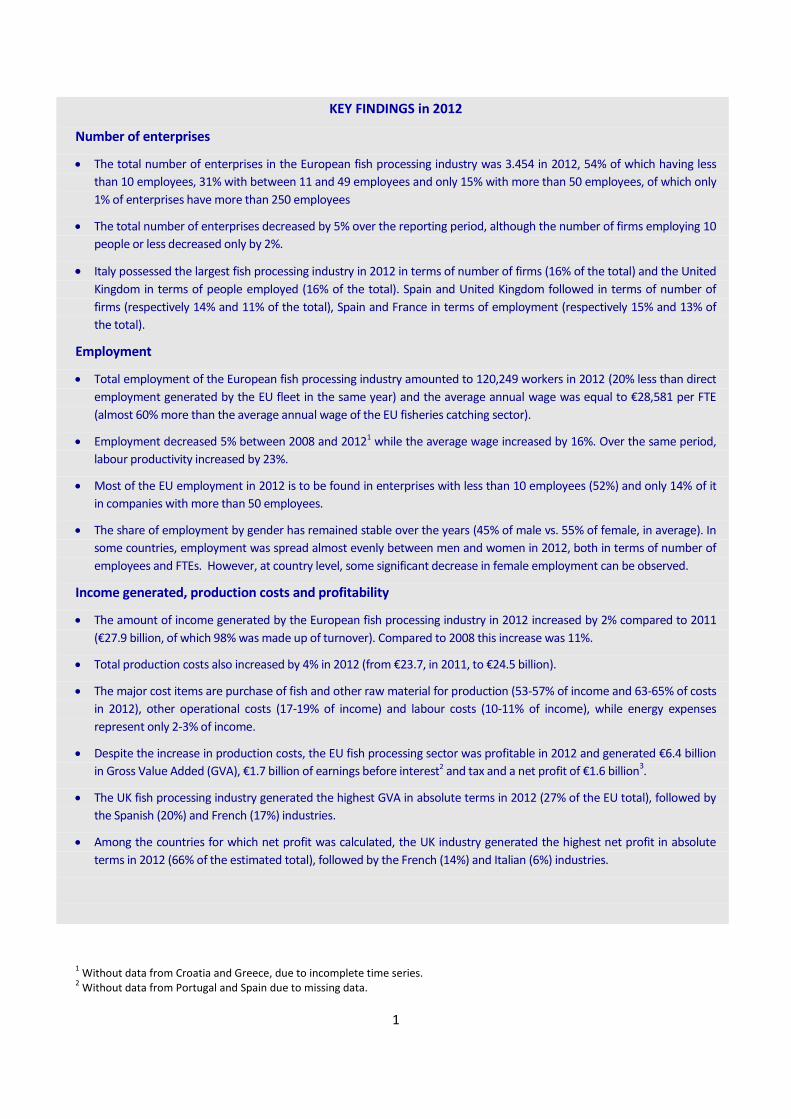
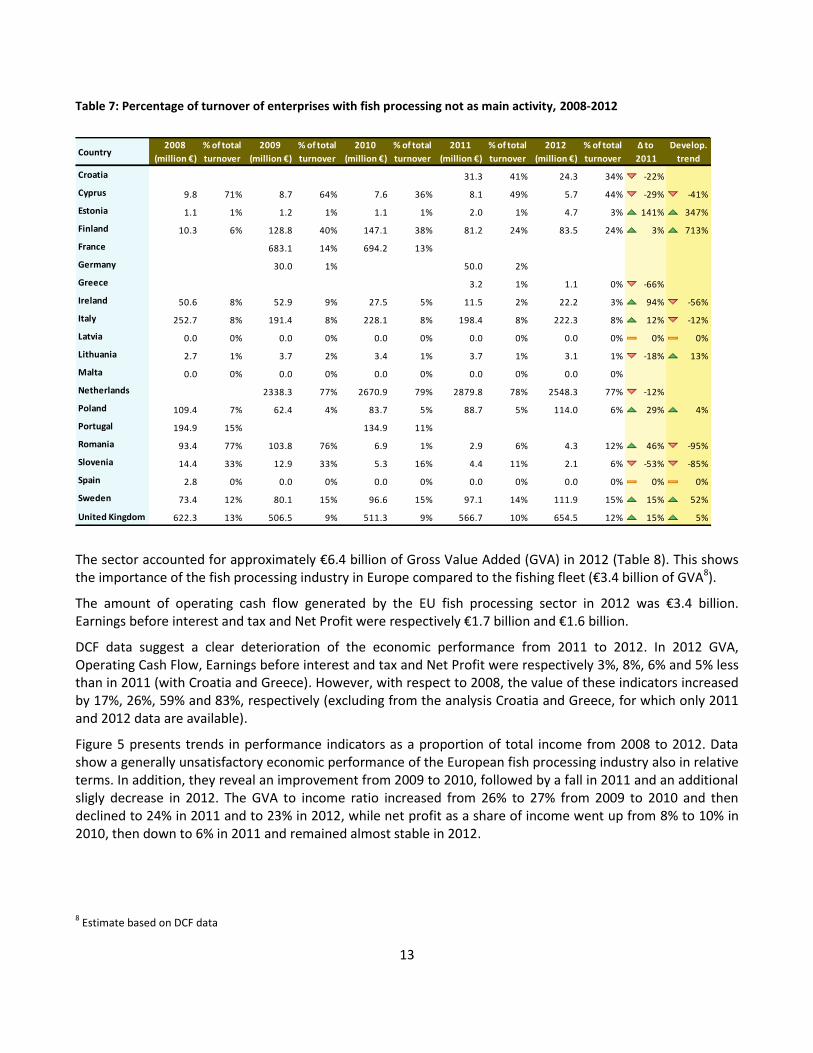

[Ca
talo
gu
e n
um
be
r]