Embed Size (px)
Citation preview

WORLD MALARIA REPORT 2015 Summary
© World Health Organization 2016All rights reserved. Publications of the World Health Organization are available on the WHO website (www.who.int) or can be purchased from WHO Press, World Health Organization, 20 Avenue Appia, 1211 Geneva 27, Switzerland (tel: +41 22 791 3264; fax: +41 22 791 4857; email: [email protected]).Requests for permission to reproduce or translate WHO publications – whether for sale or for noncommercial distribution – should be addressed to WHO Press through the WHO website (http://www.who.int/about/licensing/copyright_form/en/index.html).The designations employed and the presentation of the material in this publication do not imply the expression of any opinion whatsoever on the part of the World Health Organization concerning the legal status of any country, territory, city or area or of its authorities, or concerning the delimitation of its frontiers or boundaries. Dotted and dashed lines on maps represent approximate border lines for which there may not yet be full agreement.The mention of specific companies or of certain manufacturers’ products does not imply that they are endorsed or recommended by the World Health Organization in preference to others of a similar nature that are not mentioned. Errors and omissions excepted, the names of proprietary products are distinguished by initial capital letters.All reasonable precautions have been taken by the World Health Organization to verify the information contained in this publication. However, the published material is being distributed without warranty of any kind, either expressed or implied. The responsibility for the interpretation and use of the material lies with the reader. In no event shall the World Health Organization be liable for damages arising from its use.Printed by the WHO Document Production Services, Geneva, SwitzerlandWHO/HTM/GMP/2016.2

3
IntroductionThe World malaria report 2015 summarizes progress in malaria control and elimination in a milestone year: 2015 marked the end of the era of Millennium Development Goals (MDGs) and was the target year for the malaria goals set by the World Health Assembly and other global institutions.
The report shows a dramatic decline in the global malaria burden since 2000. The malaria component of Target 6C of the MDGs – to have halted by 2015 and begun to reverse the incidence of malaria and other major diseases – was achieved convincingly. Fifty-seven countries reduced their malaria cases by 75%, in line with the World Health Assembly’s target for 2015. For the first time since WHO began keeping track, the WHO European Region reported zero indigenous cases of malaria.
Despite this tremendous progress, much more needs to be done to further reduce the malaria burden. The Global technical strategy for malaria 2016–2030, approved by the World Health Assembly in May 2015, set ambitious but achievable targets for 2030, including a reduction of at least 90% in global malaria incidence and mortality.
The complete World malaria report 2015 can be found at:http://www.who.int/malaria/publications/world-malaria-report-2015/report/en/
© T
he G
loba
l Fun
d/Jo
hn R
ae

WO
RLD
MAL
ARIA
REP
ORT
201
5 SUMMARY
4
Distribution of malariaThe number of countries and territories with ongoing malaria transmission has decreased since 2000In 2000, there were 106 countries and territories with ongoing malaria transmission; by the end of 2015, there were 95. Data were assembled from these 95 countries and territories, and from a further six countries that have recently eliminated malaria, to produce the World malaria report 2015.
Countries with ongoing transmission of malaria, 2000 and 2015
Non-endemic or no ongoing malaria transmisionEndemic in 2000, no longer endemicMalaria endemic Not applicable

5
Estimated cases and deathsThere have been large reductions in the number of malaria cases and deaths since 2000The number of malaria cases fell from an estimated 262 million globally in 2000 (range: 205–316 million), to 214 million in 2015 (range: 149–303 million), a decline of 18%. The number of malaria deaths globally fell from an estimated 839 000 in 2000 (range: 653 000–1.1 million), to 438 000 in 2015 (range: 236 000–635 000), a decline of 48%. Most cases and deaths in 2015 are estimated to have occurred in the WHO African Region (88%), followed by the WHO South-East Asia Region.
Estimated malaria cases and deaths, by WHO region, 2000–2015
Estimated number of malaria cases (000's) Change Estimated number of malaria deaths Change
WHO region 2000 2005 2010 2015 2000–2015 2000 2005 2010 2015 2000–2015
African 214 000 217 000 209 000 188 000 -12% 764 000 670 000 499 000 395 000 -48%
Americas 2 500 1 800 1 100 660 -74% 1 600 1 200 1 100 500 -69%
Eastern Mediterranean
9 100 8 600 4 000 3 900 -57% 15 000 15 000 7 000 7 000 -51%
European* 36 5.6 0.2 0 -100% 0 0 0 0
South-East Asia 33 000 34 000 28 000 20 000 -39% 51 000 48 000 44 000 32 000 -37%
Western Pacific 3 700 2 300 1 700 1 500 -59% 8 100 4 200 3 500 3 200 -60%
World 262 000 264 000 243 000 214 000 -18% 839 000 738 000 554 000 438 000 -48%
Lower bound 205 000 203 000 190 000 149 000 653 000 522 000 362 000 236 000
Upper bound 316 000 313 000 285 000 303 000 1 099 000 961 000 741 000 635 000
* There were no recorded deaths among indigenous cases in the WHO European Region for the years shown.Source: WHO estimates
6
WO
RLD
MAL
ARIA
REP
ORT
201
5 SUMMARY
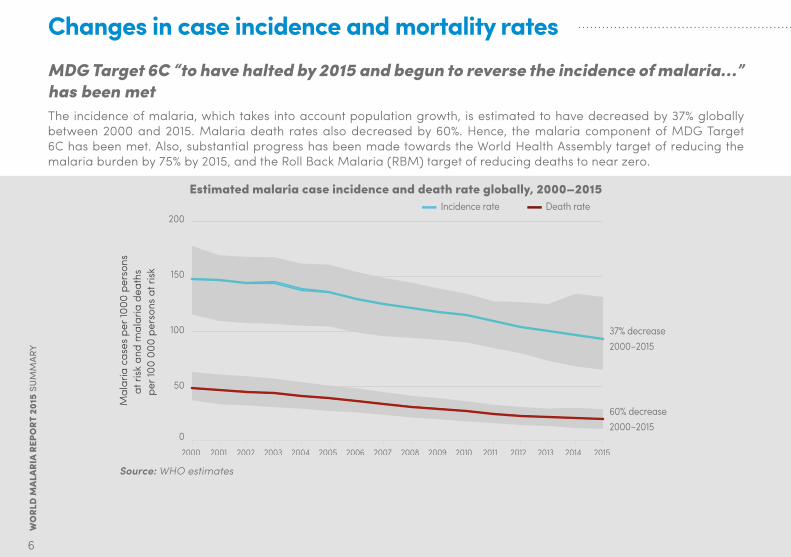
Changes in case incidence and mortality ratesMDG Target 6C “to have halted by 2015 and begun to reverse the incidence of malaria…” has been metThe incidence of malaria, which takes into account population growth, is estimated to have decreased by 37% globally between 2000 and 2015. Malaria death rates also decreased by 60%. Hence, the malaria component of MDG Target 6C has been met. Also, substantial progress has been made towards the World Health Assembly target of reducing the malaria burden by 75% by 2015, and the Roll Back Malaria (RBM) target of reducing deaths to near zero.
Estimated malaria case incidence and death rate globally, 2000–2015Death rateIncidence rate
Mal
aria
cas
es p
er 10
00 p
erso
ns
at ri
sk a
nd m
alar
ia d
eath
s pe
r 100
000
per
sons
at r
isk
200
150
100
50
0
37% decrease2000–2015
60% decrease2000–2015
2015201420132012201120102009200820072006200520042003200220012000
Source: WHO estimates

7
57 countries and territories have reduced malaria case incidence by >75%Substantial reductions in malaria incidence and mortality rates have occurred across the globe.
Estimated change in malaria case incidence 2000–2015, by WHO regionAFR AMR EMR EUR SEAR WPR
Num
ber o
f cou
ntrie
s
60
50
40
30
20
10
0Unable to assess Increase <50% 50–75%
Decrease in malaria incidence
>75%
AFR, African Region; AMR, Region of the Americas; EMR, Eastern Mediterranean Region; EUR, European Region; SEAR, South-East Asia Region; WPR, Western Pacific Region Source: WHO estimates
WO
RLD
MAL
ARIA
REP
ORT
201
5 SUMMARY
8
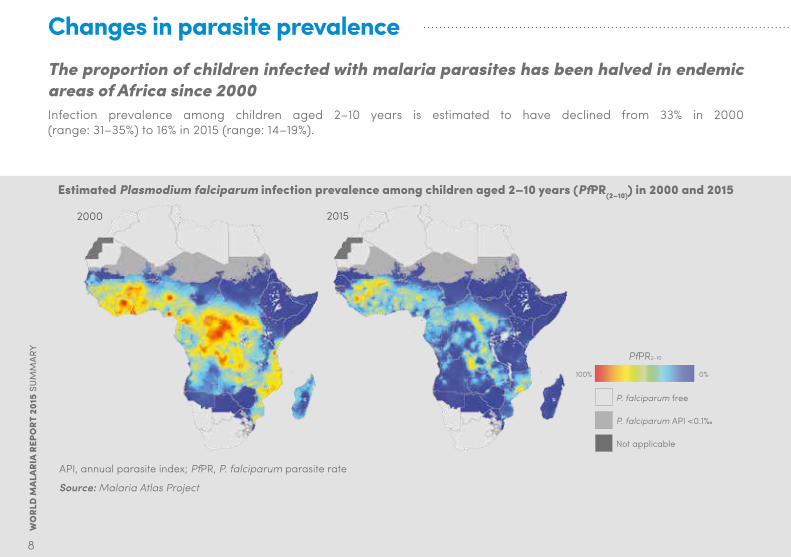
Changes in parasite prevalenceThe proportion of children infected with malaria parasites has been halved in endemic areas of Africa since 2000Infection prevalence among children aged 2–10 years is estimated to have declined from 33% in 2000 (range: 31–35%) to 16% in 2015 (range: 14–19%).
Estimated Plasmodium falciparum infection prevalence among children aged 2–10 years (PfPR(2–10)) in 2000 and 2015
2000
Not applicable
PfPR2–10
0%100%
P. falciparum free
P. falciparum API <0.1‰
2015
API, annual parasite index; PfPR, P. falciparum parasite rate
Source: Malaria Atlas Project

9
Leading causes of deaths in sub-Saharan AfricaMalaria is no longer the leading cause of death among children in sub-Saharan AfricaThe number of malaria deaths in children aged under 5 years is estimated to have decreased from 723 000 globally in 2000 (range: 563 000–948 000) to 306 000 in 2015 (range: 219 000–421 000), with the bulk of this decrease occurring in sub-Saharan Africa. Reductions in malaria deaths have contributed substantially to progress towards achieving MDG Target 4A, which was to reduce the under-5 mortality rate by two thirds between 1990 and 2015.
Leading causes of death* among children aged under 5 years in sub-Saharan Africa, 2000–2015
30
25
20
15
10
5
02014 201520132012201120102009200820072006200520042003200220012000
MalariaPrematurity
Birth asphyxia and birth trauma Diarrhoeal diseases
Measles Acute respiratory infections
Dea
ths
per 1
000
live
birth
s
*Conditions that are responsible for more than 10 deaths per 1000 live births during any time between 2000 and 2015 are shown.Source: WHO estimates
10
WO
RLD
MAL
ARIA
REP
ORT
201
5 SUMMARY
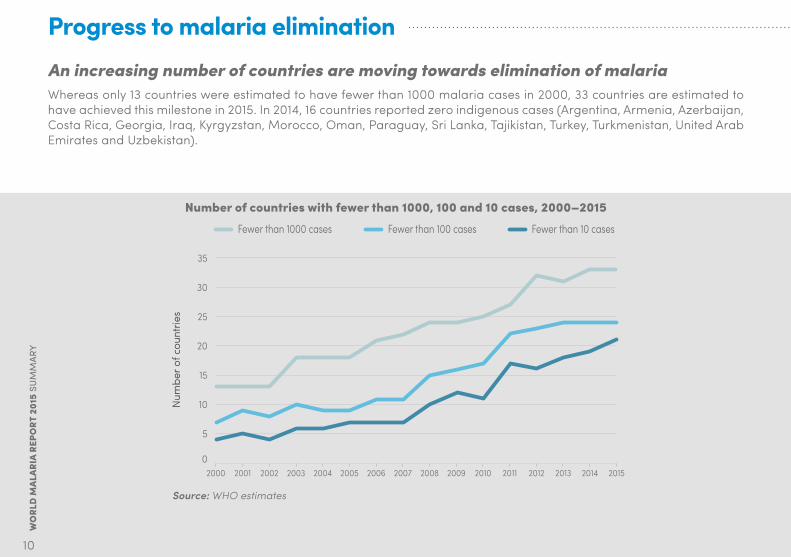
Progress to malaria eliminationAn increasing number of countries are moving towards elimination of malariaWhereas only 13 countries were estimated to have fewer than 1000 malaria cases in 2000, 33 countries are estimated to have achieved this milestone in 2015. In 2014, 16 countries reported zero indigenous cases (Argentina, Armenia, Azerbaijan, Costa Rica, Georgia, Iraq, Kyrgyzstan, Morocco, Oman, Paraguay, Sri Lanka, Tajikistan, Turkey, Turkmenistan, United Arab Emirates and Uzbekistan).
Number of countries with fewer than 1000, 100 and 10 cases, 2000–2015
35
30
25
20
15
10
5
020132012 2014 2015201120102009200820072006200520042003200220012000
Fewer than 1000 cases Fewer than 100 cases Fewer than 10 cases
Num
ber o
f cou
ntrie
s
Source: WHO estimates

11
In 2015, the WHO European Region reported zero indigenous malaria cases for the first timeIn 2000, there were 32 394 indigenous cases of malaria in the WHO European Region. By 2005, control efforts had reduced this number to 5072, and the nine affected countries made a commitment through the Tashkent Declaration to eliminate malaria from the region by 2015. The number of indigenous malaria cases decreased to just 179 in six countries in 2010. The last indigenous case of Plasmodium falciparum malaria in the region was reported in Tajikistan in 2009. The years 2011 and 2012 saw renewed malaria transmission – in Georgia (isolated cases), and in Greece and Turkey (localized outbreaks) – but these resurgences were brought under control, and no indigenous cases were detected in 2015.
Indigenous malaria cases in the WHO European Region, by country, 1990–2015
Num
ber o
f ind
igen
ous
mal
aria
cas
es
100 000
80 000
60 000
40 000
20 000
0201520102005200019951990
Georgia Armenia Other countriesKyrgyzstanAzerbaijanTajikistanTurkey
Source: National malaria control programme reports and WHO estimates

WO
RLD
MAL
ARIA
REP
ORT
201
5 SUMMARY
12
Insecticide-treated mosquito nets (ITNs)The proportion of the population at risk of malaria in sub-Saharan Africa with access to and sleeping under an ITN has increased dramatically since 2000The proportion of the population sleeping under an ITN increased from less than 2% in 2000 to an estimated 55% in 2015 (range: 50–58%). Ensuring access to ITNs has been critical to increasing the proportion of the population sleeping under an ITN. Nearly 500 million ITNs were delivered to countries in sub-Saharan Africa between 2013 and 2015, and the proportion of the population with access to an ITN increased to an estimated 67% in 2015 (range: 61–71%).
Proportion of the population at risk with access to an ITN and proportion sleeping under an ITN in
sub-Saharan Africa, 2000–2015
Prop
ortio
n of
pop
ulat
ion
at ri
sk
100%
80%
60%
40%
20%
0%
20142013
20122011
201020152009
20082007
20062005
20042003
20022001
2000
Population sleeping under an ITNPopulation with access to an ITN
95% confidence interval
ITN, insecticide-treated mosquito netSource: ITN coverage model from Malaria Atlas Project, with further analysis by WHO

13
Indoor residual spraying (IRS)
Percentage of the population protected by IRS or with access to ITNs in sub-Saharan Africa, 2014
<25%
25–49%
50–74%
>75%
Not malaria endemic
Not applicable
IRS, indoor residual spraying; ITN, insecticide-treated mosquito netSource: National malaria control programme reports and insecticide-treated mosquito net coverage model from Malaria Atlas Project, with further analysis by WHO
The proportion of the population at risk protected by IRS has declined in recent yearsNational malaria control programmes (NMCPs) often target only selected populations for IRS. The proportion of the population at risk protected by IRS declined globally from a peak of 5.7% in 2010 to 3.4% in 2014. Decreases were seen in all regions except the WHO Eastern Mediterranean Region. The WHO African Region had the largest number of persons and the largest proportion of the population at risk protected by IRS in 2014.

WO
RLD
MAL
ARIA
REP
ORT
201
5 SUMMARY
14
Chemoprevention in pregnant womenThe proportion of pregnant women receiving three or more doses of preventive therapy for malaria has increased in recent years, but is still less than 20%Since WHO revised its recommendation in 2012, the proportion of pregnant women receiving at least three doses of intermittent preventive treatment in pregnancy (IPTp) has increased. In 2014, an estimated 52% of eligible pregnant women received at least one dose of IPTp, 40% received two or more doses, and 17% received three or more doses.
Proportion of pregnant women receiving IPTp, by number of doses, sub-Saharan Africa, 2007–2014Pr
opor
tion
of p
regn
ant w
omen
100%
80%
60%
40%
20%
0%20142013201220112010200920082007
At least 1 dose of IPTp At least 2 doses of IPTp At least 3 doses of IPTp
IPTp, intermittent preventive treatment in pregnancySource: WHO estimates using national malaria control programme reports and United Nations population estimates
15
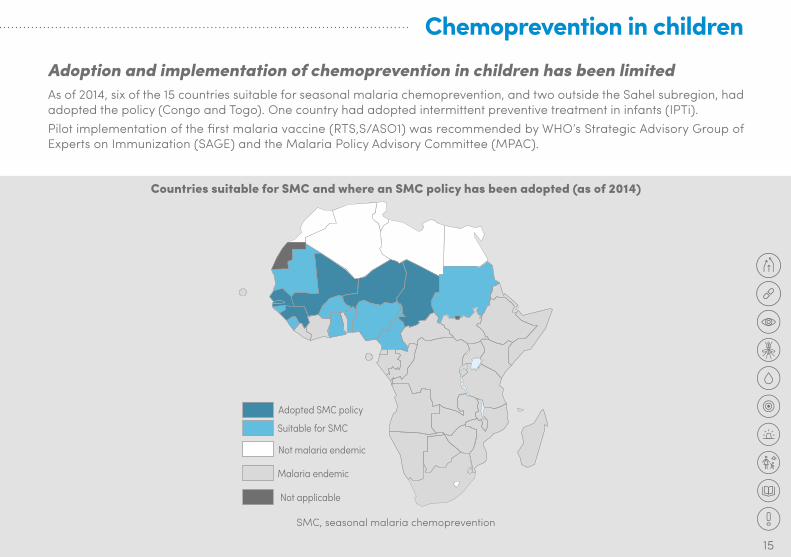
Chemoprevention in childrenAdoption and implementation of chemoprevention in children has been limitedAs of 2014, six of the 15 countries suitable for seasonal malaria chemoprevention, and two outside the Sahel subregion, had adopted the policy (Congo and Togo). One country had adopted intermittent preventive treatment in infants (IPTi).Pilot implementation of the first malaria vaccine (RTS,S/ASO1) was recommended by WHO’s Strategic Advisory Group of Experts on Immunization (SAGE) and the Malaria Policy Advisory Committee (MPAC).
Countries suitable for SMC and where an SMC policy has been adopted (as of 2014)
Adopted SMC policy
Suitable for SMC
Not malaria endemic
Not applicable
Malaria endemic
SMC, seasonal malaria chemoprevention

16
WO
RLD
MAL
ARIA
REP
ORT
201
5 SUMMARY
Diagnostic testingThe proportion of suspected malaria cases receiving a malaria diagnostic test has increased steadily since 2005The proportion of suspected malaria cases presenting for care in the public sector that receives a malaria diagnostic test increased from 74% in 2005 to 78% in 2014. The global trend is dominated by countries in South-East Asia, particularly India.The WHO African Region has had the largest increase in levels of malaria diagnostic testing, from 36% of suspected malaria cases tested in 2005, to 41% in 2010 and 65% in 2014.
Proportion of suspected malaria cases attending public health facilities that received a diagnostic test, by WHO region, 2005–2014
Prop
ortio
n of
sus
pect
ed m
alar
ia
case
s
100%
80%
60%
40%
20%
0%201320122011 2014201020092008200720062005
World AFR AMR EMR EUR SEAR WPR
AFR, African Region; AMR, Region of the Americas; EMR, Eastern Mediterranean Region; EUR, European Region; SEAR, South-East Asia Region; WPR, Western Pacific Region Source: National malaria control programme reports

17
Treatment with artemisinin-based combination therapies (ACTs)The proportion of malaria cases in sub-Saharan Africa receiving treatment with ACTs has increased, but is still less than 20%The proportion of children in sub-Saharan Africa with P. falciparum malaria receiving ACT is estimated to have increased to 16% in 2014 (range: 12–22%). A major reason for this low percentage is that a high proportion of children with fever are not taken for care, or use the informal private sector, where they are less likely to obtain ACTs for treatment.Although the proportion of malaria cases receiving an ACT has increased, the proportion treated with other antimalarial medicines has decreased since 2000. Hence, an increasing proportion of children with malaria who receive treatment are treated with an ACT (median 47% among 18 household surveys conducted in 2013–2015).
Estimated proportion of children aged under 5 years with confirmed Plasmodium falciparum malaria who received ACTs, sub-Saharan Africa, 2003–2014
Prop
ortio
n of
chi
ldre
n w
ith m
alar
ia
50%
40%
30%
20%
10%
0%2013 20142012201120102009200820072006200520042003
ACT, artemisinin-based combination therapySource: Malaria treatment model from the Center for Applied Malaria Research and Evaluation (Tulane University), the Global Health Group (University of California, San Francisco) and the Malaria Atlas Project (University of Oxford).
WO
RLD
MAL
ARIA
REP
ORT
201
5 SUMMARY
18
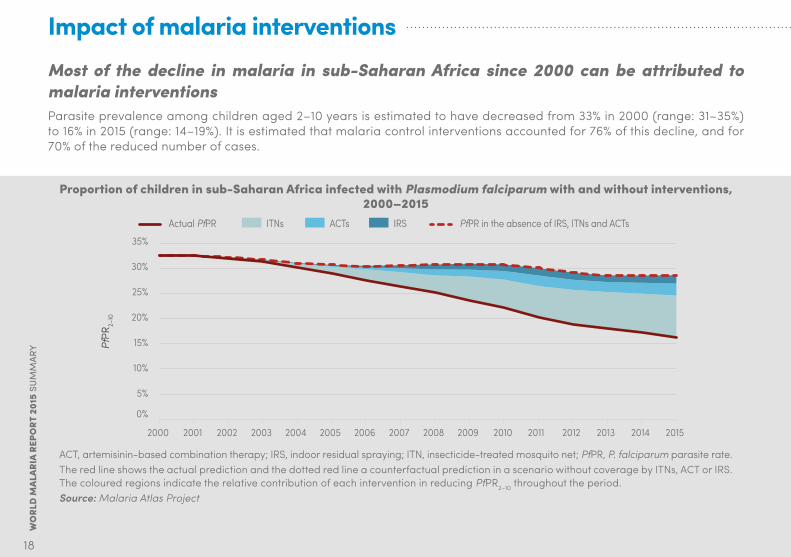
Impact of malaria interventionsMost of the decline in malaria in sub-Saharan Africa since 2000 can be attributed to malaria interventionsParasite prevalence among children aged 2–10 years is estimated to have decreased from 33% in 2000 (range: 31–35%) to 16% in 2015 (range: 14–19%). It is estimated that malaria control interventions accounted for 76% of this decline, and for 70% of the reduced number of cases.
Proportion of children in sub-Saharan Africa infected with Plasmodium falciparum with and without interventions, 2000–2015
PfPR
2–10
35%
30%
25%
20%
15%
10%
5%
0%
20142013201220112010 20152009200820072006200520042003200220012000
IRSITNs ACTs PfPR in the absence of IRS, ITNs and ACTsActual PfPR
ACT, artemisinin-based combination therapy; IRS, indoor residual spraying; ITN, insecticide-treated mosquito net; PfPR, P. falciparum parasite rate.The red line shows the actual prediction and the dotted red line a counterfactual prediction in a scenario without coverage by ITNs, ACT or IRS. The coloured regions indicate the relative contribution of each intervention in reducing PfPR2–10 throughout the period.Source: Malaria Atlas Project

19
Malaria prevention and treatment measures are estimated to have averted more than 650 million malaria cases between 2001 and 2015It is estimated that 1.2 billion fewer malaria cases and 6.2 million fewer malaria deaths occurred globally between 2001 and 2015 than would have been the case had incidence and mortality rates remained unchanged since 2000. In sub-Saharan Africa, it is estimated that 943 million fewer malaria cases occurred, and that malaria interventions were responsible for 70% of this reduction, averting 663 million malaria cases (range: 542–753 million).
Predicted cumulative number of malaria cases averted by interventions, sub-Saharan Africa, 2000–2015
Mal
aria
cas
es a
verte
d (m
illion
)
1000
900
800
700
600
500
400
300
200
100
02014 20152013201220112010200920082007200620052004200320022001
Cases averted due to ITNs Cases averted due to ACTs Cases averted due to IRS Total cases averted not attributable to IRS, ITNs, or ACTs
ACT, artemisinin-based combination therapy; IRS, indoor residual spraying; ITN, insecticide-treated mosquito net Source: Malaria Atlas Project estimates of cases averted attributable to ITNs, ACTs, and IRS and WHO estimates of total cases averted
20
WO
RLD
MAL
ARIA
REP
ORT
201
5 SUMMARY
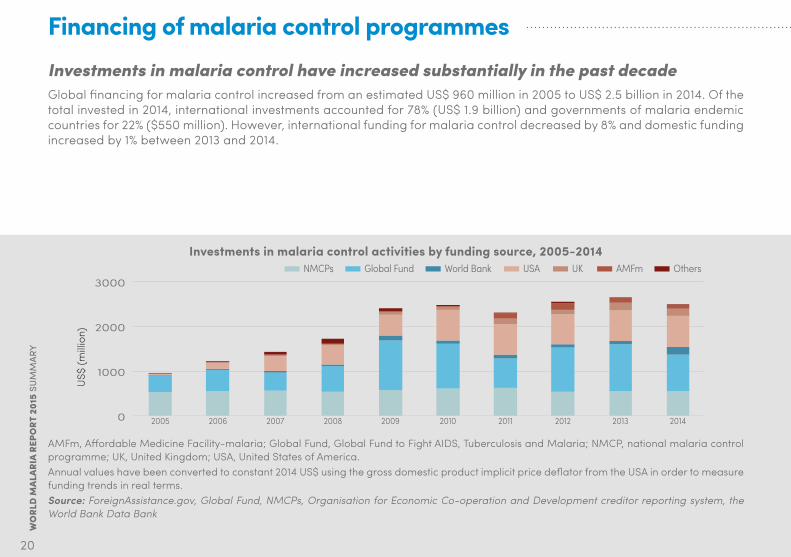
Financing of malaria control programmesInvestments in malaria control have increased substantially in the past decadeGlobal financing for malaria control increased from an estimated US$ 960 million in 2005 to US$ 2.5 billion in 2014. Of the total invested in 2014, international investments accounted for 78% (US$ 1.9 billion) and governments of malaria endemic countries for 22% ($550 million). However, international funding for malaria control decreased by 8% and domestic funding increased by 1% between 2013 and 2014.
Investments in malaria control activities by funding source, 2005-2014
US$
(milli
on)
3000
2000
1000
0 2014201320122011201020092008200720062005
NMCPs Global Fund World Bank USA UK AMFm Others
AMFm, Affordable Medicine Facility-malaria; Global Fund, Global Fund to Fight AIDS, Tuberculosis and Malaria; NMCP, national malaria control programme; UK, United Kingdom; USA, United States of America.Annual values have been converted to constant 2014 US$ using the gross domestic product implicit price deflator from the USA in order to measure funding trends in real terms.Source: ForeignAssistance.gov, Global Fund, NMCPs, Organisation for Economic Co-operation and Development creditor reporting system, the World Bank Data Bank

21
Cost savings due to malaria interventionsMalaria interventions led to health service savings of US$ 900 million in sub-Saharan Africa between 2001 and 2014, owing to the reduced number of cases requiring treatmentDiagnosis and treatment of malaria incurs significant costs. The amount of money spent on diagnosing and treating malaria patients rose between 2001 and 2014 because of increasing use of diagnostic tests and ACTs. However, the increase has been curtailed by reductions in the number of malaria cases (as a result of malaria interventions). The reductions in malaria case incidence attributable to malaria control activities are estimated to have saved about US$ 900 million on the malaria case management costs in sub-Saharan Africa between 2001 and 2014. These estimates consider only savings to health services, they exclude savings to households.
Provider savings in malaria case management costs attributable to expansion of malaria control activities, 2001–2014
US$
(milli
on)
200
150
100
50
0 20142013201220112010200920082007200620052004200320022001
Savings in diagnostics and treatment Savings in patient care delivery services
Annual values have been converted to constant 2014 US$ using the gross domestic product implicit price deflator from the USA in order to measure savings trends in real terms.Source: Data on malaria cases averted as per Section 2.3 of the main report. Data on treatment-seeking behaviour, parasitological diagnosis and treatment coverage as per Sections 3.5 and 3.6 of the main report. WHO-CHOICE database on price estimates for outpatient care visit and inpatient bed stay; Management Science for Health International Drug Price Indicator Guide, and Global Fund Price and Quality Reporting Tool for commodity prices.

WO
RLD
MAL
ARIA
REP
ORT
201
5 SUMMARY
22
ChallengesDecreases in malaria incidence and mortality were slowest in countries that had the highest number of malaria cases and deaths in 2000Despite the progress in reducing malaria cases and deaths, malaria remains a major public health problem in many countries of the world. It has been slowest to decline in countries that had the highest number of cases and deaths in 2000. Reductions in incidence need to be greatly accelerated in these countries if global progress is to be improved.
Reduction in malaria incidence in 2000–2015 versus estimated number of cases in a country in 2000
Perc
enta
ge re
duct
ion
100
80
60
40
20
0>1 000 00010 000–100 000
Estimated number of cases in 2000
100 000–1 000 0001000–10 000<1000
Two countries with increases (negative decreases) have been excluded from the chart. Source: WHO estimates
23
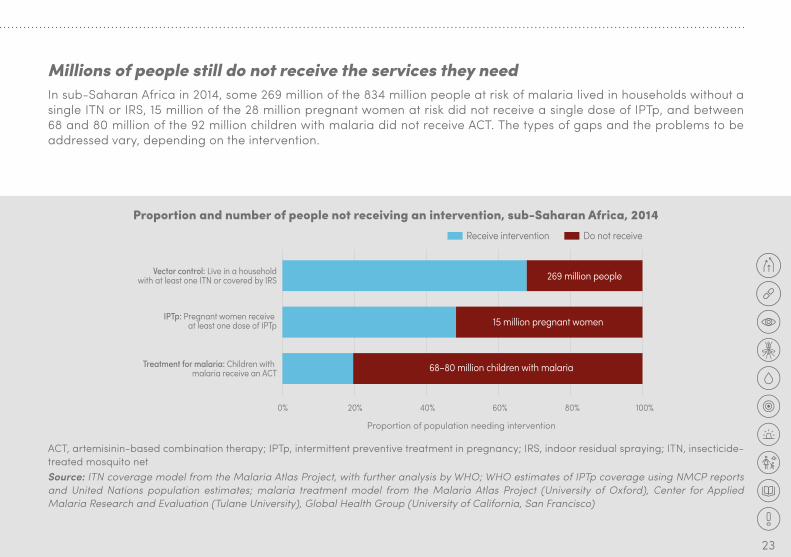
Millions of people still do not receive the services they needIn sub-Saharan Africa in 2014, some 269 million of the 834 million people at risk of malaria lived in households without a single ITN or IRS, 15 million of the 28 million pregnant women at risk did not receive a single dose of IPTp, and between 68 and 80 million of the 92 million children with malaria did not receive ACT. The types of gaps and the problems to be addressed vary, depending on the intervention.
Proportion and number of people not receiving an intervention, sub-Saharan Africa, 2014
Proportion of population needing intervention
Vector control: Live in a householdwith at least one ITN or covered by IRS
IPTp: Pregnant women receive at least one dose of IPTp
Treatment for malaria: Children with malaria receive an ACT
Do not receiveReceive intervention
80%60%40%20%0% 100%
269 million people
15 million pregnant women
68–80 million children with malaria
ACT, artemisinin-based combination therapy; IPTp, intermittent preventive treatment in pregnancy; IRS, indoor residual spraying; ITN, insecticide-treated mosquito netSource: ITN coverage model from the Malaria Atlas Project, with further analysis by WHO; WHO estimates of IPTp coverage using NMCP reports and United Nations population estimates; malaria treatment model from the Malaria Atlas Project (University of Oxford), Center for Applied Malaria Research and Evaluation (Tulane University), Global Health Group (University of California, San Francisco)

24
WO
RLD
MAL
ARIA
REP
ORT
201
5 SUMMARY
Malaria is concentrated in countries with weaker heath systems and lower national incomesRatios of staff to population are lower in countries with the highest numbers of malaria cases. The ability to finance an expansion of the health services and to fill coverage gaps is constrained by lower national incomes in countries with the highest malaria burden.
Number of nurses per 1000 population (malaria endemic countries) versus estimated number of malaria cases*
Gross national income per capita versus estimated number of malaria cases, by WHO region, 2015
Gro
ss n
atio
nal i
ncom
e pe
r cap
ita
100 000
10 000
1000
010 000 0001 000 000100 00010 0001000100101 100 000 000
Estimated number of malaria cases, 2015
AFR AMR EMR SEAR WPR10
1
010 000 0001 000 000100 00010 0001000100101 100 000 000
Estimated number of malaria cases, 2015
AFR AMR EMR SEAR WPR
Nur
ses
* Year of observation varies by country, ranging from 2005 to 2012AFR, African Region; AMR, Region of the Americas; EMR, Eastern Mediterranean Region; SEAR, South-East Asia Region; WPR, Western Pacific RegionSource: WHO estimates and the World Bank Data Bank
Challenges

25
P. vivax malaria is a significant public health issue in many parts of the world, and predominates in countries that are prime candidates for malaria eliminationP. vivax is estimated to have been responsible for 13.8 million malaria cases globally in 2015, and to have accounted for about half the total number of malaria cases outside Africa. Severe cases and deaths due to P. vivax malaria have been reported from all endemic regions. Because of the difficulty in controlling P. vivax, its incidence has decreased more slowly than that of P. falciparum in locations where the two species coexist. P. vivax may then persist as the principal cause of malaria and pose the main challenge to malaria elimination. Indeed, P. vivax predominates in countries with the lowest incidence of malaria, accounting for more than 70% of cases in countries with fewer than 5000 reported cases each year.
Proportion of reported malaria cases due to Plasmodium vivax, countries with different average caseloads between 2000 and 2014
Prop
ortio
n of
cas
es
100%
80%
60%
40%
20%
0%0–500501–50005001–50 00050 001–500 000
Average number of cases, 2000–2014500 001–5 000 0005 000 000 +
Source: National malaria control programme reports and WHO estimates
WO
RLD
MAL
ARIA
REP
ORT
201
5 SUMMARY
26
The effectiveness of insecticide-based vector control is threatened as malaria mosquitoes develop resistance to the insecticides used in ITNs and IRSOf the 78 countries reporting any monitoring data since 2010, 60 reported resistance to at least one insecticide in one malaria vector population, and 49 reported resistance to insecticides from two or more insecticide classes. Pyrethroid resistance was detected in all major malaria vectors, with three quarters of countries that monitored this insecticide class in 2014 reporting resistance. However, long-lasting insecticidal nets remain effective, despite resistance.
Antimalarial drug resistance has substantial implications for malaria control and global public healthP. falciparum resistance to artemisinins has now been detected in five countries in the Greater Mekong subregion. Despite the observed changes in parasite sensitivity, patients continue to respond to combination treatment, provided the partner drug remains effective. The efficacy of artemether-lumefantrine in Africa and South America remains high, as does artesunate-amodiaquine in Africa. Artesunate-mefloquine requires vigilant monitoring in South-East Asia and South America. The efficacy of artesunate-sulfadoxine-pyrimethamine is compromised in areas with resistance to SP. The efficacy of dihydroartemisinin-piperaquine is low in areas with existing piperaquine resistance. Treatment or prophylactic failure with chloroquine for P. vivax malaria has been observed in 24 countries.
Challenges

27
Insecticide resistance and monitoring status, by insecticide class and WHO region, 2010–2014
50
40
30
20
10
0AFR AMR EMR EUR SEAR WPR AFR AMR EMR EUR SEAR WPR AFR AMR EMR EUR SEAR WPR AFR AMR EMR EUR SEAR WPR
Pyrethroids Organochlorine (DDT) Carbamates Organophosphates
Num
ber o
f cou
ntrie
sResistance reported Resistance not reported Resistance not monitored
Reported use of class for malaria vector control, 2014
ITNs 42 19 8 3 10 10 – – – – – – – – – – – – – – – – – –IRS 11 9 4 3 7 6 6 0 0 0 1 0 8 3 4 0 1 0 4 2 0 0 1 0
AFR, African Region; AMR, Region of the Americas; DDT, dichloro-diphenyl-trichloroethane; EMR, Eastern Mediterranean Region; EUR, European Region; IRS, indoor residual spraying; ITN, insecticide-treated mosquito net; SEAR, South-East Asia Region; WPR, Western Pacific Region Source: National malaria control programme reports, African Network for Vector Resistance, Malaria Atlas Project, President’s Malaria Initiative (United States), scientific publications
28
WO
RLD
MAL
ARIA
REP
ORT
201
5 SUMMARY
GLOBAL TECHNICAL STRATEGY FOR MALARIA 2016–2030
Global Technical Strategy for Malaria 2016–2030
Global Malaria ProgrammeWorld Health Organization 20 avenue Appia1211 Geneva 27 Switzerland
ISBN 978 92 4 156499 1

29
Moving forwardTo address remaining and emerging challenges, WHO developed the Global technical strategy for malaria 2016–2030The vision of WHO and the global malaria community is a world free of malaria. The Global technical strategy for malaria 2016–2030 sets the most ambitious yet feasible targets for reductions in malaria cases and deaths since the malaria eradication era. It also provides a framework for developing programmes that are tailored to local circumstances, with the aim of accelerating progress towards malaria elimination.
Goals, milestones and targets of the Global technical strategy for malaria 2016–2030 and Action and investment to defeat malaria 2016–2030
Vision A world free of malariaGoals Milestones Targets
2020 2025 2030
1. Reduce malaria mortality rates globally compared with 2015 At least 40% At least 75% At least 90%
2. Reduce malaria case incidence globally compared with 2015 At least 40% At least 75% At least 90%
3. Eliminate malaria from countries in which malaria was transmitted in 2015 At least 10 countries At least 20 countries At least 35 countries
4. Prevent re-establishment of malaria in all countries that are malaria free
Re-establishment prevented
Re-establishment prevented
Re-establishment prevented
The Global technical strategy for malaria 2016–2030 can be found at:http://www.who.int/malaria/areas/global_technical_strategy/en/

30
AcknowledgementsNumerous people provided valuable help to the development of the World malaria report 2015. We are especially grateful to staff of NMCPs that submitted the data and responded to queries with the support of WHO country and regional offices. The following organizations also contributed to the production of the report: African Leaders Malaria Alliance; Global Fund to Fight AIDS, Tuberculosis and Malaria; Imperial College; John Hopkins Bloomberg School of Public Health; Kaiser Family Foundation; Milliner Global Associates; Tulane University; University of California, San Francisco (UCSF) Global Health Group; United States Centers for Disease Control and Prevention; United States President’s Malaria Initiative; and University of Oxford.
We are also thankful for financial support from the United Kingdom Department of International Development, the United States Agency for International Development, and the Swiss Agency for Development and Cooperation (through a grant to the Swiss Tropical and Public Health Institute). We also thank the Government of Monaco for its programme, “Accelerated Malaria Control towards Pre-elimination in East and Southern Africa by 2015”, which supported the collection of malaria programme data.
© T
he G
loba
l Fun
d/Jo
hn R
ae

WHO/HTM/GMP/2016.2
m a l a r i a a t l a s p r o j e c t
The mark “CDC” is owned by the US Dept. of Health and
Human Services and is used with permission. Use of this logo is not an endorsement by HHS or CDC of any particular product, service,
or enterprise.
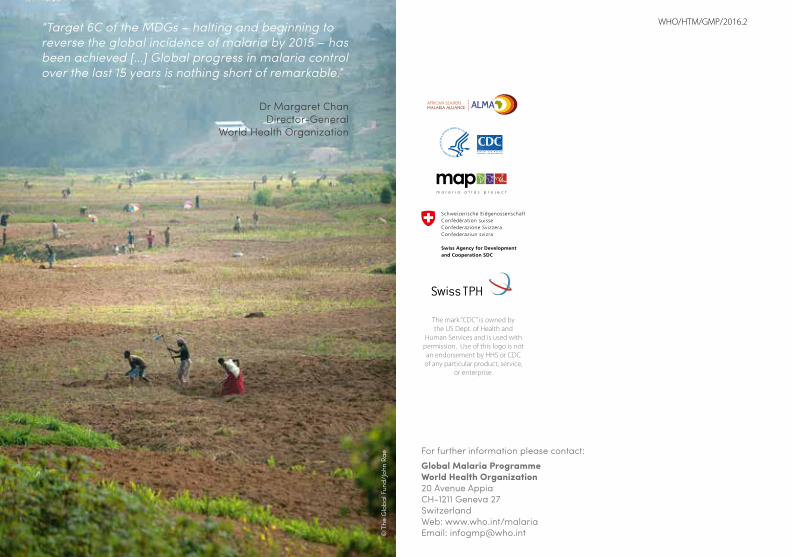
“Target 6C of the MDGs – halting and beginning to reverse the global incidence of malaria by 2015 – has been achieved […] Global progress in malaria control over the last 15 years is nothing short of remarkable.”
Dr Margaret ChanDirector-General
World Health Organization
© T
he G
loba
l Fun
d/Jo
hn R
ae For further information please contact:Global Malaria ProgrammeWorld Health Organization20 Avenue AppiaCH-1211 Geneva 27SwitzerlandWeb: www.who.int/malariaEmail: [email protected]