Embed Size (px)
Citation preview
ANL-LTR-CERT-12-001
Summary Report on Liquid-Liquid Contactor Scoping Experiments and Validation Test Case Definition
Chemical Sciences and Engineering Division

About Argonne National Laboratory Argonne is a U.S. Department of Energy laboratory managed by UChicago Argonne, LLC under contract DE-AC02-06CH11357. The Laboratory’s main facility is outside Chicago, at 9700 South Cass Avenue, Argonne, Illinois 60439. For information about Argonne and its pioneering science and technology programs, see www.anl.gov. Availability of This Report This report is available, at no cost, at http://www.osti.gov/bridge. It is also available on paper to the U.S. Department of Energy and its contractors, for a processing fee, from:
U.S. Department of Energy Office of Scientif ic and Technical Information P.O. Box 62 Oak Ridge, TN 37831-0062 phone (865) 576-8401 fax (865) 576-5728 [email protected]
Disclaimer This report was prepared as an account of work sponsored by an agency of the United States Gov ernment. Neither the United Sta tes Gov ernment nor any agency thereof , nor UChicago Argonne, LLC, nor any of their employ ees or of f icers, makes any warranty , express or implied, or assumes any legal liability or responsibility f or the accuracy , completeness, or usef ulness of any information, apparatus, product, or process disclosed, or represents that its use would not inf ringe priv ately owned rights. Ref erence herein to any specif ic commercial product, process, or serv ice by trade name, trademark, manuf acturer, or otherwise, does not necessarily constitute or imply its endorsement, recommendation, or f av oring by the United States Gov ernment or any agency thereof . The v iews and opinions of document authors expressed herein do not necessarily state or ref lect those of the United States Gov ernment or any agency thereof , Argonne National Laboratory , or UChicago Argonne, LLC.
ANL-LTR-CERT-12-001
Summary Report on Liquid-Liquid Contactor Scoping
Experiments and Validation Test Case Definition prepared by Kent E. Wardle
Chemical Sciences and Engineering Division, Argonne National Laboratory
May 31, 2012
work sponsored by
U.S. Department of Energy, Office of Nuclear Energy, Science and Technology
Summary Report on Liquid–Liquid Contactor Scoping
Experiments and Validation Test Case Definition
Kent E. Wardle∗
Chemical Sciences and Engineering Division
Argonne National Laboratory
Argonne, IL 60439, U.S.A.
31 May 2012
1 Introduction
This report presents an overview of a set of wide ranging experiments that was conducted dur-
ing the first half of FY12 using the capability of the Contactor Electrical Resistance Tomography
(CERT) Facility. This facility includes the capability for multiphase measurements of flow in
liquid–liquid contactors using ERT as well as high-speed imaging with the current test focus on
an instrumented engineering-scale annular centrifugal contactor having a 5 inch rotor (CINC-V5).
The purpose of the efforts during this current FY are to explore a range of flow conditions for mul-
tiphase operation to gain broad insight into observable trends and quantities after which detailed
measurements will be made for specific controlled test conditions to provide data for validation of
advanced computational fluid dynamics models which are being developed under a separate work
package (FT-12AN030901).
In addition to the Redlake X5plus camera, a Redlake MotionPro Y7 camera was also available
on loan from another research group at Argonne. The Y7 is capable of grayscale imaging at 7500
frames per second at full resolution (1920×1080) and has excellent light sensitivity (can be used
for time-resolved particle image velocimetry (PIV)). This camera was used for the bubble imaging
described in Section 2.3. Imaging at the bubble scale was done using a Infinity K1 CentriMax lens
with an MX-4 objective attachment.
The process solutions used for these tests were:
1
ANL-LTR-CERT-12-001
Aqueous Phase: 37.5 wt% aluminum nitrate (1M) in 8 wt% nitric acid (1M)
Organic Phase: 40 vol% tributyl phosphate (lab grade) in dodecane (technical grade mixture of
isomers)
The addition of aluminum nitrate to the aqueous phase and use of 40 vol% TBP was intended to
produce a measurable electrical conductivity in the organic phase and enable electrical resistance
tomography (ERT) measurements under organic continuous conditions. Indeed, the measured con-
ductivities of the two phases were 169 mS/cm and 7.6 µS/cm, respectively. Challenges related to
ERT measurements for this phase system are described in Section 3.2.
Tests were conducted at three different total flow rates (5, 10, 15 LPM) at an O/A of 1, and at
three different O/A ratios (0.33, 1, 3) for a total flow rate of 10 LPM. The rotor speed generally
used was 1800 RPM and each set of tests were done for four different mixing vane configurations,
four-, six-, and eight-straight vanes (4V, 6V, 8V) and eight curved vanes (CV). The general purpose
of this phase of testing was to explore a wide range of conditions for the four available vane types
in order to investigate general liquid–liquid operation and identify conditions for later detailed
experimentation and acquisition of CFD validation quality data. Observations and measurements
were made using high-speed video of both the housing side and the mixing vane region under the
rotor. ERT measurements using the single 32-electrode array positioned in the housing near the
bottom edge of the rotor (top of the vanes) were made solely for the liquid-liquid cases at 10 LPM
and O/A of 0.33 (aqueous continuous).
2 High-speed Imaging
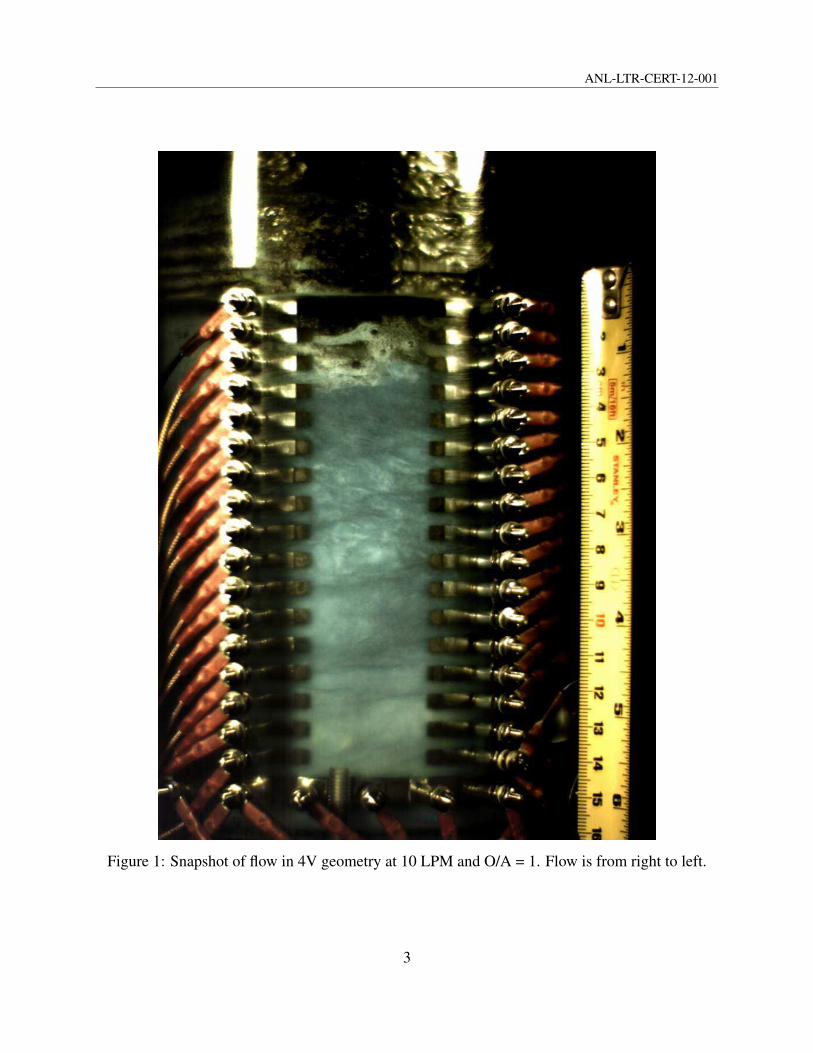
As an example of the general flow patterns seen in the mixing zone during these experiments, a
snapshot from the high-speed imaging of flow in the 4V geometry at 10 LPM and O/A = 1 is
shown in Figure 1. The banding of the aqueous phase (dyed dark blue) is evident as well as several
turbulent Taylor-Couette vortices. Note that the organic phase inlet flow enters just to the right of
the viewing area and can be seen as droplets and a liquid film descending above the electrode array
on the right. As noted in previous investigations using the CINC-V2 contactor, the liquid height
in the mixing zone was oscillatory and the image shown is at or just subsequent to a minimum in
liquid height.
2
ANL-LTR-CERT-12-001
Figure 1: Snapshot of flow in 4V geometry at 10 LPM and O/A = 1. Flow is from right to left.
3
ANL-LTR-CERT-12-001
2.1 Annular Liquid Height Comparisons
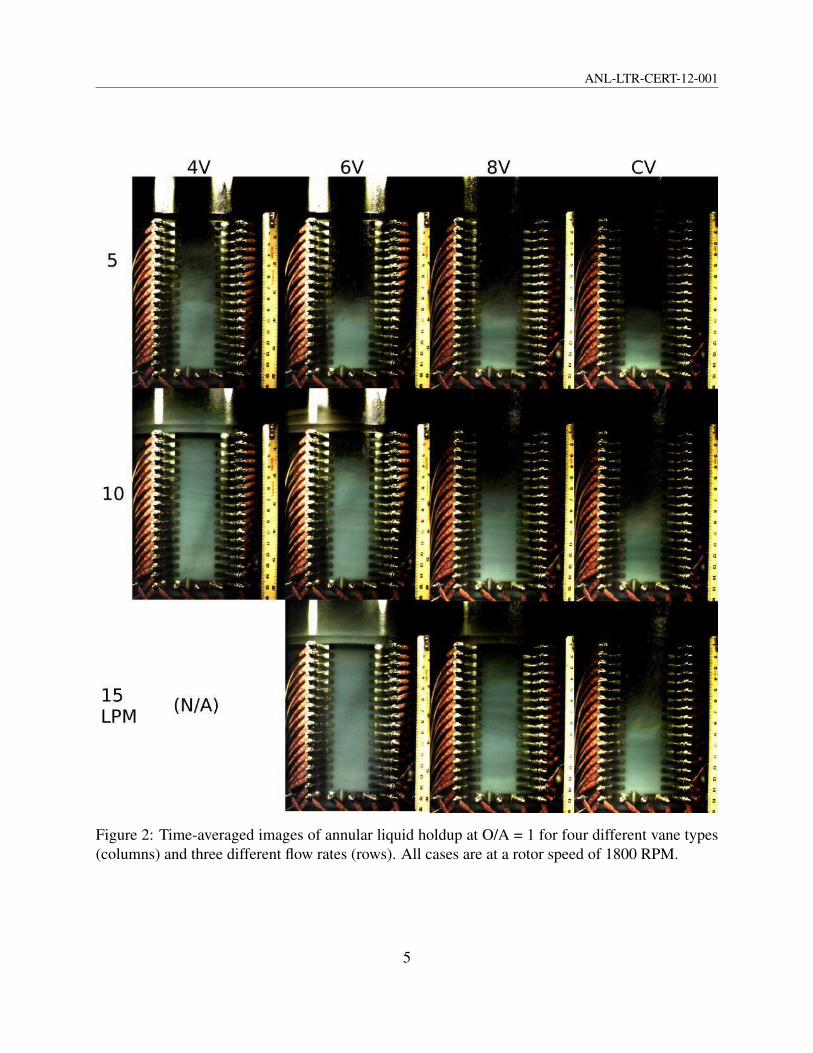
Figure 2 shows time averages of the high-speed images of the flow as viewed from the side for the
three flow rates at an O/A flow ratio of 1. A test for the highest flow rate in the 4V geometry was
not performed as the liquid volume in the mixing zone was filled beyond the height of the inlets
under these conditions—the inlet height is just above the top of the image. The same trends in
liquid height as seen in the single liquid (water) tests reported in FY11 are evident here: 4V > 6V
> 8V > CV. In the liquid–liquid case, the differences in liquid height are enhanced over the water
case as the mixture viscosity for the liquid-liquid dispersion is greater than that of water leading
to higher liquid height in all cases. Banding of the aqueous phase is also apparent in individual
snapshots, but is somewhat washed out by the time-averaging evidencing the dynamic axial motion
and variability of the bands, particularly for larger liquid height cases such as in the 4V and 6V
geometries. Interestingly, the liquid height for 6V at 5 LPM is roughly equal to that for 8V at
10 LPM and CV at 15 LPM such that top-left to bottom-right diagonals in the image matrix have
roughly equivalent liquid height.
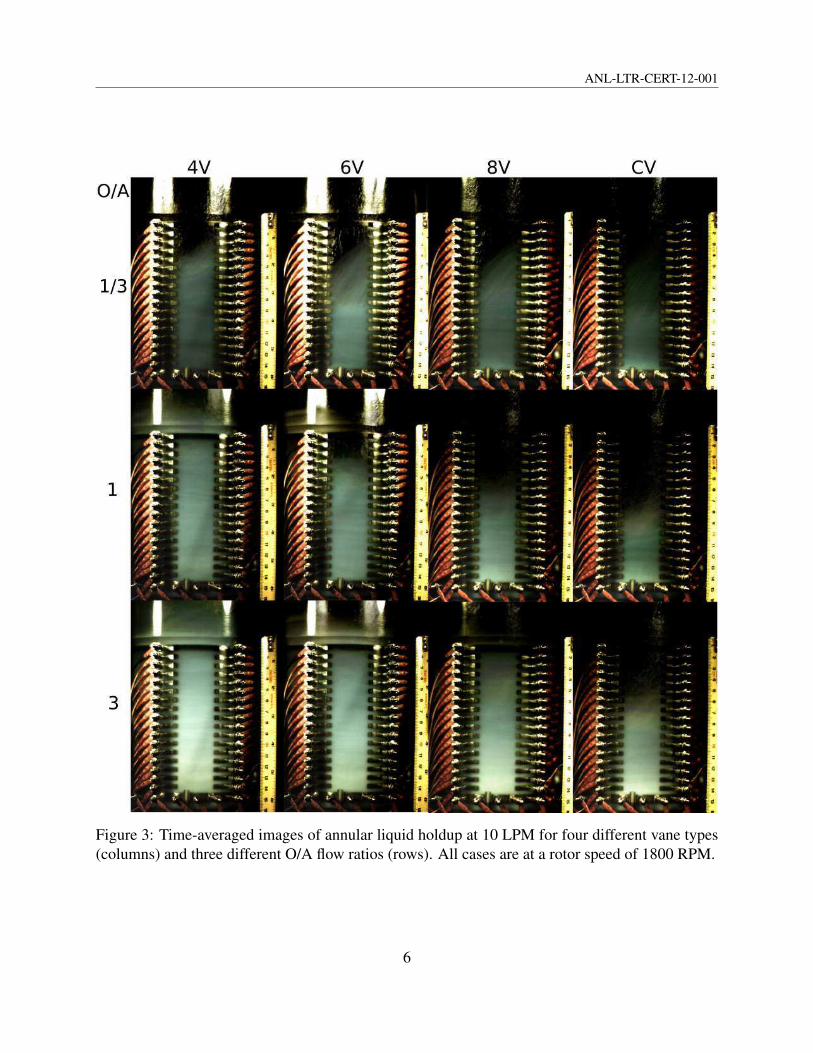
The variation in liquid height with O/A ratio for the four vane types (at 10 LPM total flow)
is shown in Figure 3. It was observed that with increasing organic flow fraction there was seen
greater liquid height and also greater air entrainment as evidenced by increased light scattering.
The variation across the vane types is most pronounced at O/A = 1. This is thought to be due to
the mixture viscosity having a maximum in the range of 1:1 phase ratio.
2.2 Mixing Vane Region
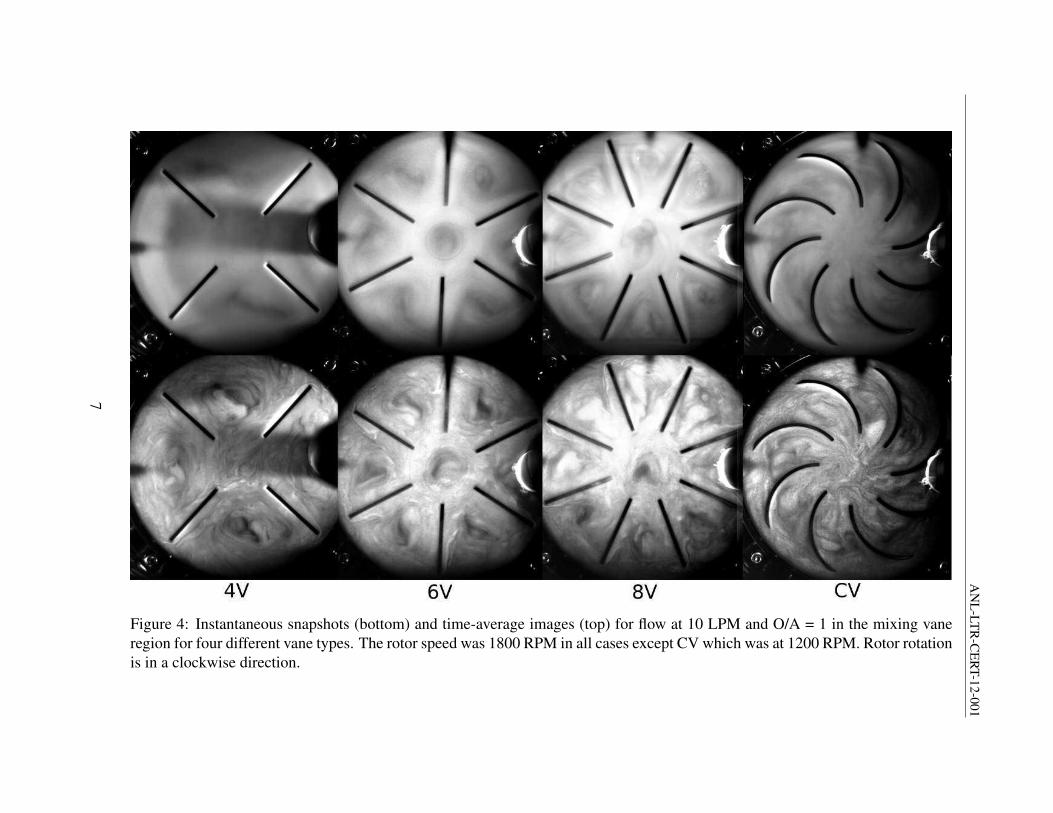
The flow underneath the rotor for each of the vane types is shown in Figure 4 with the bottom
row showing instantaneous snapshots and the top row time-averaged images. Note that all cases
are at 10 LPM, O/A = 1, and 1800 RPM except the CV case which is at 1200 RPM. Images were
taken at 500 fps (X5plus camera). Under these conditions, the dyed aqueous phase is dispersed
and darker regions should thus be aqueous-rich. At first inspection, it was unexpected that the
center of each rotating region between vanes would have a higher concentration of the more heavy
phase. However, recent CFD simulations using coupled dispersed/segregated phase models have
confirmed that these dark regions are indeed aqueous-rich. While it seems counterintuitive that the
heavy phase would go towards the center of rotation rather than outward, as the dispersed phase,
the droplets also have the tendency to go towards regions of lower flow velocity, a tendency which
appears to dominate over density variations in this case. It can be seen that for the 6V and 8V
cases, these regions are most pronounced and an additional counter-rotating vortex is observed in
4
ANL-LTR-CERT-12-001
Figure 2: Time-averaged images of annular liquid holdup at O/A = 1 for four different vane types
(columns) and three different flow rates (rows). All cases are at a rotor speed of 1800 RPM.
5
ANL-LTR-CERT-12-001
Figure 3: Time-averaged images of annular liquid holdup at 10 LPM for four different vane types
(columns) and three different O/A flow ratios (rows). All cases are at a rotor speed of 1800 RPM.
6
AN
L-L
TR
-CE
RT
-12
-00
1
Figure 4: Instantaneous snapshots (bottom) and time-average images (top) for flow at 10 LPM and O/A = 1 in the mixing vane
region for four different vane types. The rotor speed was 1800 RPM in all cases except CV which was at 1200 RPM. Rotor rotation
is in a clockwise direction.
7
ANL-LTR-CERT-12-001
the center near the rotor axis as noted in earlier CFD simulations [1].
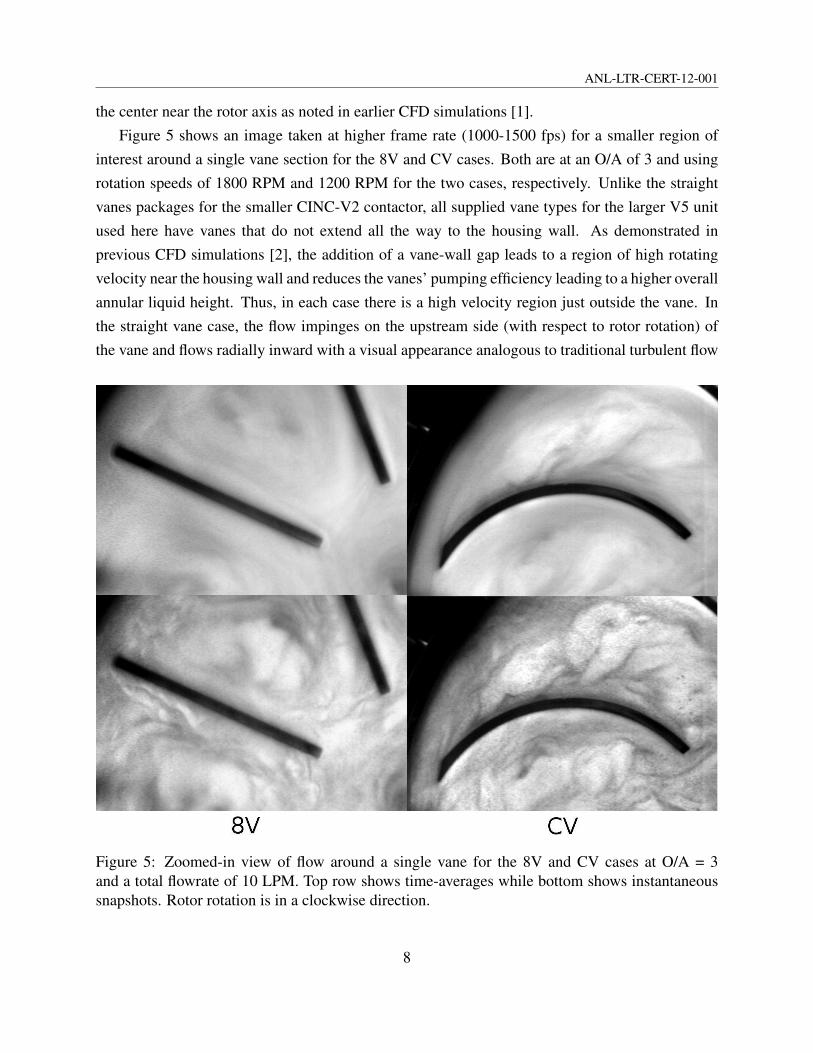
Figure 5 shows an image taken at higher frame rate (1000-1500 fps) for a smaller region of
interest around a single vane section for the 8V and CV cases. Both are at an O/A of 3 and using
rotation speeds of 1800 RPM and 1200 RPM for the two cases, respectively. Unlike the straight
vanes packages for the smaller CINC-V2 contactor, all supplied vane types for the larger V5 unit
used here have vanes that do not extend all the way to the housing wall. As demonstrated in
previous CFD simulations [2], the addition of a vane-wall gap leads to a region of high rotating
velocity near the housing wall and reduces the vanes’ pumping efficiency leading to a higher overall
annular liquid height. Thus, in each case there is a high velocity region just outside the vane. In
the straight vane case, the flow impinges on the upstream side (with respect to rotor rotation) of
the vane and flows radially inward with a visual appearance analogous to traditional turbulent flow
Figure 5: Zoomed-in view of flow around a single vane for the 8V and CV cases at O/A = 3
and a total flowrate of 10 LPM. Top row shows time-averages while bottom shows instantaneous
snapshots. Rotor rotation is in a clockwise direction.
8
ANL-LTR-CERT-12-001
over a flat plate. In the curved vane case, the flow is more efficiently directed radially inward on the
upstream side, however, on the backside of the vane there is separation of the flow and a stagnation
region near the radial midpoint of the vane. As noted previously, low flow regions are characterized
by darkened appearance due to dispersed phase accumulation. The general flow pattern are around
the curved vane is reminiscent of aerodynamic flow over a wing at high angle of attack where flow
separation occurs.
One interesting, but yet unanswered, question is how the overall mixing is distributed between
the fraction that occurs in the vane region under the rotor as opposed to the annular region. In this
regard, the addition of a vane-wall gap introduces and additional source of turbulence and droplet
shearing in the sharp outer vane edge bordering the high velocity region. It is not clear if this region
of enhanced mixing has a significant impact on overall mixing and more detailed analyses—both
experimental and computational—are needed to better understand this issue. Additionally, it is
also not clear whether the increased liquid height observed in cases with fewer vanes leads to
the production of very fine droplets which do not separate adequately in the rotor and lead to an
increase in other-phase carry-over and degradation of stage efficiency. However, based on the
testing that has been done with the CERT facility to date, no measurable difference in carry-over
from the feed tank balance monitoring has been observed for the different vane types that would
suggest over-mixing in such cases.
2.3 In-situ Bubble/Droplet Size Imaging
Quantitative data for dispersed phase droplet sizes can not only lend insight into the questions
mentioned in the previous section regarding over-mixing, but are also critical for validation of
advanced CFD models aimed at prediction of liquid–liquid interfacial area. A limited set of single
droplet and multiple droplet imaging studies had been planned through a separate FY12 work
package at INL. Unfortunately, this project was left unfunded for FY12 due to budget constraints.
As such data is critical to the CFD validation mission of this work, it was deemed worthwhile to
explore the feasibility of performing droplet size measurements, in this case in situ in the CINC-
V5 contactor as part of this project. Note that similar in situ high-speed imaging for liquid–liquid
flow in a CINC-V2 contactor has been done at Oak Ridge National Laboratory as part of a lab-
funded effort a few years ago. While these experiments have been mentioned in several ORNL
presentations1 there are as yet no published data that have been made available. Depending on
the quality of data and documentation, characterization, and control of the flow conditions, these
data could be extremely useful to the CFD validation goals of this current effort and also provide a
1e.g. D. DePaoli July 20, 2011 presentation here.
9
ANL-LTR-CERT-12-001
means of exploring equipment scaling by comparison with the similar measurements planned here
for the CINC-V5. In fact, if FY13 funding allows, it would be worthwhile to support from the
Separations Program a small work package to provide ORNL the means to accelerate the release
of these data sets. At the very least, we are consulting with the ORNL researchers who did this
work to gain insights and advice for overcoming common challenges with lighting and image
post-processing.
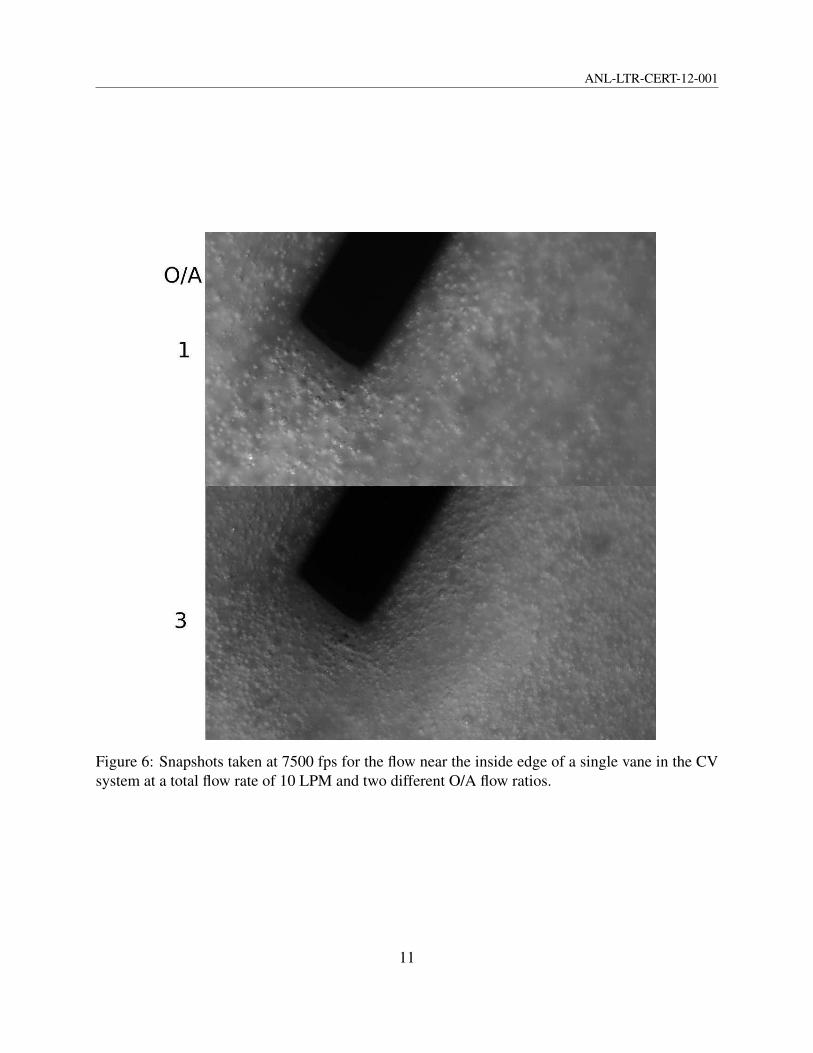
Figure 6 shows a comparison of sample images taken with the Y7 camera at 7500 fps for two
different O/A flow ratios (1 and 3) for the CV geometry. The black region is the inner end of the
vane (toward the rotor axis) which has a thickness of 1.59 mm (1/16 in). Under these conditions,
contrast between the liquid phases is small as are the liquid droplets themselves. Consequently,
the fluid particles more readily seen are are entrained air bubbles as in this case. It was apparent
from these and other experimental observations that the amount of entrained air was significant
in all cases—a fact that has previously not been fully appreciated by most researchers including
the author. It was observed that the O/A ratio also had an impact on the amount of entrainment
with high values (more organic phase) having more entrainment—something noted in the ORNL
work—as shown in Figure 6. While of little interest from a solvent extraction perspective, such
observations on gas entrainment may be of use for contactor applications in gas-liquid contacting
as have been proposed in the literature.
The evaluation of several image processing options is underway for quantification of bubble
size distributions from such images and enable comparison between various cases. In addition, a
higher magnification lens objective for the configurable K1 CentriMax lens used here is also being
acquired which will allow imaging over a field of view of approximately 1 mm by 1 mm and enable
resolution of liquid drops down to the micron scale. Given the budgetary constraints of this project
in the current FY, it is anticipated that only a preliminary effort in this area can be made in the near
term but it is planned that more significant effort can be put towards this important task in FY13
given adequate funding.
3 ERT
3.1 3D ERT Reconsructions
As described in the final report for this project in FY11, various methods exist for processing
the acquired voltage measurements from the ERT system into a reconstructed cross-sections of
conductivity. It was shown there that processing using an open-source toolkit called Eidors3D en-
10
ANL-LTR-CERT-12-001
Figure 6: Snapshots taken at 7500 fps for the flow near the inside edge of a single vane in the CV
system at a total flow rate of 10 LPM and two different O/A flow ratios.
11
ANL-LTR-CERT-12-001
abled explicit meshing of vane geometry and reconstruction of volume fraction fields with greater
fidelity. Due to the constrained geometry of the centrifugal contactor and the placement of the
circular array of electrodes near the top of the vanes and the bottom of the rotor, it would seem that
a full 3D reconstruction would give an even better representation of the data and a more physically
realistic result.
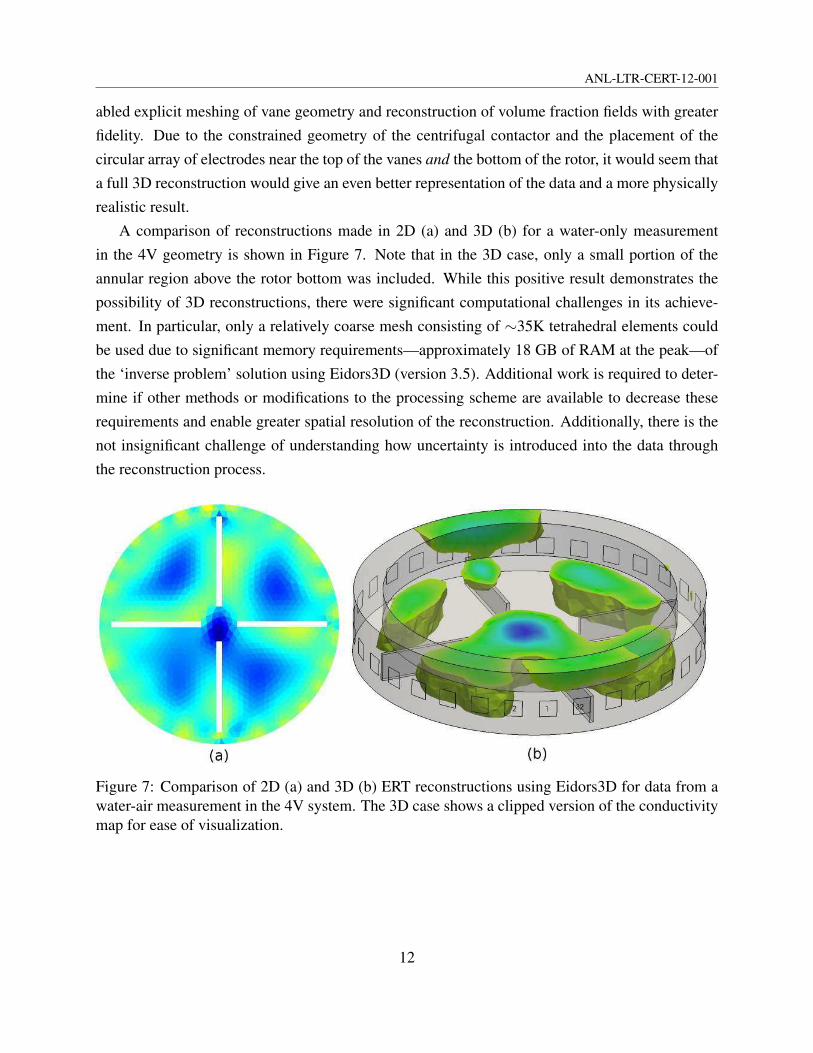
A comparison of reconstructions made in 2D (a) and 3D (b) for a water-only measurement
in the 4V geometry is shown in Figure 7. Note that in the 3D case, only a small portion of the
annular region above the rotor bottom was included. While this positive result demonstrates the
possibility of 3D reconstructions, there were significant computational challenges in its achieve-
ment. In particular, only a relatively coarse mesh consisting of ∼35K tetrahedral elements could
be used due to significant memory requirements—approximately 18 GB of RAM at the peak—of
the ‘inverse problem’ solution using Eidors3D (version 3.5). Additional work is required to deter-
mine if other methods or modifications to the processing scheme are available to decrease these
requirements and enable greater spatial resolution of the reconstruction. Additionally, there is the
not insignificant challenge of understanding how uncertainty is introduced into the data through
the reconstruction process.
Figure 7: Comparison of 2D (a) and 3D (b) ERT reconstructions using Eidors3D for data from a
water-air measurement in the 4V system. The 3D case shows a clipped version of the conductivity
map for ease of visualization.
12
ANL-LTR-CERT-12-001
3.2 Liquid–Liquid ERT
As for ERT measurements in the liquid–liquid system, significant challenges were discovered due
to the extreme difference in conductivity of the two phases. While the measurable conductivity
of the organic phase made configuration of the measurement system (ITS P2+ ERT System) for
organic continuous operation possible, due to the high conductivity of the aqueous phase, faulty
measurements were produced even at modest phase fractions. Thus it was chosen to pursue only
aqueous continuous measurements. However, due to the very high conductivity of the aqueous
phase, even using the system’s maximum injection current of 75 mA there was significant noise in
the measurements (+/- 10%).
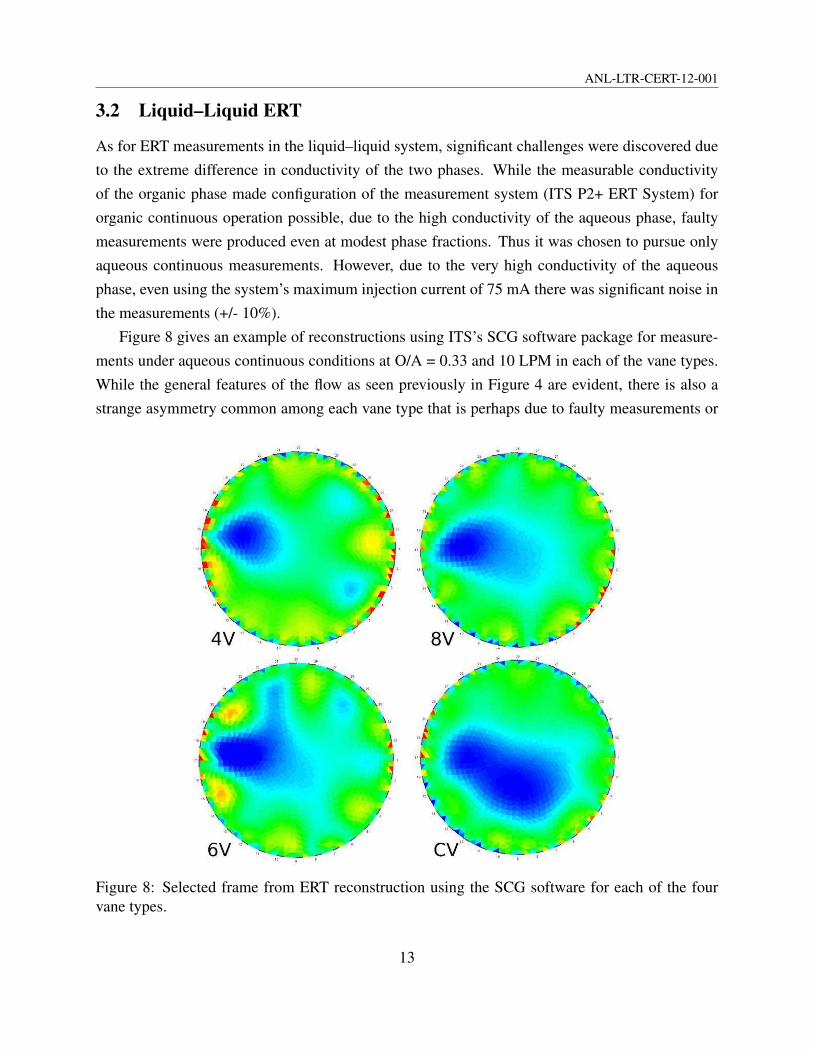
Figure 8 gives an example of reconstructions using ITS’s SCG software package for measure-
ments under aqueous continuous conditions at O/A = 0.33 and 10 LPM in each of the vane types.
While the general features of the flow as seen previously in Figure 4 are evident, there is also a
strange asymmetry common among each vane type that is perhaps due to faulty measurements or
Figure 8: Selected frame from ERT reconstruction using the SCG software for each of the four
vane types.
13
ANL-LTR-CERT-12-001
amplification of noise in the reconstruction. While reconstructions with explicitly meshed vanes
should yield much better results, the noise in the measurements and the fact that the injection
current of the ERT system is insufficient for the high aqueous phase conductivity leads to the con-
clusion that the chosen phase composition will not work and modifications are necessary to enable
successful ERT measurements. While ITS currently has in development an ERT system capable
of significantly higher currents needed for high conductivity solutions such as this, it will be nec-
essary for the given setup to achieve reduction in the aqueous phase conductivity as discussed in
the following section.
Conductivity measurements using the vertical electrode arrays are also possible for the liquid–
liquid system under aqueous continuous conditions as described in the FY11 report. Additional
measurements of this type were not part of these scoping experiments.
4 Validation Test Case Definition
One of the primary goals of this research effort is the acquisition of experimental data which will
be sufficiently characterized and detailed to enable validation of the multiphase CFD methodol-
ogy and simulations being conducted under the companion modeling project. The CFD solver
under development is aimed at prediction of stage performance indicators such as extraction effi-
ciency and other-phase carryover in annular centrifugal contactors and other liquid–liquid extrac-
tion devices. In order to achieve this, computational models are required which can predict liquid–
liquid interfacial area for complex multiphase flow regimes spanning complete phase-segregation
to phase-dispersed. Such a goal requires the development of a hybrid computational methodology
which enable selective sharp interface capturing as well as multi-fluid inter-dispersion modeling
with variable droplet sizes. The development of such a unique capability unavailable in commer-
cial CFD tools is well under way and testing to date has been successful.
A variety of experimental data are necessary for rigorous validation of such novel hybrid mul-
tiphase CFD tools. These are described here:
Droplet Size Prediction of liquid–liquid interfacial area requires accurate models for prediction
of dispersed phase droplet size distributions. Prediction of droplet sizes in turn requires
underlying models for prediction of the rates of droplet coalescence and breakup. Thus
data are required for validation of the individual breakup and coalescence models and/or
data for the actual droplet size distributions under relevant localized conditions. This would
include droplet size measurements in situ as well as measurements of residual dispersed
phase volumes in other-phase effluents.
14
ANL-LTR-CERT-12-001
Droplet drag Droplet motion is governed by inter-phase momentum transfer terms for the indi-
vidual phase momentum equations. A variety of drag models exist and information is needed
to guide the selection of appropriate models for the current application. A companion com-
putational effort at LANL (only minimally funded for FY12) on droplet-scale studies along
with the planned (but unfunded in FY12) INL experiments mentioned previously are aimed
at providing data in this regard.
Interfacial Area While this can be inferred from the droplet size, it can also be measured directly
through chemical means using well-characterized irreversible reaction systems as an overall,
device-averaged quantity. Such measurements for a CINC-V2 contactor are described in the
work of Schuur et al. [3]. Along with overall interfacial area, these studies provide certain
useful bulk quantities such as phase hold-up (estimations only), residence time distributions,
and droplet size distributions. Unfortunately, the focus of this work was on biological appli-
cations so the feed rates are extremely low (e.g. <100 ml/min) as are the rotor speeds used
(<30 hz (1800 RPM)).
Phase Velocities and Turbulence Accurate prediction of velocities and turbulence quantities is
necessary for accurate prediction of all other flow variables including those which are di-
rectly related to stage performance such as phase hold-up (residence time) and droplet size
(break-up and coalescence models are functions of the turbulence dissipation rate ε). Veloc-
ity measurements using optical methods (LDV, PIV) are limited to the near wall region as
the flows in these systems are opaque under typical conditions.
Volume Fraction Distributions Local volume fraction measurements provide another means of
direct validating model predictions for multiphase mixing and flow. Annular liquid height is
also useful, albeit as a more composite quantity. The ERT methods currently being applied
provide a non-intrusive method for measurement of such quantities.
Mass Transfer Coefficients Similar to drag models (momentum transfer), mass transfer informa-
tion is strictly more of a required input to the simulations and requires experimental or direct
numerical simulation level computational information to guide the selection of models and
parameters.
Ultimately, the overall stage extraction efficiency could be an additional quantity for validation,
however, the various detailed data outlined above are required to enable accurate prediction of this
composite quantity as well as to identify the main sources of uncertainty.
15
ANL-LTR-CERT-12-001
Based on the needs outlined above, the capabilities currently available, and the funding scope
of the current project, only a targeted set of validation experiments for selected quantities can be
conducted during the remainder of FY12. As such, the focus will be on acquisition of quantitative
data principally for the 4V geometry at 10 LPM total flow at different O/A ratios. Experiments will
include acquisition of time-resolved conductivity measurements of annular liquid height as well as
ERT measurements of phase fraction—both to be conducted in aqueous continuous regimes only.
Additionally, droplet size imaging analysis will be performed for multiple O/A ratios at multiple
points under the rotor as well as on the side of the housing if optical clarity of the acrylic allows it.
As time allows, some preliminary PIV measurements will also be performed.
As noted, the high electrical conductivity of the current aqueous phase presents challenges to
ERT measurements. As such, the aqueous phase will be switched to low nitric acid (0.1 M or
lower if necessary). A first series of experiments will be run with the current organic phase of 40
vol% TBP which will then be diluted with dodecane to 30 vol% TBP and the tests repeated. Along
with the existing data such as are presented here for the current phase system, this will provide
additional measurements for comparison of the effects of phase properties. Characteristics of the
phase properties including density, electrical conductivity, viscosity, interfacial tension, surface
tension, and contact angle will be measured where reliable data are not available in the literature.
References
1. Wardle, K.E., Allen, T.R., Swaney, R. (2006) CFD study of the flow in an annular centrifugal
contactor. Sep. Sci. Technol., 41: 2225.
2. Wardle, K.E., Allen, T.R., Anderson, M.H., Swaney, R.E. (2009) Analysis of the effect of
mixing vane geometry on the flow in an annular centrifugal contactor. AICHE J., 55: 2244.
3. Schuur, B., Kraai, G.N., Winkelman, J.G., Heeres, H.J. (2012) Hydrodynamic features of cen-
trifugal contactor separators: Experimental studies on liquid hold-up, residence time distribu-
tion, phase behavior and drop size distributions. Chem. Eng. Process.: Process Intensification,
55: 8.
16

Argonne National Laboratory is a U.S. Department of Energy
laboratory managed by UChicago Argonne, LLC
Chemical and Science Engineering Division Argonne National Laboratory
9700 South Cass Avenue, Bldg. 205
Argonne, IL 60439
www.anl.gov