Embed Size (px)
Citation preview

Currency Investments as a Source of Return Dossier Foreign Exchange Strategies – Attractive Risk-Based Solutions for Diversified Portfolios
Column Small Caps – A Big Opportunity!
Alternative Investments Alternative UCITS Funds – Paradigm Shift or Expensive Compromise?
Summer 13

Content
In light of the current low-interest environment, currency strategies are becoming increasingly interesting. In fact, the foreign exchange market is the biggest financial market in the world.
Asset Allocation Are the Stock Markets Taking Off? 4 Outlook 5
Macro GlobalSome Softening but Growth Outlook Intact 6
Fixed Income GlobalThe Role of Excess Liquidity 8
Real EstateInvesting Sustainably in "Green" Real Estate 10
DossierForeign Exchange Strategies – Attractive Risk-Based Solutions for Diversified Portfolios 12
ColumnSmall Caps – A Big Opportunity! 18
Alternative InvestmentsAlternative UCITS Funds – Paradigm Shift or Expensive Compromise? 21
Editorial deadline: May 23, 2013

| 3/28
Trends Summer 13
Editorial
Dear Reader
Persistently low interest rates are prompting many investors to look for sources of returns outside the fixed income segment. The foreign exchange markets, for example, are attracting growing interest. In this issue of Trends, we show why currency strategies can represent attractive solutions for diversified portfolios.
In addition, hedge funds are continuing to gain in importance. A special focus is placed on UCITS-compliant products, as their benefits relative to offshore struc- tures, namely a high level of transparency and liquidity, are obvious. They are, however, also exposed to criticism, primarily in connection with fees and perfor-mance. We analyze whether these and other common reservations are justified. Furthermore, we discuss why small caps should not necessarily be characterized as of secondary importance. And as usual, we also report on the markets and trends.
We hope this edition makes for enjoyable and thought-provoking reading, and provides you with some investment ideas.
Sincerely
Robert Parker Head Strategic Advisory Group, Member of the Global Investment Committee
Robert ParkerHead Strategic Advisory Group,Member of the Global InvestmentCommittee
Editorial

4/28 |
Trends Summer 13
After a brief consolidation, the equity markets have resumed their climb. The seasonal correction frequently seen in May therefore did not materi-alize this year. Instead, several stock market indices hit new record highs. Given the very mixed economic data recently, and the meager growth in corporate earnings, there is reason to doubt whether the rise in stock mar-kets is sustainable. Have the equity markets lost touch with reality? Or is lackluster economic performance ac-tually helping shares?
An analysis of price movements in recent months may provide an answer to these questions. The markets were quite clearly driven by defensive sectors such as food and pharmaceuticals. Defensive stocks outperformed cyclicals to an extent nor-mally only seen during sharp price cor-rections. It is hardly surprising that cycli-cal stocks are in such poor shape given the disappointing growth figures recently. More remarkable is the fact that overall share indices have been hoisted into re-cord territory despite the weakness in cy-clicals. One driver is that dividend yields remain attractive compared with bond yields. In addition, slightly weaker eco-
nomic data actually provides a boost, as this ensures that interest rates remain low.
We would therefore argue that the cur-rent environment, in which we are seeing weakness but not a slump in growth, is doing no harm at all to stock market pros-pects. The record-high levels should not lead us to draw the wrong conclusions, ei-ther. One striking case in point is the DAX, which after two failed attempts in 2000 and 2007, is once again trying to break through the 8,000 threshold. If we look at the companies in the index, we see that in terms of book value as well as earnings and dividends we get more than one and a half times as much for those 8,000 in-dex points as we did in 2000, which was a record year. The picture is the exact op-posite if we look at the alternative of fixed income investments. Instead of 5%, Ger-man government bonds are now yielding a little less than 1.5%.
A question of sector and country ro-tation?We are therefore maintaining our over-weight in equities, but are not necessarily sticking with the winners of the last few months. If economic performance contin-ues to stabilize, the more cyclical sectors
and regions, which have been neglected recently, should also benefit. This would be an argument in favor of underweight-ing the Swiss market, where the high in-dex weighting of sought-after blue chips has led to impressive performance, but also to a premium that for years has been the highest compared with other markets. By contrast, European equities still have potential to make up ground. Investors should not position themselves against Japanese stocks, despite their strong rise. To adopt a well-known saying, don’t fight the Bank of Japan.
The almost desperate search for returns also dictates positioning in other asset classes. In the fixed income arena, it may be worth holding on to corporate and high yield bonds despite the further tightening in spreads, while we would avoid hunting for yield along the interest rate curve. Real estate markets continue to represent an attractive substitute for yield. As with equ-ities, it makes sense from a Swiss per-spective to diversify into less expensive investments abroad.
Asset Allocation
Are the Stock Markets Taking Off?Patrick Bucher, Investment Strategy
Asset Allocation
Bold: tactical positioning. Normal type: long-term strategy/benchmark. Arrows show change compared with last issue of Trends, 04|05.13.* This is an indicative asset allocation, which may change over time.Historical performance indications and financial market scenarios are no guarantee of current or future performance.
Source: Credit Suisse.
Globally-oriented model portfolio for Swiss pension funds* CHF EUR GBP USD, JPY Em. Markets, Total CAD Commodities Liquidity 14.7% 0.0% 0.0% 1.3% 0.0% 0.0% 15.9% 9.8% 0.0% 0.0% 0.0% 0.0% 0.0% 9.8% Bonds 46.2% 2.9% 0.0% 2.1% 0.1% 51.3% 53.2% 3.0% 1.0% 2.0% 1.0% 60.2% Equities 9.4% 6.6% 0.0% 8.6% 2.7% 5.5% 32.8% 10.0% 4.0% 2.0% 8.0% 2.0% 4.0% 30.0% Total 70.2% 9.4% 0.0% 12.0% 2.9% 5.5% 100.0% 73.0% 7.0% 3.0% 10.0% 3.0% 4.0% 100.0%
| 5/28
Trends Summer 13
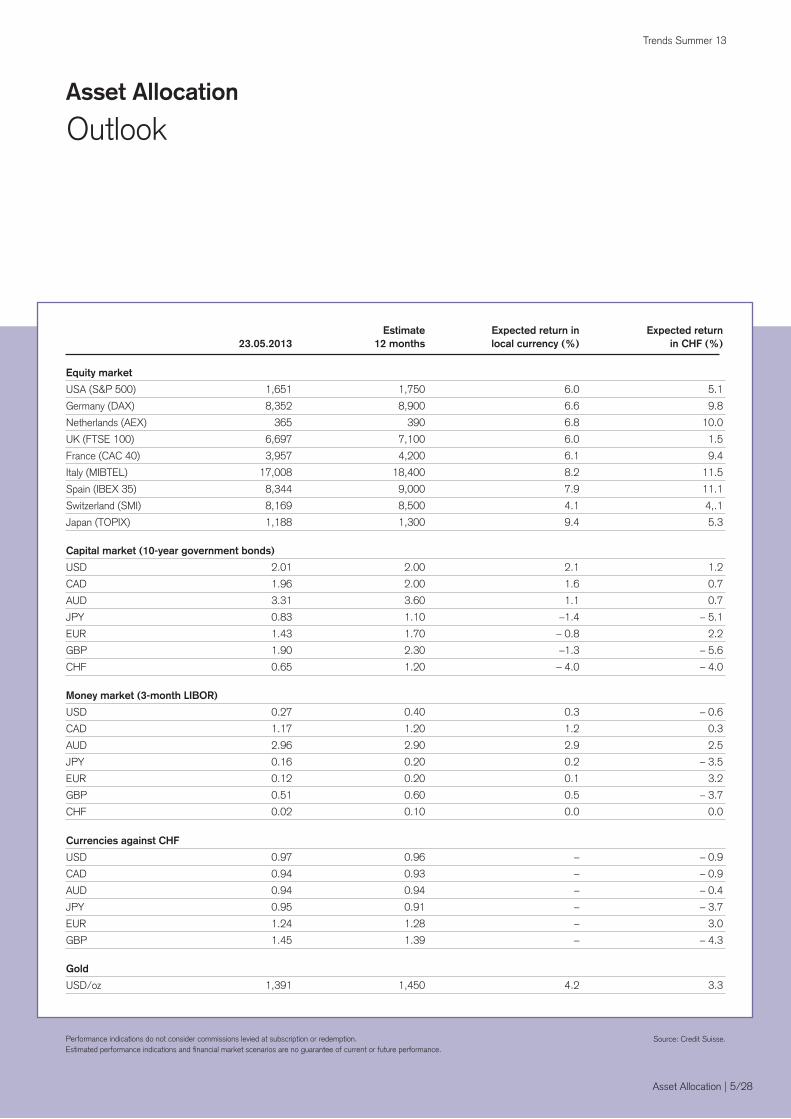
Outlook Asset Allocation
Source: Credit Suisse.
Currencies against CHF
USD 0.97 0.96 – – 0.9
CAD 0.94 0.93 – – 0.9
AUD 0.94 0.94 – – 0.4
JPY 0.95 0.91 – – 3.7
EUR 1.24 1.28 – 3.0
GBP 1.45 1.39 – – 4.3
Capital market (10-year government bonds)
USD 2.01 2.00 2.1 1.2
CAD 1.96 2.00 1.6 0.7
AUD 3.31 3.60 1.1 0.7
JPY 0.83 1.10 –1.4 – 5.1
EUR 1.43 1.70 – 0.8 2.2
GBP 1.90 2.30 –1.3 – 5.6
CHF 0.65 1.20 – 4.0 – 4.0
Equity market
USA (S&P 500) 1,651 1,750 6.0 5.1
Germany (DAX) 8,352 8,900 6.6 9.8
Netherlands (AEX) 365 390 6.8 10.0
UK (FTSE 100) 6,697 7,100 6.0 1.5
France (CAC 40) 3,957 4,200 6.1 9.4
Italy (MIBTEL) 17,008 18,400 8.2 11.5
Spain (IBEX 35) 8,344 9,000 7.9 11.1
Switzerland (SMI) 8,169 8,500 4.1 4,.1
Japan (TOPIX) 1,188 1,300 9.4 5.3
Money market (3-month LIBOR)
USD 0.27 0.40 0.3 – 0.6
CAD 1.17 1.20 1.2 0.3
AUD 2.96 2.90 2.9 2.5
JPY 0.16 0.20 0.2 – 3.5
EUR 0.12 0.20 0.1 3.2
GBP 0.51 0.60 0.5 – 3.7
CHF 0.02 0.10 0.0 0.0
Gold
USD/oz 1,391 1,450 4.2 3.3
Asset Allocation | 5/28
Performance indications do not consider commissions levied at subscription or redemption.Estimated performance indications and financial market scenarios are no guarantee of current or future performance.
Estimate Expected return in Expected return 23.05.2013 12 months local currency (%) in CHF (%)
6/28 |
Trends Summer 13
Macro Global
Some Softening but Growth Outlook IntactThomas Herrmann, Global Economic Research
The drop in some key commodity prices (e.g. oil) reflects the temporary weakness in global growth. However, lower com-modity prices also act as an “automatic
stabilizer” as they imply lower inflation. This strengthens purchasing power and al-lows central banks to continue their ultra- expansionary policy. While fiscal tight-
ening is significant in several individual countries, easy monetary policy should outweigh it on a global level. Despite per-sistent weakness in the Eurozone and some recent deceleration in both the US and China, we think global growth is thus likely to strengthen again in the second half of the year.
US: temporary weakness, but under-lying trend intactUS data has been mixed lately. On the one hand, weaker regional and national PMI (Purchasing Managers Index) num-bers point to softening activity in the man-ufacturing sector. This has been con-firmed by a decline in the latest industrial production numbers. On the other hand, job growth and US real wage gains re-main healthy and consumer spending data has been stronger than expected. Inter-est rates at near-record lows across a wide range of relevant credit categories (e.g. cars, mortgages, etc.) should also help. The recovery of the housing market should continue to support growth more visibly over coming quarters.
Flexible Fed policy should ensure smooth exit over timeThe Federal Reserve (Fed) continues to highlight greater flexibility. The latest FOMC statement on 1 May mentioned the possibility that asset purchases could both be lowered or raised further if re-
Macro Global
Did you know that …
... the recovery of the US housing market should continue to support growth over the coming quarters?
... the Fed has indicated that it is discussing a re-duction in asset purchases starting as early as this summer?
... Q1 GDP growth in Japan has been stronger than expected?
... China is likely transitio-ning to lower but still solid trend growth?
!

| 7/28
Trends Summer 13
quired. The Fed’s emphasis on “two-way risk” in asset purchases probably aims to signal that it has the means to manage a smooth exit without unwanted market dis-ruptions. The policy transition could even include an implicit and temporary move to-ward “yield targeting”. The Fed has clearly indicated that it is discussing a reduction in asset purchases starting as early as this summer. Our view is that the economic soft patch should delay stronger com-munication on such a move. More impor-tantly, if the Fed starts to cut purchases earlier than we think, it will aim to avoid a significant rise in yields, as that could con-stitute a shock for the economy. The lat-est communication tells us that it would be willing to increase purchases again if re-quired to limit the increase in bond yields.
Europe: sustained easing of financial stress, recovery emerging but lagging Agreement on the Cyprus bailout and im-proved political stability in Italy following the post-election uncertainty both con-tributed to renewed sharp declines in gov-ernment bond yields in Italy and Spain. This remains very important for lowering funding costs and for supporting the real economy. Possibly combined with new initiatives by the European Central Bank, this could finally bring easier credit con-ditions and support demand. Significant public spending cuts have been nega-tive for growth and often failed to bring
the deficit reductions hoped for. Euro-pean politicians appear to be willing to tolerate less drastic tightening going for-ward, which could also contribute to the return to gradual growth that we continue to expect.
Japan: bold BoJ policy with a signifi-cant impactThe Bank of Japan (BoJ) has made a much bolder announcement than ex-pected. The significant increase of asset purchases this year and next has contin-ued to weigh strongly on the Japanese yen and should result in stronger export and domestic demand growth. Gross do-mestic product (GDP) growth in Q1 al-ready exceeded expectations at 3.5% (Q-o-Q, annualized). However, additional structural reform efforts (e.g. increased female labor market participation) are re-quired to ensure a lasting return to growth.
Emerging markets: China still tran-sitioning to lower trend growth, but solid outlook While the latest Chinese growth data has been weaker than expected (Q1 GDP growth of 7.7% Y-o-Y), we view this as part of an expected transition to slower but still solid trend growth. Given lower inflation, Chinese policy is likely to remain growth-supportive. Indicators in Brazil still point to downside risks. Paired with more favorable food price dynamics, this should
limit policy-rate tightening after Brazil’s central bank began its latest tightening cycle (an increase of 25 basis points to 7.5% in April). While lower commodity prices dampen inflation, they also imply less immediate impetus for net commod-ity exporters like Russia.
i
European politicians appear to tolerate less drastic pub-lic spending cuts going for-ward, as these often failed to bring the deficit reduc-tions hoped for.
Macro Global
8/28 |
Trends Summer 13
The Role of Excess LiquidityLuca Bindelli, Deputy Head of Strategy, CIO Office
Fixed Income Global
Fixed Income Global
With global excess liquidity explain-ing a sizeable part of the recent surge in credit and higher yielding fixed in-come, the eventual unwind of this “bonanza” could potentially knock the search for yield. However, any li-quidity withdrawal will lag improved macro fundamentals, suggesting that excess liquidity will remain a source of support to credit and higher yield-ing segments.
Which segment benefits most from excess liquidity?To gain insight on the extent to which poli-cymakers might have influenced fixed in-come returns, we looked at the mone-
tary base in excess of real activity related transactions, and controlled for the impact it had on global high yield bonds, emerg-ing market bonds, and US investment grade credit. We constructed our global excess liquidity indicator as the growth rate of the monetary base less the growth rate of industrial production. We then ag-gregated the excess liquidity across the G10 economies plus Brazil, Russia, India and China, weighting each country by its relative economic size.1
The graph on the next page displays the yearly total return on the various fixed in-come segments (vertical axis) as a func-tion of past global excess liquidity growth (lagged by 12 months). It clearly stands out that global excess liquidity growth is positively correlated to future fixed in-come returns. Moreover, to emphasize our point, we have also displayed the lin-ear regression that best fits each fixed in-come segment. The slope of the regres-sion represents the sensitivity of the total return to liquidity. In the case of global high yield bonds, an increase of 1% in liquidity corresponds to a 0.59% addi-tional yearly return on average (global high yield has a “beta” of 0.59 to excess liquid-ity). Less risky segments have lower “be-tas”. In particular, US investment grade credit displays a beta of “only” 0.19, while
emerging market bonds stand at 0.35. This tends to confirm that less risky seg-ments of the bond space have benefitted from excess liquidity comparatively less. Also, in our example, we lagged global excess liquidity by 12 months. However, we find remarkably similar “betas” using global excess liquidity only lagged by six months. In other words, excess liquidity produces some persistent effects over bond returns. Finally, our calculations sug-gest that excess liquidity growth explains between 44% and 56% of the total return variations over the period considered. This further confirms that liquidity is a major driver of fixed income returns.
Liquidity withdrawal to lag activity im-provementGoing forward, we think central banks will “lag” in adjusting liquidity, inasmuch as their credibility at anchoring inflation expectations remains intact. This means that excess liquidity could stay sufficiently elevated to maintain pressure on spreads and bond yields for a while longer. Our best guess is that policymakers will only allow rates to move higher when final demand improvements will be markedly visible (e.g. the labor markets). In other words, the improvement in underlying fun-damentals will dictate a subsequent with-drawal of central bank liquidity. Hence,
1 By our calculations, the US accounts for 27%, the EU for 21%, and China for 13% of the global liquidity. Hence, with the Fed being the closest central bank to eventually alter its unconventional measures, we should always keep in mind that the US is the most important piece of the puzzle when discussing liquidity conditions over the next couple of months. Our analysis starts in July 2009, so as to avoid the period where central banks reacted in response to a liquidity crisis as opposed to an “activity-stimulating” policy (our data end April 2013).
Historical performance indications and financial market scenarios are no guarantee of current or future performance.

| 9/28
Trends Summer 13
while government bond yields should trend moderately higher over time, high yield, emerging market and credit seg-ments should still benefit (in that order) from persistently positive excess liquid-ity growth. However, some uncertainty
surrounding the timing of liquidity with-drawal will likely lead to setbacks along the road. But these should prove tempo-rary. The most recent global excess li-quidity data we calculated suggests some excess liquidity growth slowdown over
Q4 2012 and Q1 2013, whereby growth rates were falling from double digit levels in the first half of 2012 to single digit lev-els (around 5% growth average in Q1 this year). Given the lead-lag relation identified above, there could be scope for the ex-cess liquidity support to lessen a bit. Still, our analysis above and our belief that cen-tral banks will prefer to stay “behind the curve” would suggest an ongoing positive impact of excess liquidity on high yield, emerging market, and US credit returns (all else equal) over the coming months.
Fixed Income Global
Global excess liquidity and fixed income performance
Global high yield bonds
Total return = 0.59 x GEL + 9.29
Total return =0.35 x GEL + 9.33
Total return =0.19 x GEL + 8.39
Emerging market bondsUS investment grade credit
Global excess liquidity, %, Y-o-Y growth, lagged 12 months
Tota
l ret
urn
in U
SD
, %, Y
-o-Y
80
70
60
50
40
30
20
10
0
-10
-10 0 10 20 30 40 50 60 70 80
GEL = Global excess liquidity
Source: Credit Suisse.Historical performance indications and financial market scenarios are no guarantee of current or future performance.

10/28 |
Trends Summer 13
Real Estate
Investing Sustainably in ”Green“ Real Estate Roger Baumann, Director, Global Head Product Development & Sustainability, Real Estate Asset Management
Sustainable investments are a cur-rent trend, meeting the growing need for greater social and environmental responsibility. They are particularly suitable for institutional investors
with a long investment horizon. Sus-tainability is set to become a much more important aspect of real estate investments, too – not least because buildings consume so much energy.
The real estate sector is undergoing radi-cal change. Nearly half of final energy worldwide currently goes into heating. According to estimates, properties such as residential and commercial buildings are responsible for up to one-fifth of all greenhouse gas emissions. In addition, more than half of all available resources are used by the construction sector. As a result, the theme of building and operating sustainably is attracting increasing atten-tion within the real estate industry. High, more volatile energy prices and greater awareness of the limits of many natural resources are resulting in a stronger com-mitment to increasing environmental sus-tainability in the planning, building and running of properties. Reasons for this trend include the need not only to act re-sponsibly for the sake of future genera-tions but also to ensure low running costs, high lease potential and good return op-portunities in the long term.
More than just saving energyThe concept of sustainability is often un-derstood in very different ways. In Swit-zerland, sustainable construction is often simply equated with Minergie®1. However, if we take a broader view of sustainabil-ity, we see that energy consumption – al-though certainly important – is not the sole consideration: factors such as the materials used, flexibility of the building’s use, and public and private infrastructure must also be looked at. For instance, at
1 Minergie® is a globally protected brand and the most important energy standard in Switzerland for low-energy houses. The Minergie-P® standard is used to denote and certify buildings that aim to achieve even lower energy consumption than the Minergie® standard.
Real Estate
The "Foyer" office building in Zug has greenproperty, Minergie-ECO and LEED Platinum certification and is a showpiece for sustainable and ecological construction. Copyright: leistungsphotografie.ch

| 11/28
Trends Summer 13
first glance it may appear sustainable to own a building with the Minergie-P® la-bel1. However, if we take a second look, we may ask whether the use of building materials from far-flung regions of the world is appropriate. Such materials imply a high level of hidden energy expenditure, for instance on producing and transport-ing them. This hidden energy is known as "gray energy". Equally, if living in a prop-erty means taking the car to do the daily shopping or to commute to work because no public transport is available, then this, too, leads to high environmental costs.
Sustainable portfolio management includes both new and existing build-ingsIn 2009, Credit Suisse's Real Estate As-set Management (REAM) unveiled the first sustainable real estate fund for in-vestment in new buildings. At the same time, it broke new ground by launching the greenproperty seal of quality. Mean-while, the options for systematically ana-lyzing the savings and optimization poten-tial of existing properties were limited until recently. This is why in July 2012 Credit Suisse's REAM division - one of Switzer-land's largest private builders and build-ing owners - launched a five-year program in conjunction with Siemens Switzerland and Wincasa. The aim of the program is to systematically reduce energy consump-tion and CO2 emissions from the proper-ties that Credit Suisse's REAM division
holds in its portfolio, and to do so with-out taking measures that require further investment in the buildings. The target is a minimum 10% average reduction in CO2 emissions across all the buildings, which equates to around 13,000 metric tons of CO2. Thanks to this ambitious pro-gram, nearly 1,000 buildings in Switzer-land worth a total of more than CHF 30 billion will be optimized and operated on a sustainable basis in the long term.
The trend towards sustainable invest-mentInstitutional and private investors only have access to sustainable invest-ments on a limited scale. Yet the range of socially, ethically and environmentally
friendly products has shot up since 2005. Investors can gain exposure to "green" real estate either indirectly via sustainabil-ity funds that invest in real estate compa-nies, or directly via real estate funds that hold "green" properties. Sustainable in-vestment products are particularly suitable for institutional investors such as pension funds, which as a rule have long invest-ment horizons. Since sustainable invest-ments are aimed at achieving long-term performance targets, their investment ho-rizon fits that of institutional investors.
Decarbonizing Swiss real estateReal estate investments offer signifi-cant opportunities to make a difference in terms of de-carbonization. The aim of the study published in August 2012 is to highlight the action that banks can take in order to contribute to CO2 re-duction with their real estate invest-ments. The study analyzes CO2 aba-tement potential, taking the specific
example of Credit Suisse's Real Estate Asset Management division.
The study is available in English and German, and can be downloaded at: credit-suisse.com/cleantech/de/ Credit Suisse Research Highlighted Publications
Credit Suisse case study in cooperation with the WWF
Real Estate

12/28 |
Trends Summer 13
The investment environment pushes investors to look for transparent and liquid investment solutions. They are looking to get exposure to strategies which are capturing attractive invest-ment opportunities and, at the same
time, offer interesting statistical fea-tures from a portfolio diversification point of view. In this article, we are discussing the potential of foreign exchange (FX) strategies in this con-text, as well as possibilities of imple-
menting these strategies in an effi-cient manner within a portfolio.
Current market opportunitiesRecent fiscal and monetary policy has impacted the currency markets in partic-ular, including the ongoing debate around topics such as “currency war” and “global currency competition”. Diverging funda-mentals, such as dispersion of growth and inflation forecasts, are creating in-vestment, as well as trading opportuni-ties in the global currency markets.
In terms of performance, 2011 and 2012 have been difficult for FX managers, given the low and declining implied vol-atilities of the global FX markets. But since the end of last year, there has been a slight increase in volatility in currencies, providing managers with good trading opportunities.
Portfolio characteristics of a foreign exchange investment are favorableIn the following section, we study the implications of an FX investment in the context of a USD balanced portfolio al-lowed to invest in equities, bonds, com-modities and real estate. Under a wide
Foreign Exchange Strategies – Attractive Risk-Based Solutions for Diversified PortfoliosLuca Bindelli and Giuseppe Traviglia, CIO Office, and Damaris Reiser, Alternative Investments Advisory
Currency Investments as a Source of Return
Dossier
Dossier
Dossier
Dossier
Dossier
Dossier
Dossier
Dossier
Dossier
Dossier
Dossier
Dossier
Dossier
Dossier
Dossier
Figure 1: Average annualized performance of various asset classes (historical and CMA)
1 The expected returns over 5 years are based on the last Capital Market Assumption (CMA) available in February 2013. The returns presented here are in USD. We use the historical variance-covariance matrix to build the efficient frontiers.
2 Backtested performance.
Source: Credit Suisse, data period 01.2008-12.2012.Historical performance indications and financial market scenarios are no guarantee of current or future performance.
Asset class BenchmarkHistorical return
(2008-2012)Historical volatility
(2008-2012)
Expected return over 5 years (CMA
assumptions)1
Bonds USD Citigroup Euro $ 5.6% 3.7% 0.6%
Equities Switzerland MSCI Switzerland 4.0% 20.9% 4.1%
Equities Eurozone MSCI Eurozone -3.6% 29.8% 6.6%
Equities UK MSCI UK 0.6% 22.9% 7.5%
Equities USA MSCI USA 3.0% 19.1% 7.9%
Equities Japan MSCI Japan -2.6% 18.4% 6.6%
Equities emerging markets MSCI Emerging Markets 3.4% 29.0% 9.6%
Commodities DJ UBS Commodity -2.8% 21.9% 7.0%
Hedge funds HFRX Global -2.6% 7.2% 6.3%
Gold London PM Gold 17.5% 21.9% 7.0%
Real estate FTSE EPRA NAREIT Global 5.1% 27.4% 7.8%
Foreign exchange Diversified FX investment2 7.0% 3.1% -

| 13/28
Trends Summer 13
set of assumptions on portfolio volatility and investment returns, we show that FX is an efficient add-on to a standard balanced portfolio. For our analysis, we looked at 2008-2012. Figure 1 (see pre-vious page) displays the summary sta-tistics of our considered investment uni-verse and the historical returns1, as well as expected returns over the next five years derived from Credit Suisse’s Capi-tal Market Assumptions (CMA).
The historical returns are characterized by an environment of decreasing yields (high bond returns) and poor average eq-uity returns. However, the currently low-
yield environment implies that the high bond performance cannot be repeated over the coming years. Moreover, the current high equity risk premium sug-gests a higher return potential in the eq-uity segment. Therefore, we decided to incorporate a second return scenario (CMA) in our analysis, which precisely accounts for a less bond-friendly envi-ronment, where equities would offer a better investment opportunity compared to the historical return scenario.
Figure 2 (see above) plots the effi-cient frontiers achieved with and with-out an independent FX investment for
Dossier
Dos
sier
D
ossi
er
Dos
sier
D
ossi
er
Dos
sier
D
ossi
er
Dos
sier
D
ossi
er
Dos
sier
D
ossi
er
Dos
sier
D
ossi
er
Dos
sier
D
ossi
er
1 For the FX investment, we used monthly data from a diversified FX index, covering different FX strategies with constant weights (monthly rebalancing).
8%
7%
6%
5%
4%
3%
2%
1%
0%
8%
7%
6%
5%
4%
3%
2%
1%
0%
4% 4%5% 5%6% 6%7% 7%8% 8%
Por
tfolio
retu
rn
Portfolio risk Portfolio risk
Assuming historical returns Assuming CMA returns
Por
tfolio
retu
rn
With diversified FX investment Without FX investment
Figure 2: Efficient frontiers under historical and CMA return assumptions
Source: Credit Suisse.
BenchmarkCorrelation to
FX investment
Citigroup Euro $ 0.16
MSCI Switzerland 0.07
MSCI Euro zone 0.09
MSCI UK 0.09
MSCI USA 0.09
MSCI Japan 0.08
MSCI Emerging Markets 0.17
DJ UBS Commodity 0.13
HFRX Global 0.19
London PM Gold 0.08
FTSE EPRA NAREIT Global 0.12
Figure 3: Asset class correlations to FX investment
Source: Credit Suisse.
Historical performance indications and financial market scenarios are no guarantee of current or future performance.

14/28 |
Trends Summer 13
the two return scenarios described above: historical returns and CMA re-spectively. Under both scenarios, the integration of an FX investment in the overall portfolio offers appreciable ef-ficiency gains.2 Such gains are mainly achieved through its attractive diver-sification properties. Indeed, Figure 3 (see previous page) displays the corre-lations of the FX investment with other asset classes present in the portfolio: all correlations are low within the period considered.
Sensitivity analysis to return assump-tionsIn our previous analysis, the FX invest-ment has obvious attractive properties, with an annualized gross performance of 7% on average and a low historical volatility of 3.1%. To ensure that these results are robust, we decided to calcu-late the optimal FX weight in our portfo-lio using alternative FX investment return assumptions for a given level of portfolio risk. The results of this analysis are pre-sented in Figure 4. Under the two sce-narios of return assumptions for all other asset classes (historical and CMA), it is always optimal to allocate the maximum weight to FX when the expected return is 7% for the FX investment. This holds true for all the portfolio risk levels con-sidered. As the FX return assumptions are reduced stepwise, the FX invest-
Dossier
Dossier
Dossier
Dossier
Dossier
Dossier
Dossier
Dossier
Dossier
Dossier
Dossier
Dossier
Dossier
Dossier
Dossier
2 We constrain the FX investment in our portfolio to a quote included between 0 and 10%. Bonds are constrained between 5 and 65%, equities between 25 and 55%, commodities, gold, hedge funds, and real estate are all constrained between 0 and 10%.
Opt
imal
wei
ght
Opt
imal
wei
ght
Figure 4: Optimal FX weight under various expected return assumptions and target portfolio volatilities
Expected return = 0%
Expected return = 0%
Expected return = 2%
Expected return = 2%
Expected return = 4%
Expected return = 4%
Expected return = 7%
Expected return = 7%
10%
8%
6%
4%
2%
0%
10%
8%
6%
4%
2%
0%
5% 6%
Assuming historical returns
Portfolio risk
Portfolio risk
6% 7% 8% 9% 10% 11% 12% 13% 14%
Source: Credit Suisse
Historical performance indications and financial market scenarios are no guarantee of current or future performance.
Assuming CMA returns

| 15/28
Trends Summer 13
ment weights tend to decrease at lower target portfolio volatility levels. Neverthe-less, under nearly all target volatility lev-els, it is optimal to include a certain allo-cation to the FX investment, even when assuming an expected gross return of 0%. This is because diversification gains are particularly valuable in portfolios with lower target-volatility levels.
Foreign exchange is a useful add-up to a balanced portfolioWe showed that including FX in a styl-ized portfolio contributes to improving the risk/return profile, as the FX investment proves to be a useful addition for diver-sified portfolios thanks to its low vola-tility and positive diversification proper-ties. Second, this conclusion would be robust to a variety of expected FX re-turn assumptions. Finally, the inclusion of FX strategies would be particularly valu-able to lower risk profiles. This holds un-der the two return assumption scenarios (historical and CMA returns).
In the following section, we present sev-eral possible ways to put currency strate-gies into practice.
Potential investment approachesThere are a number of different currency strategies, and each attempts to seize on the opportunities on the FX market in a different way. A distinction should
be made between strategies with a fun-damental approach and technical trading strategies. Fundamental strategies use economic and market figures, money flows, or other external market events
as input data. Technical strategies, on the other hand, are based on a technical analysis of the fundamental market and economic data in order to determine the positioning. There are also a number of
Dossier
Dos
sier
D
ossi
er
Dos
sier
D
ossi
er
Dos
sier
D
ossi
er
Dos
sier
D
ossi
er
Dos
sier
D
ossi
er
Dos
sier
D
ossi
er
Dos
sier
D
ossi
er
16/28 |
Trends Summer 13
derivative strategies involving the use of options. These do not physically de-posit the currency and exhibit asymmet-rical return profiles. A further distinction should be made between global currency strategies and focused investment ap-proaches, whose geographical focus lies only on specific regions (e.g. on emerg-ing countries). Another variation is the multi-strategy approach, in which a fun-damental, technical, or focused strategy is pursued, depending on current context and climate.
Practical implementationCurrency strategies can be implemented in a variety of ways and can involve pur-suing a single investment strategy at a time, or a combination of several. The chosen strategy can then be imple-mented directly on the market by building a position in the foreign currency in ques-tion. Or it can be replicated via fund solu-tions. As with traditional asset classes, it makes sense when investing in curren-cies to find the right balance of strate-gies, investment styles, and geographic focus. On the one hand, this approach gives a portfolio the advantage of diversi-fication and, on the other, reduces man-ager risk insofar as fund solutions are applied. Such multi-manager solutions will be our main focus in the following. Before drawing up a multi-manager so-lution, it is useful to draw up an insti-tutionalized and transparent investment process. It should clearly define the pro-
cedure to follow in the allocation, se-lection and continued monitoring of the assets within the portfolio. To keep coun-terparty risk as low as possible, it is ad-visable to enter the individual investment products on a platform or an indepen-dent investment structure (managed-ac-count structure). A professionally man-aged platform creates transparency and enables the fee structure to be deter-mined individually depending on invest-ment volume.
Manager selectionTo select appropriate investments on the platform, selection criteria must be de-fined before they are applied as part of an extensive and detailed due diligence process. The criteria may be quantita-tive as well as qualitative in nature. One of the most important criteria is the com-parison of historical, risk-adjusted per-formance and the amount of accrued management fees. The fund manager’s experience on the FX market and the consistency of the performance gener-ated can be a further important crite-rion. The manager should also pursue a documented and institutionalized in-vestment process. Further, it should be established as to how far the manager complies with his/her own investment guidelines, and whether he/she conse-quently adheres to them even in chal-lenging market conditions. Once a fund manager has successfully completed the due diligence process, his/her fund be-
comes part of the allocation. A transpar-ent managed-account set-up ensures efficient risk management.
Allocation processAside from a strategic allocation, which determines the weighting of the individ-ual sub-investment strategies - these can be tactically adjusted according to the market environment - the next step involves a decision on the manager al-location. Here, a risk-based approach is advisable, as part of which manager al-location is determined based on a com-parison of the historical risk of each fund. Risk can be measured by maxi-mum drawdown, for example, and used as the basis for an inverse allocation, i.e. the higher the maximum drawdown of a fund, the less weighting it is given in the allocation. This approach aims to reduce the risk a portfolio is exposed to by giv-ing funds that were previously managed conservatively a higher weighting.
Continuous monitoringThe allocation should be monitored con-tinuously and, should it become neces-sary, adjusted. If a fund registers a new drawdown, its weighting in the portfolio is reduced. However, if a manager changes his/her risk strategy without a new draw-down necessarily having occurred, this should also be taken into account.
Dossier
Dossier
Dossier
Dossier
Dossier
Dossier
Dossier
Dossier
Dossier
Dossier
Dossier
Dossier
Dossier
Dossier
Dossier

| 17/28
Trends Summer 13
Investment solutions in practiceInterested investors can find several funds that pursue currency strategies within offshore solutions, but the range of such products in the onshore seg-ment is still strongly limited. The recent launch of a UCITS-compatible fund is
likely to be the first of further funds to hit the market over the next months and years. In detail, the recently launched UCITS-compatible fund is structured as follows: An index reflecting the perfor-mance of the selected FX managers is constructed. The fund enters an “un-
funded” swap with the managed-account platform. It pays fees and, in return, re-ceives the income of the FX index. The gains and losses are calculated on a daily basis. As this derivative structure ties up virtually no liquidity, it can, within the framework of a conservative fixed-income mandate, generate additional, low-risk returns. It also has the advan-tage of not requiring investments to be held physically, thus allowing capital to be utilized efficiently. Counterparty risk is equally low: If a swap is “unfunded", i.e. it does not require a mandatory deposit, risk is limited to the profit accumulated in a day, which has not yet been paid out by the counterparty. The total gains and losses are offset every two weeks.
ConclusionCurrency strategies such as the ones presented above are suited to yield-ori-ented investors. They offer advantages in terms of diversification for mixed port-folios and an optimized risk/return pro-file. Fund solutions in the UCITS format provide liquid, transparent, and diversi-fied investment solutions. They are par-ticularly suited to conservative portfolios. However, the choice of UCITS-compat-ible funds is still rather limited. With the currently observable trend of launching alternative funds as onshore products, though, the range of such products on the market is likely to grow.
Dossier
Dos
sier
D
ossi
er
Dos
sier
D
ossi
er
Dos
sier
D
ossi
er
Dos
sier
D
ossi
er
Dos
sier
D
ossi
er
Dos
sier
D
ossi
er
Dos
sier
D
ossi
er

18/28 |
Trends Summer 13
Many institutional investors in Swit-zerland base their investments in foreign equities on the MSCI World ex Switzerland Index. But since this index does not cover small caps, in-vestors are neglecting this invest-ment segment. As a result, they are missing out – whether consciously or unconsciously – on around 14% of investable market capitalization in their portfolios. This is surprising, because stocks in smaller compa-nies have always generated higher returns over the long term than those in large companies. Over the past twelve years, global indices that take into account the small cap seg-ment have recorded an annual addi-tional return of 0.6% with an almost identical level of risk.
Standard indices without small capsThe equity indices of the global index provider MSCI divide stocks into three size categories: large companies or large caps (which represent 70% of market capitalization), medium-sized companies or mid caps (15%) and small compa-nies or small caps (14%). The widely used MSCI standard indices comprise only the large and medium-sized com-panies and therefore only cover around 85% of the market. In addition to the standard indices, MSCI also calculates small cap indices. All three size catego-ries appear in the MSCI Investable Mar-ket Indices (IMI), which therefore repre-sent around 99% of investable market capitalization. The indices of other pro-viders (e.g. FTSE) use a similar building block principle.
Better performance of small compa-niesFor decades, financial market research has been focusing on the issue of whether the size of a company has a systematic effect on the return on its shares. The in-vestigations carried out by Banz (1981) and a study by Fama and French (1993) were groundbreaking in this respect. The latter looked at the US equity market be-tween 1963 and 1991 and found that small caps generated a monthly excess return of 0.27%. A comparison of long-term index returns supports this finding: between January 1993 and April 20131, the annual return generated by the MSCI World Small Cap Index was 2.08% higher than that of the MSCI World standard in-dex. From January 2001 to April 20131, small caps outperformed the standard in-dex by as much as 5.07% p.a. A compari-son of the MSCI World IMI Index (includ-ing small caps) and the MSCI World Index (excluding small caps) shows that the for-mer’s annual return was 0.57% higher – with almost the same level of overall risk.
Although the excess returns of small caps are subject to sharp cyclical fluc-tuations, the higher returns generated by small companies can be observed in al-most all equity markets over longer peri-ods of time. Research has found various explanations for this: a premium for addi-tional, systematic risk (Fama and French 1993), a premium for lower liquidity (Ami-hud 2002) and behavioral market ineffi-
Column
Small Caps – A Big Opportunity!Dr. Valerio Schmitz-Esser, Head Index Solutions
Column
1 Data as at April 30, 2013.Historical performance indications and financial market scenarios are no guarantee of current or future performance.
Large cap indices, 70% Standard indices, 85%
Invest-able
marketindices,99%
Mid cap indices, 15%
Small cap indices,14%
Figure 1: Structuring of indices according to the building block principle
Source: MSCI, Credit Suisse.

| 19/28
Trends Summer 13
Column
ciency (Lakonishok, Shleifer and Vishny 1994).
Active management not obligatoryInvestments in small caps seem to be a rewarding area for active portfolio man-agement: the significantly lower level of coverage by financial analysts means there is a greater chance of discovering hidden gems. In practice, however, active management of small caps presents chal-lenges in the form of high trading costs and low market liquidity. As a result, in-
formation that is not yet incorporated in the price can only be used for relatively low investment amounts. Looking back, it appears that active management for small caps has not necessarily been more suc-cessful than for blue chips: according to Standard & Poor’s, around 35% of ac-tive blue chip managers outperformed the S&P 500 Index between 2007 and 2012, whereas 22% of active small cap manag-ers outperformed the S&P 600 Small Cap Index in the same period. The chances of choosing an active and successful man-
ager are therefore probably no higher for small caps than for blue chips. In addition, the absolute cost of choosing the man-ager is similar for both asset classes, al-though the relative cost is higher for small caps because of the smaller investment volume.
Good reasons for an indexed invest-ment strategyWhere there is no access to active asset managers with a proven ability to gener-ate excess returns, an indexed investment strategy is sensible for small caps. Al-though the potential for outperforming the small cap index is lost, the small company size still has a positive effect. In addition, the costs of an indexed investment in the small cap segment are considerably lower than those of active management: as well as the smaller management fee, the lower portfolio turnover has a positive impact on the return after costs, a factor that cannot be underestimated for illiquid small caps.
Passive tracking of a small cap index presents the portfolio management with specific challenges: the number of stocks is far higher than in the standard index (in the MSCI, currently 4,228 stocks com-pared with 1,606 in the standard index), and there are no “heavyweights” that dom-inate the index. The highest weighting of any stock in the MSCI World Small Cap Index is just 0.19%1. Consequently, the portfolio needs to contain a high number of securities in order to reach an accept-able tracking error for an index portfolio.
MSCI World Small Cap (gross) in CHF
Indexed performance (end 2000 = 100%)
200
180
160
140
120
100
80
60
40
20
0
29.1
2.20
00
10.0
1.20
02
17.0
7.20
02
21.0
1.20
03
28.0
7.20
03
30.0
1.20
04
05.0
8.20
04
09.0
2.20
05
16.0
8.20
05
20.0
2.20
06
25.0
8.20
06
01.0
3.20
07
05.0
9.20
07
11.0
3.20
08
15.0
9.20
08
20.0
3.20
09
24.0
9.20
09
31.0
3.20
10
05.1
0.20
10
11.0
4.20
11
14.1
0.20
11
19.0
4.20
12
24.1
0.20
12
30.0
4.20
13
MSCI World IMI (gross) in CHFMSCI World (gross) in CHF
Figure 2: Comparison of index performance
Source: Datastream, Credit Suisse/IDC, as at April 30, 2012.Historical performance indications and financial market scenarios are no guarantee of current or future performance.

20/28 |
Trends Summer 13
It is also important to take into account the lower liquidity and limited availability of equity index futures for the reinvest-ment of dividends.
Credit Suisse has some experience in tracking small cap indices. In the past, it has been able to overcome the challenges of this asset class very effectively, as can be seen from the results of the physical replication portfolios on small-cap indices
for the US, the UK, the eurozone, and Japan. For the period from July 2009 to April 20131, the gross performance of two portfolios is slightly above the reference index, and it is only slightly below the ref-erence index for the two other portfolios.
An approximation method with optimized sampling is recommended for tracking the MSCI Small Cap World Index. It would be inefficient to hold all stocks in the portfo-
lio, since transaction and custodian costs have too heavy an impact on the return after costs. With a portfolio of around 1,000 securities, the expected tracking error can be reduced to 0.46%, an ac-ceptable level for the asset class. With a portfolio of 2,500 securities, the tracking error is just 0.14%. Credit Suisse aims for an index replication with 1,500 to 2,000 securities.
In view of the positive return profiles of global small caps, it is surprising that so few Swiss investors have holdings in this attractive segment. One reason for this could be that the segment has predomi-nantly been associated with active man-agement up to now, and the costs of manager selection were assessed as too high by many investors — particularly for an investment with a comparatively low investment volume. However, an indexed investment in global small caps enables the search costs and ongoing costs of the investment to be significantly reduced, without eroding the return expected over the long term. Figure 2 on the previous page shows that, from a long-term per-spective, small caps are definitely a big opportunity.
Column
1 Data as at April 30, 2013.
Ex-a
nte
track
ing
erro
r
Number of securities in the portfolio
2.00%
1.80%
1.60%
1.40%
1.20%
1.00%
0.80%
0.60%
0.40%
0.20%
0.00%
100
1.75%
0.75%
0.46%0.31%
0.21% 0.14%
0.00%
500 1,000 1,500 2,000 2,500 3,000 3,500 4,000 4,150
Replication of the MSCI World Small Cap Index
Figure 3: Impact of the number of stocks on the tracking error
Source: Credit Suisse.

| 21/28
Trends Summer 13
Alternative Investments
Alternative UCITS Funds – Paradigm Shift or Expensive Compromise?Oliver Wiedemeijer, Portfolio Manager, Alternative Fund Solutions, and Ulrich Keller, CIO Alternative Funds Solutions
Extract from the White Paper entitled "Al-ternative UCITS strategies – paradigm shift or expensive compromise?", pub-lished in February 2013
Current record-low interest rates are prompting investors to hunt for alter-native yield sources, with a focus on strategies that promise attractive re-turns. As a result, hedge funds are attracting growing interest, particu-larly from investors who do not have the capacity to assume the risks as-sociated with equities. Hedge funds have historically performed better than other asset classes, on both an absolute and risk-adjusted basis, and thus improve the risk-return charac-teristics of a mixed portfolio. Whereas in the past hedge funds have almost exclusively taken the form of offshore structures, the last few years have seen the rise of onshore vehicles, most notably alternative UCITS funds.
The UCITS framework addresses investors' most pressing concerns, specifically their needs for funds to
be liquid and transparent. In recent times, an increasing number of hedge fund managers have been turning to UCITS-compliant fund structures, leading to a steady increase in the variety of funds available. However, alternative UCITS funds have come in for criticism, particularly over fees, performance, and the use of swap structures. This article looks at whether the criticisms are justified.
An evolving frameworkUCITS stands for Undertakings for Col-lective Investment in Transferable Securi-ties. These funds have been established in accordance with EU legislation for the fund industry, aimed mainly at increasing investor protection. When the framework was introduced in 1985, it was intended in the first instance for traditional funds. However, as the financial markets have evolved, and investment instruments have become more complex, the framework has been steadily expanded. The latest Directive, UCITS IV, came into force in 2011. It allows a much wider range of instruments compared with the previous
rules, and restrictions regarding the use of derivatives have been relaxed consider-ably. This has opened up the framework to funds that follow alternative strategies, i.e. hedge fund strategies. Alternative UCITS funds – the new darling of the hedge fund industryUCITS have become a globally recognized brand of regulated investment funds. As a result, more and more hedge funds have launched onshore vehicles that are UCITS-compliant. Between 2008 and 2012, assets managed in alternative UCITS funds doubled to over USD 200 billion. Meanwhile, renowned hedge funds managers such as Brevan Howard, Win-ton and AQR have successfully launched alternative UCITS funds, broadening the investment universe and giving investors additional confidence. The growing pop-ularity of alternative UCITS funds among investors is down to the fact that UCITS IV rules address some of the most press-ing investor concerns following the 2008 financial and stock market crisis. Criti-cisms leveled at the hedge fund industry by investors since the crisis have specifi-
Alternative Investments

22/28 |
Trends Summer 13
cally concerned liquidity, transparency and risk management.
Liquidity: in most cases, daily or weeklyUnlike offshore hedge funds, which typi-cally have monthly or quarterly redemp-tion frequencies, alternative UCITS funds must offer redemptions at least twice per month. In fact, over three-quarters of al-ternative UCITS funds offer daily liquidity, while most of the rest offer liquidity on a weekly basis; less than 1% of these funds offer redemptions every two weeks only.1
Transparency: reporting standardsTransparency is one of the most impor-tant means of protecting investors under UCITS rules. There are clear guidelines on reporting, performance reporting and the way in which investment objectives, the investment process and investment risks are communicated.
Risk management: processes ap-proved by the regulatorAlternative UCITS funds have to meet specific requirements concerning risk management, counterparty risk, and risk reporting.
Examining the claimsThe structural benefits of alternative UCITS funds are obvious. Yet UCITS funds continue to come under fire from critics on the basis of various claims made about them. As it is important to separate fact from fiction, we look below at the four most commonly made claims and seek to address them.
Claim: Fees are often higher than for offshore hedge funds Given the regulatory burden and other rules – such as regular reporting require-ments, risk management calculations, col-lateralization of swaps, and platform fees
– it seems logical to assume that alterna-tive UCITS funds have to charge higher average fees than offshore hedge funds. However, given investors' sensitivity to fees, fund managers often try to align the costs charged by alternative UCITS funds with those charged by the corresponding offshore funds. This is usually done by foregoing some management fees or by placing a ceiling on total costs. As a re-sult, it seems that the difference in fees between alternative UCITS funds and off-shore funds is minimal.
Claim: UCITS funds underperform offshore hedge fundsIt is often claimed UCITS funds are strait-jacketed, while offshore hedge funds en-joy much greater flexibility. It is true that UCITS rules (such as those regarding leverage, eligible instruments, liquidity, and diversification) can curtail some in-vestment strategies; however, there are
Alternative Investments
140
130
120
110
100
90
80
70
60
UCITS-compliant fund Offshore fund
4%
3%
2%
1%
0%
-1%
-2%
-3%Apr 10 Oct 10 Oct 11 Oct 12Apr 11 Apr 12
Figure 1: Equity long/short fund performance
Source: Credit Suisse, data on monthly basis, as at January 2013.Historical performance indications and financial market scenarios are no guarantee of current or future performance.
1 Source: Alixcapital.com.
| 23/28
Trends Summer 13
Alternative Investments
hedge fund strategies that fit well into the UCITS framework, such as equity long/short – typically a liquid strategy that works well with low leverage. Figure 1 shows the performance of a UCITS fund and an off-shore fund, both following the same eq-uity long/short investment strategy. It can be seen that performance is similar for both funds.
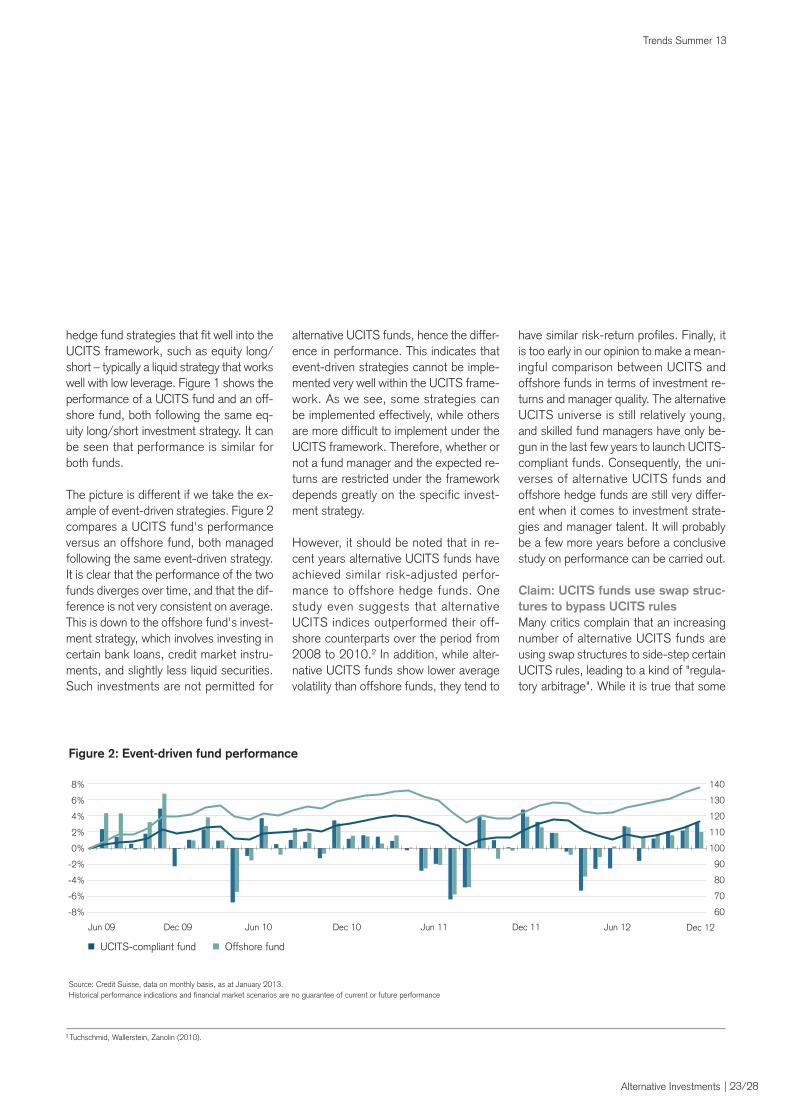
The picture is different if we take the ex-ample of event-driven strategies. Figure 2 compares a UCITS fund's performance versus an offshore fund, both managed following the same event-driven strategy. It is clear that the performance of the two funds diverges over time, and that the dif-ference is not very consistent on average. This is down to the offshore fund's invest-ment strategy, which involves investing in certain bank loans, credit market instru-ments, and slightly less liquid securities. Such investments are not permitted for
alternative UCITS funds, hence the differ-ence in performance. This indicates that event-driven strategies cannot be imple-mented very well within the UCITS frame-work. As we see, some strategies can be implemented effectively, while others are more difficult to implement under the UCITS framework. Therefore, whether or not a fund manager and the expected re-turns are restricted under the framework depends greatly on the specific invest-ment strategy.
However, it should be noted that in re-cent years alternative UCITS funds have achieved similar risk-adjusted perfor-mance to offshore hedge funds. One study even suggests that alternative UCITS indices outperformed their off-shore counterparts over the period from 2008 to 2010.2 In addition, while alter-native UCITS funds show lower average volatility than offshore funds, they tend to
have similar risk-return profiles. Finally, it is too early in our opinion to make a mean-ingful comparison between UCITS and offshore funds in terms of investment re-turns and manager quality. The alternative UCITS universe is still relatively young, and skilled fund managers have only be-gun in the last few years to launch UCITS-compliant funds. Consequently, the uni-verses of alternative UCITS funds and offshore hedge funds are still very differ-ent when it comes to investment strate-gies and manager talent. It will probably be a few more years before a conclusive study on performance can be carried out.
Claim: UCITS funds use swap struc-tures to bypass UCITS rulesMany critics complain that an increasing number of alternative UCITS funds are using swap structures to side-step certain UCITS rules, leading to a kind of "regula-tory arbitrage". While it is true that some
UCITS-compliant fund Offshore fund
Jun 09 Jun 10 Jun 11 Jun 12Dec 11 Dec 12Dec 09 Dec 10
8%
6%
4%
2%
0%
-2%
-4%
-6%
-8%
140
130
120
110
100
90
80
70
60
Figure 2: Event-driven fund performance
Source: Credit Suisse, data on monthly basis, as at January 2013.Historical performance indications and financial market scenarios are no guarantee of current or future performance
2 Tuchschmid, Wallerstein, Zanolin (2010).

24/28 |
Trends Summer 13
Alternative Investments
funds use index derivatives, this does not necessarily mean that they are breaking any rules. One frequently cited example is commodities exposure. According to UCITS rules, funds may not invest di-
rectly in commodities. Yet many funds own commodities via index swaps, which may seem at odds with UCITS rules, or at least their spirit. This is not necessarily the case, however, as long as the indices
meet all UCITS requirements regarding liquidity and diversification, and the swap is collateralized. It should also be noted that dealing in physical commodities is quite different, as there are various idio-syncrasies to be dealt with, such as stor-age, insurance, transport and potential damage. Operational issues of this kind make physical trading unsuitable for the UCITS framework. By contrast, an index product that offers daily dealing and is fully collateralized would seem to fit with UCITS regulations and should therefore be treated differently from physical com-modity exposure.
Of course, this does not mean that swap structures are always unproblematic. There may be objections in particular where managers use these structures to swap the returns of a non-UCITS-com-pliant vehicle into a UCITS fund. This practice is often criticized, and the regu-lators are currently looking into the issue to make sure that the spirit of the rules is not being breached.3,4
Claim: UCITS funds do not require due diligenceInvestors often assume that no due dili-gence into managers is required when se-lecting alternative UCITS funds, as they are regulated and liquid. However, we would argue that the particular set-up of
3 See also: http://www.ft.com/cms/s/0/e0d0e01e-0b84-11e1-9a61-00144feabdc0.html#axzz2HmuPQeSz.4 See also: http://www.esma.europa.eu/page/Investment-management-0.

| 25/28
Trends Summer 13
Alternative Investments
alternative UCITS funds requires a similar level of due diligence as when investing in offshore hedge funds, particularly on the operational side.As an increasing number of UCITS-com-pliant hedge funds are being launched in an ever greater variety of strategies, it is important to conduct detailed due dili-gence. This is to ensure a proper under-standing of potential asset/liability mis-matches, counterparty risks, costs and the feasibility of investment strategies within the UCITS framework, to name but a few points. Swap-based structures also need to be reviewed with regard to coun-terparty risks, collateral management, and the liquidity of underlyings.
ConclusionIn the current low interest-rate environ-ment, we believe that UCITS funds rep-resent an attractive means of investing in alternative investment strategies. They are able to offer risk-return profiles similar to those of offshore hedge funds, but on a regulated, liquid and transparent basis. However, some strategies are not easily implementable within the UCITS frame-work. We therefore believe that thorough due diligence and careful manager se-lection are crucial given the dispersion of returns and heterogeneity of the invest-ment universe.

26/28 |
Trends Summer 13
Contacts
German-speaking Switzerland
Institutional ClientsStefan Gregor MeiliGiesshübelstrasse 30P.O. Box 800CH-8070 ZurichTel: +41 44 335 77 [email protected]
Sandro GschwendSt. Leonhardstrasse 3P.O. Box 564CH-9001 St. GallenTel: +41 71 226 36 [email protected] Daniel AmmonBundesplatz 2P.O. Box 5366CH-3011 BernTel: +41 31 358 54 [email protected] Hans StirnimannSchwanenplatz 8P.O. Box 2548CH-6002 LucerneTel: +41 41 419 15 [email protected] André WinklerSt. Alban-Graben 1–3P.O. Box 2553CH-4002 BaselTel: +41 61 266 73 [email protected]
Wholesale DistributionReto EisenhutSihlcity – Kalanderplatz 1CH-8070 ZurichTel: +41 44 333 29 [email protected]
French-speaking Switzerland
Institutional ClientsJean-Raymond WehrliRue de Lausanne 11–19CH-1201 GenevaTel: +41 22 392 21 [email protected]
Christian WaserP.O. Box 5705CH-1002 LausanneTel: +41 21 340 26 [email protected]
Wholesale DistributionMarkus StecherRue de Lausanne 11–19CH-1201 GenevaTel: +41 22 392 22 [email protected]
Ticino
Institutional ClientsAntonio MantarroVia G. Vegezzi 1P.O. Box 5900CH-6901 LuganoTel: +41 91 802 59 [email protected]
Wholesale DistributionMarkus StecherRue de Lausanne 11–19CH-1201 GenevaTel: +41 22 392 22 [email protected]

Trends Summer 13
Trends is a Credit Suisse Asset Management publication and containsinformation for professional investors.
Internethttps://www.credit-suisse.com/ch/ asset_management/en/ thought_leadership/index.jsp
Produced byMarketing Asset Management Core Investments
Responsible for this publicationPatrick Ide
EditorFranziska Liebich
Publication frequencyFive times a year
CirculationGerman 4,500English 700French 700Italian 1,000
OrderTo receive this publication free ofcharge, please contact your personal client advisor.
Data sourceCredit Suisse, unless otherwise specified
This material has been prepared by the Private Banking & Wealth Management division of Credit Su-isse (“Credit Suisse”) and not by Credit Suisse’s Research Department. It is not investment research or a research recommendation for regulatory purposes as it does not constitute substantive research or analysis. This material is provided for informational and illustrative purposes and is intended for your use only. It does not constitute an invitation or an offer to the public to subscribe for or purchase any of the products or services mentioned. The information contained in this document has been provided as a general market commentary only and does not constitute any form of regulated finan-cial advice, legal, tax or other regulated financial service. It does not take into account the financial objectives, situation or needs of any persons, which are necessary considerations before making any investment decision. The information provided is not intended to provide a sufficient basis on which to make an investment decision and is not a personal recommendation or investment advice. It is intended only to provide observations and views of the said individual Asset Management personnel at the date of writing, regardless of the date on which the reader may receive or access the informa-tion. Observations and views of the individual Asset Management personnel may be different from, or inconsistent with, the observations and views of Credit Suisse analysts or other Credit Suisse Asset Management personnel, or the proprietary positions of Credit Suisse, and may change at any time without notice and with no obligation to update. To the extent that these materials contain statements about future performance, such statements are forward looking and subject to a number of risks and uncertainties. Information and opinions presented in this material have been obtained or derived from sources which in the opinion of Credit Suisse are reliable, but Credit Suisse makes no representation as to their accuracy or completeness. Credit Suisse accepts no liability for loss arising from the use of this material. Unless indicated to the contrary, all figures are unaudited. All valua-tions mentioned herein are subject to Credit Suisse valuation policies and procedures. It should be noted that historical returns and financial market scenarios are no guarantee of future performance.Every investment involves risk and in volatile or uncertain market conditions significant fluctuations in the value or return on that investment may occur. Investments in foreign securities or currencies involve additional risk as the foreign security or currency might lose value against the investor’s reference currency. Alternative investments products and investment strategies (e.g. Hedge Funds or Private Equity) may be complex and may carry a higher degree of risk. Such risks can arise from extensive use of short sales, derivatives and leverage. Furthermore, the minimum investment periods for such investments may be longer than traditional investment products. Alternative investment strategies (e.g. Hedge Funds) are intended only for investors who understand and accept the risks associated with investments in such products.This material is not directed to, or intended for distribution to or use by, any person or entity who is a citizen or resident of, or is located in, any jurisdiction where such distribution, publication, availability or use would be contrary to applicable law or regulation, or which would subject Credit Suisse and/or its subsidiaries or affiliates to any registration or licensing requirement within such jurisdiction. Materials have been furnished to the recipient and should not be re-distributed without the express written consent of Credit Suisse.When this document is distributed or accessed from the EEA, it is distributed by Credit Suisse Asset Management Limited which is authorized and regulated by the Financial Services Authority (UK). When this document is distributed in or accessed from Switzerland, it is distributed by Credit Suisse AG and/or its affiliates. For further information, please contact your Relationship Manager.When this document is distributed or accessed from Brazil, it is distributed by Banco de Investimen-tos Credit Suisse (Brasil) S.A. and/or its affiliates. When this document is distributed or accessed from Australia, it is issued by CREDIT SUISSE INVESTMENT SERVICES (AUSTRALIA) LIMITED ABN 26 144 592 183 AFSL 370450.
Copyright © 2013. CREDIT SUISSE GROUP AG and/or its affiliates. All rights reserved.
Publishing details
| 27/28
Trends Summer 13

CH
/G/2
013/
06 3
3511
324
CREDIT SUISSE AGMarketing Asset Management Core InvestmentsP.O. BoxCH-8070 Zurich
www.credit-suisse.com