Embed Size (px)
Citation preview

MAHARASHTRA STATE BOARD OF TECHNICAL EDUCATION
(Autonomous)
(ISO/IEC - 27001 - 2005 Certified)
MODEL ANSWER
SUMMER - 2017 EXAMINATION
Subject: Power System Operation & Control Subject Code:
Page 1/ 35
17643
Important Instructions to examiners:
1) The answers should be examined by key words and not as word-to-word as given in the model
answer scheme.
2) The model answer and the answer written by candidate may vary but the examiner may tryto
assess the understanding level of the candidate.
3) The language errors such as grammatical, spelling errors should not be given more Importance
(Not applicable for subject English and Communication Skills).
4) While assessing figures, examiner may give credit for principal components indicated in the
figure. The figures drawn by candidate and model answer may vary. The examiner may give
credit for any equivalent figure drawn.
5) Credits may be given step wise for numerical problems. In some cases, the assumed constant
values may vary and there may be some difference in the candidate‟s answers and model
answer.
6) In case of some questions credit may be given by judgement on part of examiner of relevant
answer based on candidate‟s understanding.
7) For programming language papers, credit may be given to any other program based on
equivalent concept.
Q.
No
.
Sub
Q.N.
Answer Marking
Scheme
1. (A)
(a)
Ans.
Attempt any THREE:
State the difference between ‘Generator bus’ and ‘slack bus’.
Sr.
No
Generator Bus Slack Bus
1. At this bus power
generated is injected into
the system
Oneof the generator bus is
made to take additional
real and reactive power to
supply transmission losses.
This bus is known as slack
or swing bus.
2. Specified quantities in
this bus is P & V.
Specified quantities in this bus
is V &.
3. Unknown quantities in
this bus- Q &.
Unknown quantities in this
bus- P & Q.
4. It is not a reference bus. It is a reference bus.
5. This bus does not
provides additional real
& reactive power losses
This bus provides additional
real & reactive power losses
12
4M
Any 4
point
1M for
each

MAHARASHTRA STATE BOARD OF TECHNICAL EDUCATION
(Autonomous)
(ISO/IEC - 27001 - 2005 Certified)
MODEL ANSWER
SUMMER - 2017 EXAMINATION
Subject: Power System Operation & Control Subject Code:
Page 2/ 35
17643
(b)
Ans.
State the concept of reactive power compensation. Name any two
reactive power compensating equipments.
concept of reactive power compensation: The main objective of the
utilities is to satisfy the consumers with its power demand. To meet
the consumer‟s reactive power demands, if the same power is
generated at generating stations & feed to the consumer, it will cause
voltage drop in line. This will result into reduction of transmission
efficiency and the cost of power transmission increases. Instead of
this is we generate power locally near the load centers& feed it to
consumers to his satisfaction the performance of power system will
not affect & cost of power transmission also will not increase.
Reactive power generating equipments are located near the load
centers which will help to meet the reactive power demand of
consumers to his satisfaction. These also help to control the voltage
levels in the system. The methods used for this is also called as
“Reactive Power Compensation “. And the equipment used is called
as “reactive power compensating equipment”. Reactive power
compensating equipment can be employed either at load level,
substation level, or at transmission level.
Reactive power compensating equipments:-
1. Shunt compensation equipment‟s - Shunt reactor, shunt
capacitor
2. static VAR system
3. Series compensation equipments - Series reactors
4. Synchronous compensation equipments - Synchronous
condenser
4M
2M for
concept
2M for
equipme
nts (any
2)
(c)
Ans.
Define the following terms.
- Power system stability.
- Power system instability.
- Power system stability limit.
Power System Stability: It is the ability of power system to return to normal or stable
operation after having been subjected to some form of disturbance.
4M
Power
system
stability
1M

MAHARASHTRA STATE BOARD OF TECHNICAL EDUCATION
(Autonomous)
(ISO/IEC - 27001 - 2005 Certified)
MODEL ANSWER
SUMMER - 2017 EXAMINATION
Subject: Power System Operation & Control Subject Code:
Page 3/ 35
17643
Power System instability: It is status of system when it loses its
normal stable operating condition because of sudden increase/
decrease in power demand or due to occurrence of major fault.
Power system stability limit:
The maximum feasible power flow through some point in the power
system. When the entire system or port thereof under investigation is
operating with stability.
Power
system
instabili
ty &
Stability
limi 1½
M each
(d)
Ans. State the adverse effects of instability on power system.
Due to instability of power system following effects can be observed:
1) As the Pd>>Pg, frequency of system varies over a wider range/
beyond the limits. Hence protective scheme of generators,
transformersmaytrip them.
2) Due to fluctuation of V, F, P, Q performance of grid network
reduces and power transmission capacity reduces and so consumers
receive poor quality of supply.
3) If the system parameters are not controlled, than one by one
generator will trip off and it leads major failure sometimes leads to
collapsing of whole system.
4) As consumer receives poor quality supply the performance of their
machines reduces, production rate decreases, quality of product
reduces and overall there is financial loss.
4M
Each
effect
1M
1. (B)
(a)
Ans.
Attempt any ONE:
State the importance of load flow analysis in operation of power
system.
Following are the reasons that shows importance of load flow
analysis in operation of power system:
1) The total amount of real power flow thro‟ the network generates at
generating stations whose size and location are fixed.
2) At each moment power generation must be equal to power demand
as electrical power cannot be stored.
3) Hence the load on the system has to be divided between no. of
generators in a unique ratio in order to achieve optimum economic
power generation.
4) Hence the generator output must be closely maintained at
06
6M
1M each
point

MAHARASHTRA STATE BOARD OF TECHNICAL EDUCATION
(Autonomous)
(ISO/IEC - 27001 - 2005 Certified)
MODEL ANSWER
SUMMER - 2017 EXAMINATION
Subject: Power System Operation & Control Subject Code:
Page 4/ 35
17643
predetermined set closely maintained at predetermined set points.
5) It is important to remember that the power demand under goes
slow but wide variation throughout the 24 hrs. of the day.
6) Therefore we must change these set points slowly or continuously
or in discrete step as the hours wear on. This means that load flow
configuration that fits the demand of a certain hr. of the day may
look quite different next hour.
(b)
Ans. List out the significant features of Ybus matrix.
Features of Ybus:
1) Ybusis a symmetrical matrix “n x n” matrix.
2) All diagonal elements Yii represent “self-admittances‟ of bus “I”.
3) All off diagonal elements Yij represents mutual admittance
between bus “I” bus “j”.
4) With reference to mutual admittance
Yij= Yjii.e. Y12 = Y21, Y13 = Y31
Hence it is a symmetricalmatrix.
5) Any element in the matrix “zero‟ indicates that there is not to line
between those buses.
Y21 = Y12 = 0 ………… No tr. line between bus I bus II or outage
of tr. Line
Yik = Yki = 0 if i k between but I bus II i k are not connected.
6) Ybus = (Zbus)-1
whereZbus– bus impedance matrix.
7) All elements are complex numbers.
8) Self admittances are defined as Y11 = y 11 + y 12+ y 13
Where y11 – line changing admittance
y12, y13 – line admittances
Y11 = sum of line changing admittance and total line admittances
connected to a bus.
9) Mutual admittances are defined as
Y12 = -y 12 = -y 21 = Y21 and Y13 = -y 13 = Y31
i.e. mutualadmittance is negative of line admittance between two
buses.
10) All mutual admittances are negative complex numbers.
6M
Any 6
1M each
2.
(a)
Ans.
Attempt any FOUR:
Why power utilities maintain the fluctuation in frequency within
the tolerance limit? Power utilities maintain the fluctuation in frequency within the
tolerance limit because:
1. In thermal power station steam turbines are especially designed to operate
16
4M

MAHARASHTRA STATE BOARD OF TECHNICAL EDUCATION
(Autonomous)
(ISO/IEC - 27001 - 2005 Certified)
MODEL ANSWER
SUMMER - 2017 EXAMINATION
Subject: Power System Operation & Control Subject Code:
Page 5/ 35
17643
at a very precise speed for required efficiency. The velocity of the
expanding steam is beyond our control. Hence variation in frequency
results in reduction in life of the turbine and generator.
2. In hydro power stations a turbo rotor with its many large turbine blades
consists a mechanical system of many natural frequencies. These
frequencies are quite un-damped and at various speeds they are subjected
to resonance. Hence it is very important that under load condition rotor
should never drift into such a speed range where dangerous amplitudes of
blades are build up. Hydro turbines are not supposed to subject to this
dangerous condition.
3. The overall operation of power system can be much better controlled if
the frequency error is kept within strict limits. By reducing normal
frequency fluctuations to a faint ripple, fault can be detected at early
stage. Hence in modern power system the frequency variation is normally
kept within + 0.05 Hz
4. Power systems are interconnected through H.V. line to meet increase in
demand. Hence to regulate the power flow through these lines, need
accurate constant frequency.
5. The operation of a transformer below the rated frequency is not desirable.
When frequency goes below rated frequency at constant system voltage
then the flux in the core increases and then the transformer core goes into
the saturation region.
6. With reduced frequency the blast by ID fans and FD fans decrease, and so
the generation decreases and thus it becomes a multiplying effect and may
result in shut down of the plant.
Any 4
point
1M each
(b)
Ans.
Derive the relation between real power and frequency
considering a simple two bus system.
Consider a simple two bus system in which power is transmitted from
bus 1 to bus 2 through a short transmission line.
Let 𝑉11be the voltage at bus 1,
𝑉22 be the voltage at bus 2
Z be the total series impedance of the transmission line per phase =
R+jX
4M
Diagra
m 1M
Explana
tion 3M
MAHARASHTRA STATE BOARD OF TECHNICAL EDUCATION
(Autonomous)
(ISO/IEC - 27001 - 2005 Certified)
MODEL ANSWER
SUMMER - 2017 EXAMINATION
Subject: Power System Operation & Control Subject Code:
Page 6/ 35
17643
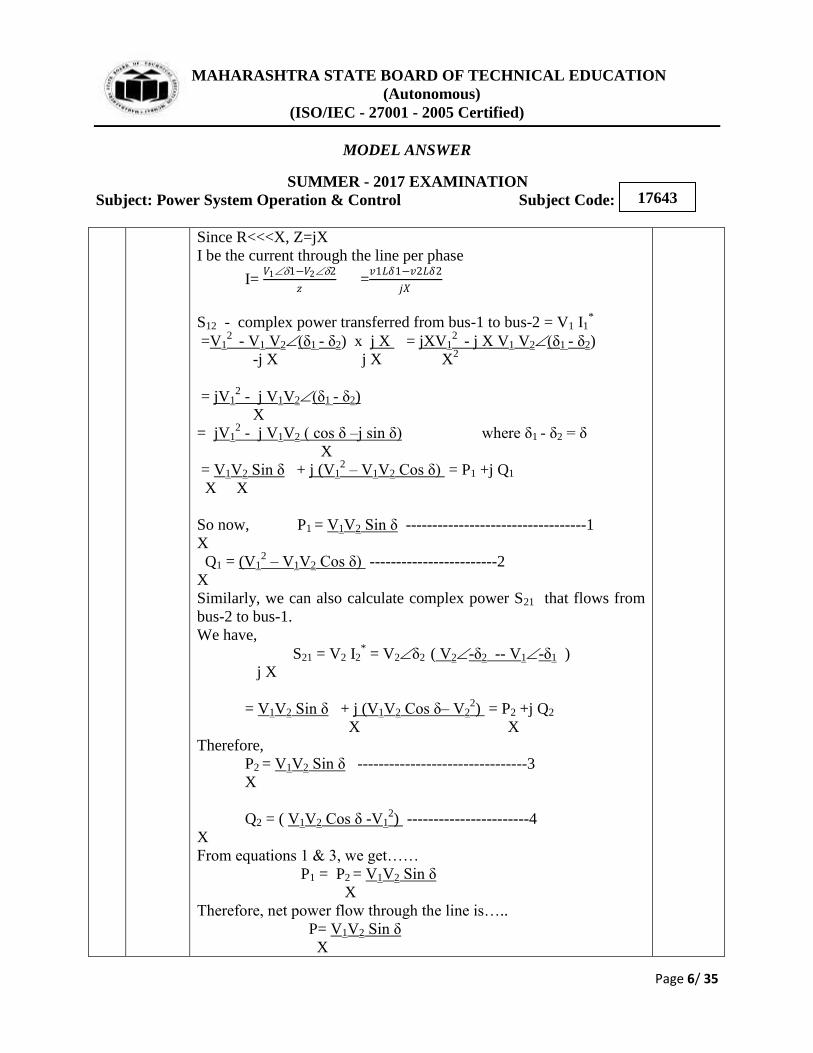
Since R<<<X, Z=jX
I be the current through the line per phase
I= 𝑉11−𝑉22
𝑧 =
𝑣1𝐿𝛿1−𝑣2𝐿𝛿2
𝑗𝑋
S12 - complex power transferred from bus-1 to bus-2 = V1 I1*
=V12
- V1 V2(δ1 - δ2) x j X = jXV12
- j X V1 V2(δ1 - δ2)
-j X j X X2
= jV12 - j V1V2(δ1 - δ2)
X
= jV12 - j V1V2 ( cos δ –j sin δ) where δ1 - δ2 = δ
X
= V1V2 Sin δ + j (V12 – V1V2 Cos δ) = P1 +j Q1
X X
So now, P1 = V1V2 Sin δ ----------------------------------1
X
Q1 = (V12 – V1V2 Cos δ) ------------------------2
X
Similarly, we can also calculate complex power S21 that flows from
bus-2 to bus-1.
We have,
S21 = V2 I2* = V2δ2 ( V2-δ2 -- V1-δ1 )
j X
= V1V2 Sin δ + j (V1V2 Cos δ– V22) = P2 +j Q2
X X
Therefore,
P2 = V1V2 Sin δ --------------------------------3
X
Q2 = ( V1V2 Cos δ -V12) -----------------------4
X
From equations 1 & 3, we get……
P1 = P2 = V1V2 Sin δ
X
Therefore, net power flow through the line is…..
P= V1V2 Sin δ
X

MAHARASHTRA STATE BOARD OF TECHNICAL EDUCATION
(Autonomous)
(ISO/IEC - 27001 - 2005 Certified)
MODEL ANSWER
SUMMER - 2017 EXAMINATION
Subject: Power System Operation & Control Subject Code:
Page 7/ 35
17643
For given system X is constant. If voltages at both ends of the line are
maintained constant i.e. V1& V2 remains same.
Then, 𝑃 ∝ 𝑆𝑖𝑛𝑒𝛿 ……………Where δ = ωt=2∏ƒt
𝛿 ∝ 𝑡 This shows that variation in real power flow results in variation of
supply frequency. P is maximum when Sin δ = 1
P = Pmax when δ = 900
But to operate the power system under stability condition the value δ
is maintained between 350 to 45
0.
(c)
Ans.
State the data required for load flow, analysis about-
Transformer, Triline, Generator and Bus.
1. Transformer data: Type of transformer such as distribution
transformer / power transformer, auto-transformer, tap-changing
transformer (on-line or off-line).
Also ratings, % impedance and tap setting points, tap setting on HV
/LV /both sides are required. Resistance of the transformer,
reactance of the transformer, and the off nominal turns-ratio.
provision for tapping‟s
For every transformer connected between buses iandk the data to
be given includes: the starting bus number i, ending bus number k,
2. Transmission line data: For every transmission line connected
between buses I and k the data includes the starting bus number i,
ending bus number k,
- Line parameters – .resistance of the line, reactance of the line
and the half line charging admittance. Series impedance (z) in
per unit, shunt admittance (Y) in per units,
- Thermal limits of the line.
- Length of the line. SG1=PG1 + j QG1
- Identification of each line and its „∏‟ equivalent circuit.
3. Generator data: No. of generating stations connected in the
systemready to generate the required amount of power and their
time duration should be available. Each generators rating,
maximum& minimum limits of generation, their characteristics, and
excitation control details are made available.
4.Bus data: Depending upon no. of buses in the system, bus data
4M
1M for
each
point

MAHARASHTRA STATE BOARD OF TECHNICAL EDUCATION
(Autonomous)
(ISO/IEC - 27001 - 2005 Certified)
MODEL ANSWER
SUMMER - 2017 EXAMINATION
Subject: Power System Operation & Control Subject Code:
Page 8/ 35
17643
should be made available.
Type of bus Bus data No. of
buses
For each Bus
Generator bus P, (V) P, Vi, , minimum
and maximum
reactive power
limit (Qi,min,
Qi,max).
Load bus P, Q Active power
demand PDi, and
the reactive power
demand QDi.
Slack bus V, δ Generator ratings
which is assume to
be connected to
slack bus
Voltage
control bus
P Q V Voltage control
equipment used
and its rating, max.
& min. limits
(d)
Ans. Write general form of SLFE considering two-bus system.
For a two bus power system , Load flow equations can be written
as……
𝑉1𝛿1 be the voltage at bus 1, 𝑉2𝛿2 be the voltage at bus 2
Y11– self admittance of bus-1 Y22– self admittance of bus-2
Y12 = Y21– mutual admittance between bus-1&bus-2
Then real power at bus -1…
P1 = PG1 – PD1= V1 2
Y11 Cos α11 +Y12 V2 V1 Cos ( δ2 –δ1 + α12)
Reactive power at bus -1…
Q1 = QG1 – QD1= – [ V1 2 Y11 Sin α11 +Y12 V2 V1 Sin ( δ2 –δ1 +
α12)] Real power at bus -2…
P2 = PG2 – PD2 = Y21 V2 V1 Cos ( δ1 –δ2 + α21)+V2 2 Y22 Cos
α22 Reactive power at bus -2….
Q2 =QG2 – QD2 = – [ Y21 V2 V1 Sin ( δ1 –δ2 + α21)+V2 2 Y22 Sin
α22]
1M for
each
equatio
n

MAHARASHTRA STATE BOARD OF TECHNICAL EDUCATION
(Autonomous)
(ISO/IEC - 27001 - 2005 Certified)
MODEL ANSWER
SUMMER - 2017 EXAMINATION
Subject: Power System Operation & Control Subject Code:
Page 9/ 35
17643
OR
Consider a power system having „n‟ no. of buses,
and𝑉1𝛿1 ,𝑉2𝛿2 ,𝑉3𝛿3 ,…..………….𝑉𝐾𝛿𝐾……….𝑉𝑛𝛿𝑛 are the bus
voltages.
Let Y11α11, Y22α22,Y33α33,……….Ykkαkk……….Ynnαnn are self-
admittances of bus1,2,3….k….n resply.
Let Y12α12, Y13α13,Y14α14,……….Y1kα1k……….Y1nα1n are mutual
admittances of bus-1 with bus,2,3….k….n resply.
Similarly…
Y21α21, Y23α23,Y24α24,……….Y2kα2k……….Y2nα2n are mutual
admittances of bus-2 with bus,1 ,3….k….n resply.
And similarly for all buses.
Now SLFE can be written as…….
Power at 1st bus can be written as….
P1 = V1 2 Y11 Cos α11 +Y12 V2 V1 Cos (δ2 –δ1 + α12) + Y13 V3V1 Cos (δ3 –δ1 +
α13)+ …...… ………………………...+ Y1n VnV1 Cos (δn–δ1+ α1n)
Q1 = -- [ ( V1 2
Y11 Sin α11+Y12 V2 V1 Sin (δ2 –δ1 + α12)+ Y13 V3V1 Sin
(δ3 –δ1 + α13)+……
………………..+ Y1n VnV1 Sin (δn–δ1+ α1n) ]
Power at k th
bus can be written as….
Pk= Yk1 V1VkCos (δ1 –δk+αk1)+Yk2 V2 VkCos (δ2 –δk+αk2) + Yk3 V3Vk
Cos (δ3 –δk+αk3) +…….+ Vk2
YkkCosαkk+……… …………………+
YknVnVk Cos (δn–δk +αkn)
Qk= --{ Yk1 V1VkSin (δ1 –δk+αk1)+Yk2 V2 VkSin (δ2 –δk+αk2) + Yk3
V3VkSin (δ3 –δk+αk3) +…….+ Vk2
YkkSinαkk+………
…………………+ YknVnVkSin (δn–δk +αkn)}
(e)
Ans.
State and explain Bus-loading and Line-flow equations refer to
power system.
Bus Loading:
The real of reactive power at any kth
bus can be written as
Sk = Pk – jQk = Ik
4M
MAHARASHTRA STATE BOARD OF TECHNICAL EDUCATION
(Autonomous)
(ISO/IEC - 27001 - 2005 Certified)
MODEL ANSWER
SUMMER - 2017 EXAMINATION
Subject: Power System Operation & Control Subject Code:
Page 10/ 35
17643
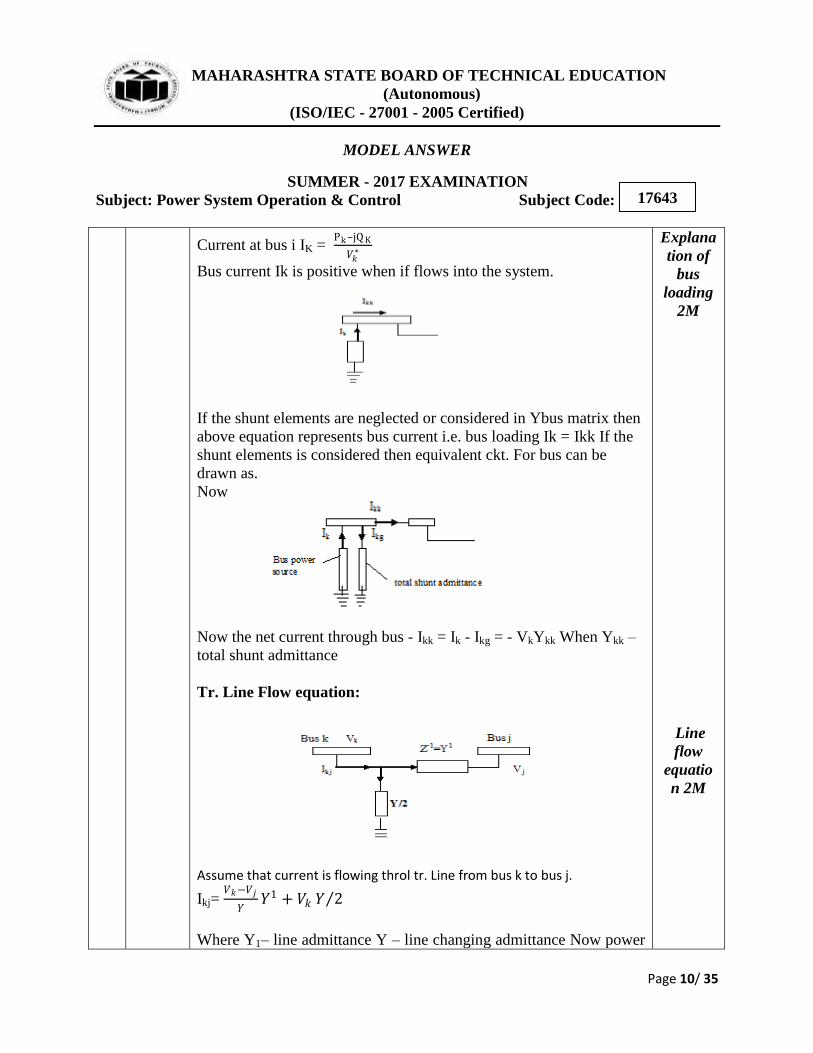
Current at bus i IK = Pk–jQ K
𝑉𝑘∗
Bus current Ik is positive when if flows into the system.
If the shunt elements are neglected or considered in Ybus matrix then
above equation represents bus current i.e. bus loading Ik = Ikk If the
shunt elements is considered then equivalent ckt. For bus can be
drawn as.
Now
Now the net current through bus - Ikk = Ik - Ikg = - VkYkk When Ykk –
total shunt admittance
Tr. Line Flow equation:
Assume that current is flowing throl tr. Line from bus k to bus j.
Ikj= 𝑉𝑘−𝑉𝑗
𝑌𝑌1 + 𝑉𝑘 𝑌 2
Where Y1– line admittance Y – line changing admittance Now power
Explana
tion of
bus
loading
2M
Line
flow
equatio
n 2M

MAHARASHTRA STATE BOARD OF TECHNICAL EDUCATION
(Autonomous)
(ISO/IEC - 27001 - 2005 Certified)
MODEL ANSWER
SUMMER - 2017 EXAMINATION
Subject: Power System Operation & Control Subject Code:
Page 11/ 35
17643
flow from bus k to bus j is Pkj-jQkj = Similarly power flow from bus j
to bus k is Pjk – jQjk = The above two equations are called as “Line
flow equation”. The algebraic sum of power expressed by above
equations gives power loss in the transmission line k – j
(f)
Ans.
Develop a Ybus matrix for the following 3-bus system.
4M
Each
step 1M

MAHARASHTRA STATE BOARD OF TECHNICAL EDUCATION
(Autonomous)
(ISO/IEC - 27001 - 2005 Certified)
MODEL ANSWER
SUMMER - 2017 EXAMINATION
Subject: Power System Operation & Control Subject Code:
Page 12/ 35
17643
MAHARASHTRA STATE BOARD OF TECHNICAL EDUCATION
(Autonomous)
(ISO/IEC - 27001 - 2005 Certified)
MODEL ANSWER
SUMMER - 2017 EXAMINATION
Subject: Power System Operation & Control Subject Code:
Page 13/ 35
17643
3.
(a)
Ans.
Attempt any FOUR:
State the comparison between shunt and series compensating
equipments. (any four factors).
Sr.
No
Shunt Compensating
Equipment
Series Compensating
Equipment
1. A device that is
connected in parallel
with a transmission line
is called a shunt
compensation equipment
A device that is connected in
series with the transmission line
is called a series compensation
equipment
2. the shunt compensator is
always connected at the
midpoint of transmission
system
he series compensator can be
connected at any point in the
line.
3. Shunt Reactive Power
compensation equipment
- Shunt reactor , shunt
capacitor
Series Reactive Power
compensation equipment -
Series reactors, Series
capacitors
4. shunt compensation is to
improve voltage profile.
series compensation is for
system stability.
16
4M
1M each
point
(b)
Ans. Why consumers demand constant voltage supply?
Consumer demand constant voltage supply because:
1. Due to variation in the supply voltage the current drawn by the
equipment varies.
2. When supply voltage decreases beyond the limit the current drawn
by equipment increases & efficiency decreases. As a result
performance of the equipment also reduces its life.
3. The induction motor which is commonly used as industrial drive
develops the torque which depends on supply voltage T 𝑉2.
Hence large variation in supply voltage leads to more variation in
torque developed .So far small variation in supply voltage the
performance of motor gets affected and as a result the quality of
product& the process gets affected.
4. In the lighting system the luminous output of lamp sources depends
on supply voltage. Light flux of a lamp depends on voltage, with
the voltage fluctuation light flux varies strongly As supply voltage
decreases the luminous output of lamp decreases with more
fluctuation in supply voltage reduces life of lamp also reduces.
4M
Any 4
point
1M each

MAHARASHTRA STATE BOARD OF TECHNICAL EDUCATION
(Autonomous)
(ISO/IEC - 27001 - 2005 Certified)
MODEL ANSWER
SUMMER - 2017 EXAMINATION
Subject: Power System Operation & Control Subject Code:
Page 14/ 35
17643
5.Nowadays the more sophisticated equipment are used e.g
computers which are very much sensitive towards supply
parameters. Fluctuation in supply voltages damages these
instruments permanently.
Because of above reason consumer demand constant supply.
(c)
Ans.
List out the informations that can be collected from load flow
studies.
(1) We get MW and MVAR flow in the various parts of the system
network.
(2) We get information about voltages at various buses in the system.
(3) We get information about optional load distribution.
(4) Impact of any change in generation (increase or decrease) on the
system.
(5) Influence of any modification or extension of the existing circuits
on the system loading.
(6) It also gives information for choice of appropriate rating and tap-
setting of the power transformer in the system.
(7) Influence of any change in conductor size and system voltage
level on power flow.
4M
Any
four
points
1M each
(d)
Ans. State the significance of Ybus matrix in loud flow studies.
Significance of Ybus matrix in load flow studies:
1. Y bus is a nodal matrix , is called as a nn matrix which describes
power system network which having n number of buses .
2. Admittance matrix is use to analyze data which is use in power
flow study.
3. Y bus matrix explain admittance & topology of network.
4. Outage of line or outage of generator can be easily indicated
through Y bus matrix in load flow analysis.
5. The off diagonal elements of matrix indicate mutual admittance i.e
the transmission line admittance between 2 bus.
6. All diagonal element indicate the sum of line charging admittance
& transmission line admittance. It is also called as self admittance
of bus.
4M
Any 4
Points
1M for
each
(e)
Ans.
When we can say that the power system is in ‘transient stability
condition’ or in steady state stability condition?
Transient state stability condition:
1.Transient state stability is the ability of the system to return to its
normal operating condition of same equilibrium or new equilibrium
position after experience sudden and large disturbance in the network.
4M

MAHARASHTRA STATE BOARD OF TECHNICAL EDUCATION
(Autonomous)
(ISO/IEC - 27001 - 2005 Certified)
MODEL ANSWER
SUMMER - 2017 EXAMINATION
Subject: Power System Operation & Control Subject Code:
Page 15/ 35
17643
2. Large disturbance is the cause of Transient state stability. Large
disturbance means occurrence of fault, sudden increase in large
amount of load, switching operation etc.
Steady state stability condition:
1. A power system is in steady state operating condition if all the
measured or calculated physical quantities describing the operating
condition of the system can be considered as constant for purpose of
analysis.
2. Small disturbance is the cause of Steady state stability . Small
disturbance is nothing but change in setting of automatic voltage
regulator of excitation system.
Stable operation of system is obtained when >0 &<90o. But
practically it is maintained between 35o-45
o. If load angle delta falls
below 10o then system drawn into transient stability condition
2M for
each
point
(f)
Ans.
List out the factors that affects the transient stability condition of
a power system.
Following are the factors that affects the transient stability
condition of a power system:
i) Generators play a vital role in any power system. Their
characteristics have a significant impact on the stability
characteristics of the system.
ii) Under transient conditions, the transient reactance, rotor inertia
(inertia constant), excitation response and the electrical damping
provided by the generator rotor and the mechanical damping by the
prime mover determine the generator performance.
iii)From swing equation the acceleration of the rotor d2/dt
2 is
inversely proportional to the moment of inertia of the machine,
when accelerating power is constant, which means higher the
moment of inertia, the slower will be the change in rotor angle,
hence longer time for breaker operation.
iv)By reducing the switching time and also the transient reactance,
power limit can be substantially improved.
v)Voltage regulators improve stability limits subsequent to the first
swing oscillation, after the clearing of the faulty section.
vi) Excitation response
4M
Any
four
points
1M each
MAHARASHTRA STATE BOARD OF TECHNICAL EDUCATION
(Autonomous)
(ISO/IEC - 27001 - 2005 Certified)
MODEL ANSWER
SUMMER - 2017 EXAMINATION
Subject: Power System Operation & Control Subject Code:
Page 16/ 35
17643
4. (A)
(a)
Ans.
Attempt any THREE:
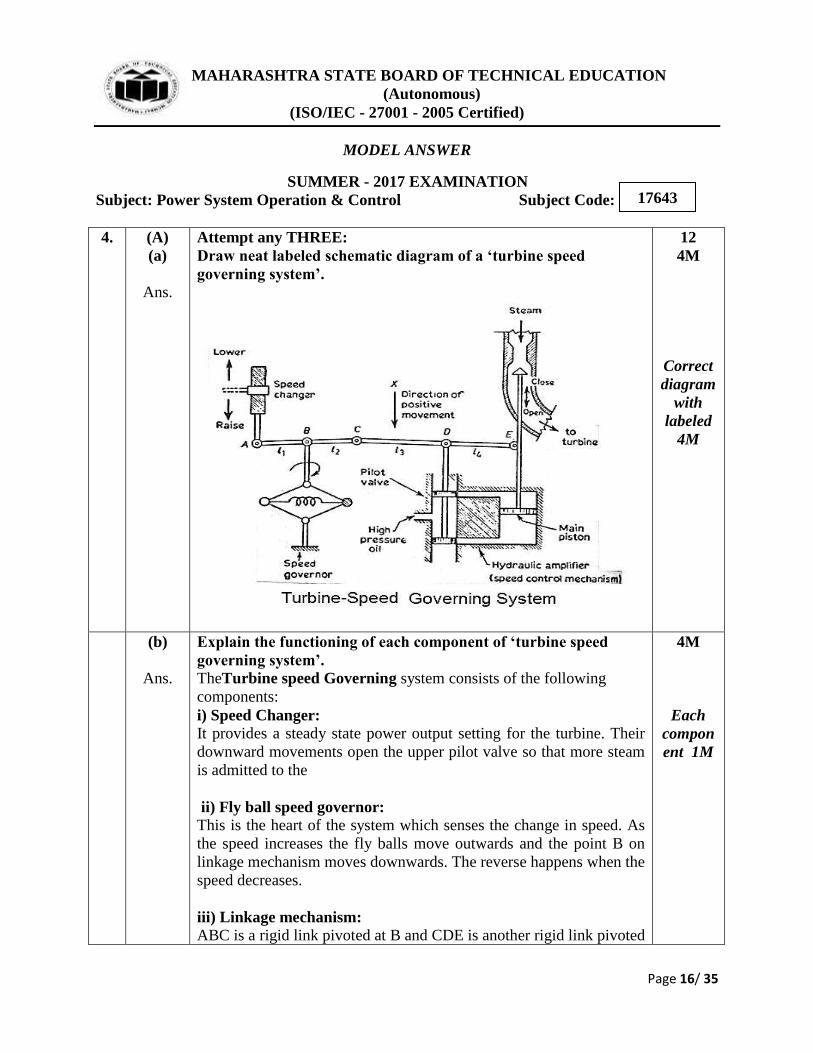
Draw neat labeled schematic diagram of a ‘turbine speed
governing system’.
12
4M
Correct
diagram
with
labeled
4M
(b)
Ans.
Explain the functioning of each component of ‘turbine speed
governing system’.
TheTurbine speed Governing system consists of the following
components:
i) Speed Changer:
It provides a steady state power output setting for the turbine. Their
downward movements open the upper pilot valve so that more steam
is admitted to the
ii) Fly ball speed governor:
This is the heart of the system which senses the change in speed. As
the speed increases the fly balls move outwards and the point B on
linkage mechanism moves downwards. The reverse happens when the
speed decreases.
iii) Linkage mechanism:
ABC is a rigid link pivoted at B and CDE is another rigid link pivoted
4M
Each
compon
ent 1M

MAHARASHTRA STATE BOARD OF TECHNICAL EDUCATION
(Autonomous)
(ISO/IEC - 27001 - 2005 Certified)
MODEL ANSWER
SUMMER - 2017 EXAMINATION
Subject: Power System Operation & Control Subject Code:
Page 17/ 35
17643
at D. This link mechanism provides a movement to control valve in
proportion to change in speed. It also provides a feedback from the
steam valve movement (link 4)
iv) Hydraulic amplifier:
It comprises a pilot valve and main piston arrangement. Low power
level pilot valve movement is converted into high power level piston
valve movement. This is necessary in order to open or close the steam
valve against high pressure steam.
Speed changer moves downward to raise the speed, fly ball of speed
governor moves outward, ABC link moves upward so that CDE link
moves downward. Now pilot piston of Hydraulic amplifier moves
downward and more oil rushes in and pushes the main piston in
downward direction. As the main piston move downward the valve
opens further and more steam in rushes to enter turbine. Now kinetic
energy increases and speed of turbine increases which will increase
the generator speed and generator output.
Whenever generator output has to decrease vise versa happens.
(c)
Ans.
Draw a neat labelled following curves and write the expressions.
- Input output curve
- Incremental fuel cost curve.
Input output curve:
𝑑𝐹
𝑑𝑃= 𝐹𝑛𝑛 Pn + fn = λ𝐧
4M
Input
output
curve
2M

MAHARASHTRA STATE BOARD OF TECHNICAL EDUCATION
(Autonomous)
(ISO/IEC - 27001 - 2005 Certified)
MODEL ANSWER
SUMMER - 2017 EXAMINATION
Subject: Power System Operation & Control Subject Code:
Page 18/ 35
17643
Incremental fuelcost curve:
𝑑𝐹
𝑑𝑃= 𝐹𝑛𝑛 Pn + fn = λ𝐧
Increme
ntal fuel
cost
curve
2M
(d)
Ans.
With reference to Indian Power system, state the types of LDCs
and their locations.
Types of LDC:
For increasing the reliability of supply, security of the system and for
increasing the stability limit of the system Load Dispatch
Centers(LDC) are located. In India Government has identified
different types of LDC depending on their locations.
National Load Dispatch Centre (NLDS)
Regional Load Dispatch Centre(RLDS)
State level Load Dispatch Centre(SLDS)
Location :
1) In India, there is one NRLDC located at Delhi.
2) In India each state has its own SLDS and in Maharashtra SLDS is
located in Nagpur.
3) In India there are four RLDS – Western, Eastern, Northern and
Southern. Western RLDS is located in Kalwa.
4)
RLDCs: There are region wise 5 RLDCS and regions are
Name of the
Region
States
included
Name of
RLDC
Located
NORTHERN
Region
Jammu and
Kashmir, Uttar
NRLDC Delhi
4M
1M
2M
1M

MAHARASHTRA STATE BOARD OF TECHNICAL EDUCATION
(Autonomous)
(ISO/IEC - 27001 - 2005 Certified)
MODEL ANSWER
SUMMER - 2017 EXAMINATION
Subject: Power System Operation & Control Subject Code:
Page 19/ 35
17643
Pradesh,
Punjab,
Hariyana
EASTERN
Region
Bengal, Bihar,
Orissa
ERLDC Kolkata
SOUTHERN
Region
Karnataka,
Goa,
Kerala,Tamiln
adu
SRLDC Banglore
WESTERN
Region
Mharastra,
Gujarat,
Madhya
Pradesh,Chatti
s gad
WRLDC Mumbai
NORTH-
EASTERN
Region
Assam, Sikim,
Nagaland
NERLDC Shillong
4. (B)
(a)
Ans.
Attempt any ONE:
State and explain any three conventional techniques used to
improve transient stability condition.
Conventional /Traditional Technique:
i) Effect of generator design.
ii) Increase of voltage level
iii) Reduction in transfer reactance
iv) Rapid fault clearing
v) Automatic reclosing of CB
Following are conventional methods adopted to improve transient
stability condition of a power system…..
i.) Effects of Generator Design:A heavy machine hasgreaterinertia
and is more stable than a light machine. Modern machines are
designed to get more power from smaller machines but this is
undesirable from the stability point of view. In earlier days a large
number of machines were employed to generate more power and this
is also not desirable from stability point of view. Salient pole
alternators operate at lower load angles and hence they are more
preferred than cylindrical rotor generates from considerations of
stability.
ii.) Increase of voltage: The amplitude of the power angle curve is
06
6M
Any 3
each 2M
MAHARASHTRA STATE BOARD OF TECHNICAL EDUCATION
(Autonomous)
(ISO/IEC - 27001 - 2005 Certified)
MODEL ANSWER
SUMMER - 2017 EXAMINATION
Subject: Power System Operation & Control Subject Code:
Page 20/ 35
17643
directly proportional to the internal voltage of the machine.An
increase in voltage increases the stability limit.
iii.) Reduction in transfer reactance: The amplitude of the power
angle curve is inversely proportional to the transfer reactance. This
reactance can be reduced by connecting more line in parallel.
iv.) When two lines are connected in paralleland a fault occurs in one
line then some power is transferred to healthy line (except when the
fault is at receiving end or sending end bus). This transmission of
power helps the stability of the system.
v.) Some features of the power system layout and business
arrangement also help in improving stability.
vi.) Use of bundled conductors helps in reducing line reactance and
improving line stability.
vii.) The compensation of line reactance by series capacitance is
another effective method of improving stability.
viii.) Rapid fault clearing: By decreasing the fault cleaning angle (by
using high speed breakers) stability can be improved.
ix.) Automatic Reclosing: Most of the fault‟s on the transmission
lines are of transient nature and are self-clearing. Modern circuit
breakers are mostly of reclosing type. When a fault occurs, the faulted
line is de-energized to suppress the are in the fault and then the
circuit breaker recloses, after a suitable time interval.
(b)
Ans.
State and explain any four planning tools used for load
forecasting in power system operation.
Types of planning tools:
i. Simulation Tools: Load flow models, sc models transient stability
models, production costing, adequacy calculations.
ii. Optimization tools: Optimum power, least cost expansion
planning, generating expansion planning
iii. The scenario techniques: Sequence of events recording, possible
outcomes, decisions, assumptions, computerize and automatic
system.
i. Stimulation Tool: This tool help stimulate the behaviour of the system under certain
load condition. This helps to calculate certain relevant indices. i .e
cost of generation , transmission & distribution. Corporate models
simulate the impact of various decision of financial performance of
utilities. It requires voluminous data and required result from various
6M
Each
tool
2M
MAHARASHTRA STATE BOARD OF TECHNICAL EDUCATION
(Autonomous)
(ISO/IEC - 27001 - 2005 Certified)
MODEL ANSWER
SUMMER - 2017 EXAMINATION
Subject: Power System Operation & Control Subject Code:
Page 21/ 35
17643
models to be integrated.
Eg: Load flow model, short circuit model, Transient stability model,
production costing, estimation of environmental impact. Results
obtained are reliable as we wouldn‟t experience major failure.
ii. Optimization Tools: This tool minimizes or maximizes adequate
values for decision variables. Eg: Optimum power, least cost
expansion planning of generation. For example, we considered the
expansion of transmission circuit and planning for electrification rural
areas. Though the cost involved is very high, still we can implement
it, because objective behind it is on higher side (Socio economic
harnessing of ground water resource food production rural
employment prevention of migration).
iii. Scenario Tool: This tool is used to known the future in quantitative fashion. In this
technique narrative description is developed which includes probable,
sequential or simultaneous recorded data. This can be built up into
case history. A decision points are always identified and possible
outcomes are investigated. The sort of decision or assumption made
by utility is noted. All these narrative descriptions are computerized
and used as past data. After certain period it is also used in
“automatic power management” as data. Electrical utilities should
prepare integrated resource plan. This long term plan must develop
the best mix of demand and supply options to meet consumers need.
5.
(a)
Ans.
Attempt any FOUR:
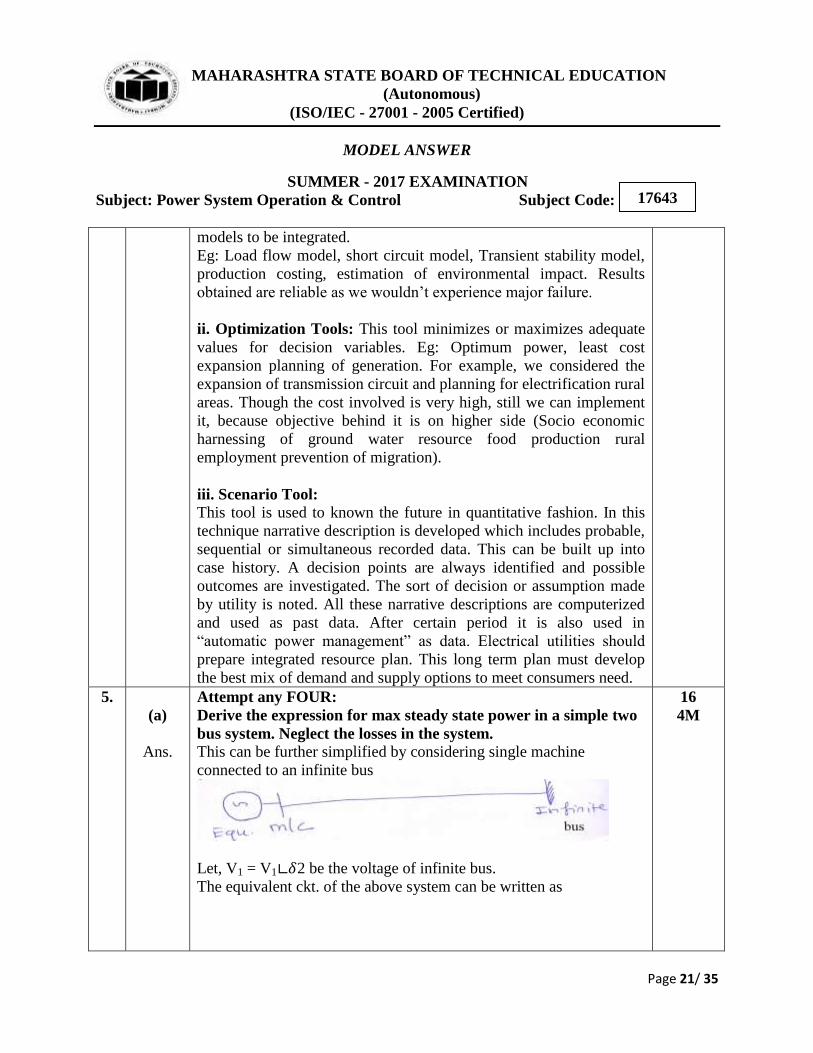
Derive the expression for max steady state power in a simple two
bus system. Neglect the losses in the system.
This can be further simplified by considering single machine
connected to an infinite bus
Let, V1 = V1∟𝛿2 be the voltage of infinite bus.
The equivalent ckt. of the above system can be written as
16
4M

MAHARASHTRA STATE BOARD OF TECHNICAL EDUCATION
(Autonomous)
(ISO/IEC - 27001 - 2005 Certified)
MODEL ANSWER
SUMMER - 2017 EXAMINATION
Subject: Power System Operation & Control Subject Code:
Page 22/ 35
17643
Let Xa * Xl are the reactance of generator & tr. Line.
Consider losses are neglible∴ R = 0.
Now the complex power injected by generator into the system is
OR
The variation of P w.r.t. 𝛿 can be represented as
1M for
Diagra
m
3M for
Explana
tion

MAHARASHTRA STATE BOARD OF TECHNICAL EDUCATION
(Autonomous)
(ISO/IEC - 27001 - 2005 Certified)
MODEL ANSWER
SUMMER - 2017 EXAMINATION
Subject: Power System Operation & Control Subject Code:
Page 23/ 35
17643
P = V1V2 sin δ
X is called “power angle equation” and curve is called
“power angle curve” or “power angle diagram”.
Consider two machine system as shown by single line diagram.

MAHARASHTRA STATE BOARD OF TECHNICAL EDUCATION
(Autonomous)
(ISO/IEC - 27001 - 2005 Certified)
MODEL ANSWER
SUMMER - 2017 EXAMINATION
Subject: Power System Operation & Control Subject Code:
Page 24/ 35
17643

MAHARASHTRA STATE BOARD OF TECHNICAL EDUCATION
(Autonomous)
(ISO/IEC - 27001 - 2005 Certified)
MODEL ANSWER
SUMMER - 2017 EXAMINATION
Subject: Power System Operation & Control Subject Code:
Page 25/ 35
17643
(b)
Ans. Write swing equation and state significance of power angle.
“swing equation” which is written as 𝑀𝑑2𝛿
𝑑𝑡= 𝑃𝑎 = 𝑃𝑚 − 𝑃𝑒 = Ta = Tm –Te
where, M = I ω- angular momentum and I- Inertia constant
Pa = Ta ω -- Accelerating Power
Pm = Tm ω -- Mechanical power input to synchronous
generator
Pe = Te ω -- Electrical Power output of synchronous generator
= Ɵ ω t in radian -- rotor angular displacement.
Significance of power angle
P =V1V2
Xsinδ
1) As varies, power flow through the system also varies though
voltage profile at each end is maintained constant.
2 ) when =90 , power flow is max . When =0 , power flow is zero
3) when > 90 , system will be unstable
4M
Equatio
n 2M
Term
1M
Signific
ance 1M
(c)
Ans.
Draw a schematic diagram of Automatic voltage control at
generators. Explain its functioning.
Automatic Voltage Control/Automatic Voltage regulator (AVR):
The automatic voltage, regulator (AVR) loop controls the magnitude
of the terminal voltage V. The latter voltage is continuously sensed,
rectified and smoothed. This D.C. signal, the resulting „error
voltage‟, after amplification and signal shaping serves as the input to
the exciter which finally delivers the voltage Vf to the generator field
4M
Diagra
m 2M
Explana
tion 2M
MAHARASHTRA STATE BOARD OF TECHNICAL EDUCATION
(Autonomous)
(ISO/IEC - 27001 - 2005 Certified)
MODEL ANSWER
SUMMER - 2017 EXAMINATION
Subject: Power System Operation & Control Subject Code:
Page 26/ 35
17643
winding.
What is the function of AVR? The basic role of the AVR is to provide reliability of the generator terminal voltage during normal, small and slow changes in the load. The main objective of Automatic Voltage Controller is to control of excitation of generator with respect to change in generated voltage. Automatic Voltage regulator is a feedback loop system, consists of voltage sensor, Automatic voltage regulator and Excitation system.
Voltage Sensor: It senses the actual generated voltage and sends the
signal to rectifier.
Rectifier: Now the rectifier converts into an equivalent D.C. Voltage-
Vdc.
Comparator: This D.C. voltage is fed to the comparator where it is compared with reference voltage Vdc ref.. The reference voltage is D.C. equivalent of the specific voltage required to maintain at generator output to maintain stability of system at that moment. The value of this is obtained by Load Flow Analysis.
Amplifier &Q-V controller: The output of comparator∆V is amplified by Power amplifier and amplified signal is given as input to Q-V controller. NowQ-V controller transfers into reactive power
signal ∆Q and feeds it to excitation controller. Excitation Controller:
This in turn varies the field regulator so that the generator terminal voltage varies.
(d)
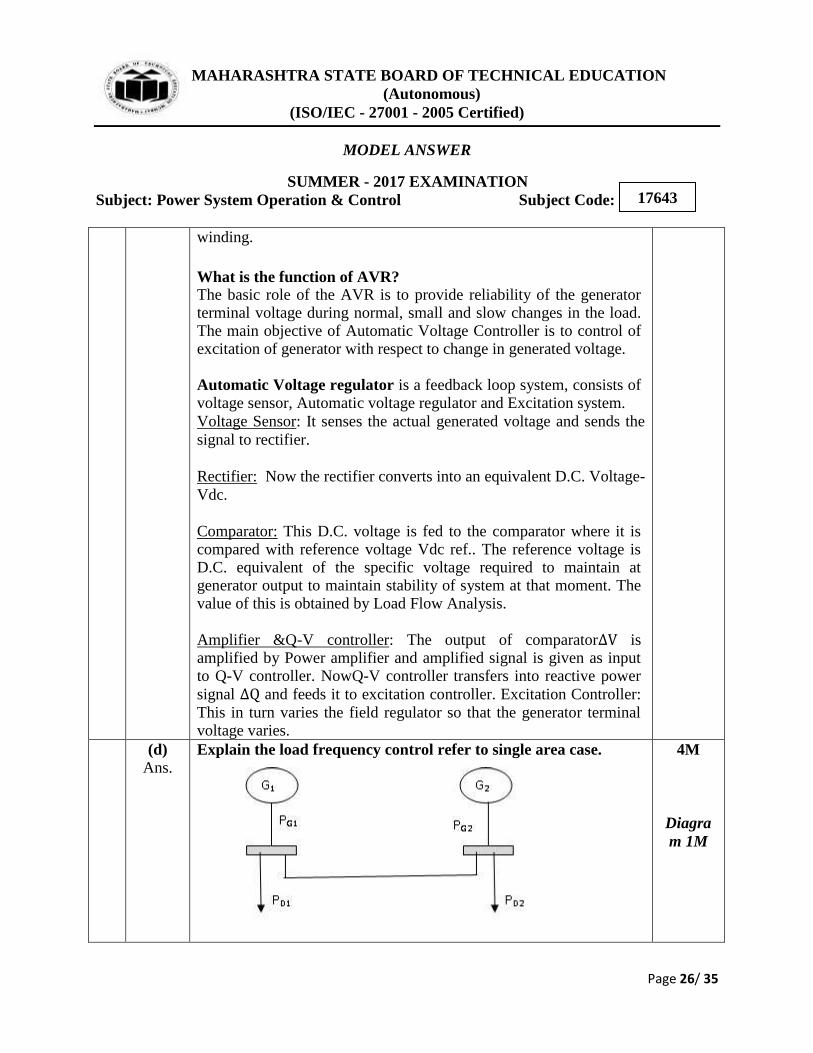
Ans. Explain the load frequency control refer to single area case.
4M
Diagra
m 1M
MAHARASHTRA STATE BOARD OF TECHNICAL EDUCATION
(Autonomous)
(ISO/IEC - 27001 - 2005 Certified)
MODEL ANSWER
SUMMER - 2017 EXAMINATION
Subject: Power System Operation & Control Subject Code:
Page 27/ 35
17643
In power system network single area is identified as single control
area of the grid network, consisting number of generators supply
power to all consumers in that area. All generators in this area are
synchronized and they swing in unison to meet change in power
demand of that area. i. e. they speed up or speed down
simultaneously.
Consider a control area consisting two generating plants connected
through transmission line as shown in single line diagram. These
generators are running in synchronism and their speed varies together
by maintain their respective machine angels.
At steady state condition, PG1 + PG2 = PD1 + PD2.
As load on generator G2 increases, its output increases to meet the
demand, while output of G1 remains same. But speed of G1 varies to
maintain the synchronism and frequency.
As load on generator G2 go on increasing, its output increases up to
its upper generation limit. Now to meet further increase in power
demand, output of G1 will increases and shares the power demand. If
the demand is very large then both generators share the demand.
Explana
tion 3M
(e)
Ans. State the need of load forecasting for power system operation.
Need of Load forecasting : Load forecasting for power system operation is required
1. For proper planning, designing of new power system network or
expansion of existing.
2. For varying generation of power with respect to time i.e. amount
of growth expected in power demand.
3. For determining the capacity of power generation and power flow
through transmission lines and distribution lines.
4. For proper planning of power flow through transmission &
distribution network.
5. For proper operation of power system in instability condition.
6. For proper planning of resources for generation of power i.e.
conventional or non-conventional resources.
7. For determining the cost of power generation, transmission and
distribution.
8. For proper man power development or training of manpower for
operation of power system.
9. To decide power tariff for different utilities and different
4M
Any 4
each 1M

MAHARASHTRA STATE BOARD OF TECHNICAL EDUCATION
(Autonomous)
(ISO/IEC - 27001 - 2005 Certified)
MODEL ANSWER
SUMMER - 2017 EXAMINATION
Subject: Power System Operation & Control Subject Code:
Page 28/ 35
17643
consumers.
10. For proper power transaction between neighbouring grid system.
11. For proper energy sales in electrical market.
12. For finding the requirement of fuel in future.
(f)
Ans. List out the functions of LDC. (Any four)
Functions of State Load Dispatch Centers:
In accordance with section 32 of Electricity Act, 2003 roles and
functions of SLDCs are as under:
1. The State Load Dispatch Centre shall be the apex body to ensure
integrated operation of the power system in a State.
2. The State Load Dispatch Centre shall -
a. be responsible for optimum scheduling and dispatch of
electricity within a State, in accordance with the contracts
entered into with the licensees or the generating companies
operating in that State;
b. monitor grid operations;
c. keep accounts of the quantity of electricity transmitted
through the State grid;
d. exercise supervision and control over the intra-state
transmission system; and
e. be responsible for carrying out real time operations for grid
control and dispatch of electricity within the State through
secure and economic operation of the State grid in accordance
with the Grid Standards and the State Grid Code.
3. The State Load Dispatch Centre may collect such fee and charges
from the generating companies and licensees engaged in intra-
State transmission of electricity as may be specified by the State
Commission.
4. Overall supervision, monitoring and control of the integrated
power system in the State on real time basis for ensuring stability,
security and economy operation of the power system in the State.
5. Optimum scheduling and dispatch of electricity within the State.
For this SLDCs estimate the demand of the State / DISCOMS, as
may be the case, availability of power in the State/DISCOMS
from State generators and other sources like Central Generating
stations, bilateral contracts etc, conveys the final requisition to
RLDCs on the State‟s entitlement from the Central Generating
Stations and bilateral transactions under open access, if any, and
4M
Any 4
each 1M

MAHARASHTRA STATE BOARD OF TECHNICAL EDUCATION
(Autonomous)
(ISO/IEC - 27001 - 2005 Certified)
MODEL ANSWER
SUMMER - 2017 EXAMINATION
Subject: Power System Operation & Control Subject Code:
Page 29/ 35
17643
issues final dispatch schedule to the State Generators and drawal
schedule to the DISCOMS.
6.
(a)
Ans.
Attempt any FOUR:
State the advantages of ALFC and AVC systems.
i. Automatic Load Frequency Control (ALFC) or Automatic
Generation Control (AGC) - Used to achieve real power balance
(acceptable frequency values).
ii. Automatic Voltage Regulator (AVC).--- Used to achieve reactive
power balance (acceptable voltage profile).
16
4M
Each
advanta
ges 2M
(b)
Ans.
Write the help of diagram, explain ALFC of synchronous
generator.
In an electric power system, Automatic Generation Control (AGC) is
a system for adjusting the power output of multiple generators at
different power plants, in response to changes in the load. Ideally it is
required that at each moment in power grid power generation and
power demand closely balance. To achieve this frequent adjustments
are necessary to the output of generators. The imbalance can be found
out by measuring the system frequency. If the system frequency is
increasing, means more power is being generated than demand and all
the machines in the system are accelerating. If the system frequency
is decreasing, means more loads is on the system, than all the
machines in the system are slowing down.
The frequency is closely related to the real power balance in the
4M
Diagra
m 2M
Explana
tion 2M

MAHARASHTRA STATE BOARD OF TECHNICAL EDUCATION
(Autonomous)
(ISO/IEC - 27001 - 2005 Certified)
MODEL ANSWER
SUMMER - 2017 EXAMINATION
Subject: Power System Operation & Control Subject Code:
Page 30/ 35
17643
overall network. Under normal operating conditions the system
generators run synchronously and generate together the power at each
moment is being drawn by all loads plus the real. Automatic load
frequency control helps to regulate the MW output of the generator to
maintain the frequency.
It consists of two feedback loop--Primary loop & Secondary loop
system.
Primary loop works for a frequency variation which is a result of
power imbalance in MW. In this loop the output generated voltage
frequency is fed to the governor which raises a signal to control
valves to regulate the steam flow so that output of the generator will
match with fast load fluctuations. This loop matches the initial course
of adjustment of frequency. Response time of this loop is in the order
of 2-20 seconds.
Primary loop - It is a feedback loop system, consists of frequency
sensor, Frequency comparator, Integrator, speed changer, Turbine
governor, Hydraulic amplifier and Valve control mechanism.
Frequency Sensor: It senses the actual frequency of generated voltage
and sends the signal toFrequency comparator.
Frequency comparator: It compares the actual frequency with the
reference frequency and rise the signal ∆f to integrator.
Integrator: It converts frequency signal into speed signal i.e. ∆f to ∆N
and feed it to speed changer.
Speed Changer: According to the signal it rolls low /high side and
activate Turbine governor.
Turbine governor: It is a turbo-generator governor. It raises the signal
to increase or decrease the speed of turbine through Link mechanisms
Link mechanisms: This is a 4-link mechanism, which provides a
movement to Steam valve through Hydraulic amplifier in proportion
to change in speed. It also provides a feedback from the steam valve
movement
Hydraulic amplifier: It comprises a pilot valve and main piston
arrangement. Low power level pilot valve movement is converted
into high power level piston valve movement. This is necessary in
order to open or close the steam valve against high pressure steam.
Valve control mechanism: As per signal valve control mechanism
opens or close the steam /gas valve to increase /decrease the speed i.e.
power output of turbine. Accordingly generator output varies.

MAHARASHTRA STATE BOARD OF TECHNICAL EDUCATION
(Autonomous)
(ISO/IEC - 27001 - 2005 Certified)
MODEL ANSWER
SUMMER - 2017 EXAMINATION
Subject: Power System Operation & Control Subject Code:
Page 31/ 35
17643
Secondary loop: It comprises Frequency amplifier which receives minor variation signal of frequency and feed the amplified signal to
integrator. Secondary loop works for fine adjustment of the frequency, signal
from the output of the generator is amplified by amplifier and the
amplified signal is fed to integral controls which integrate the frequency error and raise a signal to control the valves which in turn
regulate the steam flow. This loop is sensitive to rapid variations in load frequency. Response time of this loop is in order of one minute.
This ALFC is located in power stations. It is operative only during normal changes in load and frequency. It is unable to provide adequate control during emergency conditions when large MW imbalance occurs.
(c)
Ans.
Explain the different methods of voltage control by using
transformer.
Following are the methods of voltage control in power system. By
using transformers
1. By tap changing transformers.
- Off load tap changing
- On load tap changing
2. By regulating transformers
3. By Booster transformers
4. Auto Transformer tap changing
1) Online tap changing transformer: All transformers are provided with taps on the winding for adjusting
the ratio of transformation. Taps are usually provided on the high
voltage winding to enable a fine control of voltage. Generally the tap
changing can be done any when the transformer is in de-energized
state. However in some cases tap changing is also possible when the
transformer is energized. These transformers make it possible to
maintain a constant voltage level on important buses in the system.
Location: Intermediate distribution Substation
2) Regulating transformer: A special type of transformer designed for small adjustments of
voltage is known regulating transformer. The fig. shows a typical
arrangement to use a regulating transformer for voltage mag control
in a 3 phase ckt. A 3 phase transformer provides on adjustable voltage
4M
Each
method
1M

MAHARASHTRA STATE BOARD OF TECHNICAL EDUCATION
(Autonomous)
(ISO/IEC - 27001 - 2005 Certified)
MODEL ANSWER
SUMMER - 2017 EXAMINATION
Subject: Power System Operation & Control Subject Code:
Page 32/ 35
17643
to the primary of the regulating transformer. The secondary of the
regulating transformer are connected in series with the lines. Thus a
voltage magnitude 0volt to the voltage of each phase.
Location: distribution Substation
3) Booster Transformer:
Sometimes it is designed to control the voltage of transmission line at
a point for away from the main transformer. This is conveniently
achieved by the use of booster transformer. The secondary of booster
transformer is connected in series with the line whose voltage is to be
controlled. The primary of this transformer is supplied from a
regulating transformer with on load tap changing gear.
Location: HV &EHV transmission Line
4) Auto transformer tap changing:
Here, a midtapped auto-tranformer or reactor is used. One of the line
is connected its mid-tapping. One end of this transformer is connected
in a series of switches across the odd tapping and the other end is
connected to switches across the even tappings.
(d)
Ans.
How the voltage level can be controlled in power system by
injecting reactive power in the tr. Line?
Reactive power injection method for voltage control:
To keep the receiving end voltage at a specified value, a fixed amount
of VARS must be drawn from the line.
QG =QD bus voltage is maintained at specific value.
As VAR demand QD varies, a local VAR generator must be used as
shown in fig. The VAR balance equation at the receiving end is now.
QG =QD +QC
Any variation QD is are absorbed / injected by the local VAR
generator and QGgenerated by the line remains fixed. This helps to
keep the receiving end voltage constant.
4M
Concept
1M
Each
equipme
nt 1M

MAHARASHTRA STATE BOARD OF TECHNICAL EDUCATION
(Autonomous)
(ISO/IEC - 27001 - 2005 Certified)
MODEL ANSWER
SUMMER - 2017 EXAMINATION
Subject: Power System Operation & Control Subject Code:
Page 33/ 35
17643
Following are the equipments used to inject VARs in the system
at different points.
Generation system Excitation control Production of
reactive power
involves increasing
the magnetic field to
raise the generator‟s
terminal voltage. To
increase the
magnetic field,
increase the current
in the field winding.
Absorption of
reactive power is
limited by the
magnetic-flux
pattern in the stator,
which results in
excessive heating of
the stator-end iron,
the core-end heating
limit.
Transmission system Series reactors Capacitors and
inductors in HV and
EHV trans. Line
Static VAR system
Distribution system Shunt reactors Capacitor‟s bank
Synchronous
condenser
Static VAR system
(e)
Ans.
List out the environmental factors that affects the load
forecasting.
List out the environmental factors affecting load forecasting?
Following are Environmental factors that affect load forecasting of
power system.
i.) Time dependent factor
4M
Each
factors

MAHARASHTRA STATE BOARD OF TECHNICAL EDUCATION
(Autonomous)
(ISO/IEC - 27001 - 2005 Certified)
MODEL ANSWER
SUMMER - 2017 EXAMINATION
Subject: Power System Operation & Control Subject Code:
Page 34/ 35
17643
ii.) Weather dependent factor ( humidity, temperature)
iii.) Wind --wind speed, wind direction, cloud cover, fog
iv.) Random weather change ( storm, sunami, heavy rain, flood)
1M
(f)
Ans. Why social activities are important for power system operation?
Electricity consumers i.e. residential consumer, commercial
consumers, industrial consumers are part of society. Hence their
activities, events affect the power requirement. Following are the
some of the activities that affect the load forecasting of power system.
1) Energy consumption pattern: All 24hr,s of day load on system
varies as consumer has freedom to use electricity whenever they
required without any prior information. Hence daily load curves
differ with the day. Also energy consumption pattern of various
and type of consumer differs. To satisfy all consumers power
generation must be varied with time. So during forecasting of load
these factors must be considered.
2) Holidays/week ends and week days: During power consumption
pattern is nearly same but on weekends / Sundays power
consumption pattern changes. Therefore their impact on load
forecasting cannot be neglected. Public holidays also have
considerable impact on load forecasting. Long weekend‟s creates
more fluctuation in load demand.
3) School /college vacations: Vacation period changes the daily
routine of children and their stay at consumes power for their
activities such as watching TV, playing video games, net surfing,
watching films, etc. So in residential sector more power consumes
by lighting and air-conditioning systems.
4) Festivals and National days: During festivals like Diwali, Dashera,
Christmas, Onam etc. more lightings are used for decoration
purpose. This increases power consumption of residential as well
as commercial sector. Hence they have to be considered for load
forecasting. National days like Independence day, republic day,
Marashtra day etc. all government building are decorated with
lights and more cultural programs were arranged. As power
consumption is of considerable amount, their impact on load has to
4M
Any 4
each 1M

MAHARASHTRA STATE BOARD OF TECHNICAL EDUCATION
(Autonomous)
(ISO/IEC - 27001 - 2005 Certified)
MODEL ANSWER
SUMMER - 2017 EXAMINATION
Subject: Power System Operation & Control Subject Code:
Page 35/ 35
17643
be considered in load forecasting.
5) Emergency conditions and Major accidents: If sudden large
variation power demands, failure of system components, faults
(line-to-line, line-to-ground) in system, causes more imbalances in
power demand and supply. It will put the system in transient
stability condition. Also if major accidents takes place like sunami,
wind storm, earth quack, snow storm, flood etc. may affects the
infrastructure of power system. And so there may be major power
failure. In such situations load forecasting becomes failure.
6) Special events:Labour strike in Industry, political events, VIP
visits also creates large variation in power demand. These events
cannot be neglected