Embed Size (px)
Citation preview
2016-2017 Graduation Survey DataSummer and Fall (2016) and Spring (2017)
Marshall University
Office of Assessment and Program Review
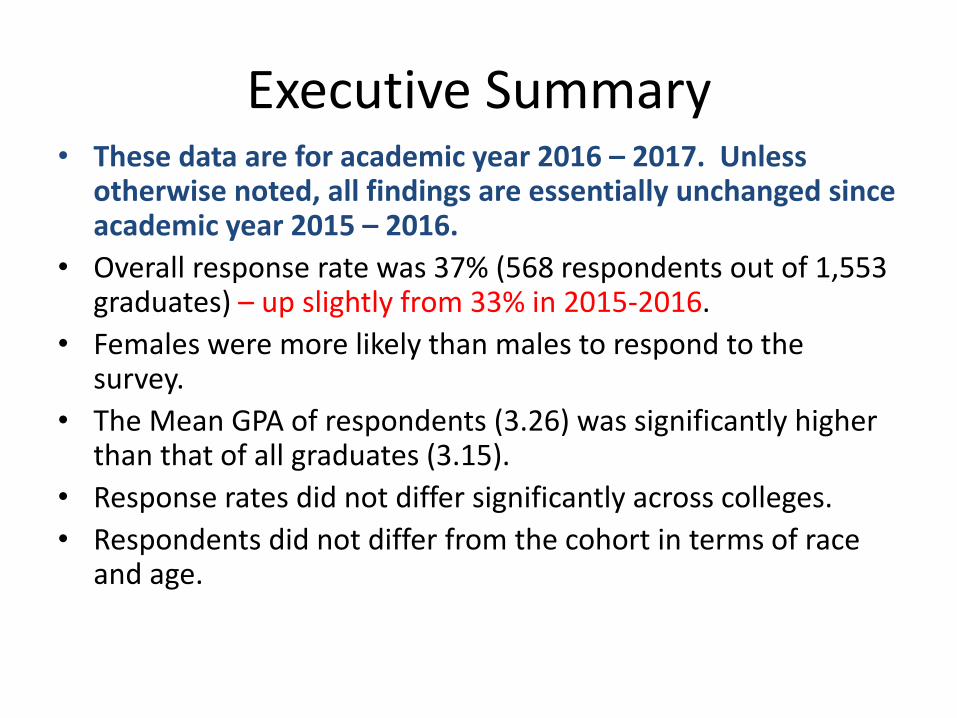
Executive Summary• These data are for academic year 2016 – 2017. Unless
otherwise noted, all findings are essentially unchanged since academic year 2015 – 2016.
• Overall response rate was 37% (568 respondents out of 1,553 graduates) – up slightly from 33% in 2015-2016.
• Females were more likely than males to respond to the survey.
• The Mean GPA of respondents (3.26) was significantly higher than that of all graduates (3.15).
• Response rates did not differ significantly across colleges.
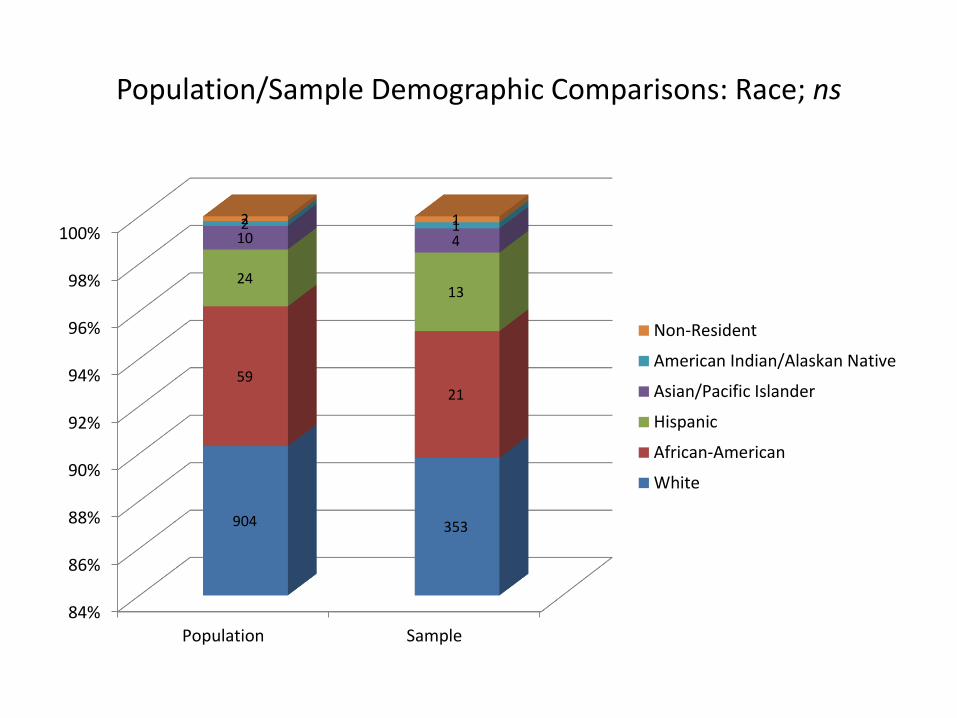
• Respondents did not differ from the cohort in terms of race and age.
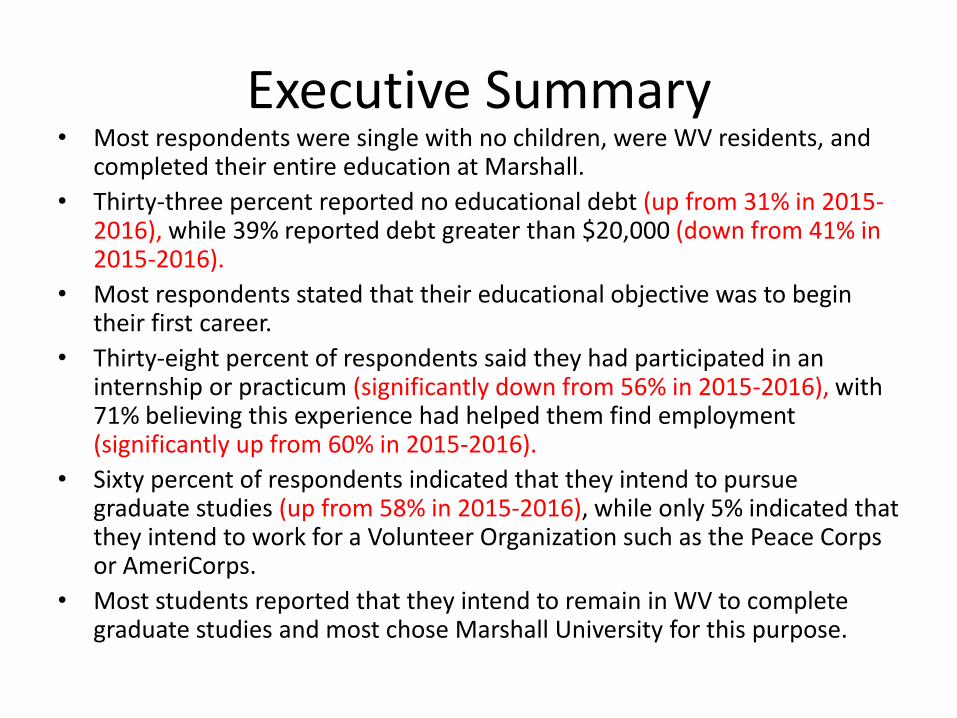
Executive Summary• Most respondents were single with no children, were WV residents, and
completed their entire education at Marshall.
• Thirty-three percent reported no educational debt (up from 31% in 2015-2016), while 39% reported debt greater than $20,000 (down from 41% in 2015-2016).
• Most respondents stated that their educational objective was to begin their first career.
• Thirty-eight percent of respondents said they had participated in an internship or practicum (significantly down from 56% in 2015-2016), with 71% believing this experience had helped them find employment (significantly up from 60% in 2015-2016).
• Sixty percent of respondents indicated that they intend to pursue graduate studies (up from 58% in 2015-2016), while only 5% indicated that they intend to work for a Volunteer Organization such as the Peace Corps or AmeriCorps.
• Most students reported that they intend to remain in WV to complete graduate studies and most chose Marshall University for this purpose.
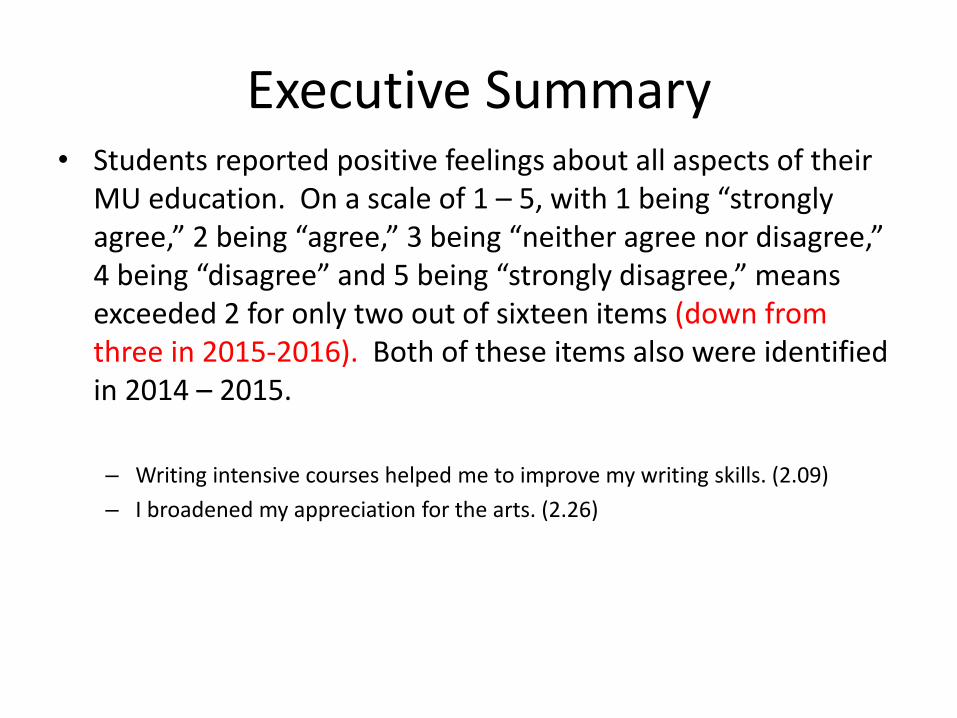
Executive Summary• Students reported positive feelings about all aspects of their
MU education. On a scale of 1 – 5, with 1 being “strongly agree,” 2 being “agree,” 3 being “neither agree nor disagree,” 4 being “disagree” and 5 being “strongly disagree,” means exceeded 2 for only two out of sixteen items (down from three in 2015-2016). Both of these items also were identified in 2014 – 2015.
– Writing intensive courses helped me to improve my writing skills. (2.09)
– I broadened my appreciation for the arts. (2.26)
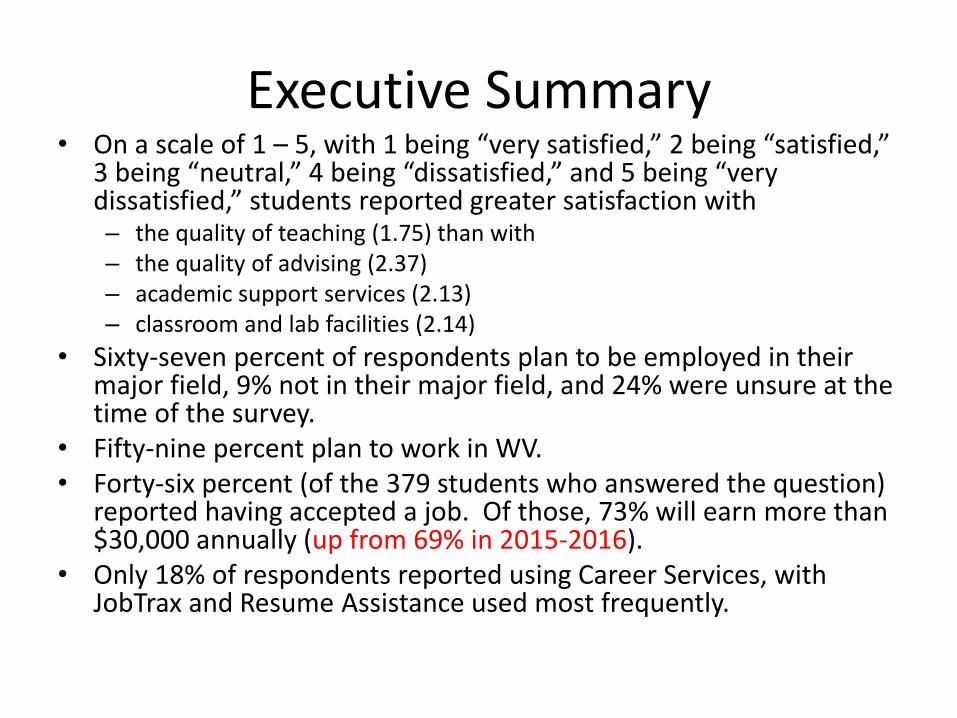
Executive Summary• On a scale of 1 – 5, with 1 being “very satisfied,” 2 being “satisfied,”
3 being “neutral,” 4 being “dissatisfied,” and 5 being “very dissatisfied,” students reported greater satisfaction with – the quality of teaching (1.75) than with – the quality of advising (2.37)– academic support services (2.13)– classroom and lab facilities (2.14)
• Sixty-seven percent of respondents plan to be employed in their major field, 9% not in their major field, and 24% were unsure at the time of the survey.
• Fifty-nine percent plan to work in WV. • Forty-six percent (of the 379 students who answered the question)
reported having accepted a job. Of those, 73% will earn more than $30,000 annually (up from 69% in 2015-2016).
• Only 18% of respondents reported using Career Services, with JobTrax and Resume Assistance used most frequently.
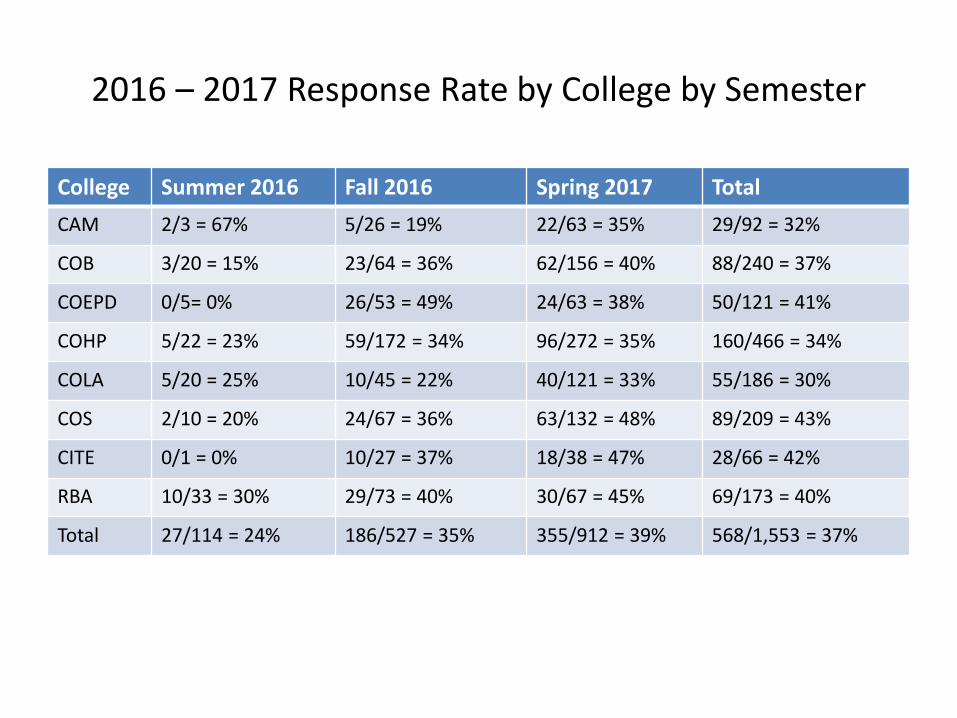
2016 – 2017 Response Rate by College by Semester
College Summer 2016 Fall 2016 Spring 2017 Total
CAM 2/3 = 67% 5/26 = 19% 22/63 = 35% 29/92 = 32%
COB 3/20 = 15% 23/64 = 36% 62/156 = 40% 88/240 = 37%
COEPD 0/5= 0% 26/53 = 49% 24/63 = 38% 50/121 = 41%
COHP 5/22 = 23% 59/172 = 34% 96/272 = 35% 160/466 = 34%
COLA 5/20 = 25% 10/45 = 22% 40/121 = 33% 55/186 = 30%
COS 2/10 = 20% 24/67 = 36% 63/132 = 48% 89/209 = 43%
CITE 0/1 = 0% 10/27 = 37% 18/38 = 47% 28/66 = 42%
RBA 10/33 = 30% 29/73 = 40% 30/67 = 45% 69/173 = 40%
Total 27/114 = 24% 186/527 = 35% 355/912 = 39% 568/1,553 = 37%
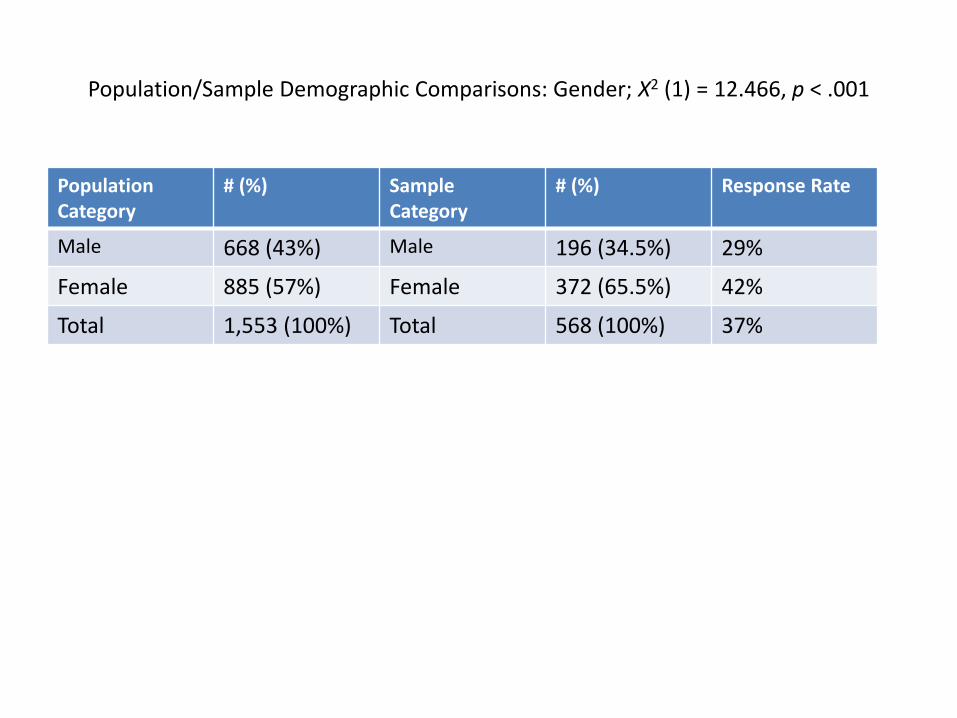
Population/Sample Demographic Comparisons: Gender; X2 (1) = 12.466, p < .001
Population Category
# (%) SampleCategory
# (%) Response Rate
Male 668 (43%) Male 196 (34.5%) 29%
Female 885 (57%) Female 372 (65.5%) 42%
Total 1,553 (100%) Total 568 (100%) 37%
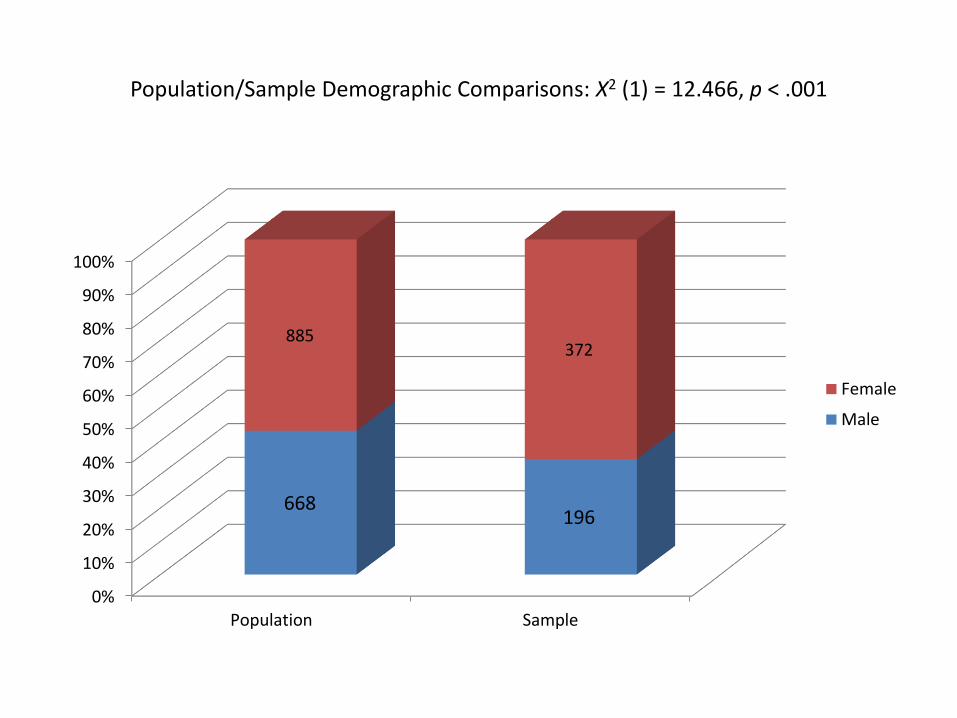
Population/Sample Demographic Comparisons: X2 (1) = 12.466, p < .001
0%
10%
20%
30%
40%
50%
60%
70%
80%
90%
100%
Population Sample
668196
885372
Female
Male
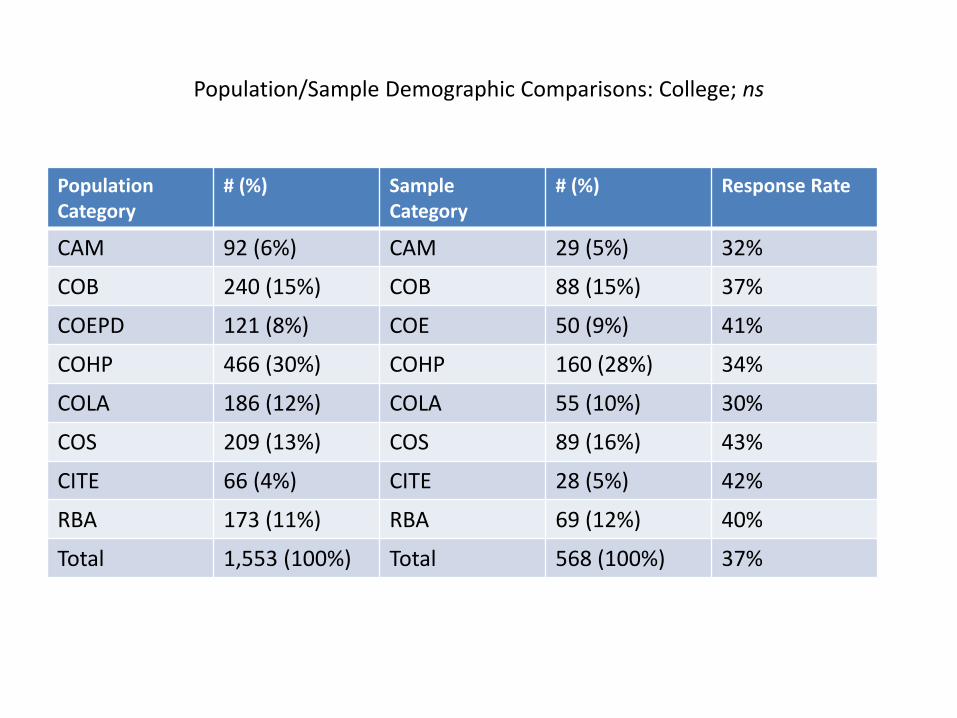
Population/Sample Demographic Comparisons: College; ns
Population Category
# (%) SampleCategory
# (%) Response Rate
CAM 92 (6%) CAM 29 (5%) 32%
COB 240 (15%) COB 88 (15%) 37%
COEPD 121 (8%) COE 50 (9%) 41%
COHP 466 (30%) COHP 160 (28%) 34%
COLA 186 (12%) COLA 55 (10%) 30%
COS 209 (13%) COS 89 (16%) 43%
CITE 66 (4%) CITE 28 (5%) 42%
RBA 173 (11%) RBA 69 (12%) 40%
Total 1,553 (100%) Total 568 (100%) 37%
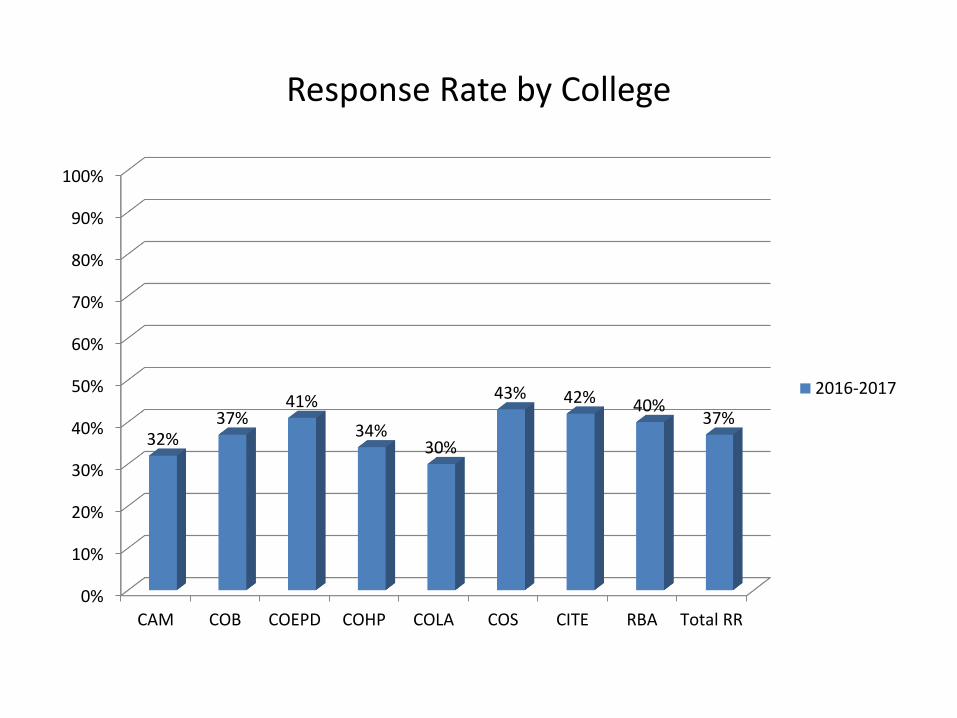
Response Rate by College
0%
10%
20%
30%
40%
50%
60%
70%
80%
90%
100%
CAM COB COEPD COHP COLA COS CITE RBA Total RR
32%37%
41%
34%30%
43% 42% 40%37%
2016-2017
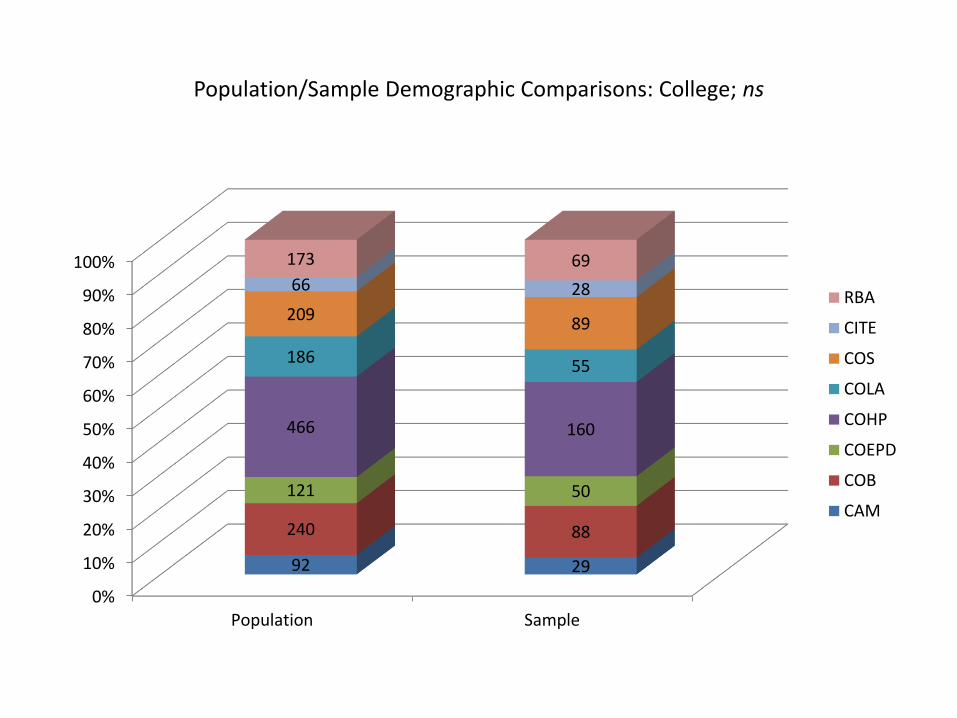
Population/Sample Demographic Comparisons: College; ns
0%
10%
20%
30%
40%
50%
60%
70%
80%
90%
100%
Population Sample
92 29
240 88
121 50
466 160
186 55
20989
66 28
173 69
RBA
CITE
COS
COLA
COHP
COEPD
COB
CAM
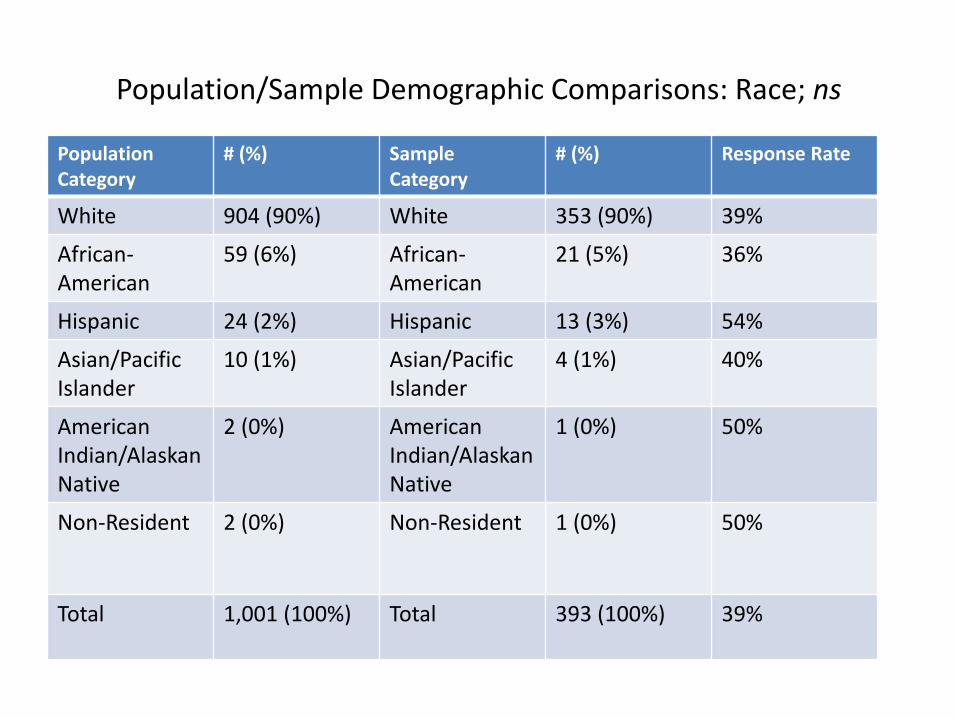
Population/Sample Demographic Comparisons: Race; ns
Population Category
# (%) SampleCategory
# (%) Response Rate
White 904 (90%) White 353 (90%) 39%
African-American
59 (6%) African-American
21 (5%) 36%
Hispanic 24 (2%) Hispanic 13 (3%) 54%
Asian/Pacific Islander
10 (1%) Asian/Pacific Islander
4 (1%) 40%
American Indian/Alaskan Native
2 (0%) American Indian/Alaskan Native
1 (0%) 50%
Non-Resident 2 (0%) Non-Resident 1 (0%) 50%
Total 1,001 (100%) Total 393 (100%) 39%
Population/Sample Demographic Comparisons: Race; ns
84%
86%
88%
90%
92%
94%
96%
98%
100%
Population Sample
904 353
5921
2413
10 42 12 1
Non-Resident
American Indian/Alaskan Native
Asian/Pacific Islander
Hispanic
African-American
White
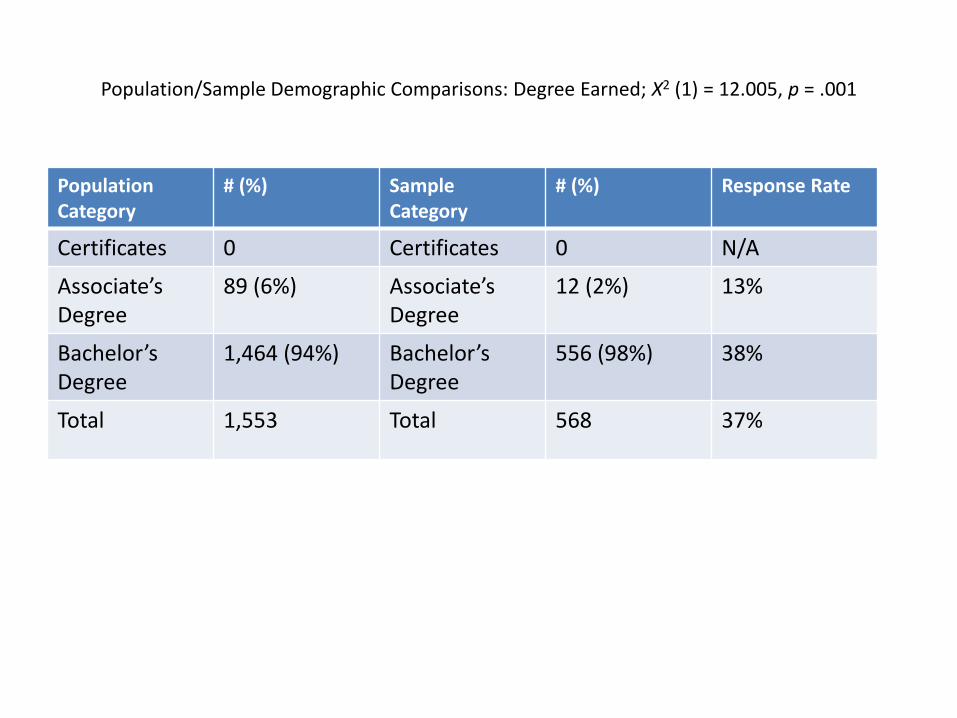
Population/Sample Demographic Comparisons: Degree Earned; X2 (1) = 12.005, p = .001
Population Category
# (%) SampleCategory
# (%) Response Rate
Certificates 0 Certificates 0 N/A
Associate’s Degree
89 (6%) Associate’s Degree
12 (2%) 13%
Bachelor’s Degree
1,464 (94%) Bachelor’s Degree
556 (98%) 38%
Total 1,553 Total 568 37%
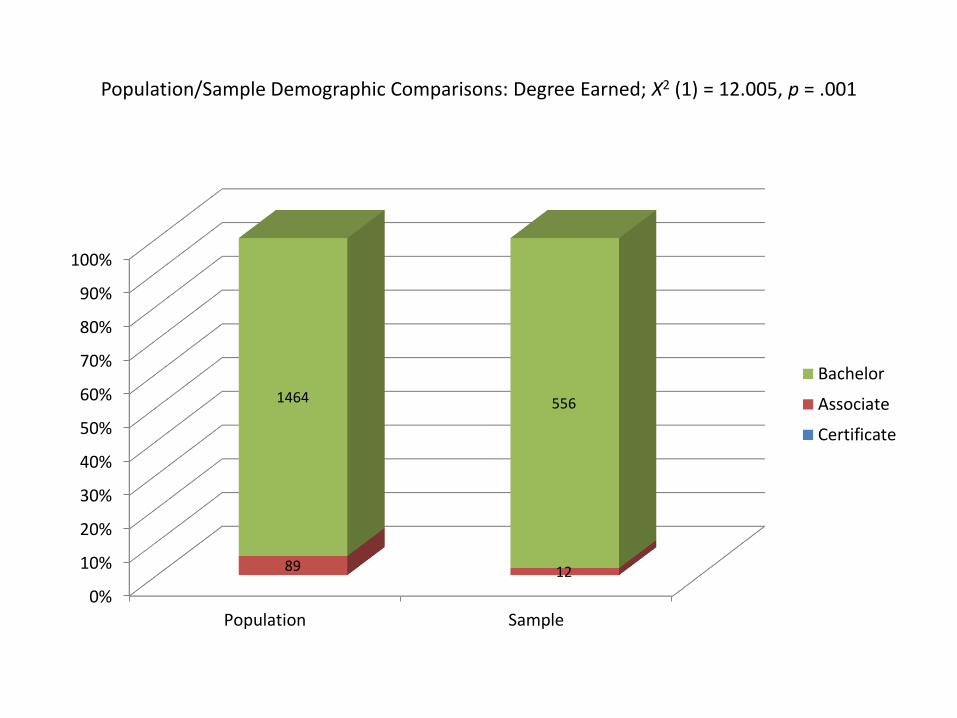
Population/Sample Demographic Comparisons: Degree Earned; X2 (1) = 12.005, p = .001
0%
10%
20%
30%
40%
50%
60%
70%
80%
90%
100%
Population Sample
89 12
1464 556
Bachelor
Associate
Certificate
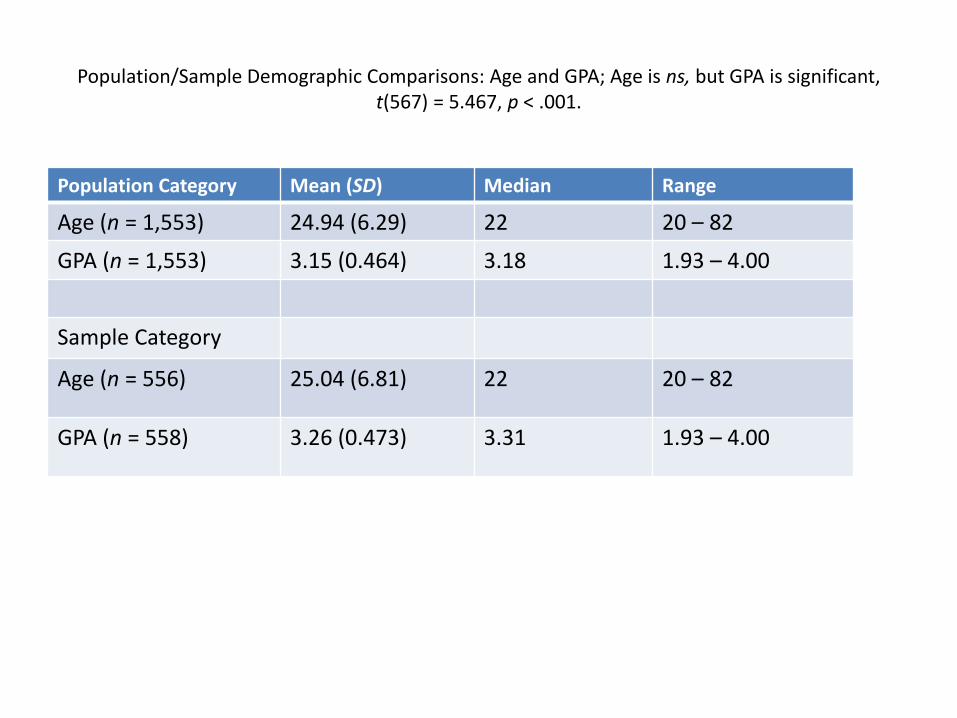
Population/Sample Demographic Comparisons: Age and GPA; Age is ns, but GPA is significant, t(567) = 5.467, p < .001.
Population Category Mean (SD) Median Range
Age (n = 1,553) 24.94 (6.29) 22 20 – 82
GPA (n = 1,553) 3.15 (0.464) 3.18 1.93 – 4.00
Sample Category
Age (n = 556) 25.04 (6.81) 22 20 – 82
GPA (n = 558) 3.26 (0.473) 3.31 1.93 – 4.00
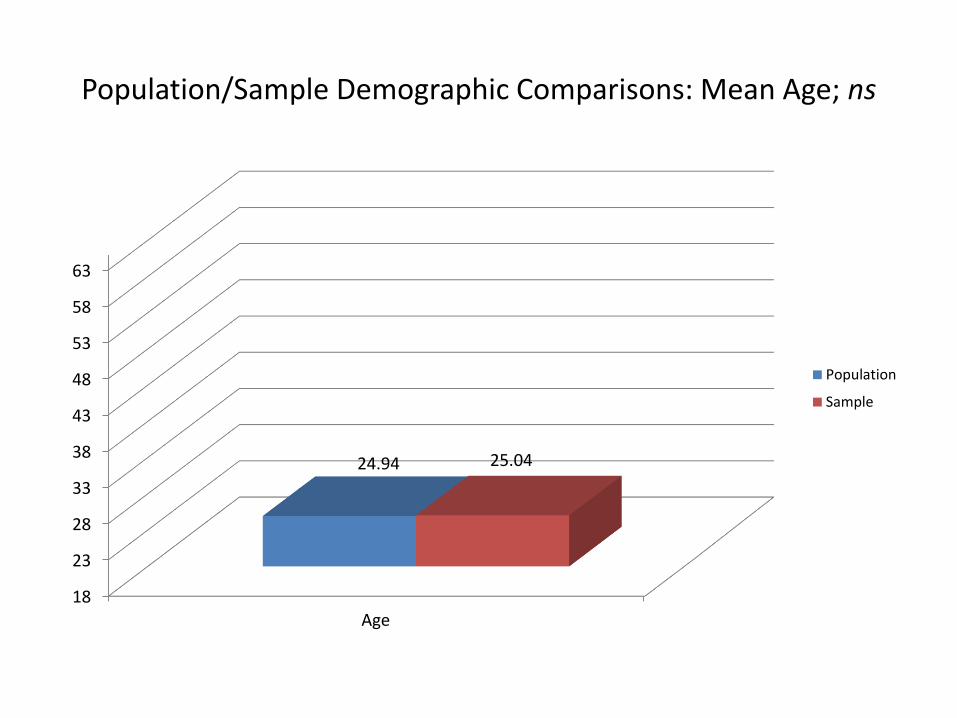
Population/Sample Demographic Comparisons: Mean Age; ns
18
23
28
33
38
43
48
53
58
63
Age
24.94 25.04
Population
Sample
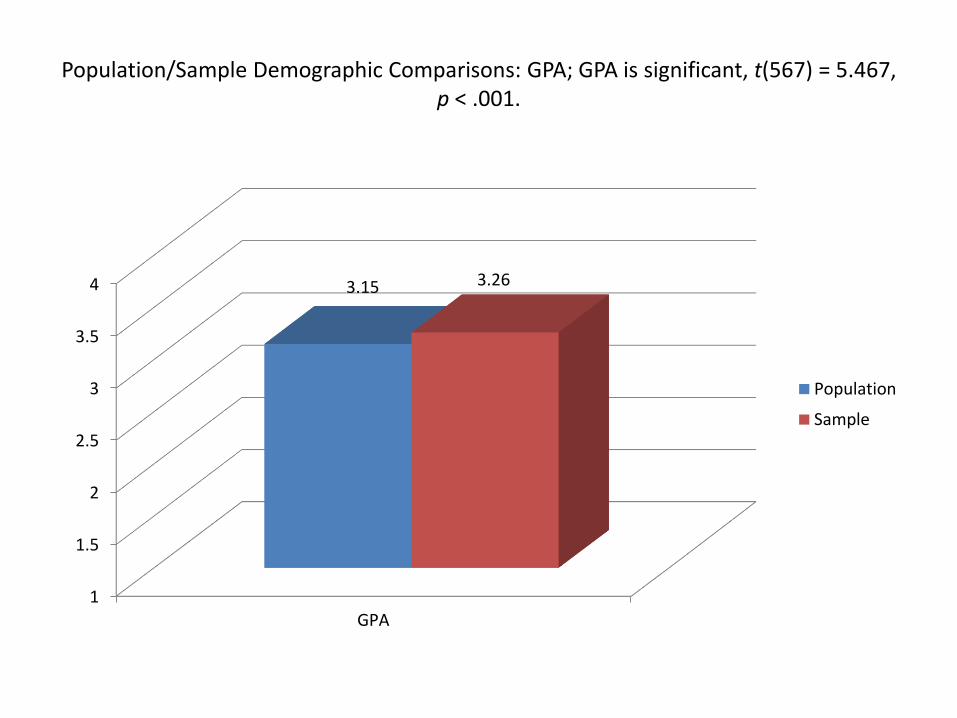
Population/Sample Demographic Comparisons: GPA; GPA is significant, t(567) = 5.467, p < .001.
1
1.5
2
2.5
3
3.5
4
GPA
3.15 3.26
Population
Sample
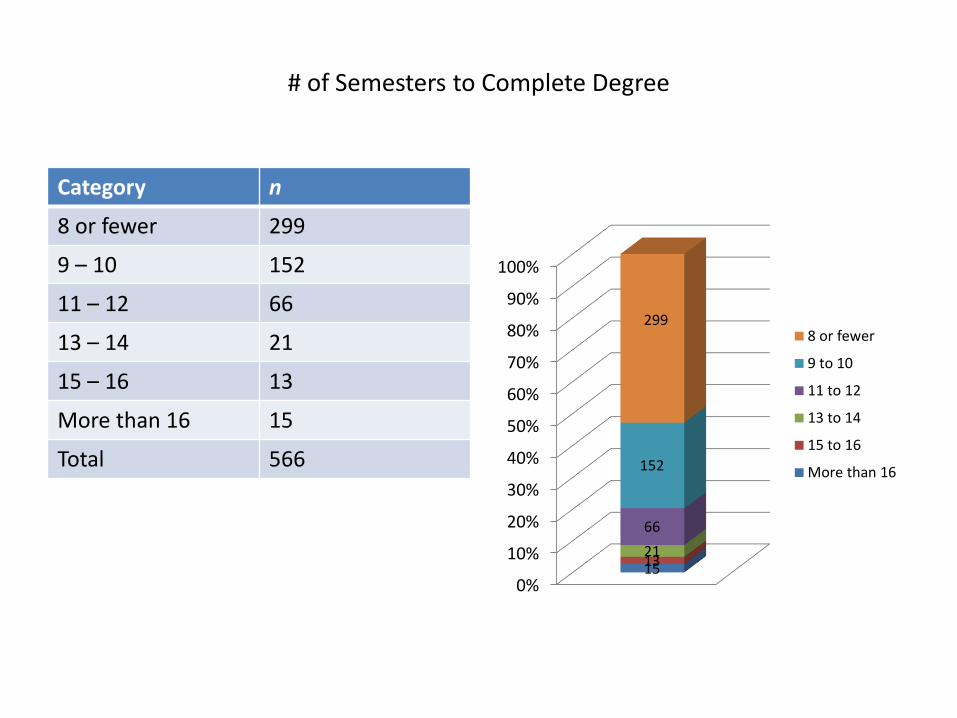
# of Semesters to Complete Degree
Category n
8 or fewer 299
9 – 10 152
11 – 12 66
13 – 14 21
15 – 16 13
More than 16 15
Total 566
0%
10%
20%
30%
40%
50%
60%
70%
80%
90%
100%
151321
66
152
2998 or fewer
9 to 10
11 to 12
13 to 14
15 to 16
More than 16
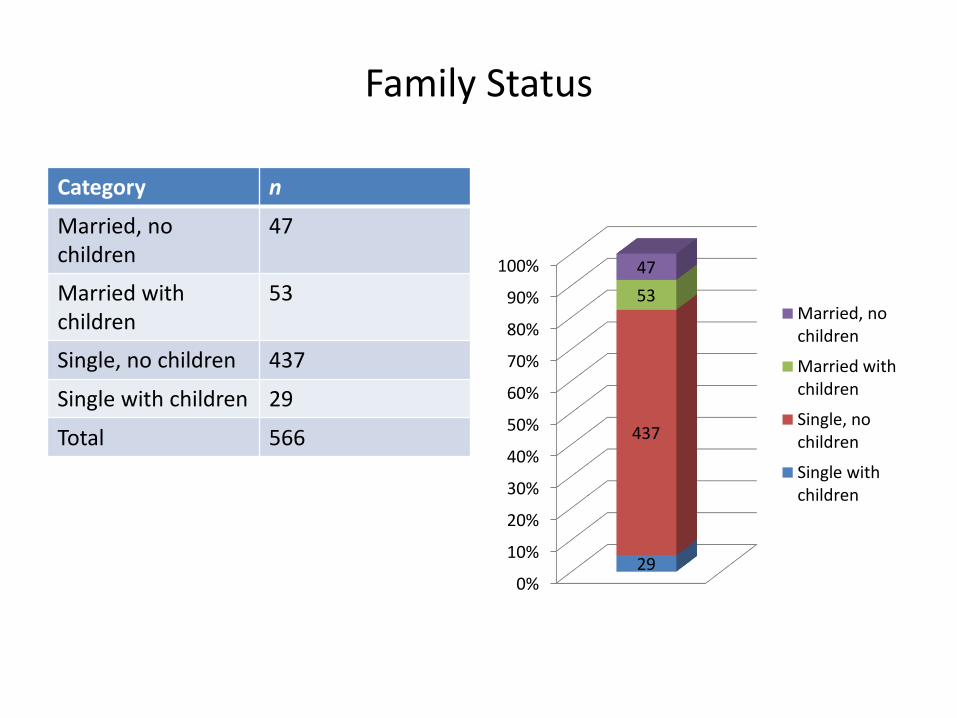
Family Status
Category n
Married, no children
47
Married with children
53
Single, no children 437
Single with children 29
Total 566
0%
10%
20%
30%
40%
50%
60%
70%
80%
90%
100%
29
437
53
47
Married, nochildren
Married withchildren
Single, nochildren
Single withchildren
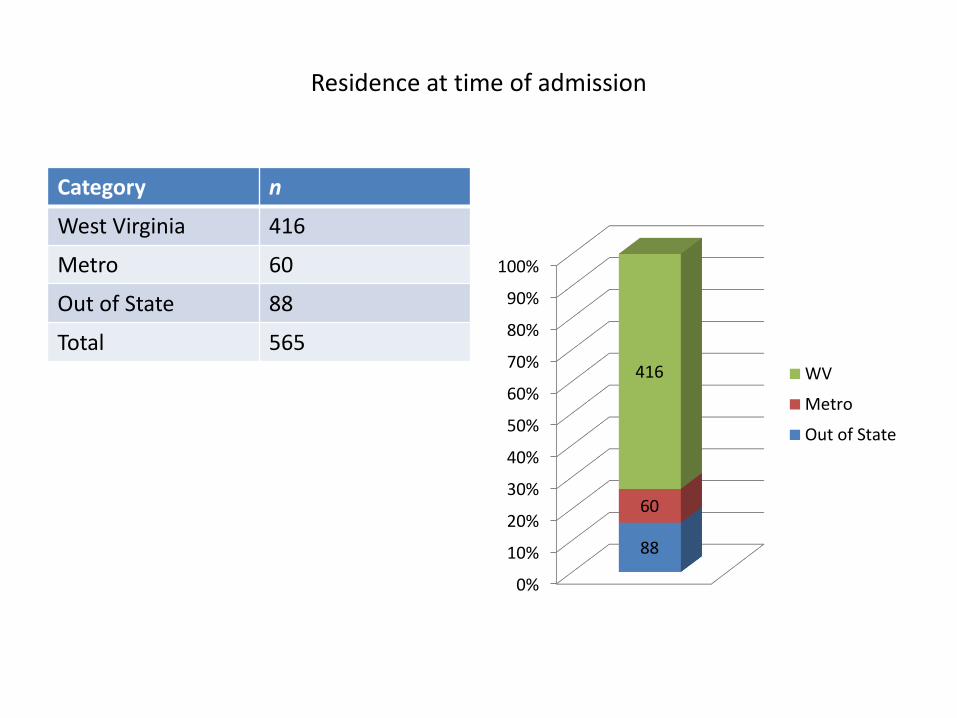
Residence at time of admission
Category n
West Virginia 416
Metro 60
Out of State 88
Total 565
0%
10%
20%
30%
40%
50%
60%
70%
80%
90%
100%
88
60
416 WV
Metro
Out of State
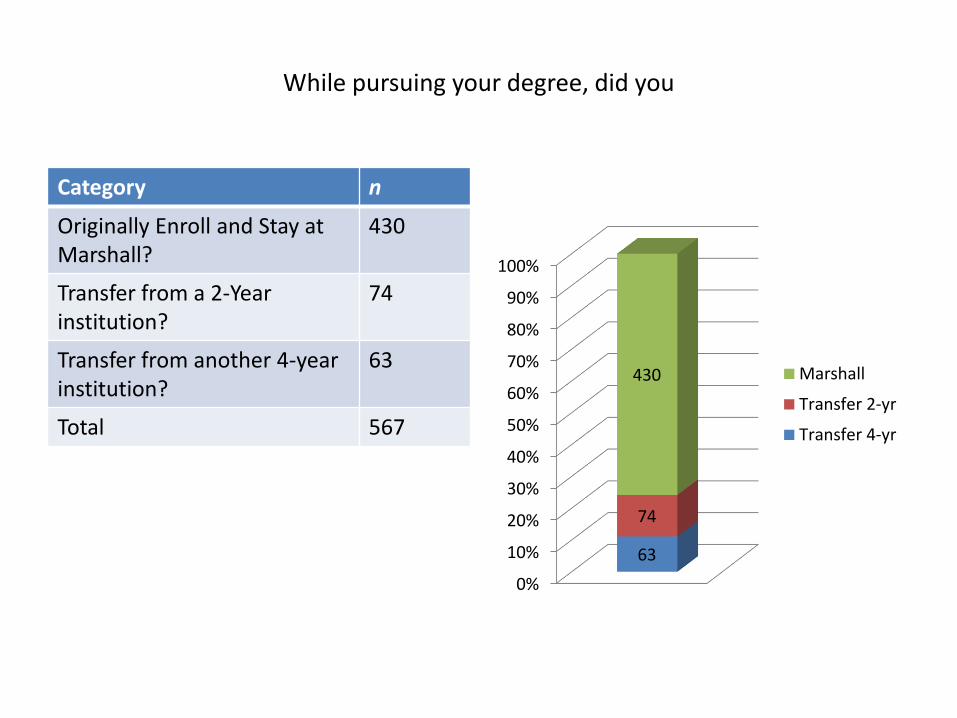
While pursuing your degree, did you
Category n
Originally Enroll and Stay at Marshall?
430
Transfer from a 2-Year institution?
74
Transfer from another 4-year institution?
63
Total 567
0%
10%
20%
30%
40%
50%
60%
70%
80%
90%
100%
63
74
430 Marshall
Transfer 2-yr
Transfer 4-yr
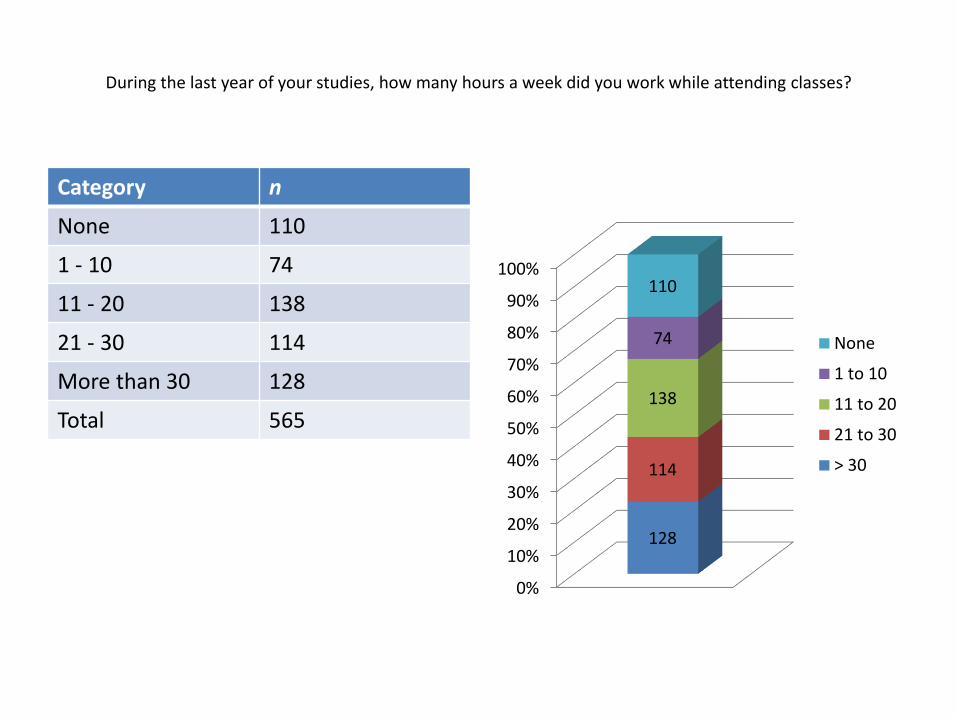
During the last year of your studies, how many hours a week did you work while attending classes?
Category n
None 110
1 - 10 74
11 - 20 138
21 - 30 114
More than 30 128
Total 565
0%
10%
20%
30%
40%
50%
60%
70%
80%
90%
100%
128
114
138
74
110
None
1 to 10
11 to 20
21 to 30
> 30
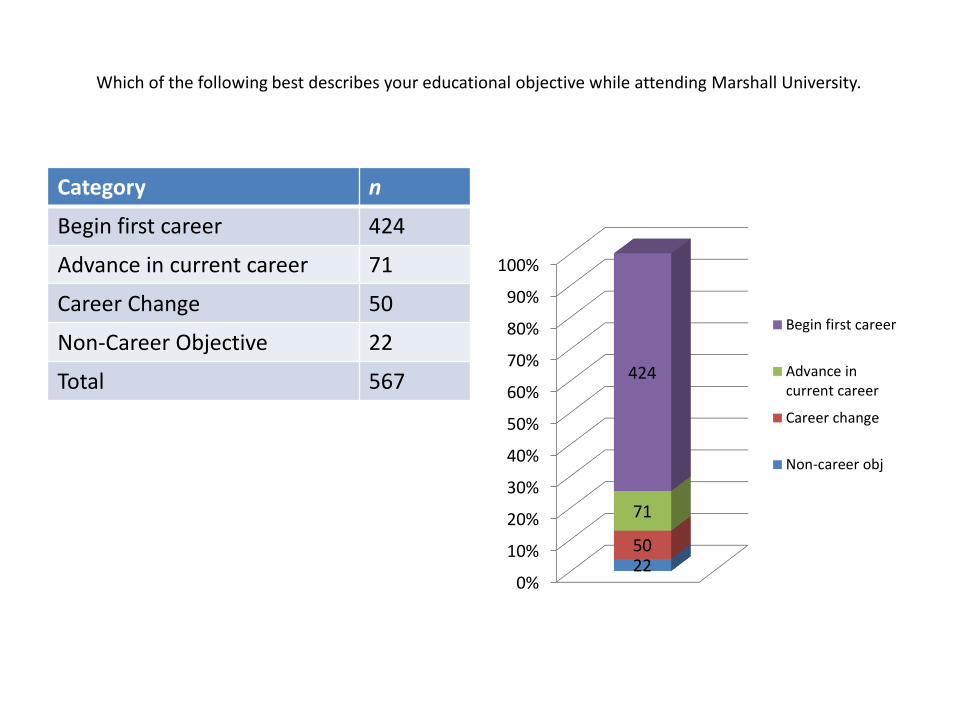
Which of the following best describes your educational objective while attending Marshall University.
Category n
Begin first career 424
Advance in current career 71
Career Change 50
Non-Career Objective 22
Total 567
0%
10%
20%
30%
40%
50%
60%
70%
80%
90%
100%
2250
71
424
Begin first career
Advance incurrent career
Career change
Non-career obj
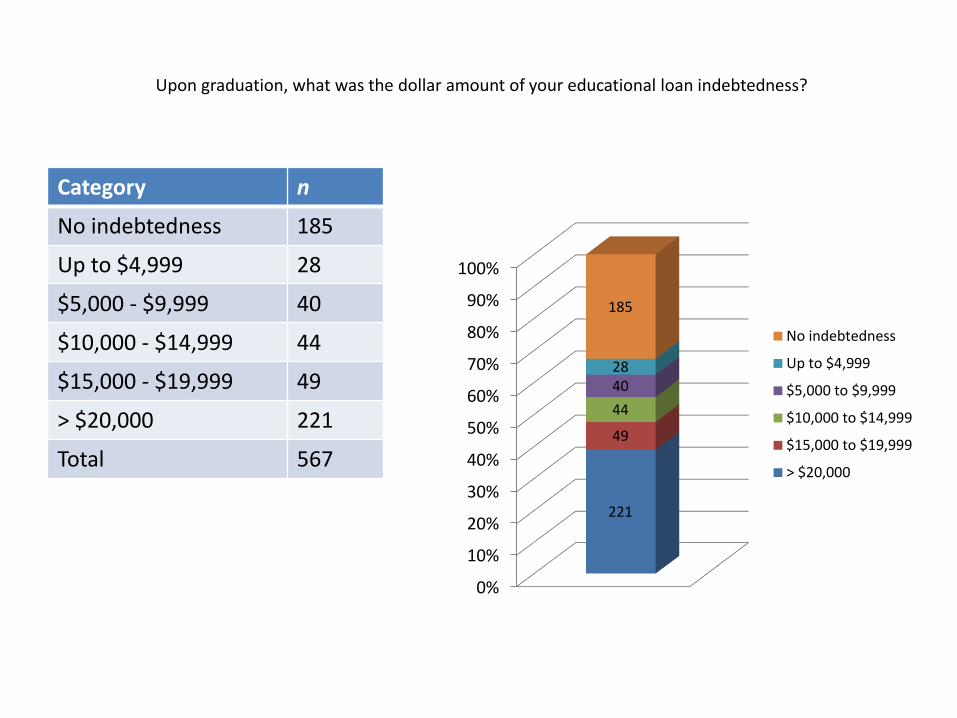
Upon graduation, what was the dollar amount of your educational loan indebtedness?
Category n
No indebtedness 185
Up to $4,999 28
$5,000 - $9,999 40
$10,000 - $14,999 44
$15,000 - $19,999 49
> $20,000 221
Total 567
0%
10%
20%
30%
40%
50%
60%
70%
80%
90%
100%
221
49
44
4028
185
No indebtedness
Up to $4,999
$5,000 to $9,999
$10,000 to $14,999
$15,000 to $19,999
> $20,000
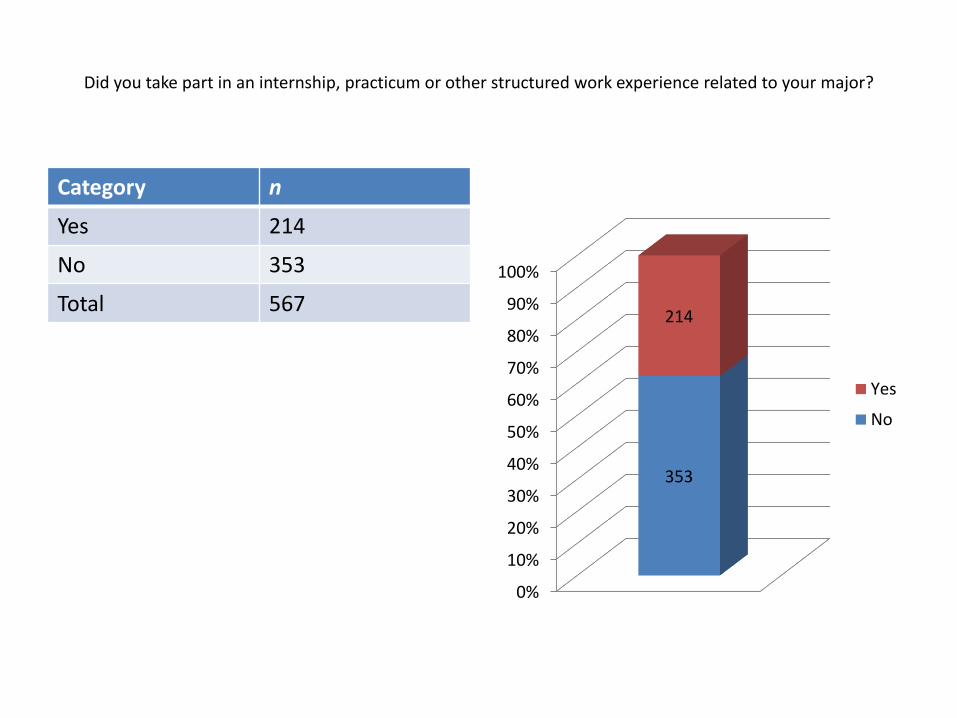
Did you take part in an internship, practicum or other structured work experience related to your major?
Category n
Yes 214
No 353
Total 567
0%
10%
20%
30%
40%
50%
60%
70%
80%
90%
100%
353
214
Yes
No
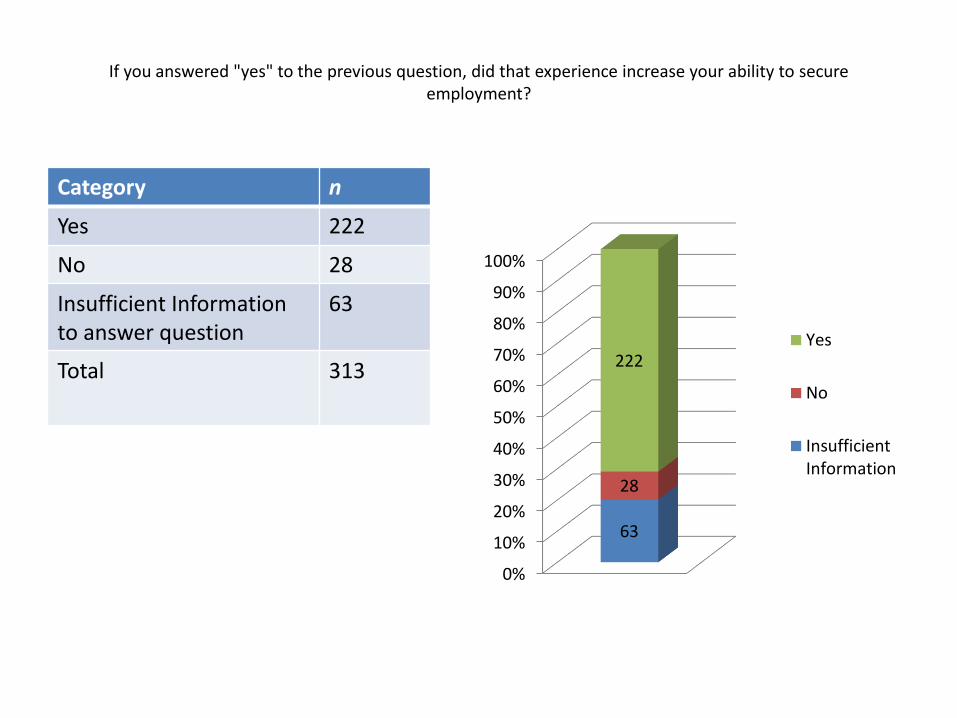
If you answered "yes" to the previous question, did that experience increase your ability to secureemployment?
Category n
Yes 222
No 28
Insufficient Information to answer question
63
Total 313
0%
10%
20%
30%
40%
50%
60%
70%
80%
90%
100%
63
28
222Yes
No
InsufficientInformation
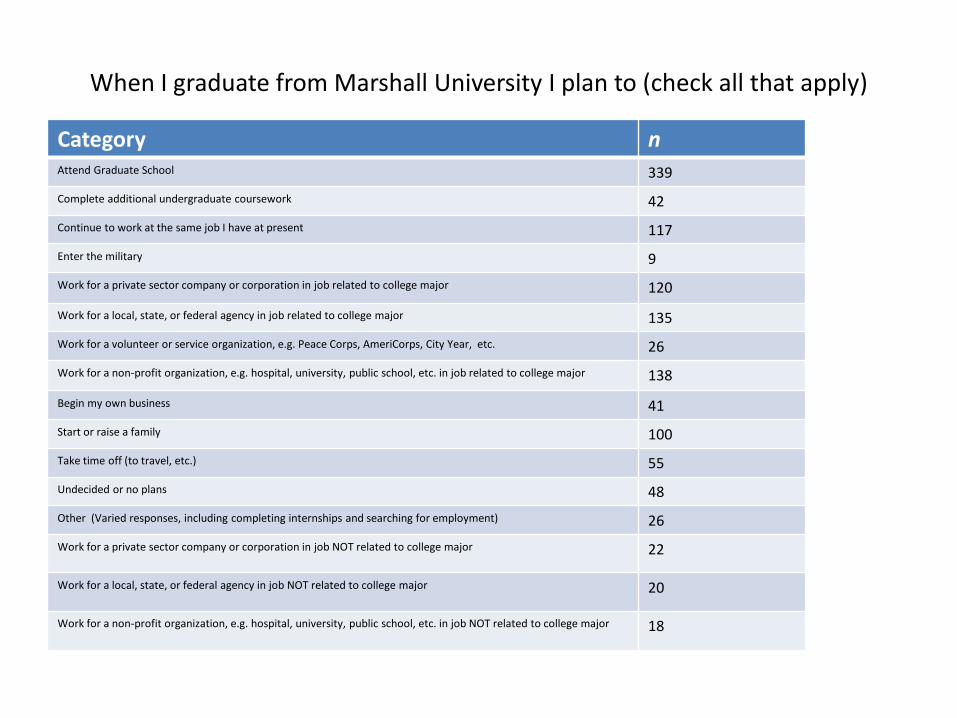
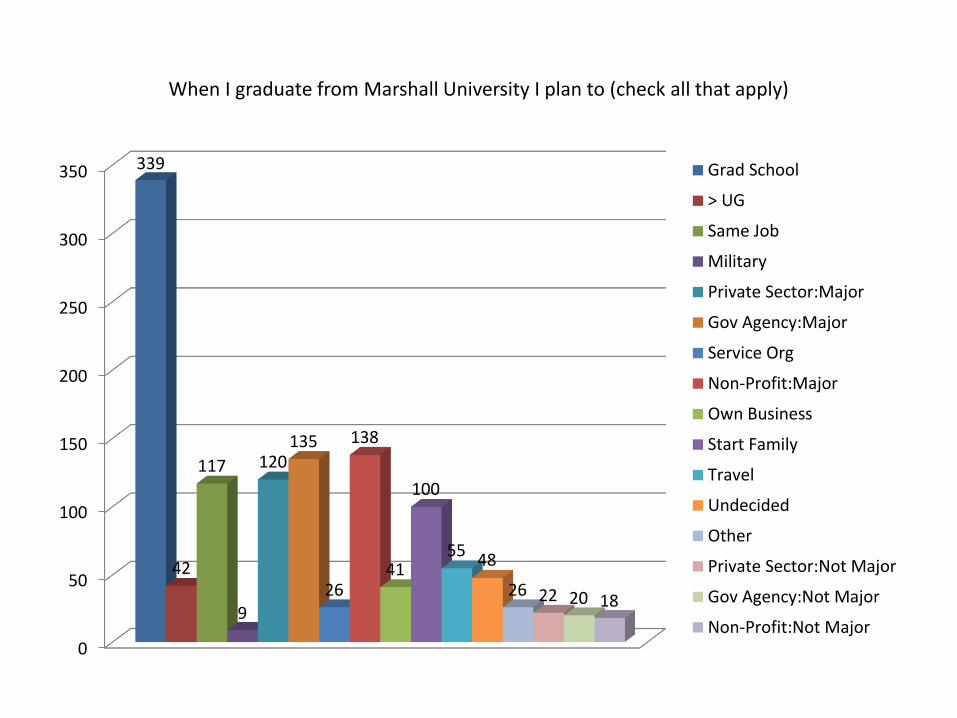
When I graduate from Marshall University I plan to (check all that apply)
Category nAttend Graduate School 339
Complete additional undergraduate coursework 42
Continue to work at the same job I have at present 117
Enter the military 9
Work for a private sector company or corporation in job related to college major 120
Work for a local, state, or federal agency in job related to college major 135
Work for a volunteer or service organization, e.g. Peace Corps, AmeriCorps, City Year, etc. 26
Work for a non-profit organization, e.g. hospital, university, public school, etc. in job related to college major 138
Begin my own business 41
Start or raise a family 100
Take time off (to travel, etc.) 55
Undecided or no plans 48
Other (Varied responses, including completing internships and searching for employment) 26
Work for a private sector company or corporation in job NOT related to college major 22
Work for a local, state, or federal agency in job NOT related to college major 20
Work for a non-profit organization, e.g. hospital, university, public school, etc. in job NOT related to college major 18
When I graduate from Marshall University I plan to (check all that apply)
0
50
100
150
200
250
300
350 339
42
117
9
120135
26
138
41
100
5548
26 22 20 18
Grad School
> UG
Same Job
Military
Private Sector:Major
Gov Agency:Major
Service Org
Non-Profit:Major
Own Business
Start Family
Travel
Undecided
Other
Private Sector:Not Major
Gov Agency:Not Major
Non-Profit:Not Major
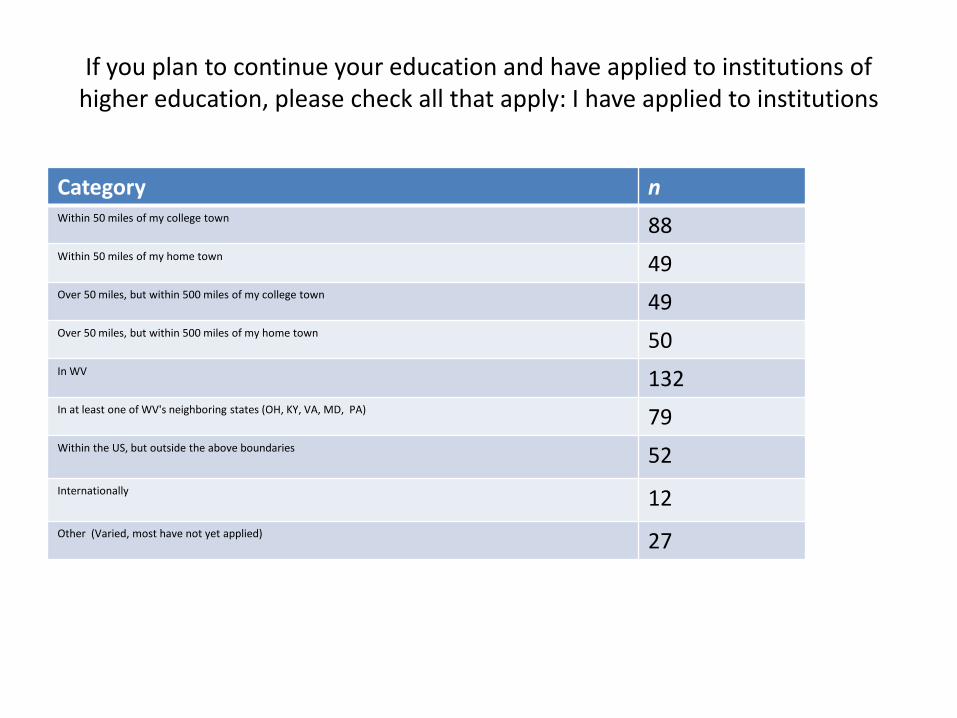
If you plan to continue your education and have applied to institutions of higher education, please check all that apply: I have applied to institutions
Category nWithin 50 miles of my college town 88Within 50 miles of my home town 49Over 50 miles, but within 500 miles of my college town 49Over 50 miles, but within 500 miles of my home town 50In WV 132In at least one of WV's neighboring states (OH, KY, VA, MD, PA) 79Within the US, but outside the above boundaries 52
Internationally 12
Other (Varied, most have not yet applied) 27
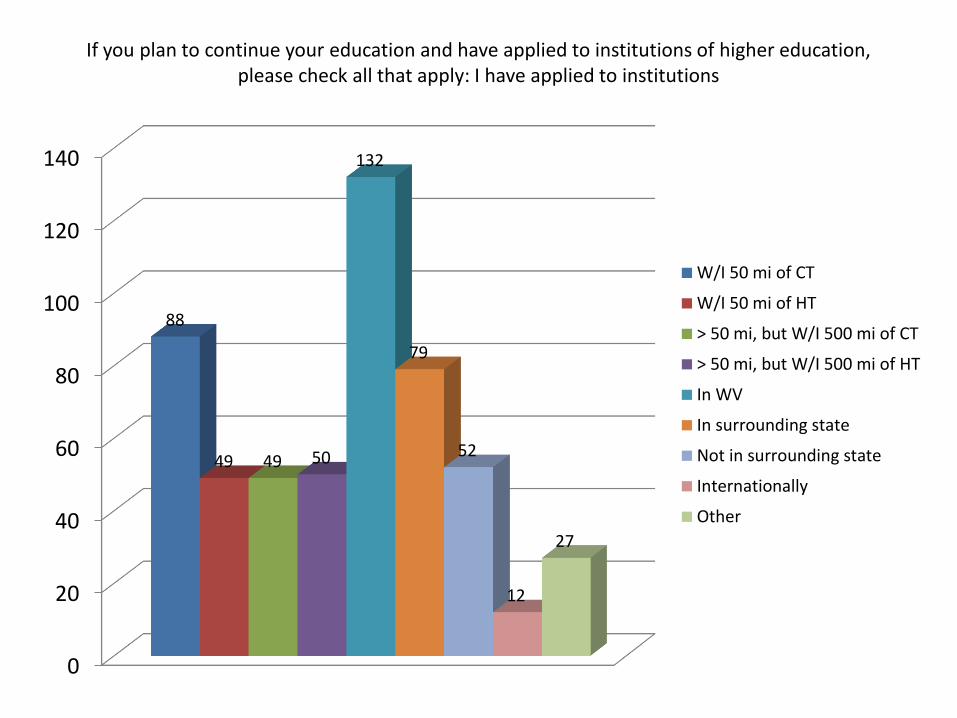
If you plan to continue your education and have applied to institutions of higher education, please check all that apply: I have applied to institutions
0
20
40
60
80
100
120
140
88
49 49 50
132
79
52
12
27
W/I 50 mi of CT
W/I 50 mi of HT
> 50 mi, but W/I 500 mi of CT
> 50 mi, but W/I 500 mi of HT
In WV
In surrounding state
Not in surrounding state
Internationally
Other
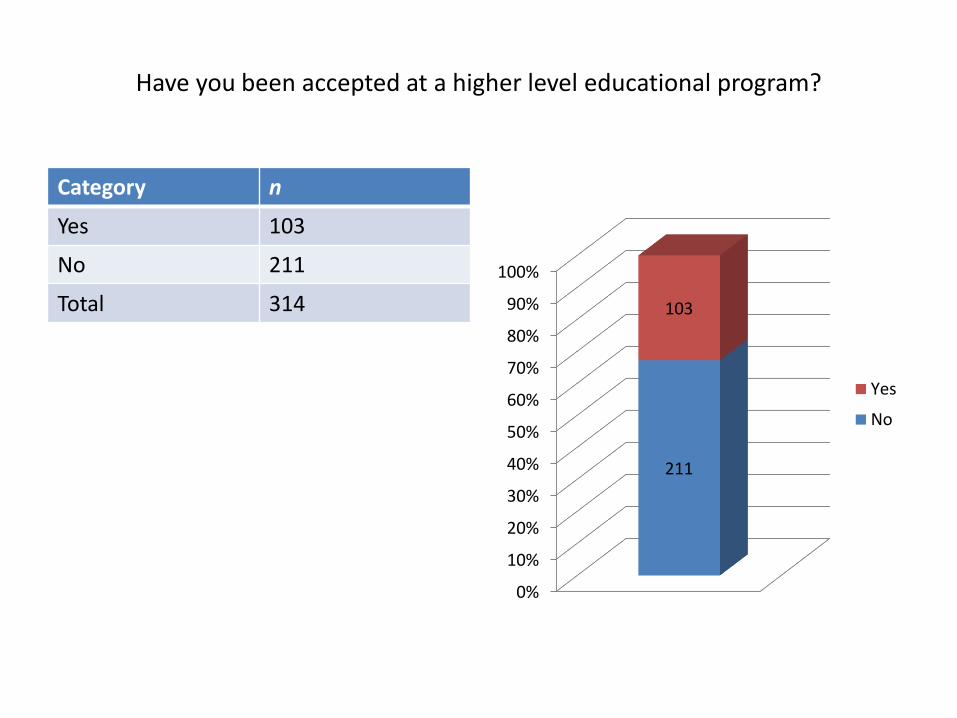
Have you been accepted at a higher level educational program?
Category n
Yes 103
No 211
Total 314
0%
10%
20%
30%
40%
50%
60%
70%
80%
90%
100%
211
103
Yes
No
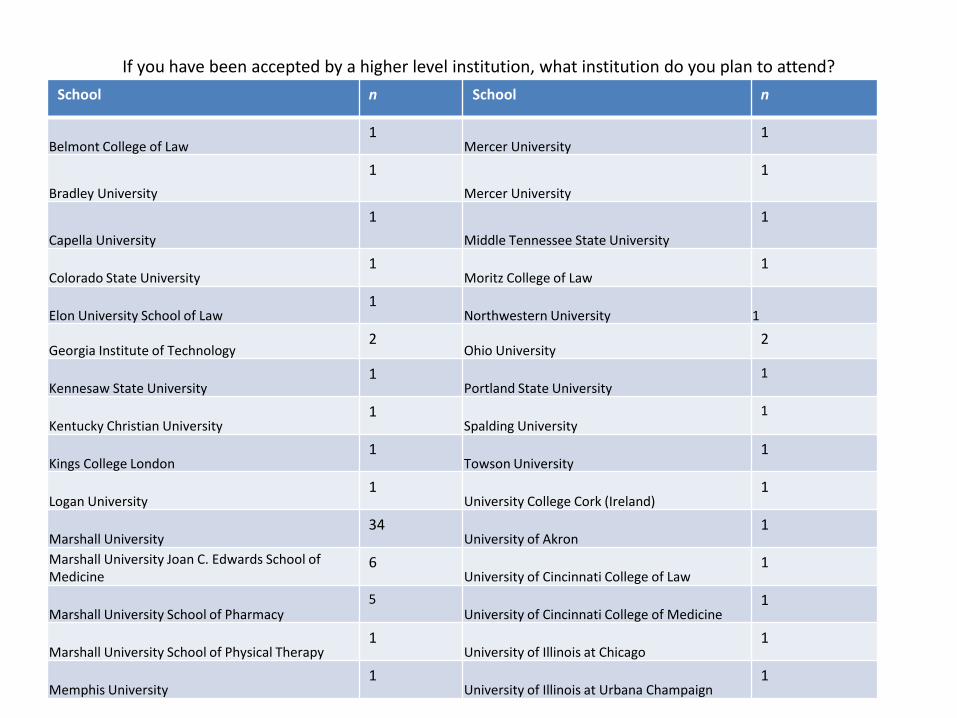
If you have been accepted by a higher level institution, what institution do you plan to attend?
School n School n
Belmont College of Law1
Mercer University1
Bradley University
1
Mercer University
1
Capella University
1
Middle Tennessee State University
1
Colorado State University1
Moritz College of Law1
Elon University School of Law1
Northwestern University 1
Georgia Institute of Technology2
Ohio University2
Kennesaw State University1
Portland State University1
Kentucky Christian University1
Spalding University1
Kings College London1
Towson University1
Logan University1
University College Cork (Ireland)1
Marshall University34
University of Akron1
Marshall University Joan C. Edwards School of Medicine
6University of Cincinnati College of Law
1
Marshall University School of Pharmacy5
University of Cincinnati College of Medicine1
Marshall University School of Physical Therapy1
University of Illinois at Chicago1
Memphis University1
University of Illinois at Urbana Champaign1
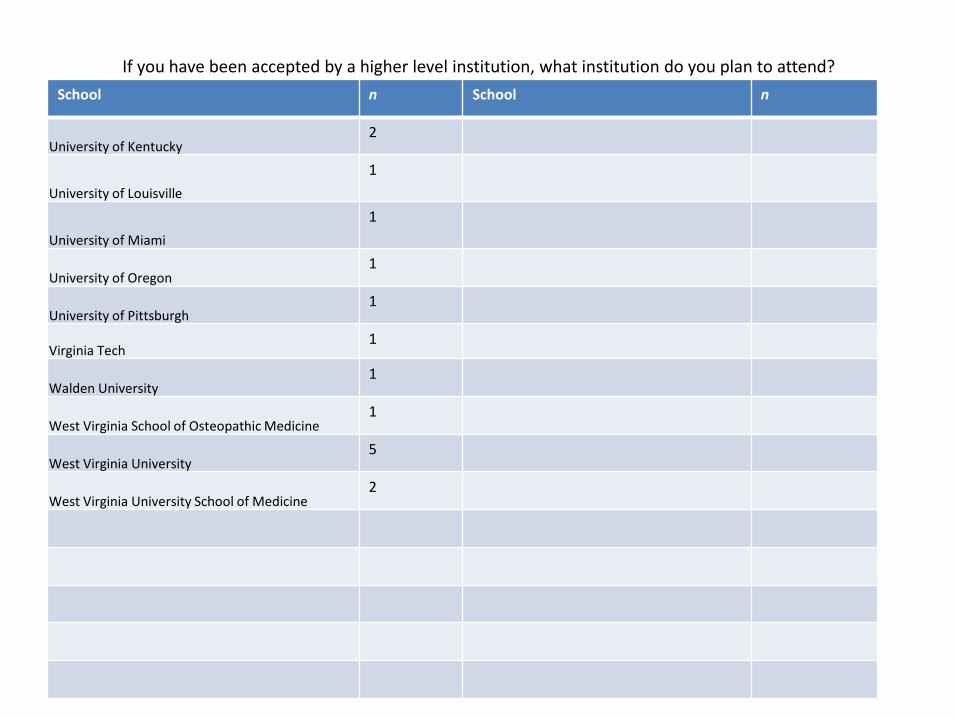
If you have been accepted by a higher level institution, what institution do you plan to attend?
School n School n
University of Kentucky2
University of Louisville
1
University of Miami
1
University of Oregon1
University of Pittsburgh1
Virginia Tech1
Walden University1
West Virginia School of Osteopathic Medicine1
West Virginia University5
West Virginia University School of Medicine2
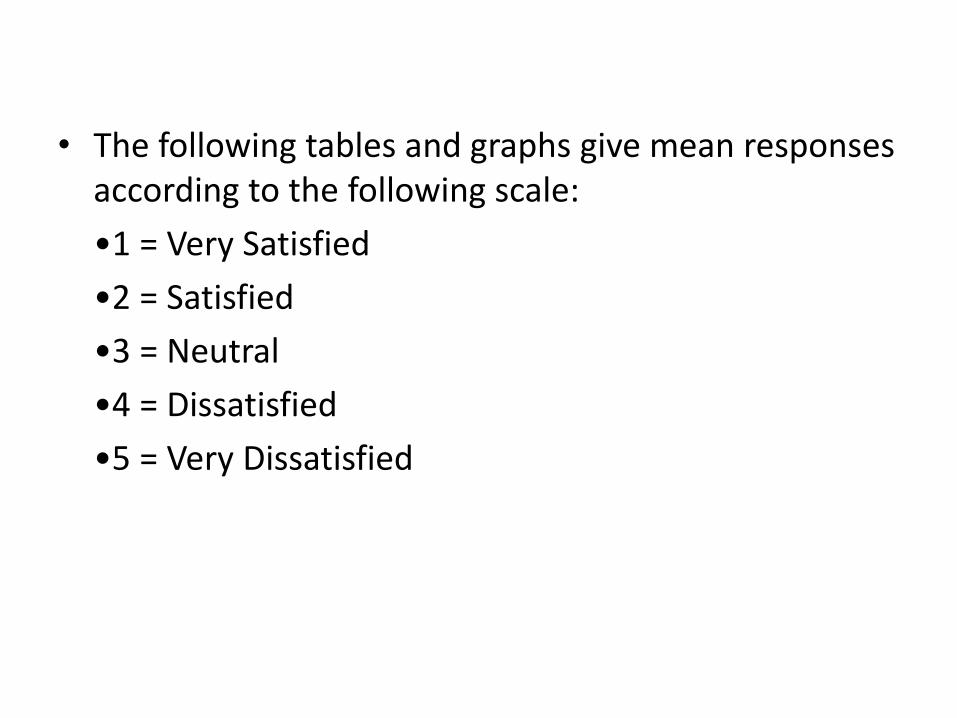
• The following tables and graphs give mean responses according to the following scale:
•1 = Strongly Agree
•2 = Agree
•3 = Neither Agree nor Disagree
•4 = Disagree
•5 = Strongly Disagree
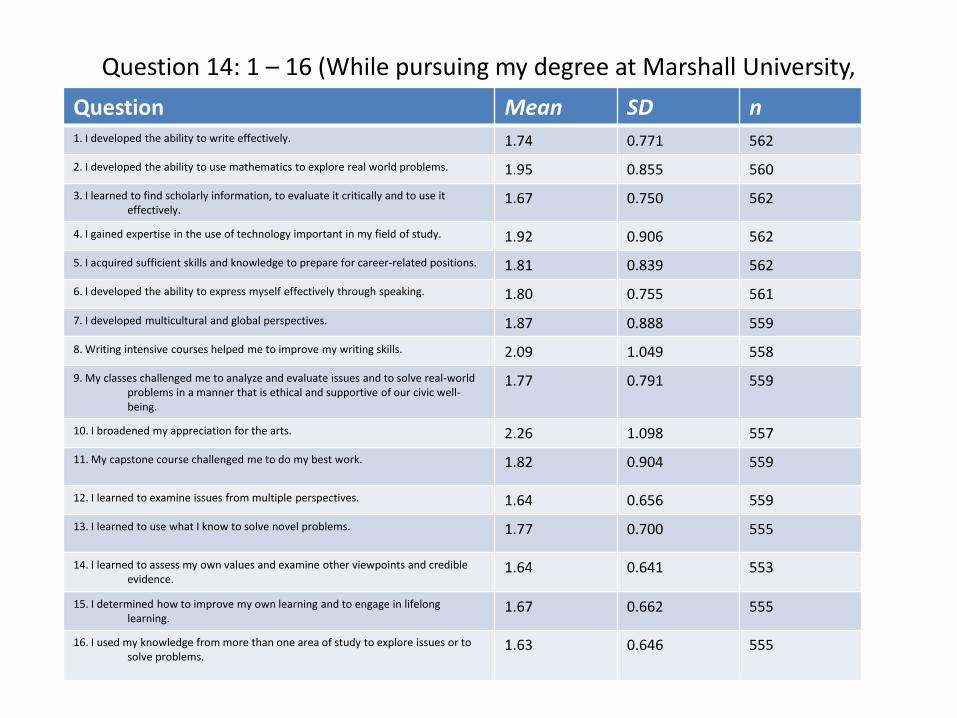
Question 14: 1 – 16 (While pursuing my degree at Marshall University,
Question Mean SD n1. I developed the ability to write effectively. 1.74 0.771 562
2. I developed the ability to use mathematics to explore real world problems. 1.95 0.855 560
3. I learned to find scholarly information, to evaluate it critically and to use it effectively.
1.67 0.750 562
4. I gained expertise in the use of technology important in my field of study. 1.92 0.906 562
5. I acquired sufficient skills and knowledge to prepare for career-related positions. 1.81 0.839 562
6. I developed the ability to express myself effectively through speaking. 1.80 0.755 561
7. I developed multicultural and global perspectives. 1.87 0.888 559
8. Writing intensive courses helped me to improve my writing skills. 2.09 1.049 558
9. My classes challenged me to analyze and evaluate issues and to solve real-world problems in a manner that is ethical and supportive of our civic well-being.
1.77 0.791 559
10. I broadened my appreciation for the arts. 2.26 1.098 557
11. My capstone course challenged me to do my best work. 1.82 0.904 559
12. I learned to examine issues from multiple perspectives. 1.64 0.656 559
13. I learned to use what I know to solve novel problems. 1.77 0.700 555
14. I learned to assess my own values and examine other viewpoints and credible evidence.
1.64 0.641 553
15. I determined how to improve my own learning and to engage in lifelong learning.
1.67 0.662 555
16. I used my knowledge from more than one area of study to explore issues or to solve problems.
1.63 0.646 555
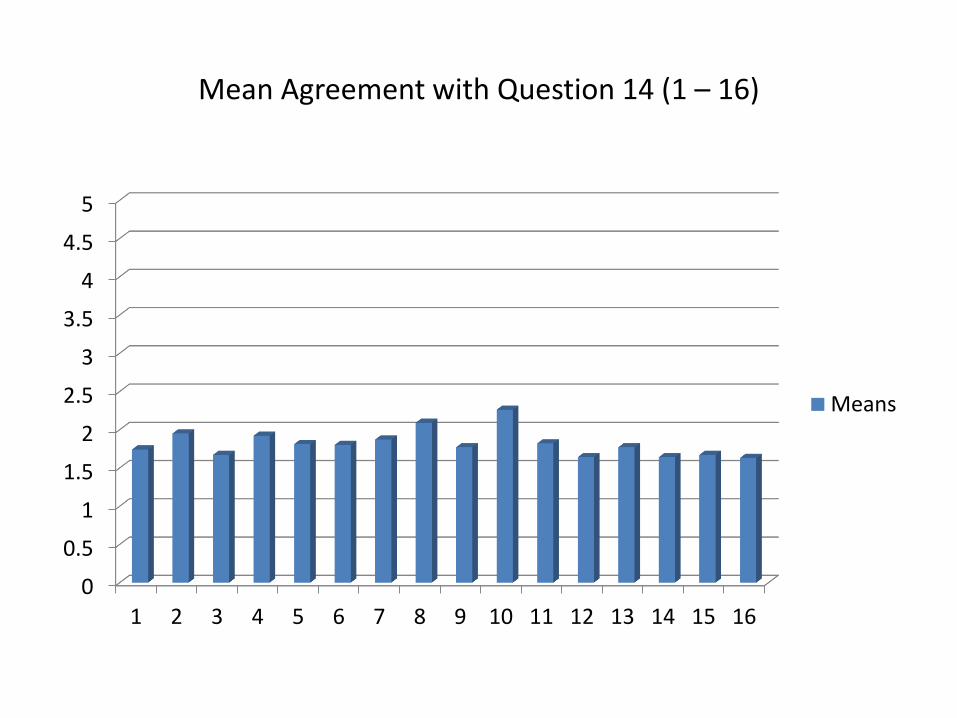
Mean Agreement with Question 14 (1 – 16)
0
0.5
1
1.5
2
2.5
3
3.5
4
4.5
5
1 2 3 4 5 6 7 8 9 10 11 12 13 14 15 16
Means
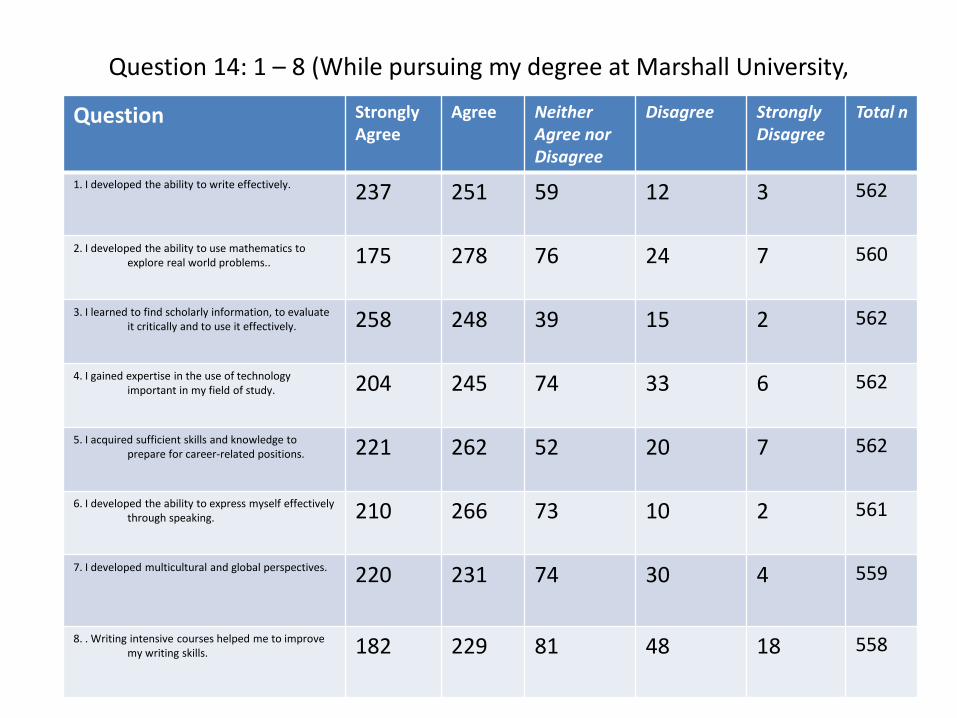
Question 14: 1 – 8 (While pursuing my degree at Marshall University,
Question StronglyAgree
Agree NeitherAgree nor Disagree
Disagree Strongly Disagree
Total n
1. I developed the ability to write effectively. 237 251 59 12 3 562
2. I developed the ability to use mathematics to explore real world problems.. 175 278 76 24 7 560
3. I learned to find scholarly information, to evaluate it critically and to use it effectively. 258 248 39 15 2 562
4. I gained expertise in the use of technology important in my field of study. 204 245 74 33 6 562
5. I acquired sufficient skills and knowledge to prepare for career-related positions. 221 262 52 20 7 562
6. I developed the ability to express myself effectively through speaking. 210 266 73 10 2 561
7. I developed multicultural and global perspectives. 220 231 74 30 4 559
8. . Writing intensive courses helped me to improve my writing skills. 182 229 81 48 18 558
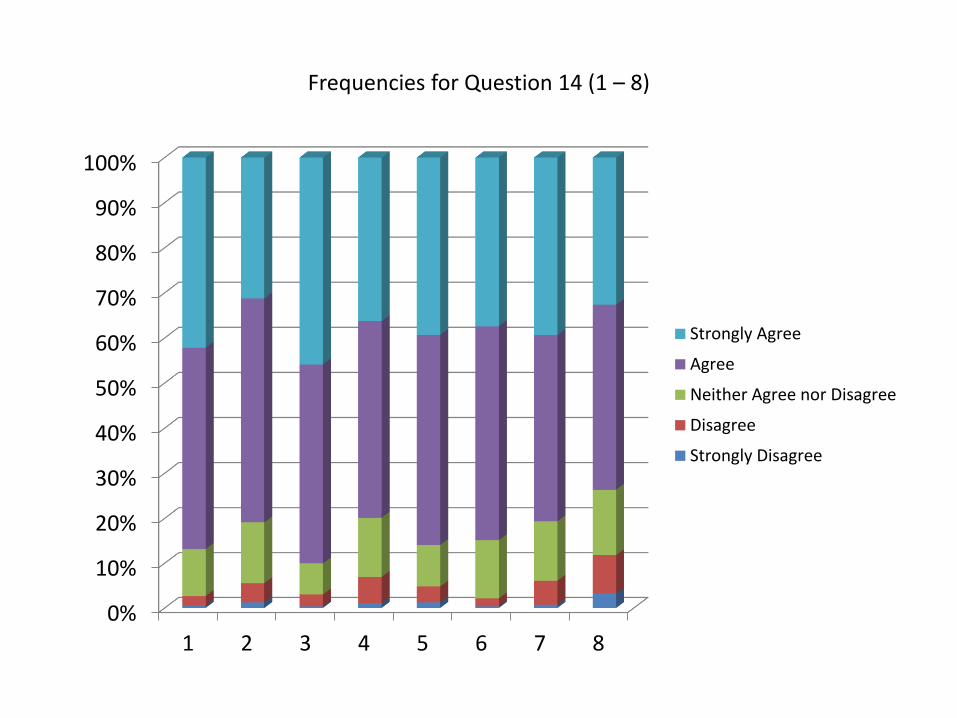
Frequencies for Question 14 (1 – 8)
0%
10%
20%
30%
40%
50%
60%
70%
80%
90%
100%
1 2 3 4 5 6 7 8
Strongly Agree
Agree
Neither Agree nor Disagree
Disagree
Strongly Disagree
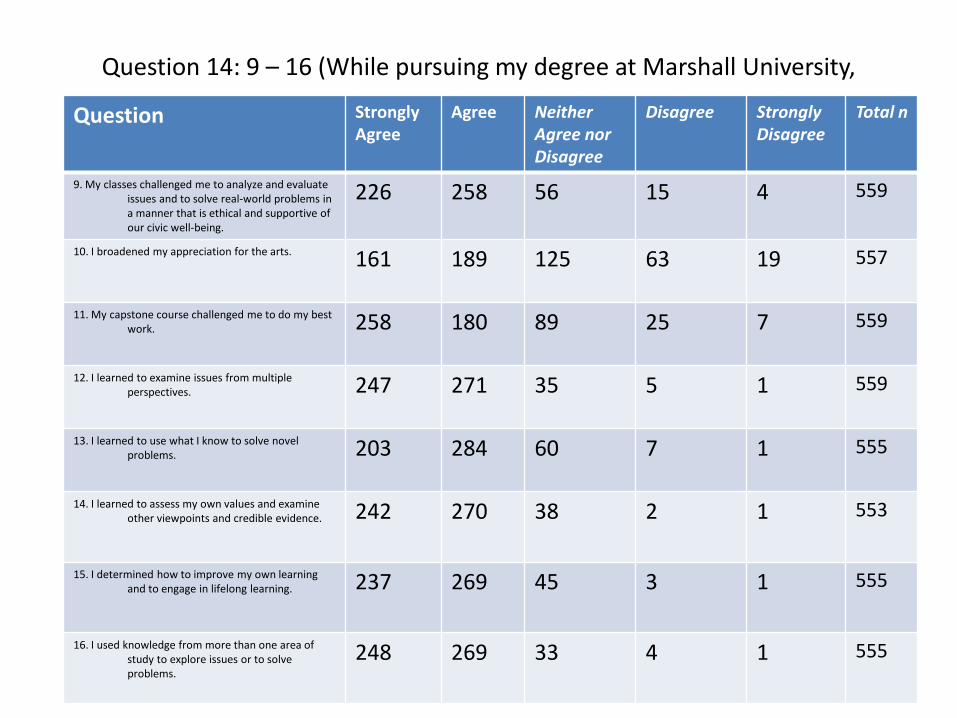
Question 14: 9 – 16 (While pursuing my degree at Marshall University,
Question StronglyAgree
Agree NeitherAgree nor Disagree
Disagree Strongly Disagree
Total n
9. My classes challenged me to analyze and evaluate issues and to solve real-world problems in a manner that is ethical and supportive of our civic well-being.
226 258 56 15 4 559
10. I broadened my appreciation for the arts. 161 189 125 63 19 557
11. My capstone course challenged me to do my best work. 258 180 89 25 7 559
12. I learned to examine issues from multiple perspectives. 247 271 35 5 1 559
13. I learned to use what I know to solve novel problems. 203 284 60 7 1 555
14. I learned to assess my own values and examine other viewpoints and credible evidence. 242 270 38 2 1 553
15. I determined how to improve my own learning and to engage in lifelong learning. 237 269 45 3 1 555
16. I used knowledge from more than one area of study to explore issues or to solve problems.
248 269 33 4 1 555
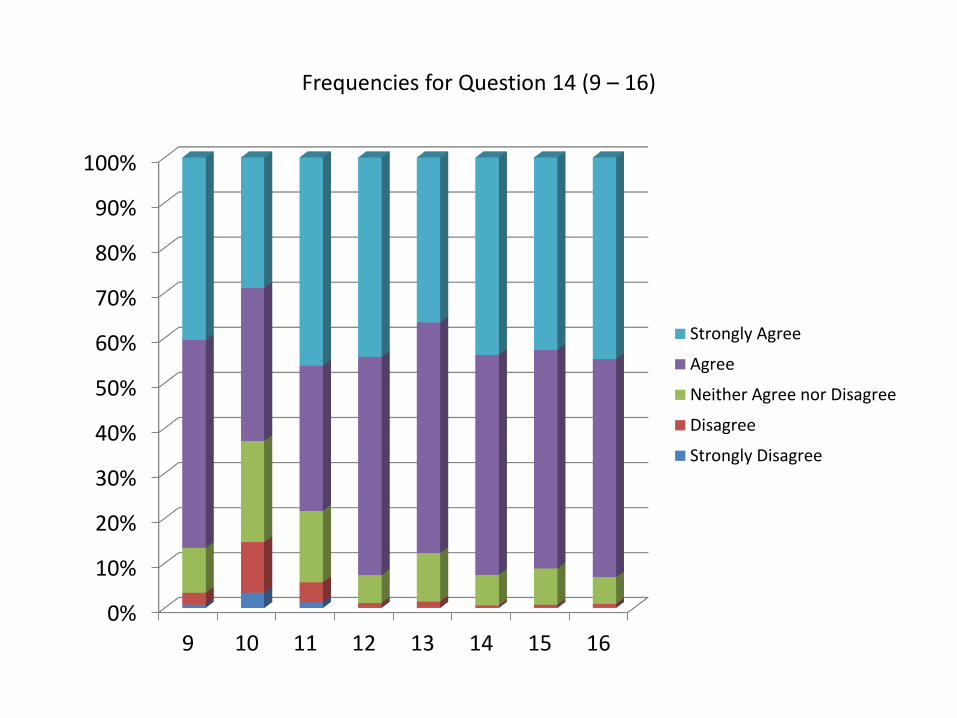
Frequencies for Question 14 (9 – 16)
0%
10%
20%
30%
40%
50%
60%
70%
80%
90%
100%
9 10 11 12 13 14 15 16
Strongly Agree
Agree
Neither Agree nor Disagree
Disagree
Strongly Disagree
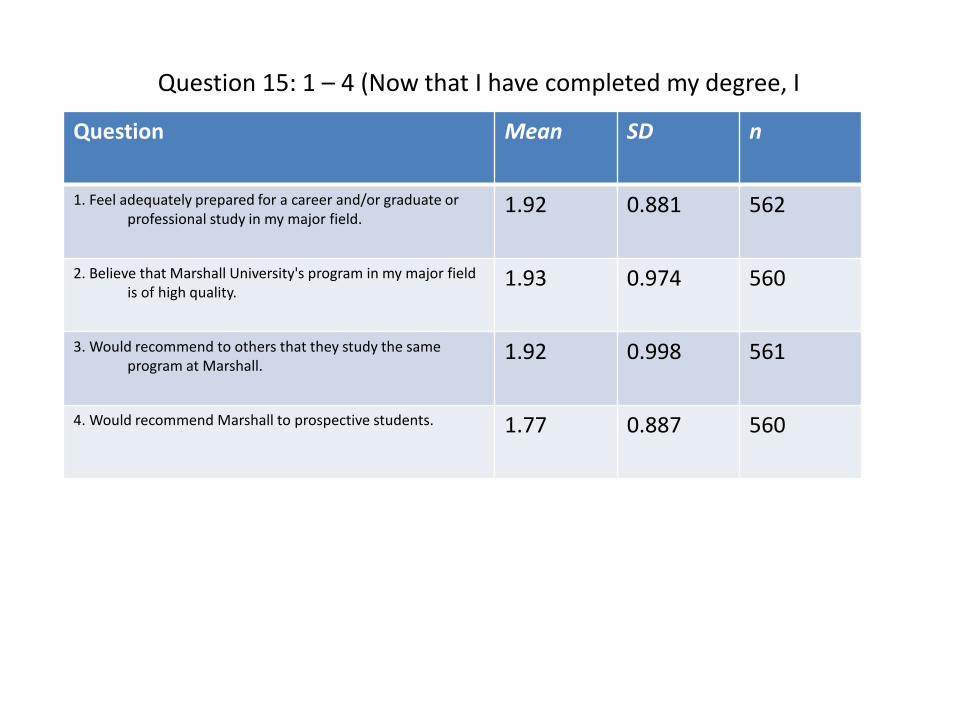
Question 15: 1 – 4 (Now that I have completed my degree, I
Question Mean SD n
1. Feel adequately prepared for a career and/or graduate or professional study in my major field.
1.92 0.881 562
2. Believe that Marshall University's program in my major field is of high quality.
1.93 0.974 560
3. Would recommend to others that they study the same program at Marshall.
1.92 0.998 561
4. Would recommend Marshall to prospective students. 1.77 0.887 560
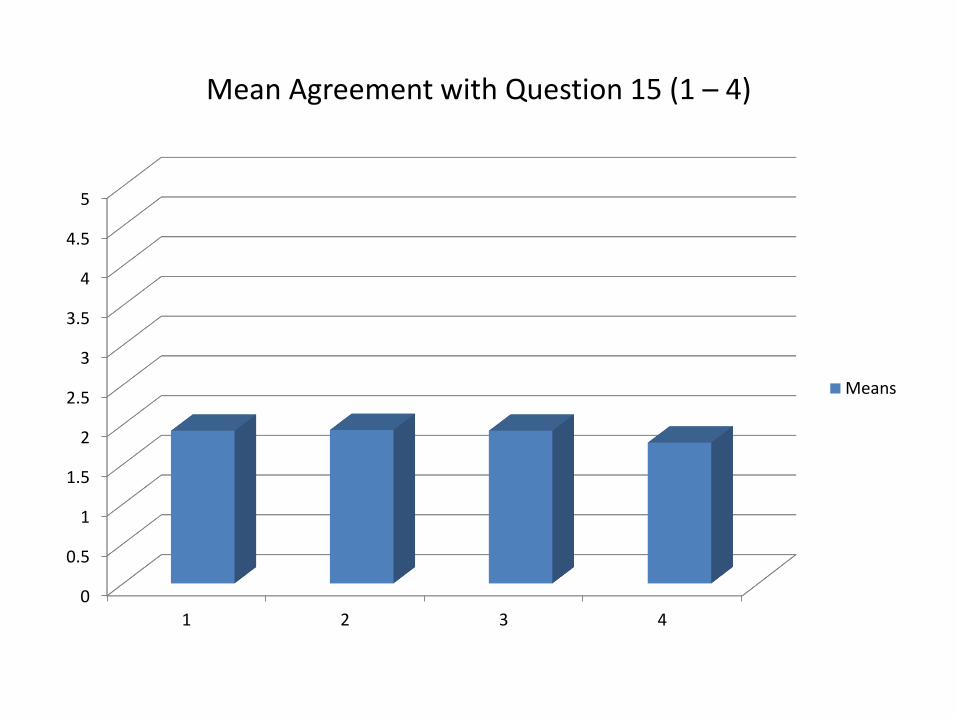
Mean Agreement with Question 15 (1 – 4)
0
0.5
1
1.5
2
2.5
3
3.5
4
4.5
5
1 2 3 4
Means
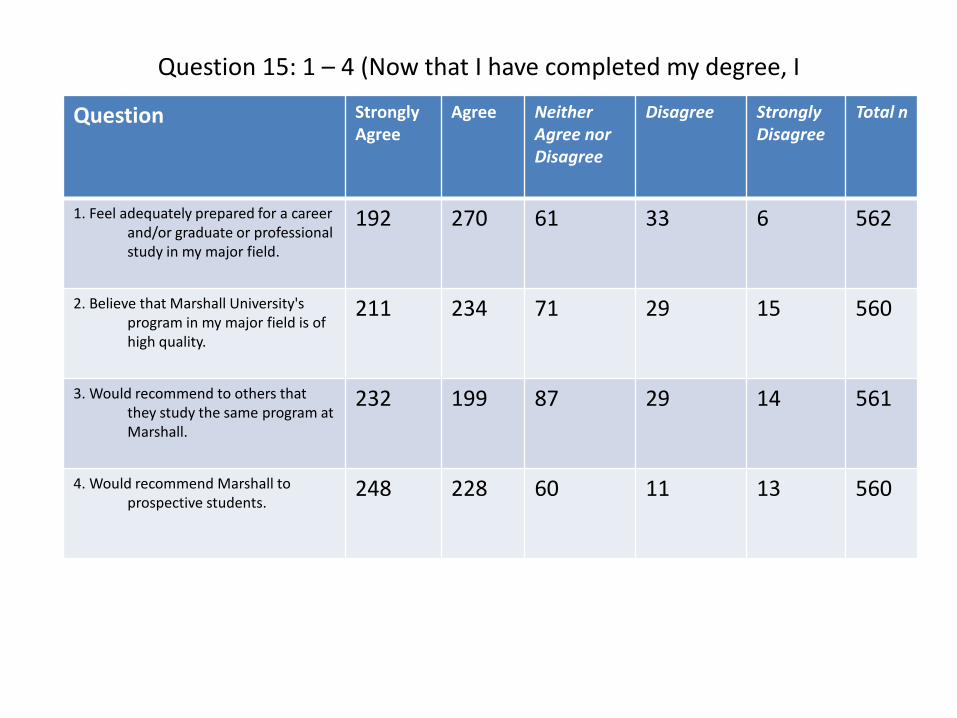
Question 15: 1 – 4 (Now that I have completed my degree, I
Question StronglyAgree
Agree NeitherAgree nor Disagree
Disagree Strongly Disagree
Total n
1. Feel adequately prepared for a career and/or graduate or professional study in my major field.
192 270 61 33 6 562
2. Believe that Marshall University's program in my major field is of high quality.
211 234 71 29 15 560
3. Would recommend to others that they study the same program at Marshall.
232 199 87 29 14 561
4. Would recommend Marshall to prospective students.
248 228 60 11 13 560
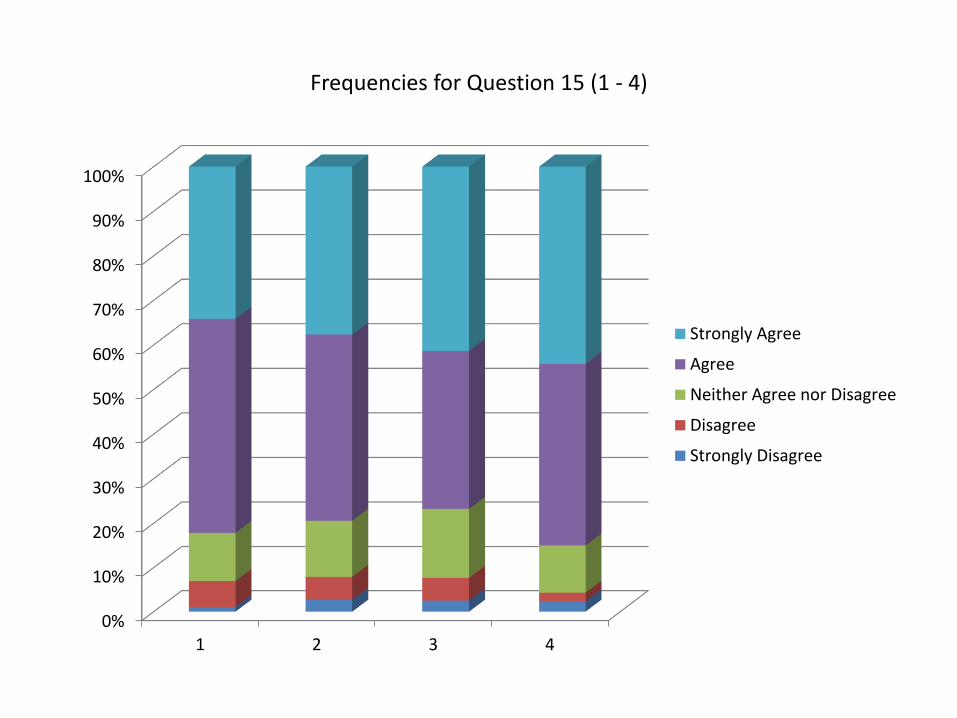
Frequencies for Question 15 (1 - 4)
0%
10%
20%
30%
40%
50%
60%
70%
80%
90%
100%
1 2 3 4
Strongly Agree
Agree
Neither Agree nor Disagree
Disagree
Strongly Disagree
• The following tables and graphs give mean responses according to the following scale:
•1 = Very Satisfied
•2 = Satisfied
•3 = Neutral
•4 = Dissatisfied
•5 = Very Dissatisfied
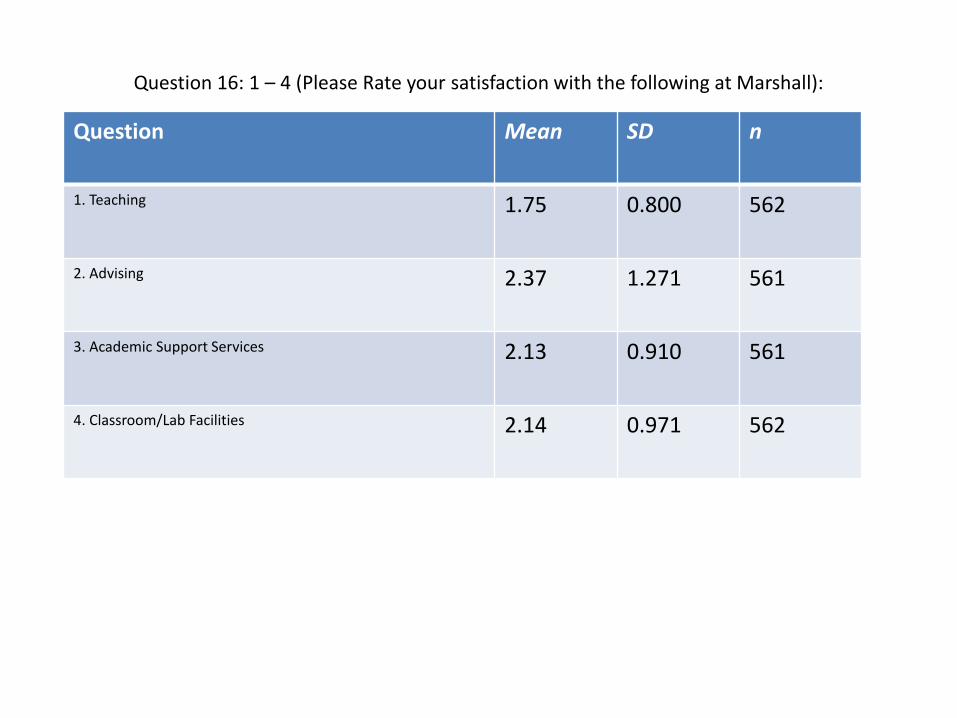
Question 16: 1 – 4 (Please Rate your satisfaction with the following at Marshall):
Question Mean SD n
1. Teaching 1.75 0.800 562
2. Advising 2.37 1.271 561
3. Academic Support Services 2.13 0.910 561
4. Classroom/Lab Facilities 2.14 0.971 562
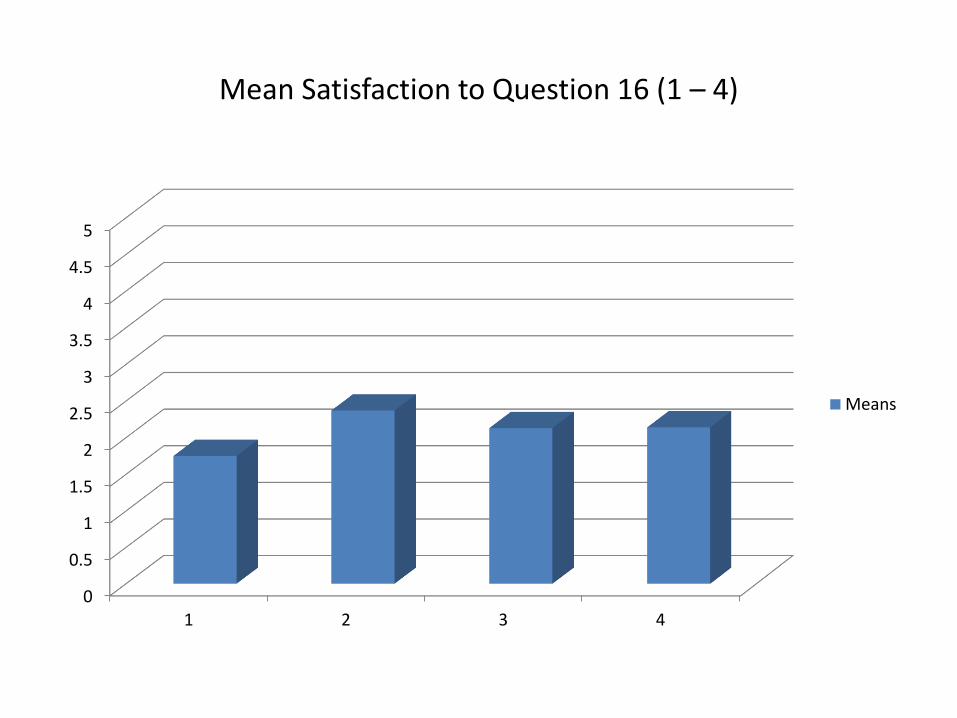
Mean Satisfaction to Question 16 (1 – 4)
0
0.5
1
1.5
2
2.5
3
3.5
4
4.5
5
1 2 3 4
Means
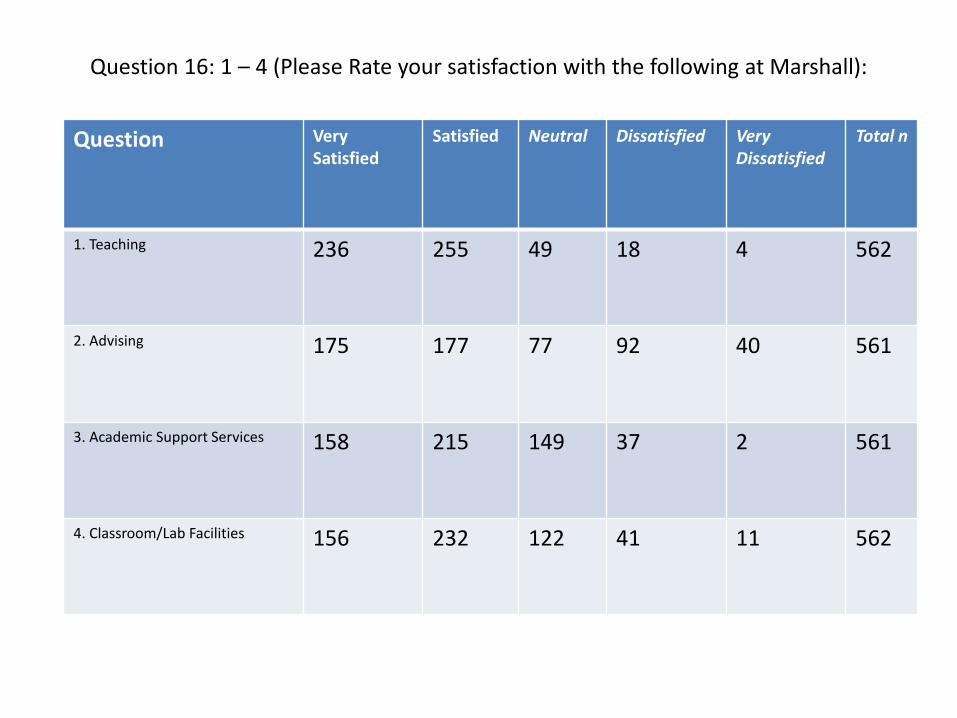
Question 16: 1 – 4 (Please Rate your satisfaction with the following at Marshall):
Question VerySatisfied
Satisfied Neutral Dissatisfied Very Dissatisfied
Total n
1. Teaching 236 255 49 18 4 562
2. Advising 175 177 77 92 40 561
3. Academic Support Services 158 215 149 37 2 561
4. Classroom/Lab Facilities 156 232 122 41 11 562
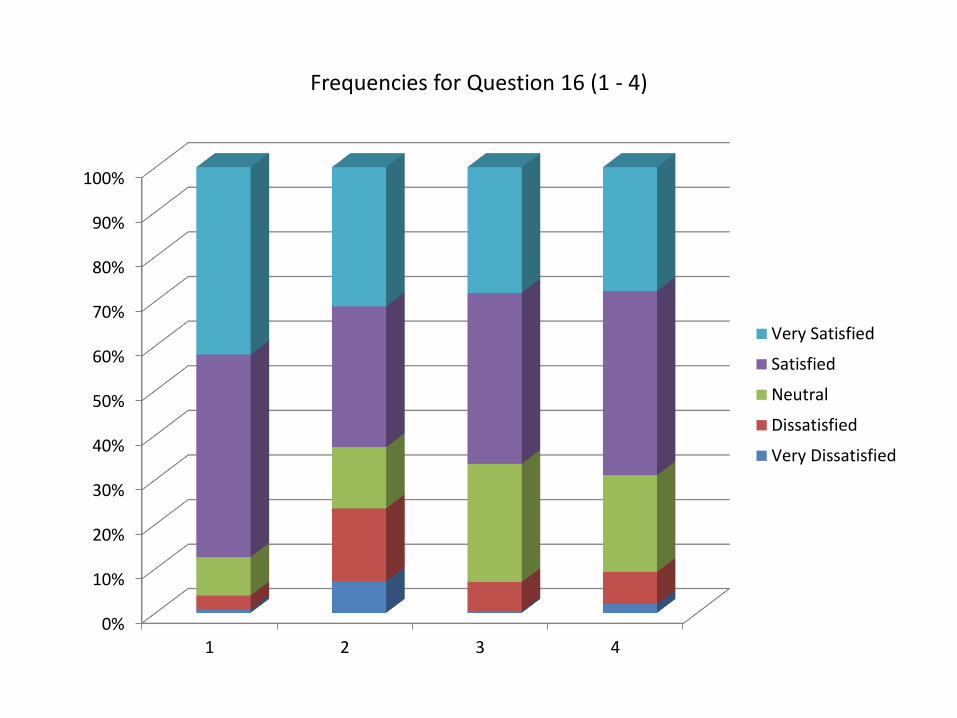
Frequencies for Question 16 (1 - 4)
0%
10%
20%
30%
40%
50%
60%
70%
80%
90%
100%
1 2 3 4
Very Satisfied
Satisfied
Neutral
Dissatisfied
Very Dissatisfied
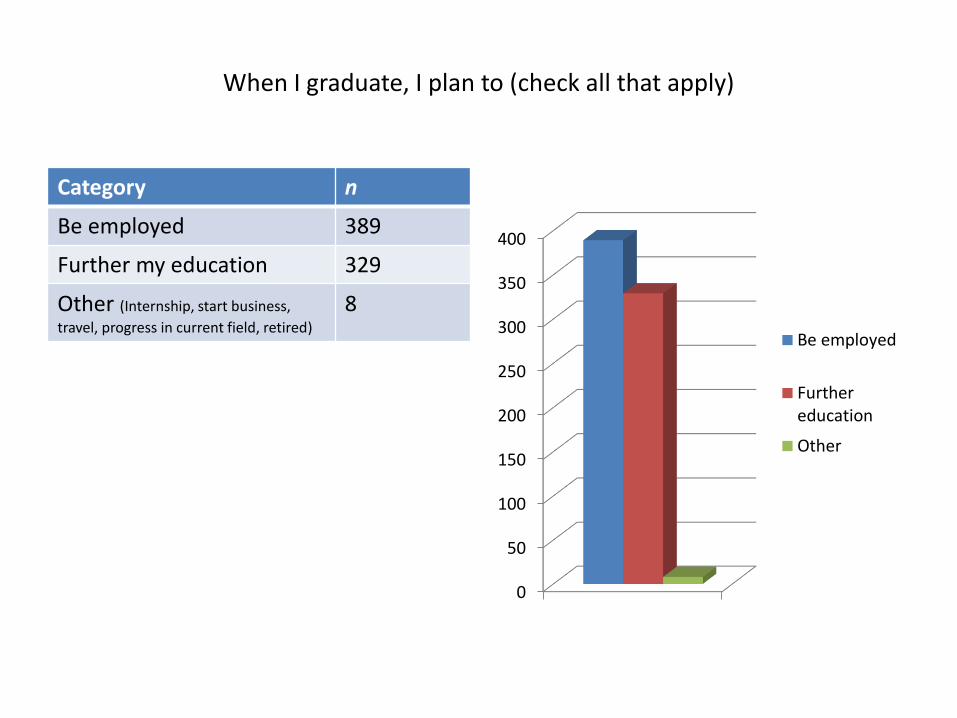
When I graduate, I plan to (check all that apply)
Category n
Be employed 389
Further my education 329
Other (Internship, start business,
travel, progress in current field, retired)
8
0
50
100
150
200
250
300
350
400
Be employed
Furthereducation
Other
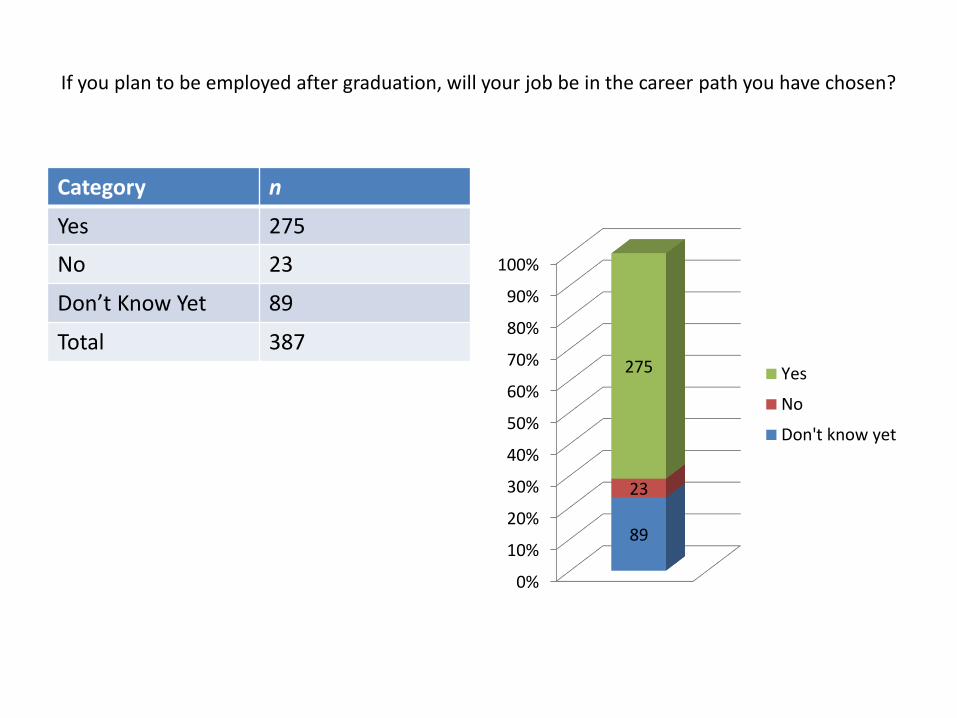
If you plan to be employed after graduation, will your job be in the career path you have chosen?
Category n
Yes 275
No 23
Don’t Know Yet 89
Total 387
0%
10%
20%
30%
40%
50%
60%
70%
80%
90%
100%
89
23
275 Yes
No
Don't know yet
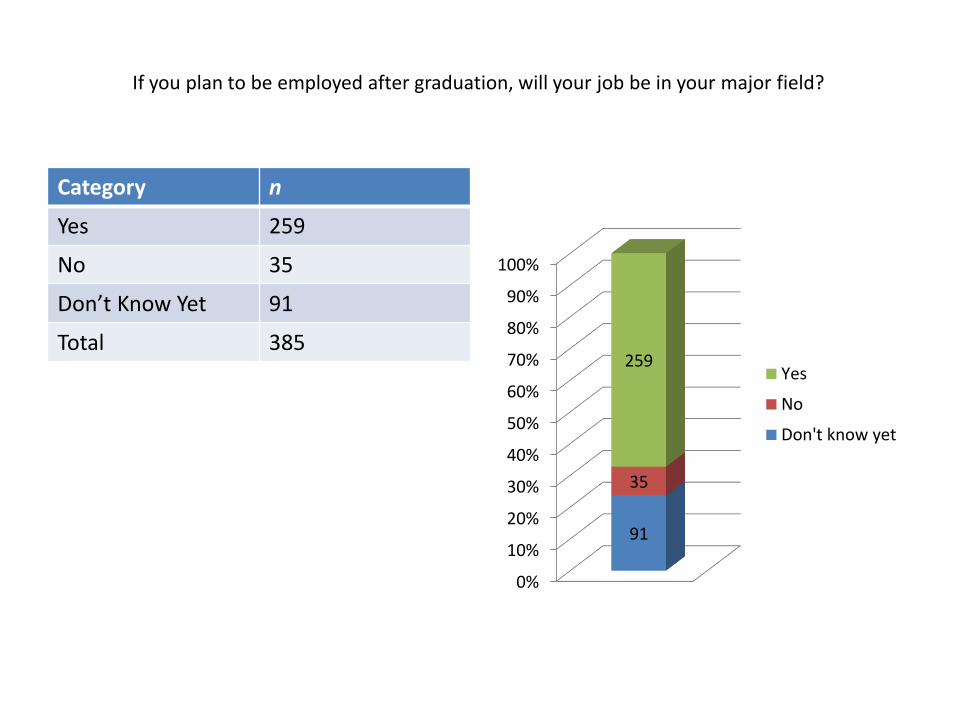
If you plan to be employed after graduation, will your job be in your major field?
Category n
Yes 259
No 35
Don’t Know Yet 91
Total 385
0%
10%
20%
30%
40%
50%
60%
70%
80%
90%
100%
91
35
259Yes
No
Don't know yet
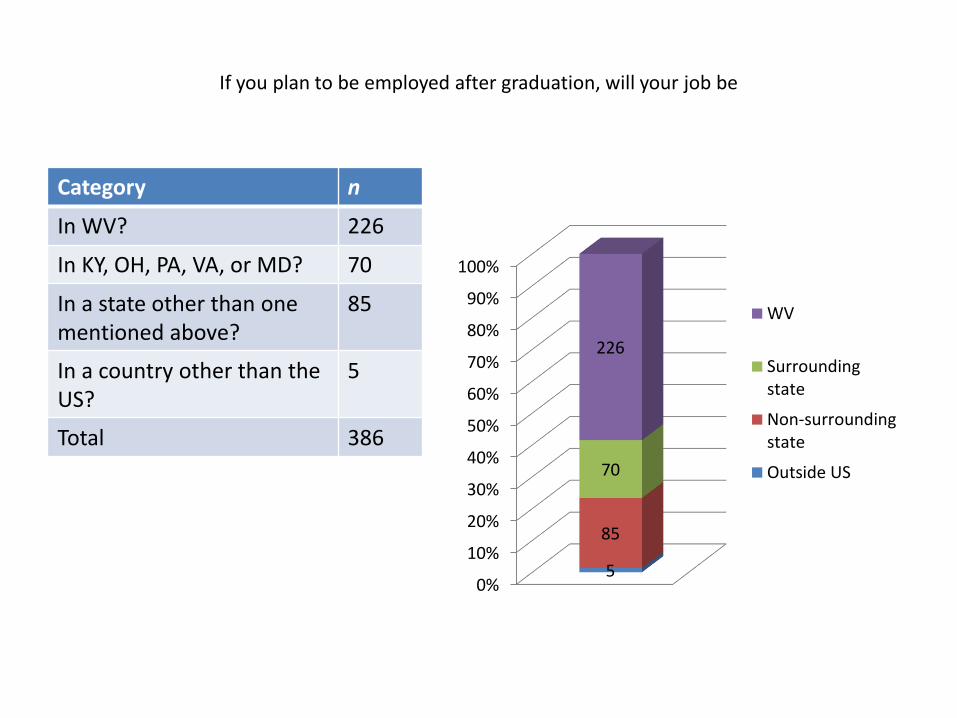
If you plan to be employed after graduation, will your job be
Category n
In WV? 226
In KY, OH, PA, VA, or MD? 70
In a state other than one mentioned above?
85
In a country other than the US?
5
Total 386
0%
10%
20%
30%
40%
50%
60%
70%
80%
90%
100%
5
85
70
226
WV
Surroundingstate
Non-surroundingstate
Outside US
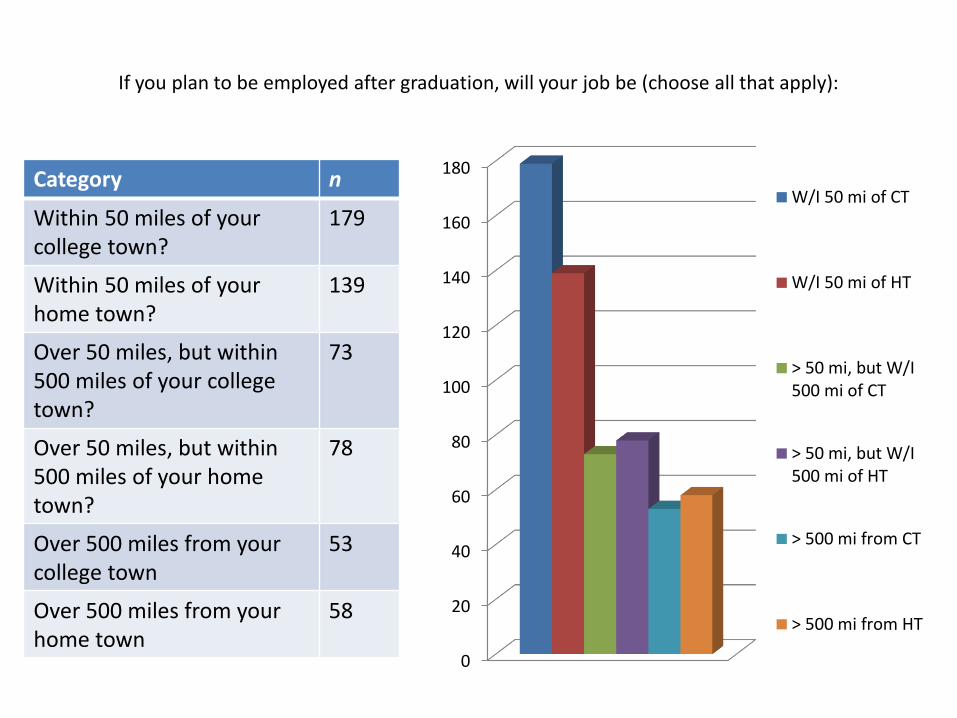
If you plan to be employed after graduation, will your job be (choose all that apply):
Category n
Within 50 miles of your college town?
179
Within 50 miles of your home town?
139
Over 50 miles, but within 500 miles of your college town?
73
Over 50 miles, but within 500 miles of your home town?
78
Over 500 miles from your college town
53
Over 500 miles from your home town
58
0
20
40
60
80
100
120
140
160
180
W/I 50 mi of CT
W/I 50 mi of HT
> 50 mi, but W/I500 mi of CT
> 50 mi, but W/I500 mi of HT
> 500 mi from CT
> 500 mi from HT
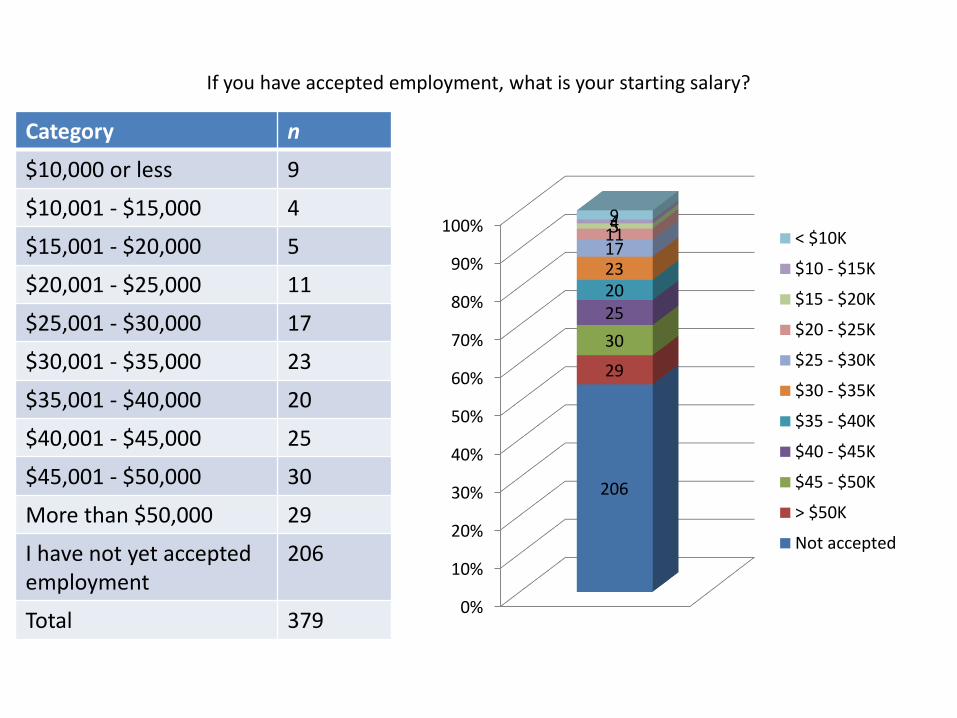
If you have accepted employment, what is your starting salary?
Category n
$10,000 or less 9
$10,001 - $15,000 4
$15,001 - $20,000 5
$20,001 - $25,000 11
$25,001 - $30,000 17
$30,001 - $35,000 23
$35,001 - $40,000 20
$40,001 - $45,000 25
$45,001 - $50,000 30
More than $50,000 29
I have not yet accepted employment
206
Total 3790%
10%
20%
30%
40%
50%
60%
70%
80%
90%
100%
206
29
30
2520231711549
< $10K
$10 - $15K
$15 - $20K
$20 - $25K
$25 - $30K
$30 - $35K
$35 - $40K
$40 - $45K
$45 - $50K
> $50K
Not accepted
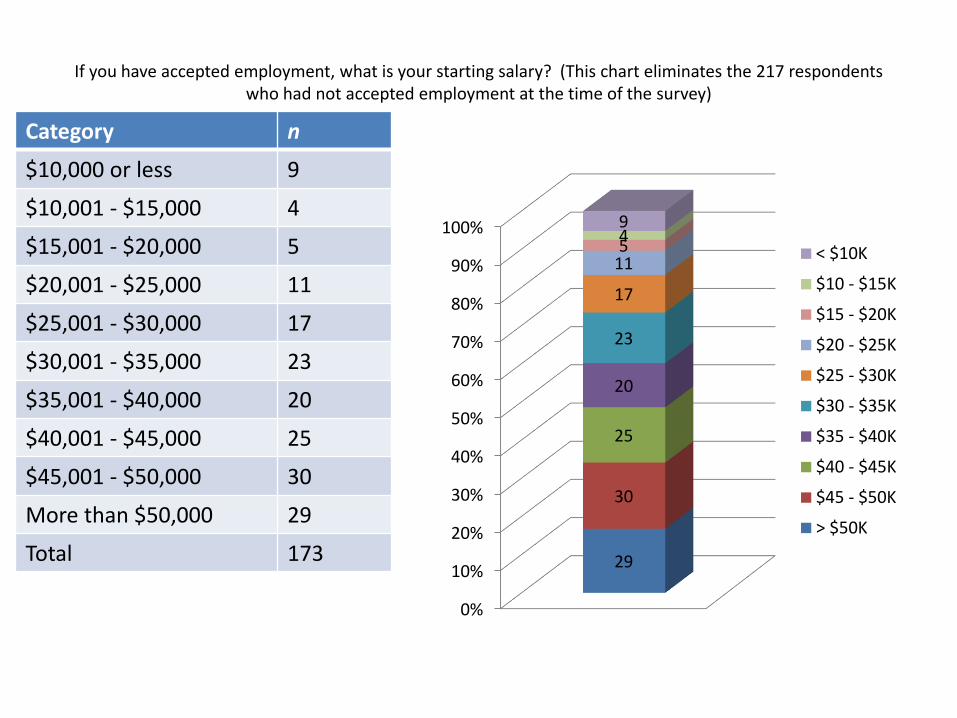
If you have accepted employment, what is your starting salary? (This chart eliminates the 217 respondents who had not accepted employment at the time of the survey)
Category n
$10,000 or less 9
$10,001 - $15,000 4
$15,001 - $20,000 5
$20,001 - $25,000 11
$25,001 - $30,000 17
$30,001 - $35,000 23
$35,001 - $40,000 20
$40,001 - $45,000 25
$45,001 - $50,000 30
More than $50,000 29
Total 173
0%
10%
20%
30%
40%
50%
60%
70%
80%
90%
100%
29
30
25
20
23
17
11549
< $10K
$10 - $15K
$15 - $20K
$20 - $25K
$25 - $30K
$30 - $35K
$35 - $40K
$40 - $45K
$45 - $50K
> $50K
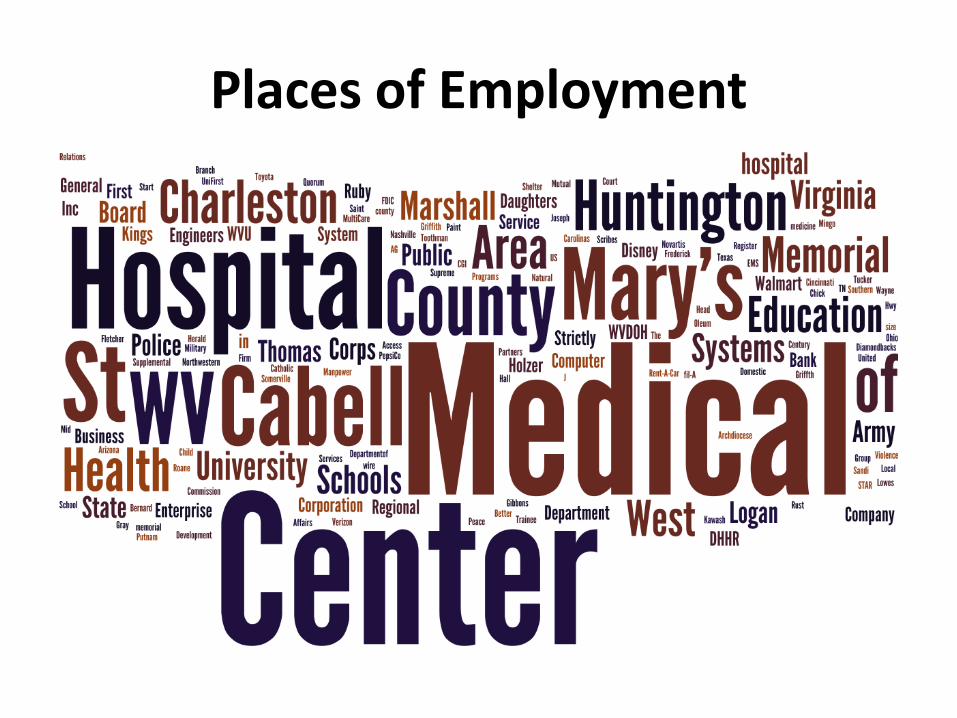
Places of Employment
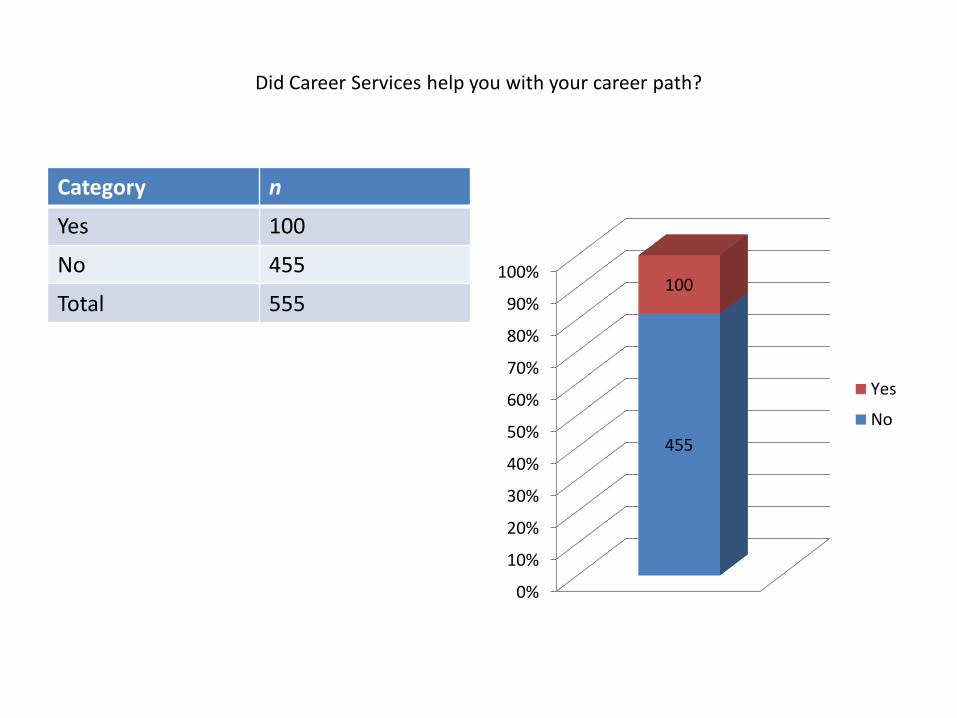
Did Career Services help you with your career path?
Category n
Yes 100
No 455
Total 555
0%
10%
20%
30%
40%
50%
60%
70%
80%
90%
100%
455
100
Yes
No
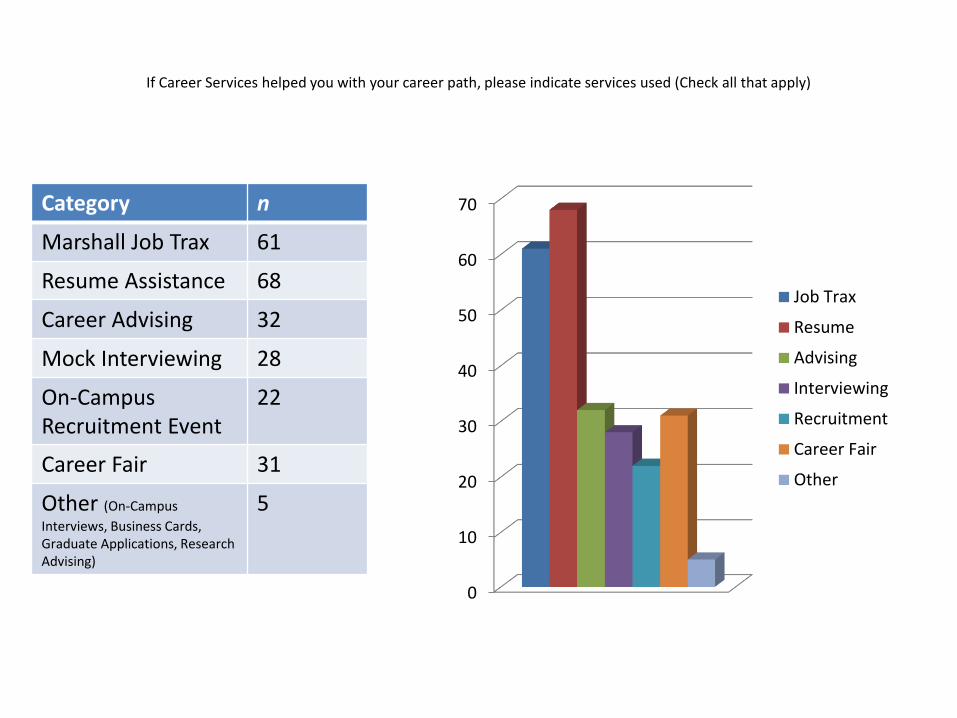
If Career Services helped you with your career path, please indicate services used (Check all that apply)
Category n
Marshall Job Trax 61
Resume Assistance 68
Career Advising 32
Mock Interviewing 28
On-Campus Recruitment Event
22
Career Fair 31
Other (On-Campus
Interviews, Business Cards, Graduate Applications, Research Advising)
5
0
10
20
30
40
50
60
70
Job Trax
Resume
Advising
Interviewing
Recruitment
Career Fair
Other