Embed Size (px)
Citation preview

ConorConor ErodableErodable Polymer Polymer PaclitaxelPaclitaxelEluting Eluting StentStent-- Indian & European Indian & European
ExperienceExperience
Dr. Upendra Dr. Upendra KaulKaulFortisFortis Hospitals, New Delhi & NOIDAHospitals, New Delhi & NOIDA
INDIAINDIA
Caution: CoStarCaution: CoStar™™ is an investigational device, for sale in select international mis an investigational device, for sale in select international markets only.arkets only.CoStarCoStar™™ is not currently available for sale in the E.U. or U.S. Limiteis not currently available for sale in the E.U. or U.S. Limited by law to investigational use in the U.S.d by law to investigational use in the U.S.
Conor Medsystems and CoStar are trademarks of Conor Medsystems. Conor Medsystems and CoStar are trademarks of Conor Medsystems. ©© Conor Medsystems, Inc. 2005Conor Medsystems, Inc. 2005Summit TCT Asia Pacific
Seoul, April 28th 2006

A Stent Specifically Designed for Controlled Drug Delivery From a Bioerodable PolymerA Stent Specifically Designed for Controlled Drug Delivery From A Stent Specifically Designed for Controlled Drug Delivery From a Bioerodable Polymera Bioerodable Polymer
CoStarCoStar™™ PaclitaxelPaclitaxel--Eluting Eluting Cobalt Cobalt ChromiumChromium Coronary Stent SystemCoronary Stent System

CoStarCoStar™™ Cobalt Chromium Cobalt Chromium Stent SystemStent System
130x Magnification of 130x Magnification of Strut Based NonStrut Based Non--Deformable ReservoirsDeformable Reservoirs
90x Magnification of Reservoirs & Hinges90x Magnification of Reservoirs & Hinges

The Power of Reservoir TechnologyThe Power of Reservoir Technology
Single DrugSingle DrugStructureStructure
Multiple DrugMultiple DrugStructuresStructures
Drug Delivery ReservoirsDrug Delivery Reservoirs
BiBi--DirectionalDirectional UniUni--DirectionalDirectional
SingleSingle AdjacentAdjacent

CoStarCoStar™™ PaclitaxelPaclitaxel--Eluting Cobalt Chromium Eluting Cobalt Chromium Coronary Stent SystemCoronary Stent System
PLGA PLGA -- Fully ResorbableFully ResorbablePolymer TypePolymer TypeExcellentExcellentRadiopacityRadiopacity
0.98 mm / 0.038 inch0.98 mm / 0.038 inchCrossing Profile Crossing Profile (2.5 mm Stent)(2.5 mm Stent)
0.09 mm / 0.0035 inch0.09 mm / 0.0035 inchStrut ThicknessStrut ThicknessL605 Cobalt ChromiumL605 Cobalt ChromiumAlloyAlloy
Repeating Cell with nonRepeating Cell with non--deforming reservoirsdeforming reservoirs492 Reservoirs 492 Reservoirs (17mm stent)(17mm stent)
DesignDesign
CoStarCoStar™™ Coronary Stent SystemCoronary Stent SystemCharacteristicsCharacteristics

Following Tissue RemovalFollowing Tissue RemovalNo Residual PolymerNo Residual Polymer
CoStarCoStar™™ StentStent180 Day Porcine Explant180 Day Porcine Explant

COSTAR I TRIALCOSTAR I TRIALBackground & ObjectivesBackground & Objectives
PISCES 10 µg and 30 µg doses at variable kinetic releases with stainless steel platform found long release to be superior (Serruys P et al, Rotterdam)
COSTAR I trial evaluated:Variable dose/kinetic formulations of paclitaxel on the Conor cobalt chromium stent in a high risk populationDose response to determine lowest effective drug dose
PISCES 10 PISCES 10 µµg and 30 g and 30 µµg doses at variable kinetic g doses at variable kinetic releases with stainless steel platform found long releases with stainless steel platform found long release to be superior (release to be superior (SerruysSerruys P et al, Rotterdam)P et al, Rotterdam)
COSTAR I trial evaluated:COSTAR I trial evaluated:Variable dose/kinetic formulations of paclitaxel on Variable dose/kinetic formulations of paclitaxel on the Conor cobalt chromium stent in a high risk the Conor cobalt chromium stent in a high risk populationpopulationDose response to determine lowest effective drug Dose response to determine lowest effective drug dosedose

COSTAR I TrialCOSTAR I TrialParticipating CentersParticipating Centers
Dr. Upendra Kaul - Principal InvestigatorBatra Hospital & Medical Research Center, New Delhi
Dr. Atul MathurEscorts Heart Institute & Research Center, New Delhi
Dr. Sameer DaniS.A.L. Hospital & Medical Institute, Ahmedabad
Dr. P. Ranganath Nayak Wockhardt Hospital & Heart Institute, Bangalore
Dr. Upendra KaulDr. Upendra Kaul -- Principal InvestigatorPrincipal InvestigatorBatra Hospital & Medical Research Center, New DelhiBatra Hospital & Medical Research Center, New Delhi
Dr. Atul MathurDr. Atul MathurEscorts Heart Institute & Research Center, New DelhiEscorts Heart Institute & Research Center, New Delhi
Dr. Sameer DaniDr. Sameer DaniS.A.L. Hospital & Medical Institute, AhmedabadS.A.L. Hospital & Medical Institute, Ahmedabad
Dr. P. Ranganath Nayak Dr. P. Ranganath Nayak Wockhardt Hospital & Heart Institute, BangaloreWockhardt Hospital & Heart Institute, Bangalore

COSTAR I TrialCOSTAR I TrialStudy Design & Patient FollowStudy Design & Patient Follow--UpUp
Prospective nonProspective non--randomized, sequential enrollment randomized, sequential enrollment
4 Month Clinical Follow-Up4 Month Clinical Follow4 Month Clinical Follow--UpUp
12 Month Angiographywith QCA & IVUS
12 Month Angiography12 Month Angiographywith QCA & IVUSwith QCA & IVUS
12 Month Clinical Follow-Up12 Month Clinical Follow12 Month Clinical Follow--UpUp
Baseline Angiography Baseline Angiography Baseline Angiography
4 Month Angiographywith QCA & IVUS
4 Month Angiography4 Month Angiographywith QCA & IVUSwith QCA & IVUS
* * in vitroin vitro
Group 130 µg PTX / 10 days*
Bi-Directional ReleaseN = 10 patients
Group 1Group 130 30 µµg PTXg PTX / 10 days*/ 10 days*
BiBi--Directional ReleaseDirectional ReleaseN = 10 patientsN = 10 patients
Group 210 µg PTX / 30 days*
Mural ReleaseN = 40 patients
Group 2Group 210 10 µµg PTXg PTX / 30 days*/ 30 days*
Mural ReleaseMural ReleaseN = 40 patientsN = 40 patients
Group 33 µg PTX / 30 days*
Mural ReleaseN = 37 patients
Group 3Group 33 3 µµg PTXg PTX / 30 days*/ 30 days*
Mural ReleaseMural ReleaseN = 37 patientsN = 37 patients
U.S. Pivotal and O.U.S.
CommercialDose
U.S. Pivotal U.S. Pivotal and O.U.S.and O.U.S.
CommercialCommercialDoseDose
*Loaded on a 17 mm stent,( 0.7 µµg PTX mm2)g PTX mm2)
COSTAR I TrialCOSTAR I TrialStudyStudy Endpoints & InclusionsEndpoints & Inclusions
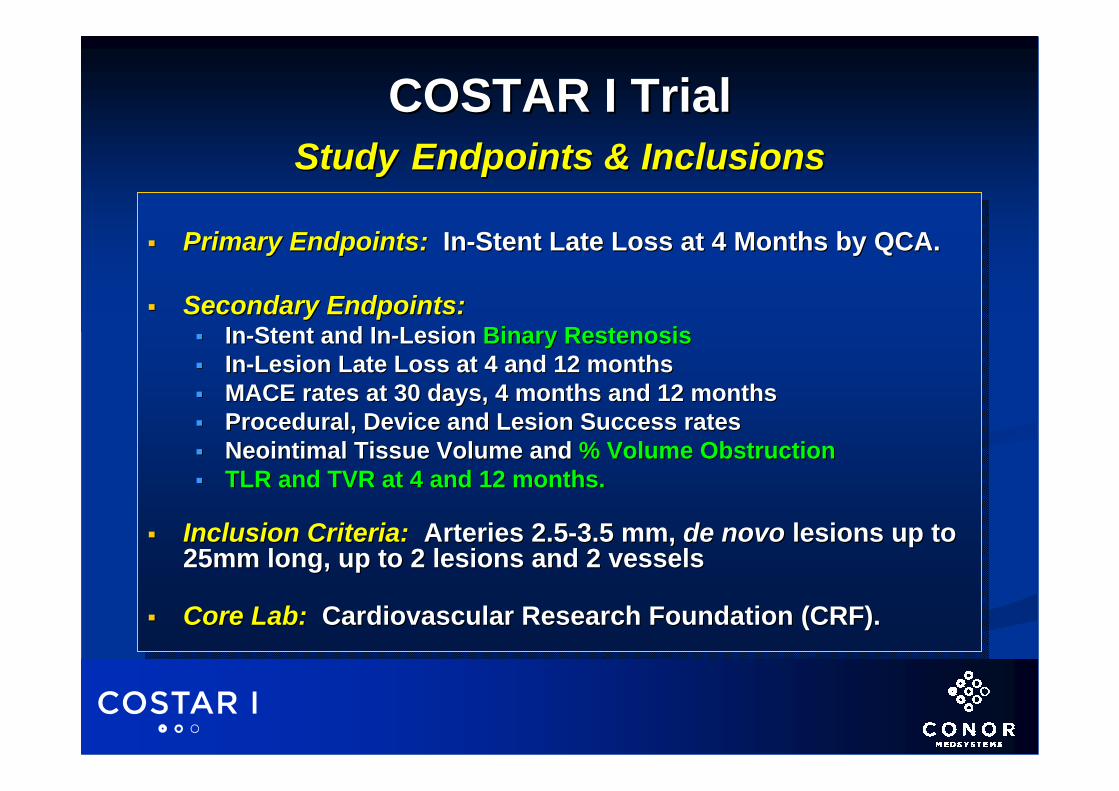
Primary Endpoints: In-Stent Late Loss at 4 Months by QCA.
Secondary Endpoints:In-Stent and In-Lesion Binary RestenosisIn-Lesion Late Loss at 4 and 12 monthsMACE rates at 30 days, 4 months and 12 monthsProcedural, Device and Lesion Success ratesNeointimal Tissue Volume and % Volume ObstructionTLR and TVR at 4 and 12 months.
Inclusion Criteria: Arteries 2.5-3.5 mm, de novo lesions up to 25mm long, up to 2 lesions and 2 vessels
Core Lab: Cardiovascular Research Foundation (CRF).
Primary Endpoints:Primary Endpoints: InIn--Stent Late Loss at 4 Months by QCA.Stent Late Loss at 4 Months by QCA.
Secondary Endpoints:Secondary Endpoints:InIn--Stent and InStent and In--Lesion Lesion Binary RestenosisBinary RestenosisInIn--Lesion Late Loss at 4 and 12 monthsLesion Late Loss at 4 and 12 monthsMACE rates at 30 days, 4 months and 12 monthsMACE rates at 30 days, 4 months and 12 monthsProcedural, Device and Lesion Success ratesProcedural, Device and Lesion Success ratesNeointimal Tissue Volume and Neointimal Tissue Volume and % Volume Obstruction% Volume ObstructionTLR and TVR at 4 and 12 months.TLR and TVR at 4 and 12 months.
Inclusion Criteria:Inclusion Criteria: Arteries 2.5Arteries 2.5--3.5 mm, 3.5 mm, de novode novo lesions up to lesions up to 25mm long, up to 2 lesions and 2 vessels25mm long, up to 2 lesions and 2 vessels
Core Lab:Core Lab: Cardiovascular Research Foundation (CRF).Cardiovascular Research Foundation (CRF).

0.0%0.0%5.0%5.0%10.0%10.0%Prior Stent Implant Prior Stent Implant 0.0%0.0%3.0%3.0%10.0%10.0%Prior AngioplastyPrior Angioplasty2.7%2.7%0.0%0.0%10.0%10.0%Prior CABGPrior CABG48.6%48.6%53.0%53.0%30.0%30.0%Prior MIPrior MI27.0%27.0%25.0%25.0%50.0%50.0%DyslipidemiaDyslipidemia56.8%56.8%60.0%60.0%70.0%70.0%HypertensionHypertension21.6%21.6%28.0%28.0%30.0%30.0%Diabetes MellitusDiabetes Mellitus37.8%37.8%25.0%25.0%50.0%50.0%History of SmokingHistory of Smoking83.8%83.8%88.0%88.0%90.0% 90.0% Gender (% male)Gender (% male)
54.4 54.4 ++ 9.09.056.0 56.0 ++ 9.69.662.9 62.9 ++ 11.411.4Age in Years (mean Age in Years (mean ±± SD)SD)
3 3 µµg / 30 daysg / 30 days37 patients,37 patients,51 lesions51 lesions
10 10 µµg / 30 daysg / 30 days40 patients, 40 patients, 57 lesions57 lesions
30 30 µµg / 10 daysg / 10 days10 patients,10 patients,14 lesions14 lesions
Baseline Patient DemographicsBaseline Patient Demographics
COSTAR I TrialCOSTAR I Trial
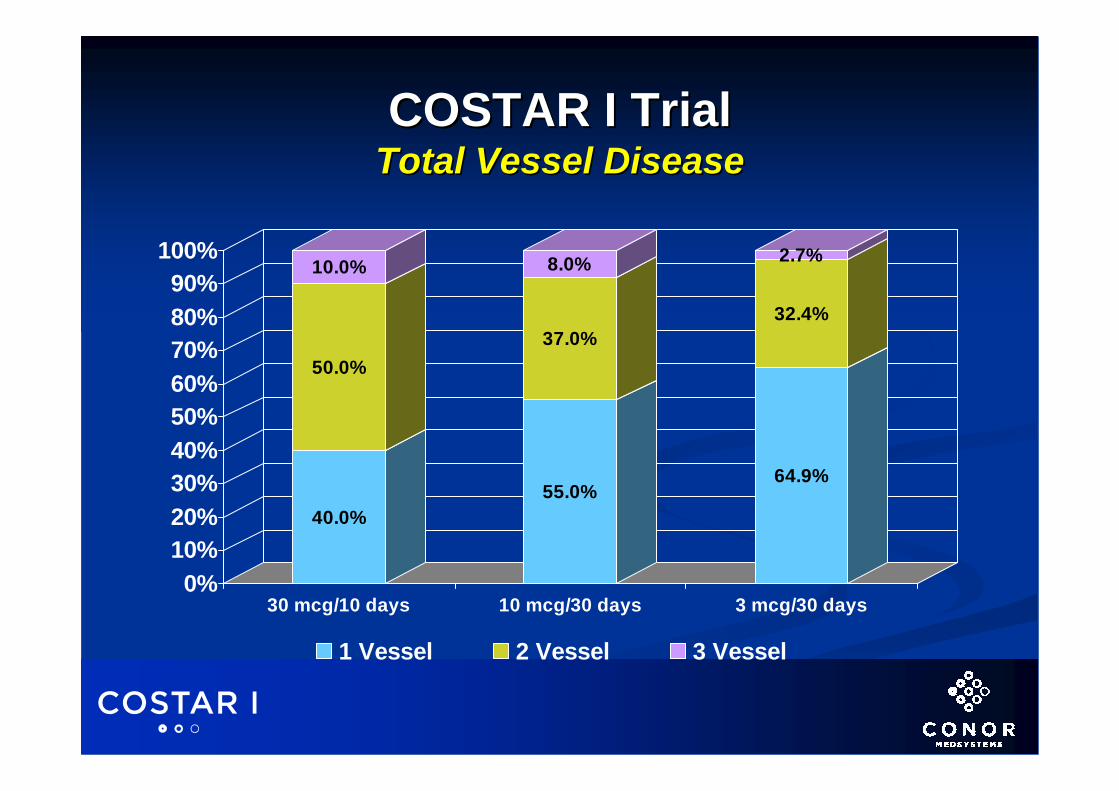
40.0%
50.0%
10.0%
55.0%
37.0%
8.0%
64.9%
32.4%
2.7%
0%10%20%30%40%50%60%70%80%90%
100%
30 mcg/10 days 10 mcg/30 days 3 mcg/30 days
1 Vessel 2 Vessel 3 Vessel
COSTAR I TrialCOSTAR I TrialTotal Vessel DiseaseTotal Vessel Disease

64.3%
21.4%
14.3%
44.6%
33.9%
21.5%
28.0%
34.0%
38.0%
0%
20%
40%
60%
80%
100%
30 mcg/10 days 10 mcg/30 days 3 mcg/30 days
Type A Type B1 Type B2 Type C
COSTAR I TrialCOSTAR I TrialACC Lesion Classification by QCAACC Lesion Classification by QCA

2.57 2.57 ++ 0.360.362.46 2.46 ++ 0.41 0.41 2.45 2.45 ++ 0.300.30Reference Vessel DiameterReference Vessel Diameter(mm)(mm)
17.42 17.42 ++ 5.435.4315.94 15.94 ++ 3.643.6415.89 15.89 ++ 4.944.94Lesion Length Lesion Length (mm)(mm)
37 patients37 patients51 lesions51 lesions56 stents56 stents
62.2%62.2%37.8%37.8%
40 patients40 patients57 lesions57 lesions60 stents60 stents
57.5%57.5%42.5%42.5%
10 patients10 patients14 lesions14 lesions16 stents16 stents
60.0%60.0%40.0%40.0%
# of Patients Treated# of Patients Treated# of Lesions Treated# of Lesions Treated# of Stent Implanted# of Stent Implanted
Patients with 1 LesionPatients with 1 LesionPatients with 2 LesionsPatients with 2 Lesions
3 3 µµg / 30 daysg / 30 days10 10 µµg / 30 daysg / 30 days30 30 µµg / 10 daysg / 10 days
Baseline Lesion Characteristics by QCABaseline Lesion Characteristics by QCA
COSTAR I TrialCOSTAR I Trial
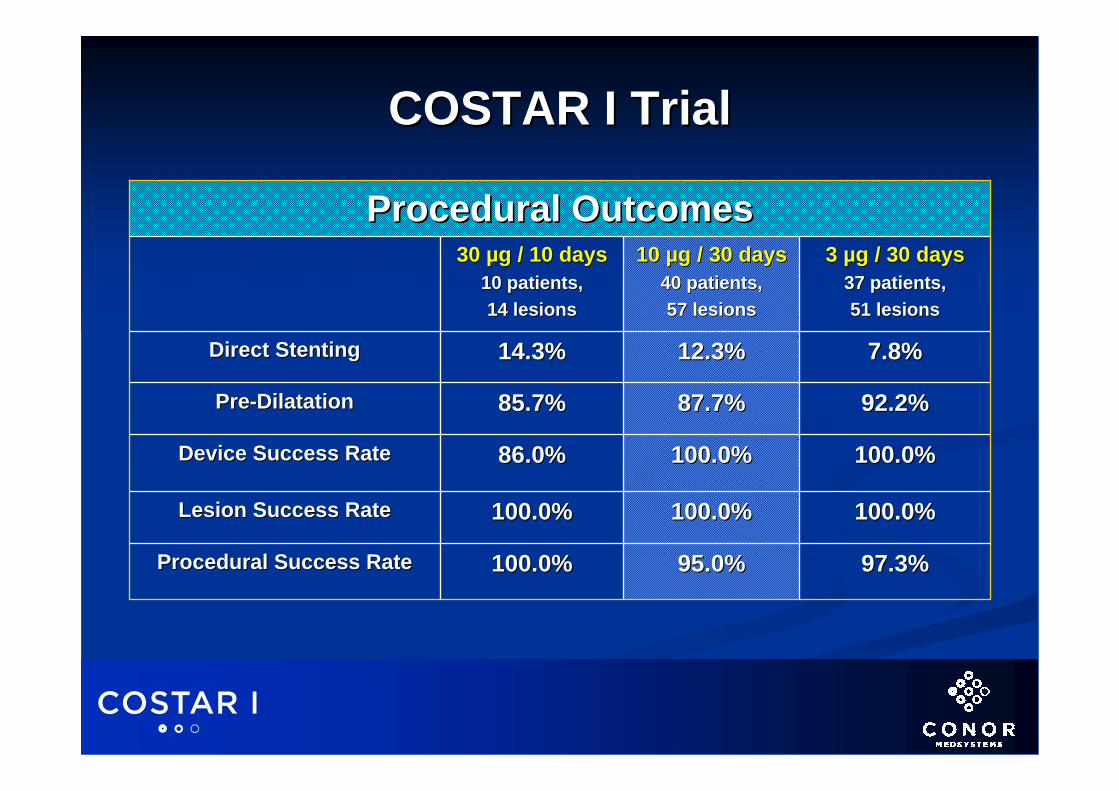
97.3%97.3%95.0%95.0%100.0%100.0%Procedural Success RateProcedural Success Rate
100.0%100.0%100.0%100.0%100.0%100.0%Lesion Success RateLesion Success Rate
100.0%100.0%100.0%100.0%86.0%86.0%Device Success RateDevice Success Rate
92.2%92.2%87.7%87.7%85.7%85.7%PrePre--DilatationDilatation
7.8%7.8%12.3%12.3%14.3%14.3%Direct StentingDirect Stenting
3 3 µµg / 30 daysg / 30 days37 patients,37 patients,51 lesions51 lesions
10 10 µµg / 30 daysg / 30 days40 patients, 40 patients, 57 lesions57 lesions
30 30 µµg / 10 daysg / 10 days10 patients,10 patients,14 lesions14 lesions
Procedural OutcomesProcedural Outcomes
COSTAR I Trial COSTAR I Trial

8.1% 8.1% (3/37)(3/37)5.0% 5.0% (2/40)(2/40)10.0% 10.0% (1/10)(1/10)Cumulative MACECumulative MACE2/372/370/400/401/101/10Stent ThrombosisStent Thrombosis
0.0% 0.0% (0/51)(0/51)0.0% 0.0% (0/57)(0/57)0.0% 0.0% (0/14)(0/14)TLRTLR0.0% 0.0% (0/37)(0/37)0.0% 0.0% (0/40)(0/40)0.0% 0.0% (0/10)(0/10)Emergent CABGEmergent CABG2.7% 2.7% (1/37)(1/37)5.0% 5.0% (2/40)(2/40)0.0% 0.0% (0/10)(0/10)Non Q Non Q –– Wave MIWave MI2.7% 2.7% (1/37)(1/37)0.0% 0.0% (0/40)(0/40)10.0% 10.0% (1/10)(1/10)Q Q –– Wave MIWave MI2.7% 2.7% (1/37)(1/37)0.0% 0.0% (0/40)(0/40)0.0% 0.0% (0/10)(0/10)DeathDeath
37 patients37 patients51 lesions51 lesions
40 patients40 patients57 lesions57 lesions
10 patients10 patients14 lesions14 lesions
N Value N Value (Intent to Treat)(Intent to Treat)
3 3 µµg / 30 daysg / 30 days10 10 µµg / 30 daysg / 30 days30 30 µµg / 10 daysg / 10 days
Implant to 30 Days Hierarchal MACEImplant to 30 Days Hierarchal MACE
COSTAR I TrialCOSTAR I Trial

6.5% 6.5% (3/46)(3/46)1.9% 1.9% (1/52)(1/52)0.0% 0.0% (0/14)(0/14)TVRTVR++
0.0% (0/37)0.0% (0/37)0.0% (0/40)0.0% (0/40)0.0% (0/10)0.0% (0/10)Stent Thrombosis (30DStent Thrombosis (30D--4M)4M)21.6% 21.6% (8/37)(8/37)7.5% 7.5% (3/40)(3/40)10.0% 10.0% (1/10)(1/10)Cumulative MACECumulative MACE
5.9% 5.9% (3/51)(3/51)1.8% 1.8% (1/57)(1/57)0.0% 0.0% (0/14)(0/14)TLRTLR0.0% 0.0% (0/37)(0/37)0.0% 0.0% (0/40)(0/40)0.0% 0.0% (0/10)(0/10)Emergent CABGEmergent CABG5.4% 5.4% (2/37)(2/37)5.0% 5.0% (2/40)(2/40)0.0% 0.0% (0/10)(0/10)Non Q Non Q –– Wave MIWave MI2.7% 2.7% (1/37)(1/37)0.0% 0.0% (0/40)(0/40)10.0% 10.0% (1/10)(1/10)Q Q –– Wave MIWave MI5.4% 5.4% (2/37)(2/37)0.0% 0.0% (0/40)(0/40)0.0% 0.0% (0/10)(0/10)DeathDeath
37 patients37 patients51 lesions51 lesions
40 patients40 patients57 lesions57 lesions
10 patients10 patients14 lesions14 lesions
N Value N Value (Intent to Treat)(Intent to Treat)
3 3 µµg / 30 daysg / 30 days10 10 µµg / 30 daysg / 30 days30 30 µµg / 10 daysg / 10 days
Implant to 4 Months Hierarchal MACEImplant to 4 Months Hierarchal MACE
COSTAR I TrialCOSTAR I Trial
+ Clinically driven based upon the number of lesions treated+ Clinically driven based upon the number of lesions treated
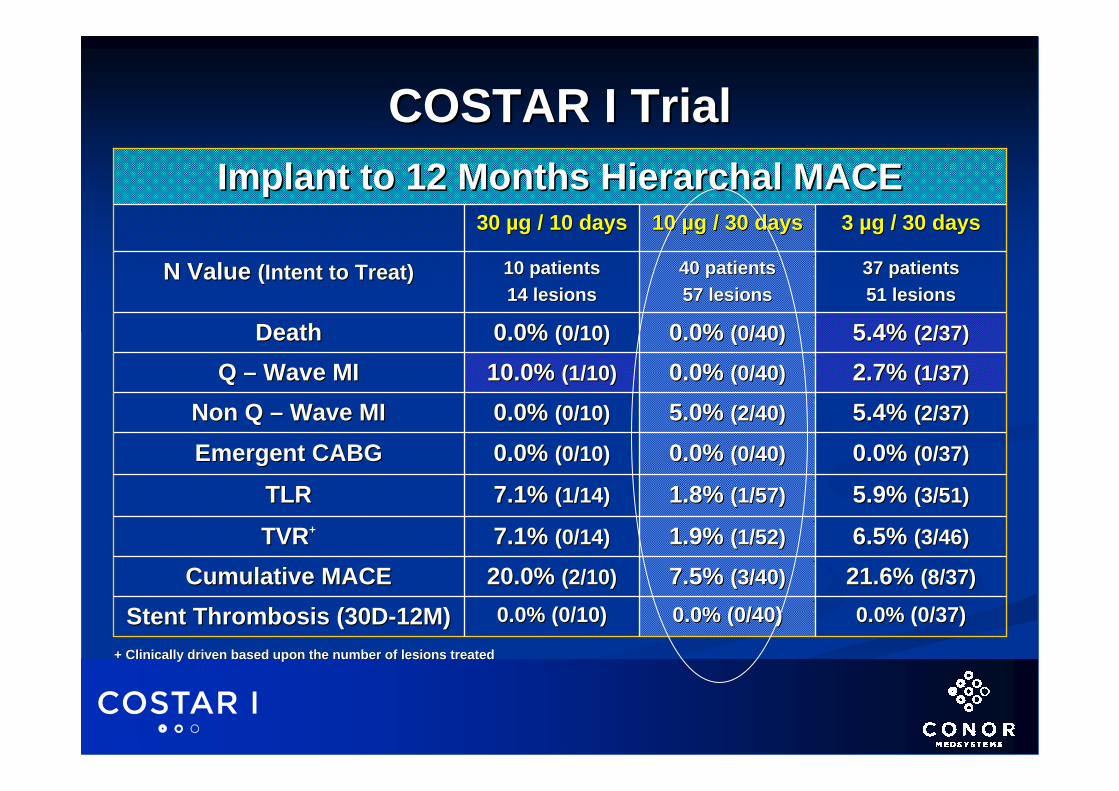
6.5% 6.5% (3/46)(3/46)1.9% 1.9% (1/52)(1/52)7.1% 7.1% (0/14)(0/14)TVRTVR++
0.0% (0/37)0.0% (0/37)0.0% (0/40)0.0% (0/40)0.0% (0/10)0.0% (0/10)Stent Thrombosis (30DStent Thrombosis (30D--12M)12M)21.6% 21.6% (8/37)(8/37)7.5% 7.5% (3/40)(3/40)20.0% 20.0% (2/10)(2/10)Cumulative MACECumulative MACE
5.9% 5.9% (3/51)(3/51)1.8% 1.8% (1/57)(1/57)7.1% 7.1% (1/14)(1/14)TLRTLR0.0% 0.0% (0/37)(0/37)0.0% 0.0% (0/40)(0/40)0.0% 0.0% (0/10)(0/10)Emergent CABGEmergent CABG5.4% 5.4% (2/37)(2/37)5.0% 5.0% (2/40)(2/40)0.0% 0.0% (0/10)(0/10)Non Q Non Q –– Wave MIWave MI2.7% 2.7% (1/37)(1/37)0.0% 0.0% (0/40)(0/40)10.0% 10.0% (1/10)(1/10)Q Q –– Wave MIWave MI5.4% 5.4% (2/37)(2/37)0.0% 0.0% (0/40)(0/40)0.0% 0.0% (0/10)(0/10)DeathDeath
37 patients37 patients51 lesions51 lesions
40 patients40 patients57 lesions57 lesions
10 patients10 patients14 lesions14 lesions
N Value N Value (Intent to Treat)(Intent to Treat)
3 3 µµg / 30 daysg / 30 days10 10 µµg / 30 daysg / 30 days30 30 µµg / 10 daysg / 10 days
Implant to 12 Months Hierarchal MACEImplant to 12 Months Hierarchal MACE
COSTAR I TrialCOSTAR I Trial
+ Clinically driven based upon the number of lesions treated+ Clinically driven based upon the number of lesions treated
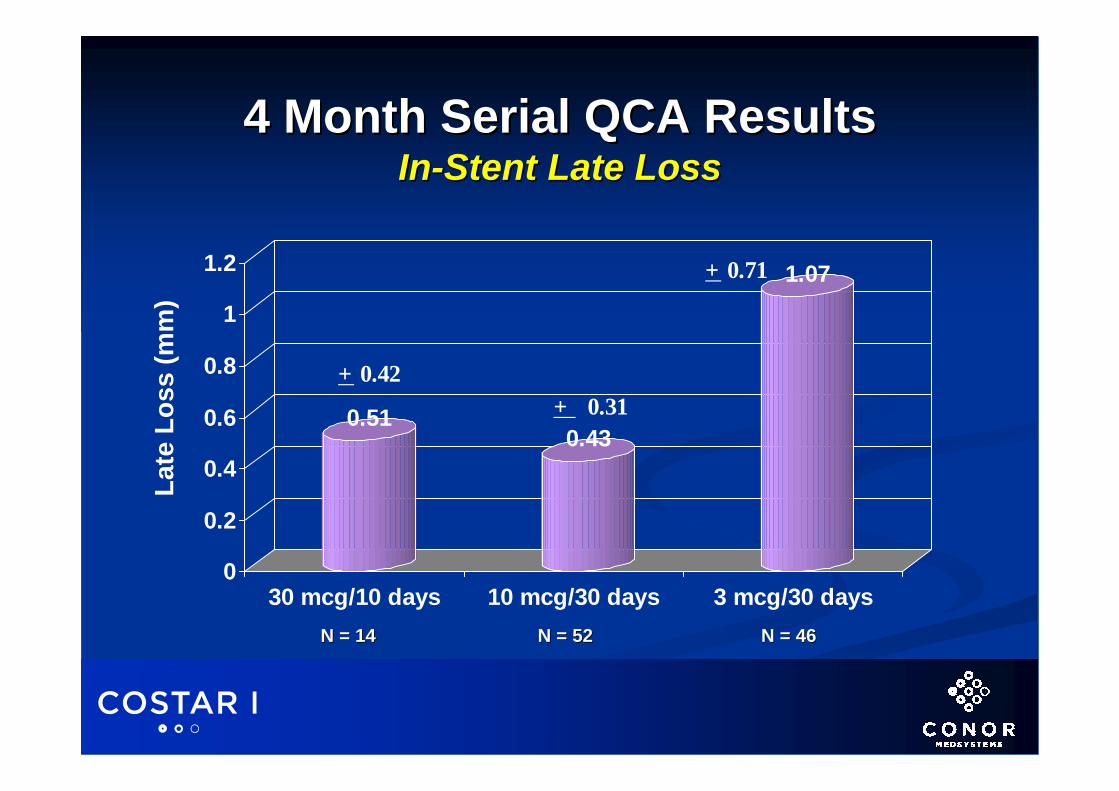
4 Month Serial QCA Results4 Month Serial QCA ResultsInIn--Stent Late LossStent Late Loss
0.510.43
1.07
0
0.2
0.4
0.6
0.8
1
1.2
30 mcg/10 days 10 mcg/30 days 3 mcg/30 days
Late
Los
s (m
m)
N = 14N = 14 N = 52N = 52 N = 46N = 46
+ 0.31
+ 0.42
+ 0.71
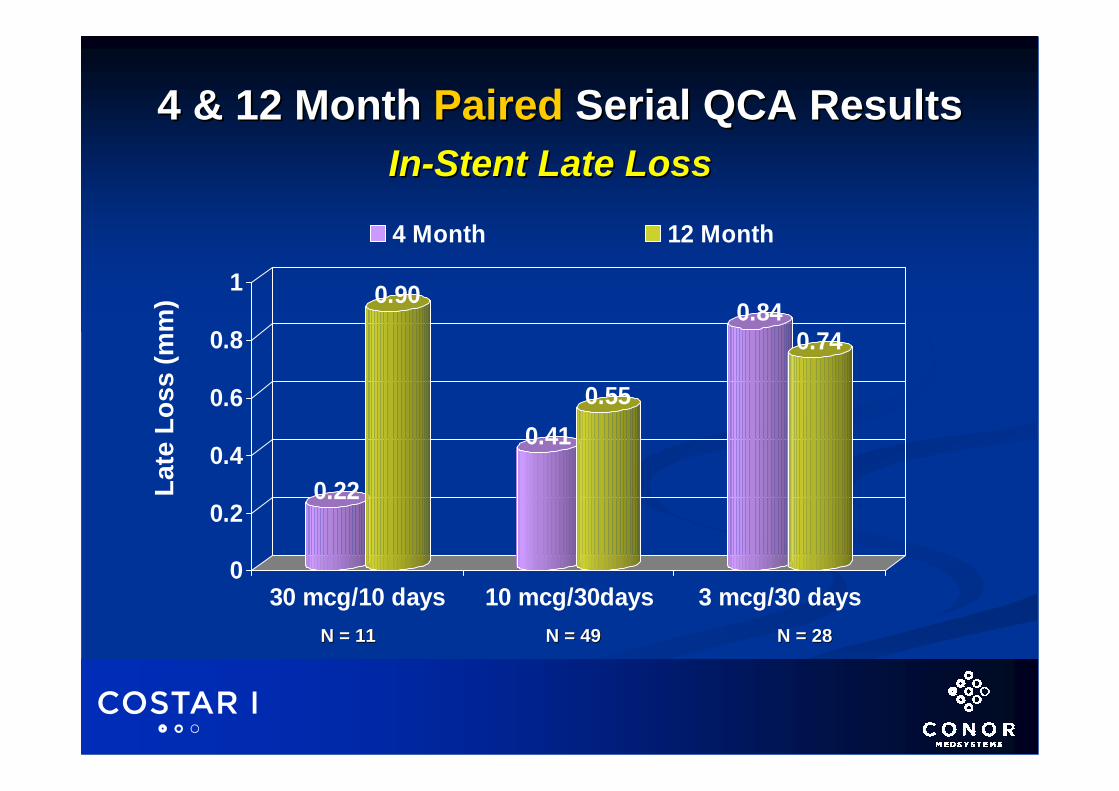
4 & 12 Month 4 & 12 Month PairedPaired Serial QCA ResultsSerial QCA Results
0.22
0.90
0.410.55
0.840.74
0
0.2
0.4
0.6
0.8
1
30 mcg/10 days 10 mcg/30days 3 mcg/30 days
4 Month 12 Month
Late
Los
s (m
m)
InIn--Stent Late LossStent Late Loss
N = 11N = 11 N = 49N = 49 N = 28N = 28
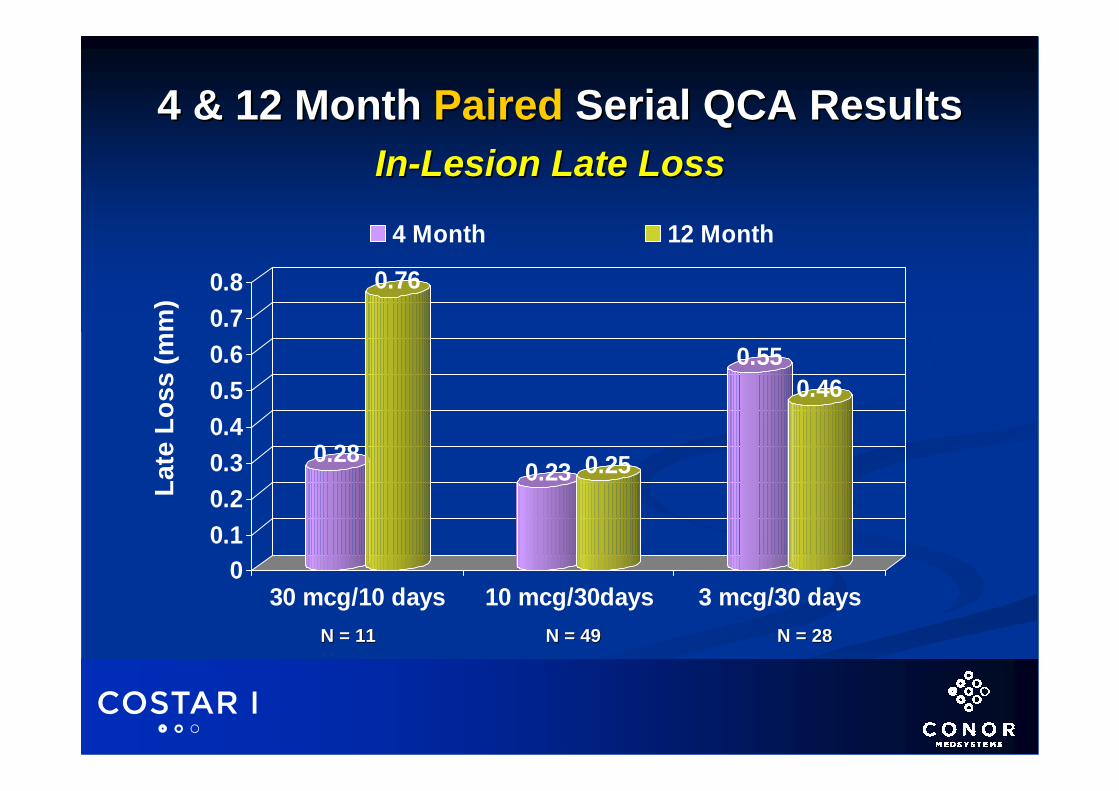
4 & 12 Month 4 & 12 Month PairedPaired Serial QCA ResultsSerial QCA Results
0.28
0.76
0.23 0.25
0.550.46
00.10.20.30.40.50.60.70.8
30 mcg/10 days 10 mcg/30days 3 mcg/30 days
4 Month 12 Month
Late
Los
s (m
m)
InIn--Lesion Late LossLesion Late Loss
N = 11N = 11 N = 49N = 49 N = 28N = 28

4 Month Serial QCA Results4 Month Serial QCA ResultsInIn--Stent Binary RestenosisStent Binary Restenosis
14.3%
1.9%
32.6%
0
5
10
15
20
25
30
35
30 mcg/10 days 10 mcg/30 days 3 mcg/30 days
Bin
ary
Res
teno
sis
%
N = 14N = 14 N = 52N = 52 N = 46N = 46

4 & 12 Month 4 & 12 Month PairedPaired Serial QCA ResultsSerial QCA Results
0.0%
27.3%
0.0% 0.0%
14.3%14.3%
0
5
10
15
20
25
30
30 mcg/10 days 10 mcg/30days 3 mcg/30 days
4 Month 12 Month
Bin
ary
Res
teno
sis
%InIn--Stent Binary RestenosisStent Binary Restenosis
N = 11N = 11 N = 49N = 49 N = 28N = 28

4 Month Serial IVUS Results4 Month Serial IVUS ResultsInIn--Stent NIH Volumetric ObstructionStent NIH Volumetric Obstruction
8.1 7.6
21.5
0
5
10
15
20
25
30 mcg/10 days 10 mcg/30 days 3 mcg/30 days
In-S
tent
NIH
Obs
truc
tion
(%)
N = 6N = 6 N = 27N = 27 N = 24N = 24

4 & 12 Month 4 & 12 Month PairedPaired Serial IVUS ResultsSerial IVUS Results
4.6
36.4
8.513.6 15.2 16.5
0.05.0
10.015.020.025.030.035.040.0
30 mcg/10 days 10 mcg/30days 3 mcg/30 days
4 Month 12 Month
N = 3N = 3 N = 20N = 20 N = 11N = 11
InIn--Stent NIH Volumetric ObstructionStent NIH Volumetric ObstructionIn
-Ste
nt N
IH O
bstr
uctio
n (%
)

COSTAR I TrialCOSTAR I TrialConclusionsConclusions
The COSTAR I trial studied perhaps the most complex group of patients yet evaluated in a DES trial by virtue of long lesions,small vessel diameters, multi-vessel disease and high incidence of diabetes.
The 3 µg formulation was ineffective thus establishing a 10 µg (0.7mm2) dose of paclitaxel as the lowest effective delivered dose.
Short release formulation showed the most re-bound clinically from 4 to 12 months as was demonstrated in PISCES trial.
The 10 µg long release formulation was the most efficacious and was clinically unchanged from 4 to 12 months.
The COSTAR I trial studied perhaps the most complex group of The COSTAR I trial studied perhaps the most complex group of patients yet evaluated in a DES trial by virtue of long lesions,patients yet evaluated in a DES trial by virtue of long lesions,small vessel diameters, multismall vessel diameters, multi--vessel disease and high incidence vessel disease and high incidence of diabetes.of diabetes.
The 3 The 3 µµgg formulation was ineffective thus establishing a 10 formulation was ineffective thus establishing a 10 µµg g (0.7mm(0.7mm22) dose of paclitaxel as the lowest effective delivered ) dose of paclitaxel as the lowest effective delivered dose.dose.
Short release formulation showed the most reShort release formulation showed the most re--bound clinically bound clinically from 4 to 12 months as was demonstrated in PISCES trial.from 4 to 12 months as was demonstrated in PISCES trial.
The 10 The 10 µµg long release formulation was the most efficacious and g long release formulation was the most efficacious and was clinically unchanged from 4 to 12 months.was clinically unchanged from 4 to 12 months.

EuroSTAREuroSTARThe The EuroEuropean Cobalt pean Cobalt StStent with ent with
AAntiproliferative for ntiproliferative for RRestenosis Trialestenosis TrialResults for Arm 1 (12 Month)Results for Arm 1 (12 Month)Results for Arm 2 (6 Month)Results for Arm 2 (6 Month)
Caution: CoStarCaution: CoStar™™ is an investigational device, for sale in select international mis an investigational device, for sale in select international markets only.arkets only.CoStarCoStar™™ is not currently available for sale in the E.U. or U.S. Limiteis not currently available for sale in the E.U. or U.S. Limited by law to investigational use in the U.S.d by law to investigational use in the U.S.
Conor Medsystems and CoStar are trademarks of Conor Medsystems. Conor Medsystems and CoStar are trademarks of Conor Medsystems. ©© Conor Medsystems, Inc. 2005Conor Medsystems, Inc. 2005
Keith D Dawkins MD FRCP FACCKeith D Dawkins MD FRCP FACCSouthampton University HospitalSouthampton University Hospital
UKUK

Primary Endpoint:6 Month In-Stent Late Loss by QCA
Secondary Endpoints:6 Month in-Stent Binary Restenosis Rate %6 Month in- Segment Binary Restenosis Rate %6 Month Target Lesion Revascularization (TLR) %30 Day, 6 Month and 1 Year MACE %6 Month In-Stent Mean Luminal Diameter (MLD) %Primary Device Success %Lesion Success %Procedural Success %Yearly Clinical Follow-up out to 5 Years
Primary Endpoint:Primary Endpoint:66 Month InMonth In--Stent Late Loss by QCAStent Late Loss by QCA
Secondary Endpoints:Secondary Endpoints:6 Month in6 Month in--Stent Stent Binary Restenosis Rate %Binary Restenosis Rate %6 Month in6 Month in-- Segment Binary Restenosis Rate %Segment Binary Restenosis Rate %6 Month Target Lesion Revascularization (TLR) %6 Month Target Lesion Revascularization (TLR) %30 Day, 6 Month and 1 Year MACE %30 Day, 6 Month and 1 Year MACE %6 Month In6 Month In--Stent Mean Luminal Diameter (MLD) %Stent Mean Luminal Diameter (MLD) %Primary Device Success %Primary Device Success %Lesion Success %Lesion Success %Procedural Success %Procedural Success %Yearly Clinical FollowYearly Clinical Follow--up out to 5 Yearsup out to 5 Years
EuroSTAR TrialEuroSTAR TrialStudy EndpointsStudy Endpoints

EuroSTAR TrialEuroSTAR TrialStudy Design & Patient FollowStudy Design & Patient Follow--UpUp
Prospective, multiProspective, multi--center study, scheduled to sequentially enroll center study, scheduled to sequentially enroll patients from 18 centers in 6 countries into one of two registrypatients from 18 centers in 6 countries into one of two registryarms with two different dose formulations of paclitaxel. arms with two different dose formulations of paclitaxel.
Arm 110 µg PTX / 30 days / Mural
N = 145 patients
Arm 1Arm 110 10 µµg PTXg PTX / 30 days / Mural/ 30 days / Mural
N = 145 patientsN = 145 patients
Arm 230 µg PTX / 30 days / Mural
N = 137 patients
Arm 2Arm 230 30 µµg PTXg PTX / 30 days / Mural/ 30 days / Mural
N = 137 patientsN = 137 patients
1 Month Clinical1 Month Clinical1 Month Clinical
6 Month Clinical6 Month Clinical6 Month Clinical
6 Month Angiographywith QCA
6 Month Angiography6 Month Angiographywith QCAwith QCA
1 Year Clinical F/U1 Year Clinical F/U1 Year Clinical F/U
Baseline Angiography Baseline Angiography Baseline Angiography
Yearly Clinical F/U to 5 YrsYearly Clinical F/U to 5 YrsYearly Clinical F/U to 5 Yrs

0.30270.3027
0.81250.8125
0.33860.3386
0.95140.9514
0.73800.7380
0.33210.3321
0.30910.3091
0.27110.2711
0.18000.1800
0.93840.9384
pp--valuevalue
13.1% (19/145)13.1% (19/145)19.3% (28/145)19.3% (28/145)
3.4% (5/145)3.4% (5/145)
31.7% (46/145)31.7% (46/145)
77.9% (113/145)77.9% (113/145)
69.0% (100/145)69.0% (100/145)
15.9% (23/145)15.9% (23/145)
67.6% (98/145)67.6% (98/145)
70.3% (102/145)70.3% (102/145)63.5 63.5 ±± 10.510.5
Arm 1Arm 110 10 µµg / 30d / Muralg / 30d / Mural
N=145 patientsN=145 patients
17.5% (24/137)17.5% (24/137)Prior Stent ImplantPrior Stent Implant19.7% (28/137)19.7% (28/137)Prior AngioplastyPrior Angioplasty5.8% (8/137)5.8% (8/137)Prior CABGPrior CABG
31.4% (43/137)31.4% (43/137)Prior MIPrior MI79.6% (109/137)79.6% (109/137)DyslipidemiaDyslipidemia63.5% (87/137)63.5% (87/137)HypertensionHypertension11.7% (16/137)11.7% (16/137)Diabetes MellitusDiabetes Mellitus61.3% (84/137)61.3% (84/137)History of SmokingHistory of Smoking77.4% (106/137)77.4% (106/137)Gender (% Male)Gender (% Male)
63.6 63.6 ±± 11.211.2Mean Age (Yrs)Mean Age (Yrs)
Arm 2Arm 230 30 µµg / 30d / Muralg / 30d / Mural
N=137 patientsN=137 patients
EuroSTAR TrialEuroSTAR TrialBaseline Patient DemographicsBaseline Patient Demographics
Diabetics in COSTAR 1 = 30%

0.380.382.68 mm 2.68 mm ±± 0.490.492.63 mm 2.63 mm ±± 0.53 0.53 Reference Vessel Reference Vessel Diameter (mm)Diameter (mm)
0.820.82
0.510.51
0.0480.048
0.780.78
0.890.89
pp--valuevalue
2.38 mm 2.38 mm ±± 0.370.37
1.01 mm 1.01 mm ±± 0.350.35
14.11% 14.11% ±± 5.845.84
61.69% 61.69% ±± 10.0810.08
11.06 mm 11.06 mm ±±5.225.22
Arm 1Arm 110 10 µµg / 30d / Muralg / 30d / Mural
N=145 patientsN=145 patients
2.39 mm 2.39 mm ±± 0.360.36MLD PostMLD Post--ProcedureProcedure1.03 mm 1.03 mm ±± 0.320.32MLD PreMLD Pre--ProcedureProcedure
15.49% 15.49% ±± 6.646.64% Diameter Stenosis % Diameter Stenosis (Post(Post--Procedure)Procedure)
61.37% 61.37% ±± 10.2010.20% Diameter Stenosis % Diameter Stenosis (Pre(Pre--Procedure)Procedure)
10.99 mm 10.99 mm ±±4.834.83
Lesion Length (mm)Lesion Length (mm)
Arm 2Arm 230 30 µµg / 30d / Muralg / 30d / Mural
N=137 patientsN=137 patients
EuroSTAR TrialEuroSTAR TrialBaseline Characteristics by QCABaseline Characteristics by QCA
COSTAR I –(RVD : 2.46+0.41 LL: 15.94+ 3.64)
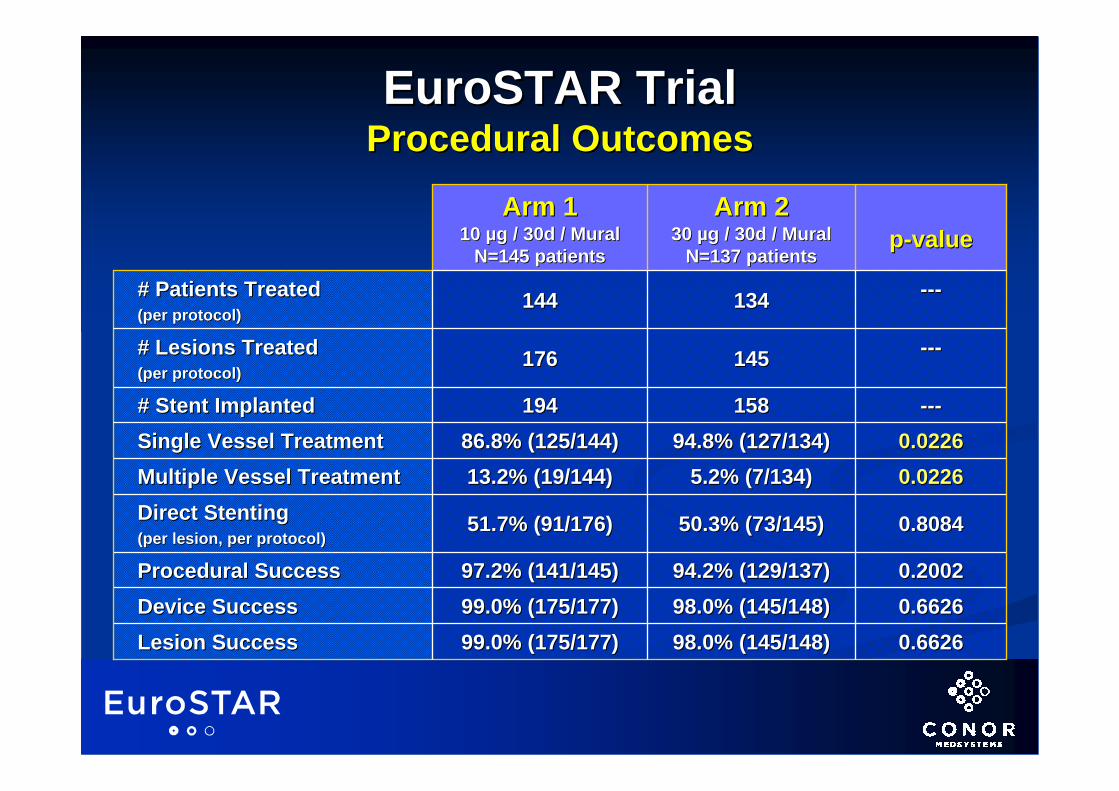
------158158194194# Stent Implanted# Stent Implanted
------134134144144# Patients Treated# Patients Treated(per protocol)(per protocol)
0.66260.66260.66260.66260.20020.2002
0.80840.8084
0.02260.02260.02260.0226
------
pp--valuevalue
99.0% (175/177)99.0% (175/177)99.0% (175/177)99.0% (175/177)97.2% (141/145)97.2% (141/145)
51.7% (91/176)51.7% (91/176)
13.2% (19/144)13.2% (19/144)86.8% (125/144)86.8% (125/144)
176176
Arm 1Arm 110 10 µµg / 30d / Muralg / 30d / Mural
N=145 patientsN=145 patients
98.0% (145/148)98.0% (145/148)Lesion SuccessLesion Success98.0% (145/148)98.0% (145/148)Device SuccessDevice Success94.2% (129/137)94.2% (129/137)Procedural SuccessProcedural Success
50.3% (73/145)50.3% (73/145)Direct StentingDirect Stenting(per lesion, per protocol)(per lesion, per protocol)
5.2% (7/134)5.2% (7/134)Multiple Vessel TreatmentMultiple Vessel Treatment94.8% (127/134)94.8% (127/134)Single Vessel TreatmentSingle Vessel Treatment
145145# Lesions Treated# Lesions Treated(per protocol)(per protocol)
Arm 2Arm 230 30 µµg / 30d / Muralg / 30d / Mural
N=137 patientsN=137 patients
EuroSTAR TrialEuroSTAR TrialProcedural OutcomesProcedural Outcomes

0.8% (1/131)0.8% (1/131)
9.2% (12/131)9.2% (12/131)
3.6% (5/139)3.6% (5/139)
0.0% (0/131)0.0% (0/131)
1.5% (2/131)1.5% (2/131)3.8% (5/131)3.8% (5/131)
0.0% (0/131)0.0% (0/131)††
Arm 2Arm 2N = 137N = 137 patientspatientsN = 145 lesionsN = 145 lesions
0.7% (1/145)0.7% (1/145)
4.8% (7/145)4.8% (7/145)
1.7% (3/176)1.7% (3/176)
0.0% (0/145)0.0% (0/145)
0.0% (0/145)0.0% (0/145)1.4% (2/145)1.4% (2/145)
1.4% (2/145)1.4% (2/145)
Arm 1Arm 1N = 145N = 145 patientspatientsN = 176 lesionsN = 176 lesions
1.00001.0000**Stent ThrombosisStent Thrombosis
0.15570.1557**Cumulative MACECumulative MACE
0.30820.3082**TLRTLR11
------Emergent CABGEmergent CABG
0.22440.2244**
0.26220.2622**
Myocardial Infarction:Myocardial Infarction:QQ--WaveWaveNon QNon Q--WaveWave
0.49950.4995**Cardiac Death Cardiac Death
pp--valuevalueEventsEvents
EuroSTAR TrialEuroSTAR TrialHierarchical MACE Hierarchical MACE –– Implant to 6 MonthsImplant to 6 Months
* * FisherFisher’’s Exact Tests Exact Test11 Clinically driven events based on the number of lesions.Clinically driven events based on the number of lesions.†† 6 patients are scheduled for FU.6 patients are scheduled for FU.
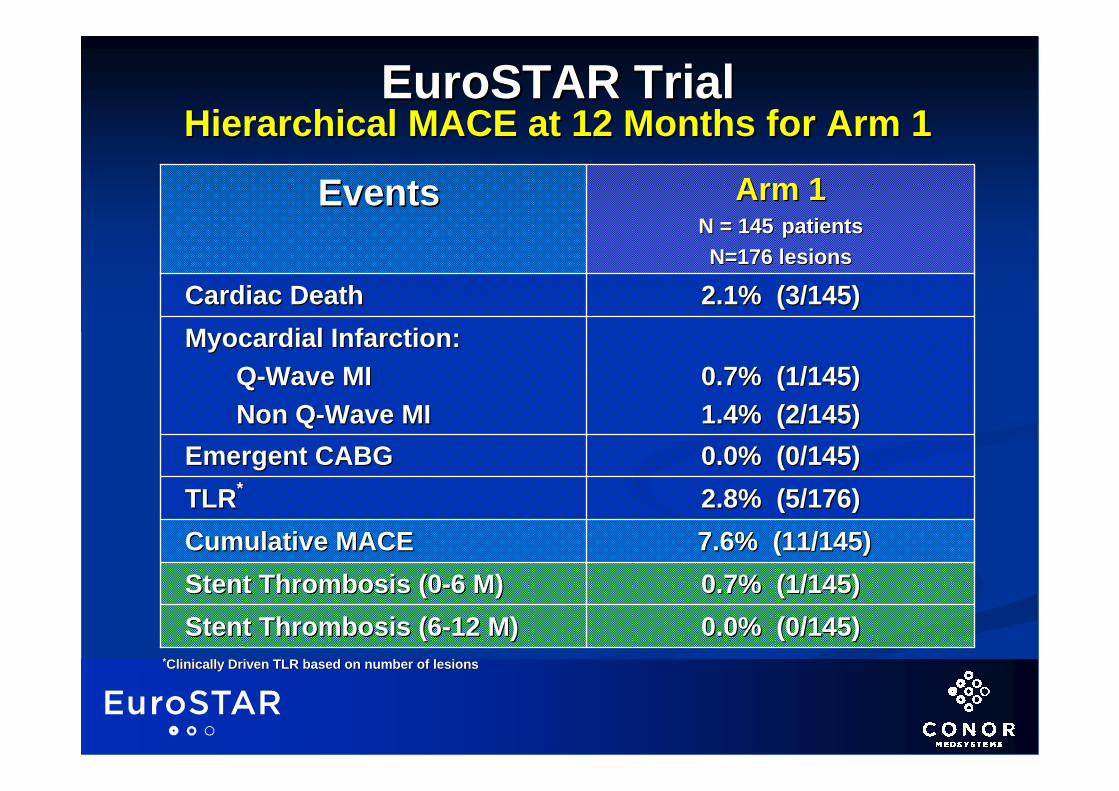
0.7% (1/145)0.7% (1/145)Stent Thrombosis (0Stent Thrombosis (0--6 M)6 M)0.0% (0/145)0.0% (0/145)Stent Thrombosis (6Stent Thrombosis (6--12 M)12 M)
7.6% (11/145)7.6% (11/145)Cumulative MACECumulative MACE2.8% (5/176)2.8% (5/176)TLRTLR**0.0% (0/145)0.0% (0/145)Emergent CABGEmergent CABG
0.7% (1/145) 0.7% (1/145) 1.4% (2/145)1.4% (2/145)
Myocardial Infarction:Myocardial Infarction:QQ--Wave MIWave MINon QNon Q--Wave MIWave MI
2.1% (3/145)2.1% (3/145)Cardiac Death Cardiac Death
Arm 1Arm 1N = 145N = 145 patientspatientsN=176 lesionsN=176 lesions
EventsEvents
EuroSTAR TrialEuroSTAR TrialHierarchical MACE at 12 Months for Arm 1Hierarchical MACE at 12 Months for Arm 1
**Clinically Driven TLR based on number of lesionsClinically Driven TLR based on number of lesions

0.690.692.74 mm 2.74 mm ±± 0.450.452.76 mm 2.76 mm ±± 0.47 0.47 Reference Vessel Diameter (mm)Reference Vessel Diameter (mm)
0.0080.0080.0030.0030.250.250.060.060.080.08
pp--valuevalue
0.26 mm 0.26 mm ±± 0.390.390.07 mm 0.07 mm ±± 0.380.38
3.4% 3.4% (5/149)(5/149)
23.42% 23.42% ±± 13.3913.392.12 mm 2.12 mm ±± 0.540.54
**Arm 1Arm 1N = 145N = 145 patientspatientsN=149 lesionsN=149 lesions
0.39 mm 0.39 mm ±±0.430.43
InIn--Stent Late Loss (mm)Stent Late Loss (mm)0.22 mm 0.22 mm ±± 0.440.44InIn--Segment Late Loss (mm)Segment Late Loss (mm)
6.9% 6.9% (8/116)(8/116)InIn--Stent Restenosis Rate (%)Stent Restenosis Rate (%)26.66% 26.66% ±± 14.7014.70InIn--Stent Diameter Stenosis (%)Stent Diameter Stenosis (%)2.01 mm 2.01 mm ±± 0.520.52InIn--Stent MLD (mm)Stent MLD (mm)
Arm 2Arm 2N = 131N = 131 patientspatientsN=116 lesionsN=116 lesions
EuroSTAR TrialEuroSTAR TrialMatched QCA AnalysisMatched QCA Analysis** at 6 Monthsat 6 Months
* * Per protocolPer protocol
* COSTAR I :In stent LL = 0.42 mm+ 0.25

EuroSTAR Angiographic FollowEuroSTAR Angiographic Follow--UpUpBinaryBinary Restenosis Rates at 6 MonthsRestenosis Rates at 6 Months
2.0
0.7
4.7
6.9
2.61.7
6.9
3.4
0.0
2.0
4.0
6.0
8.0
10.0
In-Stent Prox Edge Distal Edge In-Segment
Arm 1 (N=149 lesions) Arm 2 (N=116 lesions)
Res
teno
sis
Rat
e %
Res
teno
sis
Rat
e %
P = 0.25P = 0.25 P = 1.00P = 1.00 P = 0.58P = 0.58 P = 0.59P = 0.59

Hierarchical MACE: Implant to 6 MonthsHierarchical MACE: Implant to 6 MonthsArm 1 Arm 1 vsvs. . Arm 2Arm 2
1.4 1.4 1.7
4.8
1.5
3.8 3.6
9.2
00 000.0
2.0
4.0
6.0
8.0
10.0
12.0
Cardiac Death Q-Wave MI Non Q-Wave MI CABG TLR CumulativeMACE
Arm 1 (N=145 patients) Arm 2 (N=137 patients)
Clin
ical
Eve
nt R
ate
%C
linic
al E
vent
Rat
e %
P = 0.5P = 0.5 P = 0.2P = 0.2 P = 0.3P = 0.3 P = 0.3P = 0.3 P = 0.2P = 0.2

Late Stent Thrombosis: Beyond 6 MonthsLate Stent Thrombosis: Beyond 6 MonthsAllAll Patients Reaching 12 Month FollowPatients Reaching 12 Month Follow--UpUp
Plavix Cessation at 6 Months per ProtocolPlavix Cessation at 6 Months per Protocol
001,0031,003831831TotalTotal
0000
194194158158
145145137137
EuroSTAREuroSTARArm 1Arm 1Arm 2Arm 2
00310310271271SCEPTERSCEPTER
001321328787COSTAR ICOSTAR I
00209209191191PISCESPISCES
Thrombosis Thrombosis > 6 months> 6 months
StentsStentsPatientsPatientsTrial NameTrial Name

COSTAR Indian & European ExperienceCOSTAR Indian & European Experienceconclusion 1conclusion 1
The CoStar™ Cobalt Chromium Stent System is highly deliverable, radiopaque and permits a high acute success rate in the setting of direct stenting. Over 50% of the patients in both treatment arms were direct stented in EUROSTAR.10 µg (0.7 µg/mm) dose delivered murally was the most effective dose in both studies.Very low dose of 3µg(0.22 µg/mm) ineffective , behaves like BMS.Late loss , restenosis rates and LAST very acceptable for a good DES even in complex population of COSTAR 1. The results consistent upto 12 months follow up in 10 µg(0.7 µg/mm2) released in 30 days formulation.
The CoStarThe CoStar™™ Cobalt Chromium Stent System is highly Cobalt Chromium Stent System is highly deliverable, radiopaque and permits a high acute deliverable, radiopaque and permits a high acute success rate in the setting of direct stenting. Over 50% success rate in the setting of direct stenting. Over 50% of the patients in both treatment arms were direct of the patients in both treatment arms were direct stentedstented in EUROSTAR.in EUROSTAR.10 10 µµg (0.7 g (0.7 µµg/mm) dose delivered g/mm) dose delivered murallymurally was the most was the most effective dose in both studies.effective dose in both studies.Very low dose of 3Very low dose of 3µµg(0.22 g(0.22 µµg/mm) ineffective , behaves g/mm) ineffective , behaves like BMS.like BMS.Late loss , Late loss , restenosisrestenosis rates and LAST very acceptable rates and LAST very acceptable for a good DES even in complex population of for a good DES even in complex population of COSTAR 1. COSTAR 1. The results consistent The results consistent uptoupto 12 months follow up in 10 12 months follow up in 10 µµg(0.7 g(0.7 µµg/mmg/mm22) released in 30 days formulation.) released in 30 days formulation.

COSTAR Indian & European ExperienceCOSTAR Indian & European Experienceconclusion 2conclusion 2
Short release formulation showed the most re-bound clinically from 4 to 12 months in COSTAR 1 study.Drug dose and release patterns are both very important determinants of efficacy.There was no late thrombosis after cessation of 6 months dual antiplatelet therapy in both COSTAR I and EUROSTAR studies upto 12 months.The safety and efficacy of COSTAR is consistent in all the studies carried out so far.
Short release formulation showed the most reShort release formulation showed the most re--bound clinically from 4 to 12 months in bound clinically from 4 to 12 months in COSTAR 1 study.COSTAR 1 study.Drug dose and release patterns are both very Drug dose and release patterns are both very important determinants of efficacy.important determinants of efficacy.There was no late thrombosis after cessation of There was no late thrombosis after cessation of 6 months dual 6 months dual antiplateletantiplatelet therapy in both therapy in both COSTAR I and EUROSTAR studies COSTAR I and EUROSTAR studies uptoupto 12 12 months.months.The safety and efficacy of COSTAR is The safety and efficacy of COSTAR is consistent in all the studies carried out so far.consistent in all the studies carried out so far.