Embed Size (px)
Citation preview

Sun Life Financial Inc. ANNUAL REPORT
Life's brighter under the sunLife's brighter under the sun

TABLE OF CONTENTS 02 Financial highlights
03 Chairman’s message
04 CEO’s message
09 Management’s discussion and analysis
89 Consolidated financial statements and notes
164 Sources of earnings
167 Board of directors and executive team
168 Subsidiaries and associates
171 Major offices
173 Corporate and Shareholder information
THE WORLD OF SUN LIFE Sun Life Financial is a leading international financial services organization providing insurance, wealth and asset management solutions to individual and corporate Clients. Sun Life Financial has operations in a number of markets worldwide, including Canada, the United States, the United Kingdom, Ireland, Hong Kong, the Philippines, Japan, Indonesia, India, China, Australia, Singapore, Vietnam, Malaysia and Bermuda.
3434,,000000 111122,,909000 EMPLOYEES ADVISORS
OFFICES IN
2626 cocouunnttrriieess At the end of 2017. Includes Asia joint ventures.
OUR FOUR PILLAR STRATEGY Our strategy is focused on four key pillars of growth, where we aim to be a leader in the markets in which we operate.
CAN US AM ASIA
A Leader in A Leader in A Leader in A Leader in Insurance and U.S. Group global Asset Asia through
Wealth Solutions Benefits and Management Distribution in our Canadian International Excellence in
home market high net worth Higher Growth solutions Markets

$975 billion ASSETS UNDER MANAGEMENT1
Honouring his late sister Sri Rahayu, Darnoto used the proceeds from her Sun Life
insurance policy to help with his own financial security and
to open a restaurant in his sister’s memory.
BBAALLAANNCCEEDD & D& DIIVEVERRSSIIFFIIEED BUD BUSSIINNEESSSS
2017 UNDERLYING INCOME BY TYPE OF BUSINESS1,2
Run-Off
30%30%
28%
19%
10%
13%13%
Asset Management
Group Insurance
Wealth Individual Insurance
2017 UNDERLYING NET INCOME BY BUSINESS GROUP1,2
SLF U.K.
SLF U.S.
SLF Canada
SLF Asia
35%35%
12%
19%
4%
30%30%
SLF Asset Management
1,2 See footnotes on page 2
OUR PURPOSE
Helping our Clients achieve lifetime financial security and live healthier lives
Darnoto (left) with his Sun Life advisor, Hymne Nefolina, in our Indonesia office.

-
FINANCIAL HIGHLIGHTS DDEELIVELIVERRIINNGG VVAALLUUE TE TOO SSHARHAREEHHOOLLDDEERRSS
108%
138%
94%
51%
100%
120%
140%
160%
80%
60%
40%
20%
0%
-20% Dec-12 Dec-14 Dec-15 Dec-16 Dec-17 8%
$1.745$1.745 20172017
Dividend per Common Share3Total Shareholder Return
Sun Life TSX Composite S&P 500 TSX Financial Sector
Represents Total Shareholder Return as described in our 2017 Management Information Circular. Data source: Bloomberg.
NETNET IINNCCOOMEME1,1 ,33
Reported Underlying
$2.1$2.1 BILLB IONILLION
14% 9%$2.5$2.5 BILLB IONILLION
SSAALELESS GGRROOWWTHTH1,1 ,33
5% 10% WEALTH & ASSET INSURANCE
MANAGEMENT
STSTRROONNGG CAPCAPIITTAAL ANL AND FD FLLEEXXIIBBLLEE BBAALLAANNCCE SE SHHEEEETT
Financial Leverage Ratio1 Minimum Continuing Capital and Surplus Requirements (MCCSR) Ratio25.2%
23.6% 23.6%
22.1% 246% 221% SUN LIFE FINANCIAL INC. SUN LIFE ASSURANCE
2014 2015 2016 2017 Target Leverage Ratio (25%)
-MMEEDDIIUUMM TTEERRM FM FIINANNANCICIAL OAL OBBJJEECCTTIIVVEESS11
BASED ON UNDERLYING NET INCOME
Average EPS growth 8-10% per annum
ROE 12-14%
2017 PROGRESS ON MEDIUM-TERM OBJECTIVES
Targeted dividend payout ratio 40-50%
9% 12.7% 42% EARNINGS PER SHARE3 FULL YEAR ROE DIVIDEND PAYOUT RATIO
1All figures as of December 31, 2017. Underlying net income, underlying return on equity, underlying earnings per share, financial leverage ratio, dividend payout ratio, sales and assets under management described on pages 1-8 of this Annual Report represent non-IFRS financial measures. For additional information see Non-IFRS Financial Measures in our 2017 annual Management’s Discussion and Analysis. 2 Excludes Corporate Support results 3Percentage results are in comparison to 2016
2017 Reported Net Income by Business Group: SLF Canada 40%, SLF U.S. 13%, SLF Asset Management 27%, SLF Asia 13%, SLF U.K. 7%
2017 Reported Net Income by Type of Business: Run-off -10%, Asset Management 28%, Wealth 15%, Individual Insurance 46%, Group Insurance 21%

To my Fellow Shareholders
2017 was another year of progress as we continue to build long-term sustainable value for our Shareholders and Clients. Growth momentum in each of our business pillars contributed to strong financial results and we again increased our common share dividend twice during the year. Underlying earnings per share growth, underlying return on equity and the dividend payout ratio for 2017 were all well within our medium-term financial objectives.
These results are a reflection of Sun Life’s balanced and diversified business model and prudent risk profile, which continue to be distinguishing strengths. This strong footing enables Sun Life to intensify its investments in its Client-centric model that puts our Clients at the centre of everything we do. Your Board has strong confidence in the Company’s strategy. During the year, we spent considerable time reviewing priorities and progress on the strategy and on talent plans to ensure Sun Life has the leadership and capabilities to be successful today and to meet the varied challenges we will face in the future.
The Board was delighted to see Dean Connor named Canada’s Outstanding CEO of the Year® for 2017, a well-deserved recognition for both Dean and all Sun Life employees who have contributed to our growth and success over the past several years. During the past year, Dean has also successfully implemented healthy renewal of his strong executive team, with two new members added and four role changes that leverage our experienced senior leaders in new portfolios.
The Board has heightened its oversight on diversity and inclusion,
as well as plans to increase talent in strategic areas such as analytics
and digital, all vital to achieving our ambition and Purpose.
Sun Life has signed on to the Catalyst Accord 2022 and joined the 30% Club Canada which aims to increase the number of women on Boards and in leadership positions.
The Board remains steadfast in its commitment to effective governance and prudent oversight to help ensure Sun Life continues to flourish as a sustainable organization that has the ability to deliver long-term value to our Clients, employees, Shareholders and communities. For the ninth consecutive year, Sun Life was recognized as one of the Global 100 Most Sustainable Corporations in the World.
I would like to take this opportunity to sincerely thank retiring director Réal Raymond for his outstanding contributions to Sun Life’s Board over the past five years.
On behalf of the Board, thank you to our Shareholders and Clients for your trust and loyalty, and to the Sun Life team around the world for their efforts to achieve our Purpose of helping Clients achieve lifetime financial security and live healthier lives. I’m confident of our bright future together.
William (Bill) D. Anderson Chairman of the Board C
HA
IRM
AN
’S M
ESSA
GE
2017 Sun Life Financial Inc. | Annual Report 03

CEO
’S M
ESSA
GE
2017 – A PIVOTAL YEAR FOR SUN LIFE
2017 was a year of significant progress at Sun Life. Our financial performance was strong: underlying net earnings grew 9% to over $2.5 billion, we increased the dividend by 8%, and we continued to deliver against our medium-term financial goals. It was also the year we saw the whole organization get behind our Client 2020 strategy, with a relentless focus on doing more for Clients. We have great momentum on our journey to become one of the best insurance and asset management companies in the world.
$2.5 billion UNDERLYING NET INCOME
Our four pillar strategy continues to generate strong business growth. In Canada, sales of insurance and wealth solutions have each nearly doubled over the last five years. This includes the expansion of Sun Life Global Investments, which reached $20 billion in assets under management in just seven years since start-up.
In the U.S., our employee benefits business reached its target profitability range two years ahead of time, while improving our offerings to Clients through one of the broadest suites of products and services in the industry. The integration of our 2016 acquisition is on track to achieve our stated goals.
Sun Life Investment Management continues to develop as part of our Asset Management pillar, generating over $6 billion of net inflows in 2017. MFS delivered excellent returns for Clients and in January 2018, MFS AUM crested US$500 billion for the first time, buoyed by strong fund performance and market returns.
On the other side of the globe, underlying earnings from Sun Life Asia more than tripled in the past five years, reaching $330 million in 2017. Asia continues to represent a multi-decade growth opportunity, given its trajectory of demographic and economic potential.
Our risk culture and actions to de-risk the Company over the past years have placed us in a strong financial position. As the industry shifts to Life Insurance Capital Adequacy Testing (LICAT), a more risk-sensitive measurement of regulatory capital, we expect that capital will remain a key strength for Sun Life. We’re well positioned to invest in growth and innovation in a way that will define Sun Life in the decades to come.
RALLYING AROUND OUR PURPOSE
Helping Clients achieve lifetime financial security and live
healthier lives
I regularly receive emails and letters from Clients that speak to the critical role we play in their lives, and why we are in business. That’s why in 2017 we broadened our Purpose to go beyond helping our Clients achieve lifetime financial security to also highlight the role we play when it comes to health and wellness. Health and wellness-related offerings now represent more than 20% of our business worldwide, with opportunities for further growth.
Here’s a great example of our Purpose in action. Our Canadian Digital Health Solutions team emailed 10,000 Clients who were using an older type of glucose meter for their diabetes.
04 2017 Sun Life Financial Inc. | Annual Report

On behalf of the glucometer manufacturer, we offered them a free Bluetooth-enabled upgrade that makes it easier to monitor blood sugar. About 1,800 Clients signed up for the offer, an exceptional response rate, and we received very positive feedback. As one Client said: “I think focusing on proactive versus reactive heath is really important and love that you did this.”
CLIENTS AT THE CENTRE
As part of living our Purpose, we’re obsessing about making it easier to do business with us and being more proactive and personalized
for Clients. We’re also improving our problem resolution when we make a mistake.
Sometimes that means changing on the fly. For hurricanes Harvey and Irma in the southern U.S., we made special accommodations for affected Clients, including extra time to make payments, proactive calls to those receiving disability income cheques in affected areas, and an easy way to submit temporary addresses so those cheques arrived uninterrupted. One Client, who said he was never compelled to provide feedback in his life, wrote to say his experience with Sun Life showed “exceptional professionalism and heartfelt caring.”
Across the organization, we can see and feel the passion to create better experiences for our Clients. In Canada, we’ve improved how we handle call centre inquiries if our first line responders need to escalate more complex issues. Our sales processes in Asia are being digitized to be simpler and faster for Clients, while in the U.S. we’ve reduced the time it takes for newly hired employees to join their benefits program through a better enrollment platform. Our U.K. team continues to make it easier for Clients to do business with us by updating digital processes for annuitants and using plain language across all Client materials.
We’re offering more product choices for Clients, with additions to our Islamic insurance offerings in Asia and the acquisition of Excel Funds by Sun Life Global Investments, bringing more emerging markets funds to our Clients in Canada. This includes the Excel India Fund, which had the highest return of any mutual fund in Canada over the past 15 years. In the U.S., we’ve added a new plan to our Vision offering and launched our Sun Life Dental Network®, the country’s largest preferred provider dental network.
Our Sun Life Investment Management companies are teaming up to provide innovative new investment solutions for Clients and in the U.S. added a leveraged finance team and a private client capability. One of those companies, Sun Life Institutional Investments, was named the fastest growing asset money manager in Canada by Benefits Canada in the $1-$10 billion AUM category.
2017 Sun Life Financial Inc. | Annual Report 05
We get regular feedback from Clients through our Client experience research. The numbers tell us we’re on the right path, particularly the increase in proactive and personal contact with Clients, and growing digital adoption.
EASY ACCESS FOR CLIENTS We’re making it easier for Clients to access Sun Life by enhancing our distribution channels and touchpoints to reach us, buy our products and receive service – how and when they want – whether it’s online, on the phone or in person.
Sun Life GO launched in Canada and offers an easy way to buy life insurance online, including far fewer underwriting questions. In Malaysia, we joined forces with U Mobile to offer life insurance to the firm’s large subscriber base entirely through their mobile devices. Our telco partnerships in Asia connect our insurance knowhow with the Client and data capabilities of these firms. While these initiatives are in the early stages, we believe they have strong promise and will provide important insights as we build our digital business.
We also continue to invest in our advisor distribution forces, including our Career Sales Force in Canada and our Most Respected Advisor program in Asia. Sun Life advisors, including our joint ventures in Asia, grew 13% to finish the year at more than 112,000. Alongside this foundation, we continue to build out our third-party, broker and direct channels in Canada and Asia, as well as our Asia bancassurance and telco distribution.
DIGITAL TRANSFORMATION AND NEW BUSINESS MODELS
Our mobile apps are growing in popularity and features. In the Philippines, we have the first insurance and mutual fund mobile app with account management capabilities and it’s one of the top-rated financial apps in the country. We also enhanced our U.S. dental and vision mobile app, allowing plan members to add their dental ID card to their Apple wallet.
Canadian Clients can submit health claims in real-time, check investment balances, make contributions, and connect with their advisor on their mobile. They can even rate providers of paramedical services, with a remarkable three million ratings to date. Our Clients have made my Sun Life Canada the highest rated Canadian financial services app in the App Store.
We’re using data to be more personal and proactive with our Clients. In Canada, we now have more than 100 kinds of nudges for Clients depending on their specific circumstances. Data is also behind Ella, our interactive digital coach that can help Clients make the most of their benefits and pension plans. In the U.S., we have a powerful analytic tool that generates custom group plan benchmarks for brokers and Clients in under a minute, which is a real differentiator for Clients and their advisors.
06 2017 Sun Life Financial Inc. | Annual Report

We continue to invest in Digital Health Solutions, launching several pilots in 2017 to increase our connections with Clients. We’re helping them learn more about their health conditions, innovative health and wellness solutions, and making it easier to find top-rated paramedical, dental and other health resources nearby. Clients are responding favourably, viewing Sun Life as a trusted partner that can help them live healthier lives.
Another exciting initiative under our digital business strategy is our relationship with Collective Health, a Silicon Valley healthtech company offering alternatives to traditional health plans for the large self-funded employer market in the U.S. Our aim is to combine their innovative health benefits technology platform with our deep product and market knowledge to create an improved benefits experience for self-funded employers and their employees.
CHAMPIONING A CLIENT FOCUSED CULTURE
To create a truly magnetic Client experience, we don’t have to change just one thing; we
need to change nearly every thing.
We’re investing in top talent to execute on our strategy, including new people and roles to advance our innovation, digital, data and Client experience capabilities. Client focus is now embedded throughout our employee programs, including 25% of our annual incentive plan for all employees tied to improvements for Clients. Employees are also contributing through The Brighter Way program, our version of Lean Six Sigma. We’ve implemented thousands of ideas from employees to improve how we do things at Sun Life. These changes – large and small – are collectively making a big difference.
We’ve changed many of our offices into “BrightWork” environments, which are vibrant and collaborative spaces that give employees and teams the flexibility to choose how and where they work. This creates a terrific energy, improves how we work together and is a real draw to attract top talent. Our new global headquarters, which opened this year at One York Street in Toronto, is one example. It’s home to 2,000 employees in our Corporate Office and Canadian businesses and hosts our innovation lab, Sun Life’s Ignite Studio, where teams come together to invent, test and bring new ideas to life.
2017 Sun Life Financial Inc. | Annual Report 07

A SUSTAINABLE ORGANIZATION Sustainability is at the centre of our business strategy – after all, we make promises to Clients that span generations, and we commit to Shareholders to deliver long-term sustainable value. This includes our commitment to building brighter, healthier communities where we live and work. On our environmental footprint, we’ve set ambitious new targets to reduce our greenhouse gas emissions – by 20% by 2020 and 30% by 2030.
Bentall Kennedy, in our Sun Life Investment Management group, continues to be ranked among the top firms in the Global Real Estate Sustainability Benchmark for its sustainable investing and property management. Through Sun Life Investment Management, we have $11 billion invested globally in infrastructure projects supporting community health and sustainability – including healthcare facilities, renewable and affordable energy sources and sustainable transit infrastructure.
We’re expanding our activities on the prevention and treatment of diabetes, a disease that continues to rise at alarming rates and affects many of our Clients around the world. Partnerships with the Toronto Raptors and Boston Celtics basketball teams provide new ways to raise awareness about diabetes, with a specific focus on encouraging youth to be active and eat a balanced diet. In Asia, we launched a Diabetes Awareness Study in five markets to gauge public understanding of diabetes as a first step to creating more dialogue. We have pledged more than $22 million to this cause since 2012, the largest community wellness initiative in our history.
A BRIGHT FUTURE
There is a palpable ‘buzz’ in Sun Life today, a sense of innovation and opportunity, and
tremendous alignment around our Purpose and strategy.
Youth from Boys and Girls Clubs of Canada at a healthy snack demonstration. Part of an event recognizing their nutrition and physical activity achievements in the Sun Life Dunk for Diabetes program.
In our Client 2020 journey we have taken many significant and bold steps, but there’s a lot more to be done. I’m excited to see the pace of this work continue and I’m confident that the actions we’re taking today will appear in the capabilities and performance of the company for decades to come.
Thank you to our Shareholders and Clients for your support and confidence as we pursue this strategy. Thanks to our Board of Directors, for their guidance and oversight and their ongoing contributions to our strategy. And thank you to our employees and advisors, who bring this strategy to life with every single Client interaction across Sun Life. I’m pleased with our accomplishments so far, and am excited for what is coming next.
Dean A. Connor President & Chief Executive Officer
08 2017 Sun Life Financial Inc. | Annual Report

MANAGEMENT’S
DISCUSSION AND ANALYSIS
10 A. HOW WE REPORT OUR RESULTS
11 B. OVERVIEW 11 1. Strategy
13 2. Financial Objectives
13 3. Acquisitions
14 C. FINANCIAL SUMMARY
15 D. PROFITABILITY 15 2017 vs. 2016
17 E. GROWTH 17 1. Sales
18 2. Premiums and Deposits
18 3. Assets Under Management
19 F. FINANCIAL STRENGTH
21 G. PERFORMANCE BY BUSINESS GROUP 22 1. SLF Canada
25 2. SLF U.S.
29 3. SLF Asset Management
32 4. SLF Asia
35 5. Corporate
35 H. INVESTMENTS 36 1. Investment Profile
36 2. Debt Securities
37 3. Equities
38 4. Mortgages and Loans
39 5. Derivatives
41 6. Investment Properties
41 7. Impaired Assets
41 8. Asset Default Provision
42 I. CAPITAL AND LIQUIDITY MANAGEMENT 42 1. Capital
44 2. Capital Adequacy
45 3. Shareholder Dividends
45 4. Principal Sources and Uses of Funds
46 5. Liquidity
47 J. RISK MANAGEMENT 47 1. Risk Management Framework
47 2. Risk Universe
47 3. Risk Culture and Philosophy
48 4. Risk Appetite
49 5. Risk Governance
50 6. Risk Management Policies
51 7. Risk Management Process
51 8. Risk Categories
68 K. ADDITIONAL FINANCIAL DISCLOSURE 68 1. Items related to Statement of Operations
70 2. Items related to Statement of Financial Position
71 3. Fourth Quarter 2017 Profitability
74 4. Previous Quarters
75 L. NON-IFRS FINANCIAL MEASURES
78 M. ACCOUNTING AND CONTROL MATTERS 78 1. Critical Accounting Policies and Estimates
84 2. Changes in Accounting Policies
86 3. Disclosure Controls and Procedures
87 N. LEGAL AND REGULATORY PROCEEDINGS
87 O. FORWARD-LOOKING STATEMENTS
Management’s Discussion and Analysis Sun Life Financial Inc. Annual Report 2017 9

Management’s Discussion and Analysis February 14, 2018
A. How We Report Our Results
Sun Life Financial Inc. (“SLF Inc.”) is a leading international financial services organization providing insurance, wealth and asset management solutions to individual and corporate Clients. Sun Life Financial has operations in a number of markets worldwide, including Canada, the United States, the United Kingdom, Ireland, Hong Kong, the Philippines, Japan, Indonesia, India, China, Australia, Singapore, Vietnam, Malaysia and Bermuda. As of December 31, 2017, Sun Life Financial had total assets under management (“AUM”) of $975 billion.
SLF Inc. is a publicly traded company domiciled in Canada and is the holding company of Sun Life Assurance Company of Canada (“Sun Life Assurance”). In this management’s discussion and analysis (“MD&A”), SLF Inc., its subsidiaries and, where applicable, its joint ventures and associates are collectively referred to as “the Company”, “Sun Life Financial”, “we”, “our”, and “us”. Unless otherwise indicated, all information in this MD&A is presented as at and for the year ended December 31, 2017 and the information contained in this document is in Canadian dollars. Where information at and for the year ended December 31, 2017 is not available, information available for the latest period before December 31, 2017 is used. Except where otherwise noted, financial information is presented in accordance with International Financial Reporting Standards (“IFRS”) and the accounting requirements of Office of the Superintendent of Financial Institutions (“OSFI”).
We manage our operations and report our financial results in five business segments: Sun Life Financial Canada (“SLF Canada”), Sun Life Financial United States (“SLF U.S.”), Sun Life Financial Asset Management (“SLF Asset Management”), Sun Life Financial Asia (“SLF Asia”), and Corporate. Information concerning these segments is included in our annual and interim consolidated financial statements and accompanying notes (“Annual Consolidated Financial Statements” and “Interim Consolidated Financial Statements”, respectively) and this annual management’s discussion and analysis (“MD&A”).
i. Use of Non-IFRS Financial Measures
We report certain financial information using non-IFRS financial measures, as we believe that these measures provide information that is useful to investors in understanding our performance and facilitate a comparison of our quarterly and full year results from period to period. These non-IFRS financial measures do not have any standardized meaning and may not be comparable with similar measures used by other companies. For certain non-IFRS financial measures, there are no directly comparable amounts under IFRS. These non-IFRS financial measures should not be viewed as alternatives to measures of financial performance determined in accordance with IFRS. Additional information concerning these non-IFRS financial measures and reconciliations to the closest IFRS measures are available in section L - Non-IFRS Financial Measures in this document. Further additional information concerning these non-IFRS financial measures and reconciliations to the closest IFRS measures are included in the Supplementary Financial Information packages that are available on www.sunlife.com under Investors - Financial results & reports.
ii. Forward-looking Statements
Certain statements in this document are forward-looking statements within the meaning of certain securities laws, including the “safe harbour” provisions of the United States Private Securities Litigation Reform Act of 1995 and applicable Canadian securities legislation. Additional information concerning forward-looking statements and important risk factors that could cause our assumptions, estimates, expectations and projections to be inaccurate and our actual results or events to differ materially from those expressed in or implied by such forward-looking statements can be found in section O - Forward-looking statements in this document.
iii. Additional Information
Additional information relating to the Company can be found in SLF Inc.’s Annual Consolidated Financial Statements, Interim Consolidated Financial Statements and Annual Information Form (“AIF”) for the year ended December 31, 2017. These documents are filed with securities regulators in Canada and are available at www.sedar.com. SLF Inc.’s Annual Consolidated Financial Statements, annual MD&A and AIF are filed with the United States Securities and Exchange Commission (“SEC”) in SLF Inc.’s annual report on Form 40-F and SLF Inc.’s interim MD&As and Interim Consolidated Financial Statements are furnished to the SEC on Form 6-Ks and are available at www.sec.gov.
10 Sun Life Financial Inc. Annual Report 2017 Management’s Discussion and Analysis

Digital, Data & Analytics
Financial Discipline
Talent & Culture
CLIENTDist
ribution Excellence
B. Overview
Sun Life Financial is a leading international financial services organization providing a diverse range of insurance, wealth and asset management solutions to individual and corporate Clients.
Our Purpose is to help our Clients achieve lifetime financial security and lead healthier lives. Our ambition is to be one of the best insurance and asset management companies in the world. In achieving that ambition, we aim to: • Have top quartile Client scores relative to our competitors • Have each pillar be viewed as one of the best in its market • Have top quartile total shareholder return • Have a disproportionate share of top talent, wrapped in an empowering culture
1. Strategy
We aim to provide outstanding value to our Clients. Our Client Centric model drives a strong Client experience across our four pillars. Our strategy puts the Client at the centre of everything we do; having Client-focused distribution; digitally transforming our business models and leveraging data and analytics; building a disproportionate share of top talent, wrapped in a winning culture; and, continuing our track record of prudent risk and financial discipline. We believe this Client strategy will allow us to gain a distinct competitive advantage to achieve our goal to be a leader in each of our four key pillars.
Our Client Strategy Our Client centric strategy has five key areas of focus, which we are pursuing across each of our four pillars. They define how we compete in our markets, extend our competitive advantages, fulfill our purpose and support our ambition to be one of the best insurance and asset management companies globally.
Client: Our Clients are at the centre of everything we do and we are focused on building lasting Client relationships and deepening the value to our Clients by providing quality products and services that deliver on our Purpose. We believe this will allow us to maximize the value we provide our Clients, and lead to better business outcomes for Sun Life. We will achieve this by: • Making it easier to do business with us • Being more proactive in contacting and engaging with our Clients • Delivering consistently superior Client service
Distribution Excellence: Our Clients will work with high quality distribution partners who put them at the centre of what they do. They will engage Clients where, when and how they wish, in a personalized way. We will continue to invest in our distribution capabilities, through digital channels and by enabling our advisors, agents, partners and brokers to deliver great Client experiences.
Digital, Data & Analytics: Our Digital, Data & Analytics capabilities are critical, both to delivering value to our Clients and for efficiency and effectiveness, while respecting our Clients’ privacy. As consumer preferences evolve and technological advancements enable new possibilities and services, Sun Life is investing in new capabilities across our businesses to reach our Clients more effectively, drive efficiencies and explore new business opportunities. Our focus in these areas will be to: • Digitize current processes and interactions • Be more proactive, predictive, and personalized with our Clients • Build and deploy new digital business models, such as the introduction of Digital Health Solutions to help Canadians access the
latest in digital capabilities and innovations to take care of their health and well-being • Use data to strengthen Client relationships, deliver better products, services and solutions, and enhance our efficiency,
effectiveness and profitability
Financial Discipline: Our continued financial and risk management prudence, disciplined capital allocation and strong execution will support our medium-term financial objectives and allow us to meet our aim of top quartile total shareholder returns while maintaining a preferred risk and capital profile.
CAN
AM
A Leader in insurance and Wealth Solutions in our Canadian home market
A Leader in global Asset Management
A Leader in U.S. Group Benefits and International high net worth solutions
A Leader in Asia through Distribution Excellence in Higher Growth Markets
US
ASIA
Management’s Discussion and Analysis Sun Life Financial Inc. Annual Report 2017 11

Talent and Culture: Delivering on our strategy will require that we maintain our focus on attracting, retaining and developing the best talent, while also continuing to evolve our talent and culture to manage the increasing pace of change. Specifically, our talent goals are to continue to: • Attract a disproportionate share of top talent across our geographies, wrapped in an empowering culture • Build on our high performance culture and support and reward our diverse, talented work force • Ensure that our focus on our Clients becomes deeply embedded in our unique and inclusive culture • Remain committed to the highest standards of business ethics and good governance
Our four pillars Our four pillars define the businesses and markets in which we compete. In each of these pillars we have competitive scale and strong growth prospects. We aim to be leaders across all four pillars in order to create value for our Clients and shareholders. In targeting these four pillars, we are focused on businesses that have strong growth prospects, higher return on equity (“ROE”) and strong capital generation in attractive global markets.
A leader in insurance and wealth solutions in our Canadian home market • Provides products and services to over six million Canadians via our Group and Individual businesses that deliver value to our
Clients • The largest provider of benefits and pensions in the workplace • Provides wide range of wealth and insurance products to individuals via retail channels, including our leading Career Sales
Force
A leader in U.S. Group Benefits and International High Net Worth Solutions • One of the market leaders in Group Benefits; providing insurance solutions to employers and employees including group life,
disability, medical stop-loss, dental, and vision insurance products, as well as a suite of voluntary benefits products that meet Client needs
• Among the global leaders providing life insurance solutions for international High Net Worth Clients
A leader in global asset management • Deliver investment products through MFS and SLIM that will deliver growth in traditional active asset management as well as
liability-driven investing and alternative asset classes that deliver superior value to Clients • MFS is a premier global asset management firm offering a comprehensive selection of asset management products and
services to retail and institutional investors around the world • SLIM is an institutional investment management business delivering customized liability-driven investing, alternative fixed
income, and real estate solutions
A leader in Asia through Distribution Excellence in Higher Growth Markets • Operates across seven markets: Philippines, Hong Kong, Indonesia, Vietnam, Malaysia, India, and China • Offers individual life and health insurance that deliver Client value in all markets • In select markets, also offers asset management and group retirement products and services
Underpinning our strategy is an enduring commitment to Sustainability Sun Life’s focus on advancing sustainability - centred around a vision of building sustainable, healthier communities for life - is a key initiative for the company and is essential to our overall business success.
We define sustainability as taking accountability for our social, environmental, economic and governance impacts, risks and opportunities, in ways that help to ensure our long-term ability to deliver value to our Clients, employees, shareholders and communities.
Our company-wide sustainability strategy, approved by our Board of Directors, focuses on four key areas within which we continue to deepen our commitment and strengthen our practices: • Organizational resilience: We cultivate an organization that is competitive, forward-thinking, resilient and sustainable for the long
term, so we can continue to meet the needs of our Clients, who are at the centre of all that we do. • Environmental responsibility: We are accountable for the impact of our operations on the environment, so we’re consistently
taking steps to measure, manage and reduce that impact. • Community wellness: We believe that by actively supporting the communities in which we live and work, we can help to build a
positive environment for our Clients, employees, advisors and shareholders. • Governance and risk management: We believe a well-run organization contributes to a stable operating platform for the
company, and positions us to meet our obligations to stakeholders. Pro-active risk management and an embedded risk culture are essential to our long-term success.
For additional information on our sustainability strategy, refer to our latest Sustainability Report.
12 Sun Life Financial Inc. Annual Report 2017 Management’s Discussion and Analysis

2. Financial Objectives
The company has outlined the following medium-term financial objectives:
Measure(1) Medium-term financial objectives
Three-Year Average(2) 2017 results
Underlying EPS growth Growth in EPS reflects the Company’s focus on generating sustainable earnings for shareholders.
Underlying ROE ROE is a significant driver of shareholder value and is a major focus for management across all businesses.
Dividend payout ratio Payout of capital serves shareholder value, based on underlying net income.
8%-10%
12%-14%
40%-50%
12%
12.6%
42%
9%
12.7%
42%
(1) Underlying earnings per share (“EPS”), underlying ROE, and the dividend payout ratio are non-IFRS financial measures. See section L - Non-IFRS Financial Measures. The dividend payout ratio represents the ratio of common shareholders’ dividends to underlying net income. See section I - Capital and Liquidity Management - Capital in this document for further information regarding dividends.
(2) Underlying EPS growth is calculated on a three-year compound annual growth rate. Underlying ROE and Dividend payout ratio are based on a 3-year average of 2015 2017.
We have progressed well against our medium-term financial objectives. Although considered reasonable by the Company, we may not be able to achieve our medium-term financial objectives as our assumptions may prove to be inaccurate. Accordingly, our actual results could differ materially from our medium-term financial objectives as described above. Our medium-term financial objectives do not constitute guidance. Our medium-term financial objectives are forward-looking non-IFRS financial measures and additional information is provided in this MD&A in the section O - Forward-looking Statements - Medium-Term Financial Objectives.
3. Acquisitions
The following developments occurred since January 1, 2017. Additional information concerning acquisitions and dispositions is provided in our 2017 Annual Consolidated Financial Statements.
On October 3, 2017, we completed the first stage of our acquisition of the pension business of FWD Life Insurance Company (Bermuda) Limited (“FWD”). The first stage included the acquisition of the Mandatory Provident Fund business and the commencement of an exclusive 15-year distribution agreement with FWD that allows Sun Life Hong Kong Limited to distribute its pension products through FWD’s agency force in Hong Kong. The completion of the second and final stage of the transaction involves the purchase of the Occupational Retirement Schemes Ordinance business of FWD, and is expected to close by the end of 2018, subject to the receipt of regulatory approvals and satisfaction of customary closing conditions. These transactions will strengthen our position in the Hong Kong pension market.
On January 2, 2018, we completed the acquisition of the Excel Funds group of companies, expanding our product suite into emerging market funds.
Management’s Discussion and Analysis Sun Life Financial Inc. Annual Report 2017 13

C. Financial Summary
($ millions, unless otherwise noted) 2017 2016 2015 P
rofi
tab
ilit
y
Net income (loss) Reported net income (loss) 2,149 2,485 2,185 Underlying net income (loss)(1) 2,546 2,335 2,305
Diluted EPS ($) Reported EPS (diluted) 3.49 4.03 3.55 Underlying EPS (diluted)(1) 4.15 3.80 3.76
Reported basic EPS ($) 3.51 4.05 3.57
Return on equity (%) Reported ROE(1) 10.7% 13.0% 12.2% Underlying ROE(1) 12.7% 12.2% 12.8%
Gro
wth
Sales Insurance sales(1) 3,042 2,758 2,172 Wealth sales(1) 145,314 138,319 121,214
Premiums and deposits Net premium revenue 15,281 15,048 10,395 Segregated fund deposits 10,858 11,550 12,047 Mutual fund sales(1) 87,515 84,728 76,551 Managed fund sales(1) 44,093 40,270 30,079 Administrative services only premium and deposit equivalents(1) 6,933 6,863 7,078
Total premiums and deposits(1) 164,680 158,459 136,150
Assets under management General fund assets 162,720 161,071 155,413 Segregated fund assets 106,392 97,167 91,440 Mutual fund assets, managed fund assets and other AUM(1) 705,673 645,037 644,479
Total AUM(1) 974,785 903,275 891,332
Fin
an
cia
l Str
en
gth
MCCSR(2) ratios Sun Life Financial 246% 253% Sun Life Assurance 221% 226% 240%
Financial leverage ratio(1) 23.6% 25.2% 22.1%
Dividend(3)
Dividend yield(4) 3.6% 3.7% 3.6% Dividend payout ratio(1)(5) 42% 43% 40% Dividends per common share ($) 1.745 1.62 1.51
Capital Subordinated debt and innovative capital instruments(6) 4,136 4,534 3,189 Participating policyholders’ equity 650 412 168 Total shareholders’ equity 22,321 21,956 21,250
Total capital 27,107 26,902 24,607
Average common shares outstanding (millions) 613 613 612 Closing common shares outstanding (millions) 610.5 613.6 612.3
(1) Represents a non-IFRS financial measure. See section L - Non-IFRS Financial Measures in this document. (2) Minimum Continuing Capital and Surplus Requirements (“MCCSR”) ratio. (3) See section I - Capital and Liquidity Management - Capital in this document for further information regarding dividends. (4) Dividend yield is calculated on dividends per common share paid divided by the daily annual average share price for the year. (5) Dividend payout ratio is calculated using underlying net income. (6) Innovative capital instruments consist of Sun life ExchangEable Capital Securities (“SLEECS”) which qualify as capital for Canadian regulatory purposes. For additional
information, see the section I - Capital and Liquidity Management - Capital in this document.
14 Sun Life Financial Inc. Annual Report 2017 Management’s Discussion and Analysis

D. Profitability
2017 vs. 2016
The following table reconciles our reported net income and underlying net income. The table also sets out the impact that other notable items had on our reported net income and underlying net income in 2017 and 2016. All factors discussed in this document that impact our underlying net income are also applicable to reported net income.
($ millions, after-tax) 2017 2016
Reported net income 2,149 2,485
Market related impacts(1) (7) 107
Assumption changes and management actions(1)(2) 81 45
Other adjustments(1) (220) (2)
U.S. tax reform(2) (251) —
Underlying net income(3) 2,546 2,335
Reported ROE(3) 10.7% 13.0%
Underlying ROE(3) 12.7% 12.2%
Experience related items(4)
Impact of investment activity on insurance contract liabilities 86 154
Mortality 70 (14)
Morbidity 25 (23)
Credit 74 64
Lapse and other policyholder behaviour (49) (11)
Expenses (95) (124)
Other (15) 39
(1) See section L - Non-IFRS Financial Measures in this document for a breakdown of components within this adjustment. (2) U.S. tax reform of $(251) million includes $(288) million ($(444) million pre-tax) of ACMA, which is excluded from the ACMA of $81 million. (3) Represents a non-IFRS financial measure. See section L - Non-IFRS Financial Measures in this document. (4) Experience related items reflect the difference between actual experience during the reporting period and best estimate assumptions used in the determination of our
insurance contract liabilities.
Our reported net income decreased to $2,149 million in 2017 from 2016, reflecting the impact of the U.S. Tax Cuts and Jobs Act (“U.S. tax reform”), the restructuring charge in the fourth quarter, integration costs, Fair value adjustments on MFS’s share-based payment awards, and interest rates impacts. Underlying net income growth of 9% to $2,546 million reflected favourable mortality and morbidity experience, partially offset by a lower level of gains from investing activity, unfavourable lapse experience and the impact of foreign exchange rates.
i. Market related impacts(1)
Market related impacts in 2017 compared to 2016 was primarily driven by unfavourable changes in interest rates reflecting the flattening of the yield curve in 2017 as long term interest rates dropped compared to rising long term interest rates in 2016, and the unfavourable impact of significant increases in swap spreads. This was partially offset by favourable changes in the fair value of real estate.
ii. Assumption changes and management actions Due to the long-term nature of our business, we make certain judgments involving assumptions and estimates to value our obligations to policyholders. The valuation of these obligations is recorded in our financial statements as insurance contract liabilities and investment contract liabilities and requires us to make assumptions about equity market performance, interest rates, asset default, mortality and morbidity rates, lapse and other policyholder behaviour, expenses and inflation and other factors over the life of our products. We review assumptions each year, generally in the third quarter, and revise these assumptions if appropriate. We consider our actual experience in current and past periods relative to our assumptions as part of our annual review.
During 2017, the net impact of assumption changes and management actions (“ACMA”) resulted in an increase of $81 million to reported net income (excluding the impact of the U.S. tax reform), compared to an increase of $45 million in 2016.
(1) See section L - Non-IFRS Financial Measures in this document for a breakdown of the components.
Management’s Discussion and Analysis Sun Life Financial Inc. Annual Report 2017 15

Assumption Changes and Management Actions by Type The following table sets out the impact of ACMA on our net income in 2017.
2017 Full year
($ millions, after-tax) Impact on net income(1) Comments
Mortality/morbidity 214
Updates to reflect mortality/morbidity experience in all jurisdictions. The largest items were favourable mortality in SLF U.S. In-force Management and International insurance and favourable mortality improvement in SLF U.K.
Lapse and other policyholder behaviour (112)
Updates to reflect lapse and other policyholder behaviour experience in all jurisdictions. The largest items were lower lapse rates on lapse supported business in SLF U.S. and updated lapse assumptions in SLF Canada’s individual insurance business.
Expenses (60)
Updates to reflect expense experience in all jurisdictions. The largest items were a refinement to the allocation of expenses in SLF Canada and increased expenses in the closed block of business in SLF U.S. International wealth.
Investment returns 70
Updates to various investment related assumptions across the Company. This included a reduction of the provision for investment risk in SLF Canada and other updated investment related assumptions, offset partially by updates to promulgated ultimate reinvestment rates.
Model enhancements and other (31)
Various enhancements and methodology changes across all jurisdictions. The largest items were the impact of the recapture of certain reinsurance treaties, updates to the expected cost of reinsurance in certain other treaties, and updates to reflect reinsurance market conditions offset partially by the resolution of tax uncertainties in a U.S. subsidiary.
Total impact on net income(2)(3) 81 (1) ACMA is included in reported net income and is presented as an adjustment to arrive at underlying net income. (2) In this table, ACMA represent the shareholders’ net income impact (after-tax) including management actions. In Note 10.A of our Annual Consolidated Financial Statements,
the impact of method and assumptions changes represents the change in shareholder and participating policyholder insurance contract liabilities net of reinsurance assets (pre-tax) and does not include management actions. Further information can be found in section L - Non-IFRS Financial Measures in this document.
(3) U.S. tax reform of $(251) million includes $(288) million ($(444) million pre-tax) of ACMA, which is excluded from the ACMA of $81 million.
Additional information on estimates relating to our policyholder obligations, including the methodology and assumptions used in their determination, can be found in this MD&A under the section M - Accounting and Control Matters - Critical Accounting Policies and Estimates and in Note 10 in our 2017 Annual Consolidated Financial Statements.
iii. Other adjustments(1)
Other adjustments in 2017 decreased reported net income by $220 million, which compared to 2016 were primarily due to the impact of integration costs related to the U.S. employee benefits business acquired in 2016 of $68 million ($105 million pre-tax), the restructuring charge of $44 million ($60 million pre-tax) related to actions to enhance business processes and organizational structures and capabilities, and Fair value adjustments on MFS’s share-based payment awards.
iv. U.S. tax reform The U.S. tax reform legislation signed into law on December 22, 2017, which took effect on January 1, 2018 includes a reduction to the U.S. corporate tax rate from 35% to 21% for tax years beginning after 2017, changes to the amount of reserves that are tax deductible, and a one-time tax on the deemed repatriation of foreign earnings. In addition, this legislation includes a number of base broadening measures including provisions limiting the deductibility of certain amounts including payments to related foreign taxpayers, and expanded rules impacting foreign source income of non-US affiliates.
As a result of this legislation, the Company has booked a net charge of $251 million ($444 million pre-tax) in the fourth quarter of 2017. This reflects an after-tax charge of $288 million ($444 million pre-tax) to ACMA, and a one-time charge on the deemed repatriation of foreign earnings of $46 million. These are partially offset by a benefit of $83 million(2) relating to the revaluation of deferred tax balances from 35% to 21%.
v. Experience related items Experience related items in 2017 compared to 2016 reflected favourable mortality and morbidity experience in the SLF U.S. Group Benefits business, improved mortality experience in SLF Canada and SLF U.K. and improved expense experience. Expense experience in both periods includes incentive compensation costs arising from overall strong business performance and investments in growing our businesses. Experience related items also reflected a lower level of gains from investing activity on insurance contract liabilities and unfavourable lapse and other policyholder behaviour experience.
vi. Income taxes For 2017, our effective tax rates on reported and underlying net income(3) were 10.8% and 20.5%, respectively, compared to 18.0% and 20.9%, respectively, for 2016. Our effective tax rate on reported net income for 2017 was most notably impacted by higher
(1) See section L - Non-IFRS Financial Measures in this document for a breakdown of the components. (2) Excludes $(30) million relating to the net impact on deferred tax balances attributable to participating policyholders. (3) Our effective income tax rate on underlying net income is calculated using underlying net income and income tax expense associated with underlying net income, which
excludes amounts attributable to participating policyholders.
16 Sun Life Financial Inc. Annual Report 2017 Management’s Discussion and Analysis

reported net income in jurisdictions with lower statutory income tax rates and losses in jurisdictions with higher statutory income tax rates, by the U.S. tax reform, ACMA in SLF U.S., as well as the finalization of prior years’ tax filings, which have resulted in an unusually low effective tax rate on a reported basis for 2017. Our effective tax rate on underlying net income is within our expected range.
Our expected tax range for future years is revised to 15% to 20% as a result of the U.S. tax reform. Our statutory tax rate is normally reduced by various tax benefits, such as lower taxes on income subject to tax in foreign jurisdictions, a range of tax exempt investment income, and other sustainable tax benefits that are expected to decrease our effective tax rate. This new range is based on our current understanding of the base broadening measures referred to in section iv. above, which could impact our corporate structure and/or arrangements between our affiliates. There is also uncertainty surrounding the U.S. states’ interpretation of the U.S. tax reform and the extent to which they will conform with the federal legislation. Note that we expect additional interpretive guidance on these provisions to be issued by the Internal Revenue Service, U.S. Treasury and state tax departments in the future. Such future guidance could impact this updated range.
vii. Impact of foreign exchange rates We have operations in many markets worldwide, including Canada, the United States, the United Kingdom, Ireland, Hong Kong, the Philippines, Japan, Indonesia, India, China, Australia, Singapore, Vietnam, Malaysia and Bermuda, and generate revenues and incur expenses in local currencies in these jurisdictions, which are translated to Canadian dollars.
Items impacting our Consolidated Statements of Operations are translated into Canadian dollars using average exchange rates for the respective period. For items impacting our Consolidated Statements of Financial Position, period end rates are used for currency translation purposes.
The following table provides the foreign exchange rates for the U.S. dollar, which is usually our most significant foreign exchange impact, over the past three quarters and two years.
Exchange rate Quarterly Full year
Q4’17 Q3’17 Q2’17 Q1’17 2017 2016
U.S. Dollar - Average 1.270 1.253 1.345 1.323 1.298 1.325
U.S. Dollar - Period end 1.258 1.247 1.296 1.331 1.258 1.343
In general, our net income benefits from a weakening Canadian dollar and is adversely affected by a strengthening Canadian dollar as net income from the Company’s international operations is translated back to Canadian dollars. Conversely, in a period of losses, the weakening of the Canadian dollar has the effect of increasing losses in foreign jurisdictions. The relative impact of foreign exchange in any given period is driven by the movement of foreign exchange rates as well as the proportion of earnings generated in our foreign operations. We generally express the impact of foreign exchange on net income on a year-over-year basis.
During the year 2017, our reported net income and underlying net income decreased by $53 million and $56 million, respectively, as a result of the impact of the movement of the Canadian dollar in 2017 relative to the average exchange rates in 2016.
E. Growth
1. Sales
($ millions) 2017 2016 2015
Insurance sales(1)
SLF Canada 1,125 950 836
SLF U.S. 1,230 1,148 801
SLF Asia 687 660 535
Total insurance sales 3,042 2,758 2,172
Wealth sales(1)
SLF Canada 14,976 13,200 14,621
SLF Asia 13,056 8,849 7,070
Total wealth sales excluding SLF Asset Management 28,032 22,049 21,691
SLF Asset Management sales(1) 117,282 116,270 99,523
Total wealth sales 145,314 138,319 121,214
Large case longevity insurance sale(1)(2) - SLF Canada — — 5,260
(1) Represents a non-IFRS financial measure. See section L - Non-IFRS Financial Measures in this document. (2) Represents the transfer of longevity risk of BCE Inc.’s Bell Canada pension plan.
Management’s Discussion and Analysis Sun Life Financial Inc. Annual Report 2017 17

Total Company insurance sales were $3,042 million in 2017, compared to $2,758 million in 2016. • SLF Canada insurance sales were up, primarily due to higher sales in GB, partially offset by decreased individual life insurance
sales. • SLF U.S. insurance sales increased largely driven by higher stop-loss sales, partially offset by lower employee benefits sales
and currency impact of $26 million from the strengthening Canadian dollar. • SLF Asia insurance sales were up, mainly reflecting strong sales growth in India, Indonesia, the Philippines and Malaysia,
partially offset by lower sales in Hong Kong and currency impact of $26 million from the strengthening Canadian dollar.
Total Company wealth sales were $145.3 billion in 2017, compared to $138.3 billion in 2016. • SLF Canada wealth sales increased, reflecting higher sales in both GRS and Individual Wealth. • SLF Asia wealth sales were up, primarily driven by increased fund sales in India, higher mutual fund sales in the Philippines and
growth in the MPF sales in Hong Kong, partially offset by lower individual wealth sales in China and currency impact of $164 million from the strengthening Canadian dollar.
• SLF Asset Management sales increased, largely due to higher managed fund sales from SLIM and MFS, partially offset by lower mutual fund sales from MFS and currency impact of $2.4 billion from the strengthening Canadian dollar.
2. Premiums and Deposits Premiums and deposits were $164.7 billion in 2017, compared to $158.5 billion in 2016, primarily attributable to higher fund sales, and increased net premium revenue, partially offset by currency impact of $2.8 billion from the change in the Canadian dollar, and lower segregated fund deposits. Adjusted premiums and deposits of $170.5 billion in 2017 increased $9.3 billion compared to 2016. The increase was largely driven by higher fund sales and net premium revenue, partially offset by lower segregated fund deposits.
($ millions) 2017 2016 2015
Premiums and Deposits Net premium revenue 15,281 15,048 10,395
Segregated fund deposits 10,858 11,550 12,047
Mutual fund sales(1) 87,515 84,728 76,551
Managed fund sales(1) 44,093 40,270 30,079
ASO premium and deposit equivalents(1) 6,933 6,863 7,078
Total premiums and deposits(1) 164,680 158,459 136,150
Adjusted premiums and deposits(2) 170,534 161,217 144,689
(1) Represents a non-IFRS financial measure. See section L - Non-IFRS Financial Measures in this document. (2) Represents a non-IFRS financial measure that adjusts premiums and deposits for the impact of Constant Currency Adjustment and Reinsurance in SLF Canada’s GB
Operations Adjustment as described in section L - Non-IFRS Financial Measures.
Net life, health and annuity premiums were $15.3 billion in 2017, up $0.3 billion from 2016. The change was primarily driven by higher premiums in Individual and GB in SLF Canada and all business units in SLF U.S., partially offset by decreases in Hong Kong in SLF Asia and the currency impact from the change in the Canadian dollar. The strengthening of the Canadian dollar relative to average exchange rates in 2016 decreased net premiums by $180 million.
Segregated fund deposits were $10.9 billion in 2017, compared to $11.6 billion in 2016. The change was largely attributable to decrease in GRS in SLF Canada and the currency impact from the change in the Canadian dollar, partially offset by increase in individual wealth in SLF Canada.
Sales of mutual funds were $87.5 billion in 2017, compared to $84.7 billion in 2016, mainly driven by sales growth in India and the Philippines in SLF Asia, partially offset by the currency impact from the change in the Canadian dollar and decreased sales from MFS. The change of the Canadian dollar relative to average exchange rates in 2016 decreased mutual fund sales by $1.7 billion.
Sales of managed funds were $44.1 billion in 2017, up $3.8 billion from $40.3 billion in 2016, primarily reflecting increases from SLIM, MFS as well as Hong Kong in SLF Asia, partially offset by the currency impact from the change in the Canadian dollar. The change of the Canadian dollar relative to average exchange rates in 2016 decreased managed fund sales by $0.9 billion.
ASO premium and deposit equivalents for 2017 increased $0.1 billion from 2016, primarily attributable to GRS and GB in SLF Canada, partially offset by decreases in Hong Kong in SLF Asia and the currency impact from the change in the Canadian dollar.
3. Assets Under Management AUM consist of general funds, segregated funds and other AUM. Other AUM includes mutual funds and managed funds, which include institutional and other third-party assets managed by the Company.
($ millions) 2017 2016 2015
Assets under management General fund assets 162,720 161,071 155,413
Segregated fund assets 106,392 97,167 91,440
Mutual fund assets, managed fund assets and other AUM(1) 705,673 645,037 644,479
Total AUM(1) 974,785 903,275 891,332
(1) Represents a non-IFRS financial measure. See section L - Non-IFRS Financial Measures in this document.
18 Sun Life Financial Inc. Annual Report 2017 Management’s Discussion and Analysis

AUM were $974.8 billion as at December 31, 2017, compared to AUM of $903.3 billion as at December 31, 2016. The increase in AUM of $71.5 billion between December 31, 2017 and December 31, 2016 resulted primarily from: (i) favourable market movements on the value of mutual funds, managed funds, and segregated funds of $129.0 billion; and (ii) other business growth and activity of $3.5 billion; partially offset by (iii) a decrease of $46.3 billion from the strengthening of the Canadian dollar relative to exchange rates at the end of the fourth
quarter of 2016; and (iv) net outflow of mutual, managed, and segregated funds of $14.7 billion.
The net outflow of mutual, managed, and segregated funds of $14.7 billion in 2017 was predominantly driven by net outflows from MFS of $28.5 billion, which were partially offset by net inflows $6.1 billion from each of SLIM and SLF Asia, and $2.6 billion from SLF Canada.
General fund assets were $162.7 billion at December 31, 2017, up $1.6 billion from December 31, 2016. The increase in general fund assets was primarily attributable to: (i) business growth and activity of $3.2 billion; and (ii) an increase of $2.6 billion from the change in value of fair value through profit or loss (“FVTPL”) assets and liabilities; partially
offset by (iii) a decrease of $4.2 billion from a strengthening Canadian dollar against foreign currencies compared to the prior period
exchange rates.
Segregated fund assets were $106.4 billion as at December 31, 2017, compared to $97.2 billion as at December 31, 2016. The increase in segregated fund assets was primarily due to favourable market movement of $8.7 billion, net sales of $0.8 billion, partially offset by the currency impact from the strengthening Canadian dollar of $0.2 billion and other business activities of $0.1 billion.
Mutual funds, managed funds and other AUM increased to $705.7 billion, $60.7 billion higher than as at December 31, 2016. The increase was mainly driven by favourable market movements of $117.7 billion and other business activities of $0.5 billion, partially offset by $42.0 billion of currency impact from the strengthening Canadian dollar and net outflows of $15.5 billion.
F. Financial Strength
2017 2016 2015
MCCSR ratio Sun Life Financial 246% 253%
Sun Life Assurance 221% 226% 240%
Dividend Dividend payout ratio 42% 43% 40%
Dividends per common share ($) 1.745 1.62 1.51
Capital ($ millions)
Subordinated debt 3,437 3,836 2,492
Innovative capital instruments(1) 699 698 697
Equity
Participating policyholders’ equity and non-controlling interest 650 412 168
Preferred shareholders’ equity 2,257 2,257 2,257
Common shareholders’ equity 20,064 19,699 18,993
Total equity 22,971 22,368 21,418
Total capital 27,107 26,902 24,607
Financial leverage ratio(2) 23.6% 25.2% 22.1% (1) Innovative capital instruments consist of Sun Life ExchangEable Capital Securities, and qualify as regulatory capital. However, under IFRS they are reported as Senior
debentures in our Annual and Interim Consolidated Financial Statements. For additional information see section I - Capital and Liquidity Management - Capital in this document.
(2) Represents a non-IFRS financial measure. See section L - Non-IFRS Financial Measures in this document.
As at December 31, 2017, SLF Inc.’s MCCSR ratio was 246%, compared to 253% as at December 31, 2016. The primary difference between the MCCSR ratio of SLF Inc. and the MCCSR ratio of Sun Life Assurance as discussed below relates to cash and liquid assets held at the holding company level of $2,019 million as discussed below and capital related to certain insurance subsidiaries held directly by SLF Inc.
As at December 31, 2017, Sun Life Assurance’s MCCSR ratio was 221%, compared to 226% as at December 31, 2016. The decrease in Sun Life Assurance’s MCCSR ratio over the period primarily resulted from a recapture of a reinsurance arrangement, partially offset by the contribution of reported net income net of dividends. Additional details concerning the calculation of available capital and MCCSR are included in SLF Inc.’s 2017 AIF under the heading Regulatory Matters.
Management’s Discussion and Analysis Sun Life Financial Inc. Annual Report 2017 19

Capital Our total capital consists of subordinated debt and other capital instruments, participating policyholders’ equity and total shareholders’ equity which includes common shareholders’ equity and preferred shareholders’ equity. As at December 31, 2017, our total capital was $27.1 billion, up from $26.9 billion as at December 31, 2016. The increase in total capital was primarily the result of common shareholders’ net income of $2,205 million and the issuance of $400 million of subordinated debentures detailed below, partially offset by the foreign currency translation impact included in other comprehensive income (loss) of a loss of $737 million, the payment of $1,066 million of dividends on common shares, and the redemption of $800 million of subordinated debentures detailed below.
We strive to achieve an optimal capital structure by balancing the use of debt and equity financing. The financial leverage ratio for SLF Inc., which includes the innovative capital instruments and preferred shares issued by SLF Inc. as part of debt for the purposes of this calculation, decreased to 23.6% as at December 31, 2017, compared with 25.2% as at December 31, 2016.
The legal entity, SLF Inc. (the ultimate parent company) and its wholly-owned holding companies had $2,019 million in cash and other liquid assets as at December 31, 2017. Of this amount, $1,757 million was held at SLF Inc. The remaining $262 million of liquid assets were held by SLF Inc.’s wholly-owned holding companies, which are available to SLF Inc. without any regulatory restrictions. SLF Inc. and its wholly-owned holding companies had $1,616 million in cash and other liquid assets as at December 31, 2016. The increase in cash and liquid assets in these holding companies in 2017 was primarily attributable to net cash generated from operations and the issuance of $400 million of subordinated debentures, which were partially offset by the redemption of $800 million of subordinated debt, shares purchases under the normal course issuer bid and other operational requirements. Liquid assets as noted above include cash and cash equivalents, short-term investments, and publicly traded securities.
On March 2, 2017, SLF Inc. redeemed all of its outstanding $800 million principal amount of Series 2012-1 Subordinated Unsecured 4.38% Fixed/Floating Debentures.
On November 21, 2017, SLF Inc. issued $400 million principal amount of Series 2017-1 Subordinated Unsecured 2.75% Fixed/ Floating Debentures due 2027. The net proceeds will be used for general corporate purposes of Sun Life Financial, which may include investments in subsidiaries and repayment of indebtedness.
On January 30, 2018, SLF Inc. redeemed all of the outstanding $400 million principal amount of Series 2008-1 Subordinated Unsecured 5.59% Fixed/Floating Debentures at a redemption price equal to the principal amount together with accrued and unpaid interest to that date.
Life Insurance Capital Adequacy Test The Office of the Superintendent of Financial Institutions (“OSFI”) has implemented a revised regulatory capital framework referred to as the Life Insurance Capital Adequacy Test (“LICAT”) in Canada effective January 1, 2018. OSFI’s objective is to create a new capital framework that results in improved overall quality of available capital, greater risk sensitivity, better measurement of certain risks and closer alignment of risk measures with the economics of the life insurance business. LICAT is not expected to significantly change the level of excess capital in the industry, however capital requirements by company may change. Results as measured under LICAT are fundamentally different than under MCCSR and will not be directly comparable to MCCSR. OSFI released the final LICAT Guideline on November 24, 2017.
We currently have a strong capital position under MCCSR and expect that to continue under LICAT.
Common Share Dividend Activity SLF Inc. increased the dividend paid on its common shares in the second and fourth quarter of 2017 and paid total common shareholder dividends of $1.745 per common share in 2017, compared to $1.62 paid in 2016. In relation to the Canadian Dividend Reinvestment and Share Purchase Plan (“DRIP”), commencing with the dividends paid on March 31, 2016, common shares were acquired by the plan agent on the open market and no shares were issued from treasury in connection with the plan in 2016 or 2017. In 2015, SLF Inc. issued approximately 2 million shares from treasury under its DRIP.
Normal Course Issuer Bid On August 14, 2017, SLF Inc. launched a normal course issuer bid under which it is authorized to purchase up to 11.5 million common shares between August 14, 2017 and August 13, 2018. During 2017, SLF Inc. purchased and cancelled approximately 3.5 million common shares at a total cost of $175 million.
Financial Strength Ratings Independent rating agencies assign credit ratings to securities issued by companies and assign financial strength ratings to financial institutions such as Sun Life Assurance.
The financial strength ratings assigned by rating agencies are intended to provide an independent view of the creditworthiness and financial strength of a financial institution. Each rating agency has developed its own methodology for the assessment and subsequent rating of life insurance companies.
Rating agencies do not assign a financial strength rating for SLF Inc., however, credit ratings are assigned to the securities issued by SLF Inc. and its subsidiaries and are described in SLF Inc.’s AIF under the heading Security Ratings.
The following table summarizes the financial strength ratings for Sun Life Assurance as at January 31, 2018 and December 31, 2016.
A.M. Best DBRS Moody’s Standard & Poor’s January 31, 2018 A+ AA(low) Aa3 AA-
December 31, 2016 A+ AA(low) Aa3 AA
20 Sun Life Financial Inc. Annual Report 2017 Management’s Discussion and Analysis

Rating agencies took the following actions on the financial strength rating of Sun Life Assurance throughout 2017: • March 13, 2017 - Standard and Poor’s affirmed the financial strength rating and revised the outlook to positive from stable • April 19, 2017 - Moody’s affirmed the financial strength rating with a stable outlook • December 13, 2017 - DBRS affirmed the financial strength rating with a stable outlook • December 19, 2017 - A.M. Best affirmed the financial strength rating with a stable outlook
G. Performance by Business Group
Sun Life’s business is well diversified across geographies and business types, supported by our four pillar strategy and our diversified offerings of insurance and wealth products.
Underlying net income by business group Underlying net income by type of business 2017(1) 2017(1)
Underlying net income by business group(1) Underlying net income by type of business(1)
As at December 31, 2017 2016 As at December 31, 2017 2016
SLF Canada 35% 35% Individual Insurance 28% 31%
SLF U.S. 19% 18% Asset Management 30% 28%
SLF Asset Management 30% 28% Group Insurance 19% 18%
SLF Asia 12% 12% Wealth 13% 10%
SLF U.K. 4% 7% Run-off 10% 13%
(1) Excludes Corporate Support.
($ millions, unless otherwise noted) 2017 2016 2015
Reported net income (loss)
SLF Canada 963 936 824
SLF U.S. 308 508 333
SLF Asset Management 653 729 691
SLF Asia 326 309 311
Corporate (101) 3 26
Total reported net income (loss) 2,149 2,485 2,185
Underlying net income (loss)(1)
SLF Canada 949 887 894
SLF U.S. 507 447 441
SLF Asset Management 812 699 700
SLF Asia 330 295 252
Corporate (52) 7 18
Total underlying net income (loss)(1) 2,546 2,335 2,305
(1) Represents a non-IFRS financial measure. See section L - Non-IFRS Financial Measures in this document.
Management’s Discussion and Analysis Sun Life Financial Inc. Annual Report 2017 21

1. SLF Canada
SLF Canada is a leading provider in insurance and wealth solutions in the Canadian market, providing products and services that deliver Client value to over six million people via our group and individual businesses. We are the largest provider of benefits and pensions in the workplace, and provide a wide range of products to individuals via retail channels.
Business Profile
Business Units
• Individual Insurance & Wealth • Group Retirement Services (“GRS”) • Group Benefits(“GB”)
2017 Highlights • Sun Life Global Investments (“SLGI”), which commenced operations in 2010, grew assets under management to $20 billion by
the end of 2017. In addition, in early 2018 SLGI completed the acquisition of Excel Funds Management Inc., a Canadian firm specializing in emerging markets asset classes that will complement SLGI’s existing product offerings, and will support growth in our wealth businesses.
• Our mobile app, my Sun Life, the highest rated life insurance app in Canada, enables Clients to search and connect with 65,000 peer-rated, paramedical healthcare providers across Canada, click to call for appointment bookings, submit health claims, check investment balances, and click to quickly connect with their financial advisor.
• We launched “Ella”, a new interactive digital coach for our Group Clients. Ella is designed to enable Clients to achieve lifetime financial security and live healthier lives by getting the full value from their benefits and pension plans.
• We launched an online insurance application process, Sun Life GO, which gives Canadians the flexibility to meet financial needs with convenient access to insurance coverage.
• Sun Life was voted “Most Trusted Life Insurance Company” for the ninth year in a row by Reader’s Digest.
Strategy and Outlook Our purpose is to help Canadians achieve lifetime financial security and live healthier lives. We do so by being a leader in Group Benefits, Group Retirement Services and Individual Insurance & Wealth, offering a full range of products and services that put our Clients’ needs first.
We continue to leverage our market leadership position across our core businesses and distribution networks, and build on our objective of being a leader in physical, mental, and financial well-being in our Canadian home market. Our innovations in technology, including our industry leading mobile application, have created a competitive advantage and growth opportunities, allowing us to leverage our worksite advantage, which stems from our market leadership positions in both GB and GRS, and to deepen Client relationships through our total benefits and retail offerings. Investments we made for future growth through achieving scale in our retail wealth business, Defined Benefits Solutions and Client Solutions, are contributing to earnings growth. Additional areas of focus will be on the development of our Digital Health Solutions business area and maintaining our leading positions in our core businesses through on-going investment in distribution, products, Client-focused technology and productivity.
Specifically, we will focus on the following:
Client at the centre of everything we do • Deliver an omni-channel experience, engaging Clients where, when and how they wish • Enhance the Client experience by making it easier to do business with us and ensuring a seamless experience across all
Business Units • More proactive contact with our Clients leveraging digital, data & analytics capabilities • Advance our Client advocacy work to effectively resolve Client problems
Extending market leadership in core businesses • Continue to leverage and grow the largest insurance and wealth-based career advisor network, consisting of a sales power of
close to 4,000 located in over 1,200 communities across Canada, 67% of which is licensed to sell both insurance and wealth solutions, to deliver holistic financial planning advice, helping our Clients achieve lifetime financial security
• Launch new and enhance existing products that continue to support our Career Sales Force and third party advisors in offering customized financial plans and solutions to our Clients
• Extend our market leadership in the GB and GRS businesses where we have a high Client retention rate due to our industry leading technology, our total benefits offering and worksite advantage
22 Sun Life Financial Inc. Annual Report 2017 Management’s Discussion and Analysis

Engines accelerating growth • Grow our retail wealth business in Individual Insurance & Wealth by delivering value and strong investment performance on our
Client-focused manufactured wealth products(1) and services such as our segregated funds, Sun Life Guaranteed Investment Funds, and our SLGI wealth management solutions to further strengthen our position in the retirement market
• Extend our leadership position in the Defined Benefit Solutions business through innovative de-risking solutions to meet emerging needs of the pension market
• Further leverage our worksite advantage to drive growth in our Group Benefits and Group Retirement businesses • Advance our new business area, Digital Health Solutions, and continue to create digital solutions for our business processes
and models focused on enhancing Client and shareholder value
Leveraging digital, data and analytics to build and evolve new strategies • Deepen our Client relationships through meaningful Client touch points and solutions such as Ella, our interactive digital coach
helping Clients maximize their benefits and pension plans • Continue to develop and enhance our industry leading mobile platform, with the highest rated life insurance mobile app in
Canada, making it easy and convenient for plan members to manage and use their pensions and benefits
Disciplined financial management • Deliver strong earnings growth and disciplined expense management to support the enterprise’s medium-term objectives • Enhance productivity savings to fuel continued investment in enhanced service models, digital transformation and acceleration
of various Client initiatives
Outlook Shifting demographics, in particular the aging population and their need for financial security in retirement, and the shift in financial responsibility from governments and employers to individuals are expanding the need of individuals to seek out effective protection and wealth advice and solutions. As a trusted market leader offering a full suite of solutions and advice and a strong presence at the worksite and in communities across Canada, Sun Life is well positioned to continue to benefit from these trends.
The Canadian market is facing several headwinds, which present both challenges and opportunities for our business. New digital disruptors are emerging, regulatory focus and changes are impacting all business segments and the competitive environment continues to apply additional pressure on achieving our objectives. To address this, we are actively investing in innovative digital solutions to ensure our Clients can interact with us in the channel of their choice with industry leading offerings, and we will continue to adjust and adapt our plans to drive momentum across our core businesses and accelerate growth through our newest business area, Digital Health Solutions.
Business Units
Business Description Market position
Individual Insurance &
Wealth
Group Benefits
Group Retirement
services
• Works with individuals to provide holistic advice to help them protect themselves and their families, build lifetime financial security, and live healthier lives, via a broad suite of life and health insurance and investment products
• Products distributed via multi-channel distribution model consisting of the Career Sales Force (“CSF”) and third party channels, including independent brokers and broker-dealers, and direct to consumer for certain products
• 2nd place market position by premiums within the individual life and health market(1)
• 1st in fixed product sales(1) and 4th place market position by total wealth deposits and premiums(1)
• SLGI continues to experience strong year-over-year AUM growth driven by sales and strong fund performance versus peer group
• Provides group insurance products in Canada, including life, dental, extended health care, disability and critical illness, to employers of all sizes
• Leverages our worksite advantage to offer voluntary benefits solutions to individual plan members, including post-employment life and health plans
• Products distributed by sales representatives in collaboration with independent advisors, benefits consultants, and the CSF
• 1st place Group Benefits provider in Canada for the 8th consecutive year(2)
• Provides defined contribution pension plans and defined benefit solutions in Canada to employers of all sizes
• Leverages our worksite advantage to offer voluntary savings plans, including post-employment plans, to those members exiting their employer-sponsored plans
• Defined Benefit Solutions offers an expanding range of innovative de-risking solutions for defined benefit pension plans
• Products distributed by sales representatives in collaboration with a multi-channel distribution network of pension consultants and advisors
• GRS ranked 1st in the defined contribution market based on total Capital Accumulation Plan assets for the 15th consecutive year(3) and 1st in the Defined Benefit Solutions annuity sales market(1)
(1) LIMRA Sales Market Share as of September 30, 2017. (2) Based on revenue for year ended December 2016 as published in 2017 Fraser Group Universe Report. (3) Based on the 2016 Fraser Pension Universe report.
(1) Represents sales of individual wealth products developed by Sun Life, which include Sun Life Global Investment mutual funds, Sun Life Guaranteed Investment Funds segregated funds, Guaranteed Investment Certificates, and Accumulation and Payout Annuities.
Management’s Discussion and Analysis Sun Life Financial Inc. Annual Report 2017 23

Financial and Business Results
($ millions) 2017 2016 2015
Individual Insurance & Wealth 415 509 348
Group Benefits 332 307 324
Group Retirement Services 216 120 152
Reported net income 963 936 824
Market related impacts(1) 8 114 (106)
Assumption changes and management actions(1) 22 (60) 15
Certain hedges that do not qualify for hedge accounting (16) (5) 21
Underlying net income(2) 949 887 894
Reported ROE (%)(2) 12.6 12.0 10.7
Underlying ROE (%)(2) 12.4 11.4 11.6
Insurance sales(2) 1,125 950 836
Wealth sales(2) 14,976 13,200 14,621
Large case longevity insurance sale(3) — — 5,260
Assets under management 176,417 165,252 152,560
(1) See section L - Non-IFRS Financial Measures in this document for a breakdown of components within this adjustment. (2) Represents a non-IFRS financial measure. See section L - Non-IFRS Financial Measures in this document. (3) Represents the transfer of longevity risk of BCE Inc.’s Bell Canada pension plan.
Profitability Wealth - Assets Under ManagementReported net income was $963 million in 2017, compared to $936 million in 2016. ($ billions)Underlying net income was $949 million in 2017, compared to $887 million in
IW GRS2016.
+9%(1)Reported net income in 2017 compared to 2016 reflected less favourable market related impacts driven by the impact of interest rate and swap spreads partially offset by real estate gains. The impact of ACMA in 2017 was primarily in Individual Insurance & Wealth and favourable compared to the prior year. Underlying net income in 2017 compared to 2016 reflected higher new business gains, favourable mortality experience within GRS and Individual Wealth, and favourable credit experience, partially offset by lower investing activity gains.
Growth
72.9
29.0 30.3 31.3
81.1 89.4
Individual insurance sales of $451 million were down 5% from the same period in 2015 2016 2017 the prior year, driven by strong sales in the fourth quarter of the prior year in anticipation of Canadian life insurance tax legislation changes that came into effect (1) Compound annual growth rate
on January 1, 2017. Sales in Group Benefits of $674 million increased 42% compared to 2016 driven by several large case sales.
One of our key initiatives is to continue growing our individual wealth manufactured products, SLGI mutual funds and Sun Life Guaranteed Investment Funds segregated funds. AUM for our wealth businesses, including GRS, was $120.8 billion, increased from $111.5 billion in 2016. SLF Canada wealth sales were $15.0 billion in 2017, compared to $13.2 billion in 2016. Individual wealth sales of $5.9 billion were up 9% in 2017 compared to 2016, driven by continued growth in our wealth manufactured(1)
products, including SLGI mutual funds and Sun GIF(2) segregated funds. GRS sales of $9.1 billion were 16% ahead of 2016, due to increased renewal activity.
Profitability and Growth by Business Unit
Individual Insurance & Wealth Individual Insurance & Wealth’s reported net income was $415 million in 2017, compared to $509 million in 2016. Reported net income in 2017 compared to 2016 reflected the favourable impact of ACMA, and strong new business gains more than offset by the release of a litigation provision which increased 2016 reported net income, the unfavourable impact of interest rates and lower gains from investing activities in 2017.
Individual life and health insurance product sales decreased 5% from 2016 to $451 million in 2017. The decrease compared to 2016 reflects moderated sales following strong CSF and third party sales in the fourth quarter of 2016 as a result of sales in anticipation of the Canadian life insurance tax legislation changes that came into effect on January 1, 2017. Individual wealth product sales of $5.9 billion reflect solid growth over 2016 results, with strong sales in SLGI mutual funds and Sun Life Guaranteed Investment Funds.
(1) Represents sales of individual wealth products developed by Sun Life, which include Sun Life Global Investment mutual funds, Sun Life Guaranteed Investment Funds segregated funds, Guaranteed Investment Certificates, and Accumulation and Payout Annuities.
(2) Sun Life Guaranteed Investment Funds.
24 Sun Life Financial Inc. Annual Report 2017 Management’s Discussion and Analysis

Group Benefits Group Benefits reported net income was $332 million in 2017, compared to $307 million in 2016. Reported net income in 2017 compared to 2016 reflected favourable ACMA and business growth compared to 2016.
Group Benefits had sales of $674 million, which increased compared to $475 million in 2016, primarily due to large case sales and grew business in-force to $10 billion as at the end of 2017. Group Benefits maintained the #1 market share position for overall revenue in Canada(1) while continuing to focus on Client service and productivity. Client retention remained strong, with cancellation rates at 2.9% of revenue compared to the industry average of 4.7%(1).
Group Retirement Services Group Retirement Services had reported net income of $216 million in 2017, compared to $120 million in 2016. Reported net income in 2017 compared to 2016 reflected higher profitability in the Defined Contributions business and positive mortality and growth in the underlying business in Defined Benefit Solutions.
Group Retirement Services sales of $9.1 billion in 2017 were up from sales of $7.8 billion in 2016 driven by higher renewal activity. In 2017, rollover sales from members leaving their defined contribution plans were $2.5 billion, an 11% increase from 2016. Group Retirement Services assets under administration of $98.2 billion in 2017 grew by 10% over 2016, resulting from both net sales and favourable markets.
2. SLF U.S.
Sun Life is one of the largest Group Benefits providers in the U.S. market, serving more than 13 million Americans through their workplaces with insurance products and solutions that provide Client value. We also have a growing International life insurance business, where we are a leader helping global high-net-worth Clients transfer wealth to future generations.
Business Profile
Business Units
• Group Benefits • International • In-force Management
2017 Highlights • We made substantial progress in our integration of the acquired U.S. employee benefits business, achieving 83% of our
targeted expense synergies. We expect to reach our full target of $100 million in expense synergies as planned by the end of 2019. We also reached integration milestones with the launch of Sun Life’s new, combined portfolio of products and services and the migration of the acquired business to Sun Life platforms.
• We became the insurer with the largest preferred provider (“PPO”) dental network in the U.S.(2) with the launch of our new Sun Life Dental Network®, which has approximately 125,000 unique providers. Our dental network also includes the Premier Dental Group, Inc., which was acquired in 2017 to help us grow in key markets in the U.S.
• Diving deeper into the growing self-funded employer marketplace, we expanded our presence in the health care sector by partnering with CollectiveHealth, Inc. (“Collective Health”), an innovative technology company that serves as an alternative to traditional health plans. Together, we aim to transform the benefits experience for self-funded employers and their employees in the U.S. by integrating our stop-loss offering into Collective Health’s enterprise benefits platform, making it seamless for companies to gain stop-loss protection with Sun Life. The two companies will also collaborate closely on ways to better serve Clients through enhanced data analytics and risk modeling. Separately, we formed a stop-loss arrangement with Pareto Captive Services, LLC, providing solutions for employers seeking an alternative way to self-fund while pooling financial risks.
• We are focused on creating strong Client relationships. For example, we added digital functionality to our benefits enrollment platform to more quickly onboard employees; introduced vocational rehabilitation to our short-term disability services to enable employees to return to work earlier; enhanced our dental and absence management mobile apps; and provided deep, data-based analysis to employers for managing high-dollar medical claims.
• We continued our momentum in International product sales with an increase of 34% in the year, demonstrating our position as a global leader in serving the complex needs of Clients in the high-net-worth life insurance market.
Strategy and Outlook Our purpose is to help Clients achieve lifetime financial security and live healthier lives. Our aspiration is to grow and build our expertise, capabilities and profitability in our U.S. Group Benefits business and to grow our International Life business, while also expanding to adjacent markets. We will accomplish this by improving the Client experience and by enhancing our digital infrastructure to increase automation, efficiency and access to data. We also will leverage our unique, segmented distribution model in the U.S., which includes dedicated and specialized sales, support, and underwriting teams for each market segment, and expand and diversify our distribution reach in International.
(1) Based on revenue for year ended December 2016 as published in 2017 Fraser Group Universe Report. (2) Based on September 2017 data from the Ignition Group’s Netminder report.
Management’s Discussion and Analysis Sun Life Financial Inc. Annual Report 2017 25

Specifically, we will focus on the following:
Building the best benefits company in America To achieve our goal in the U.S. marketplace, we will seize new opportunities to leverage our scale, leading product positions and broad product portfolio to grow Group Benefits. We will continue to provide and enhance the data-driven insights we provide to employers and brokers and use our specialized expertise to meet the unique needs of Clients in all segments. We will pursue growth and innovation through compelling strategic partnerships and acquisitions, and deploy digital tools, data and analytics to improve the Client experience.
We made great progress in 2017 with improved profitability in Group Benefits and will continue our journey in 2018 toward our target after-tax profit margin of 5% to 6% through actions that underscore both financial rigour and Client engagement. Among those actions are disciplined pricing and careful expense management, achieving our target synergies for integration of our acquired group benefits business, and making investments in underwriting and claims processes.
We also will look to build capabilities that round out our portfolio or improve upon our capabilities, and will expand our footprint in the market by: • Reaching deeper into the self-funded employer marketplace through our digital health care collaboration with Collective Health
and alternative distribution channels like our new captive solutions, and developing differentiated products and services to improve our Clients’ benefits experience such as solutions for smaller employers moving to self-funding and for managing high-cost drugs
• Building on our successful Disability Reinsurance Management Services model by offering additional benefits solutions to industry partners where we already have expertise such as stop-loss insurance
• Honing our capabilities in the large-case employer segment, and leveraging data analytics to deliver enhanced web-based reporting and insights, streamlined enrollment processes and integrated benefits offerings
• Driving growth in group dental through our “Network of One” strategy to recruit dentists important to new Clients; in disability and absence management with integrated offerings; and in the voluntary business through enhanced digital capabilities on our enrollment and benefits communications platforms
• Investing in service and claims with an intense focus on the Client experience, such as new ways to interact with Clients, simplification of forms and additional digital initiatives to help make data exchange seamless with employers, TPAs and enrollment partners
Being the leader in international high-net-worth Life insurance In the International business, our solutions help high-net-worth families outside the U.S. and Canada transfer their wealth to future generations. Our solutions help these Clients with complex estate-planning needs including heirs living in multiple countries and the transfer of illiquid assets such as family businesses.
Our strong brand reputation, deep distribution relationships and market expertise will help us grow by: • Expanding and diversifying in key geographies and distribution channels for our life insurance solutions • Leveraging our unique strengths in underwriting large life insurance cases • Capitalizing on our understanding of Client needs and regulations in key geographic regions • Focusing on the Client experience through development of new products and technology solutions • Continuing to provide excellent service to our in-force International Wealth Clients
Optimizing the value of our In-force business We continue to optimize the In-force Management business through: • Effective risk and capital management • Focusing on excellent service and meeting the needs of our individual life insurance Clients
Outlook In the United States, the Group market has grown at a steady pace. There is increasing demand for voluntary insurance products and absence management capabilities that help employers manage and increase workplace productivity. In addition, as more employers decide to self-insure, the need for medical stop-loss coverage is expected to accelerate. Our expanded presence in the health care space will allow SLF U.S. to serve our Clients in a broader way. Growth in the International market is being driven by high-net-worth families with increasingly complex estate-planning needs.
We also face some headwinds. In the U.S., we see some pricing competition and new entrants in certain segments as well as rising specialty drug costs resulting in higher claims in the medical stop-loss market, which we are well-positioned to handle through our segmented distribution model, leading product positions, and analytic capabilities. Internationally, we will continue to experience increased operational complexity due to the evolving regulatory environment as well as some competitive pressure from new entrants in certain regions, which is being actively monitored to allow us to quickly adjust our product suite as necessary.
26 Sun Life Financial Inc. Annual Report 2017 Management’s Discussion and Analysis

Business Units
Business Description Market position
Group Benefits
International
In-force Management
• Provides group insurance products and services, including life, long-term and short-term disability, absence management, medical stop-loss, dental, vision and voluntary insurance such as accident and critical illness
• Stop-loss insurance provides employers who self-insure their employee health plans with protection against large claims
• Products distributed through more than 28,000 independent brokers and benefits consultants, supported by 235 employed sales representatives
• Serves approximately 60,000 employers in small, medium and large workplaces across the U.S.
• Disability RMS provides turnkey disability risk management products and services such as claims management, underwriting, actuarial and policy administration to other insurance providers
• Largest independent stop-loss provider(1)
• Largest turn-key disability provider • Largest PPO dental network with
125,000 unique dentists(2)
• Top ten group life and disability provider(3)
• Provides individual life insurance solutions to high-net-worth individuals and families residing outside the U.S. and Canada
• Manages a block of International wealth investment products closed to new sales
• A leader in International high-net-worth life insurance business
• Closed block of approximately 115,000 individual life insurance policies, primarily universal life and participating whole life insurance
(1) Based on 2016 National Association of Insurance Commissioners Accident and Healthy Policy Experience Report; excludes carriers who provide medical coverage. (2) Based on September 2017 data from the Ignition Group’s Netminder report. (3) Based on LIMRA 2016 Annual U.S. Sales & In-Force Reports for group term life, group short-term disability and long-term disability insurance.
Financial and Business Results
(US$ millions) 2017 2016 2015
Group Benefits 140 73 99
International 347 222 68
In-force Management (247) 90 84
Reported net income (loss) 240 385 251
Market related impacts(1) 1 13 26
Assumption changes and management actions(1)(2) (7) 75 (70)
Acquisition, integration and restructuring(2) (52) (42) (46)
U.S. tax reform(2) (94) — —
Underlying net income (loss)(3) 392 339 341
Reported ROE (%) 6.9 11.2 9.4
Underlying ROE (%)(3) 11.3 9.9 12.8
After-tax profit margin for Group Benefits (%)(3) 5.0 3.5 3.7
Insurance sales(3) 958 865 615
(C$ millions)
Reported net income (loss) 308 508 333
Underlying net income (loss)(3) 507 447 441
(1) US tax reform of US$(94) million ($(119) million) includes US$(231) million ($(293) million) of ACMA, which is excluded from ACMA of US $(7) million($(11) million). (2) In 2017 and 2016 Acquisition, integration and restructuring amounts related to the acquisition costs of the U.S. employee benefits business acquired in 2016 in Group
Benefits. In 2015, Acquisition, integration and restructuring amounts consisted of the impact of US$46 million related to the closing of our wealth business in SLF U.S. International to new sales, which included ACMA of US$30 million to reflect assumption updates including the expense strengthening associated with closing the business.
(3) Represents a non-IFRS financial measure. See section L - Non-IFRS Financial Measures in this document.
Management’s Discussion and Analysis Sun Life Financial Inc. Annual Report 2017 27
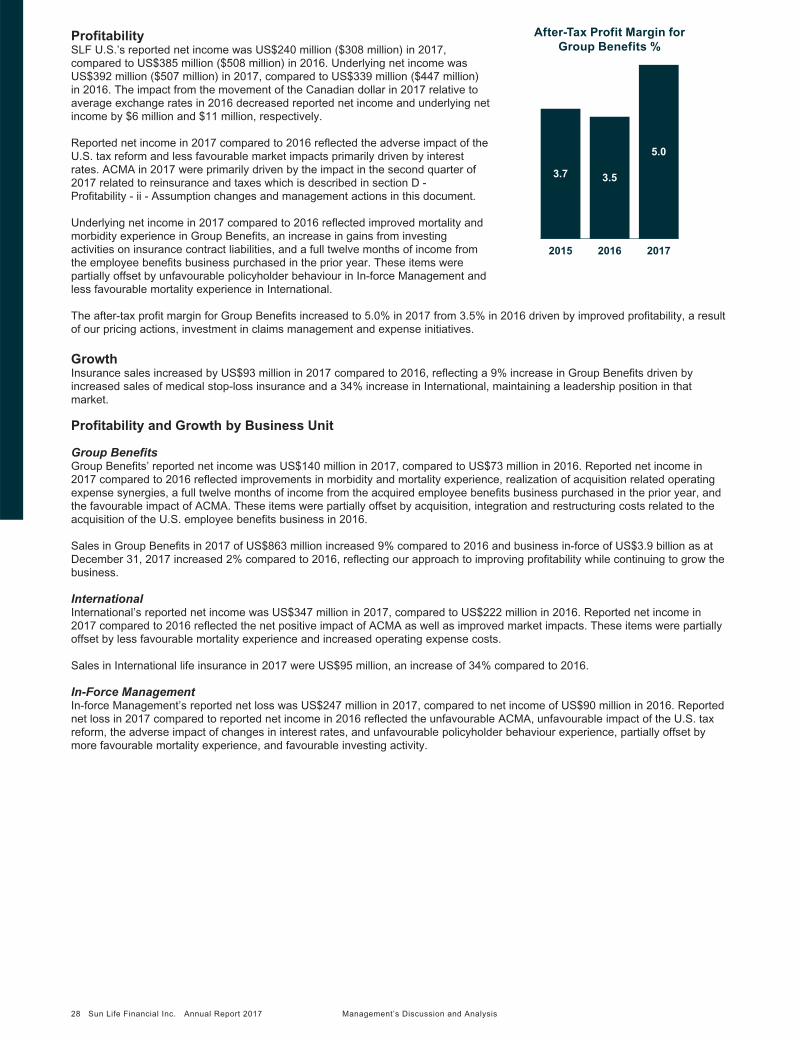
After-Tax Profit Margin for Profitability SLF U.S.’s reported net income was US$240 million ($308 million) in 2017, Group Benefits % compared to US$385 million ($508 million) in 2016. Underlying net income was US$392 million ($507 million) in 2017, compared to US$339 million ($447 million) in 2016. The impact from the movement of the Canadian dollar in 2017 relative to average exchange rates in 2016 decreased reported net income and underlying net income by $6 million and $11 million, respectively.
Reported net income in 2017 compared to 2016 reflected the adverse impact of the U.S. tax reform and less favourable market impacts primarily driven by interest rates. ACMA in 2017 were primarily driven by the impact in the second quarter of 2017 related to reinsurance and taxes which is described in section D Profitability - ii - Assumption changes and management actions in this document.
Underlying net income in 2017 compared to 2016 reflected improved mortality and morbidity experience in Group Benefits, an increase in gains from investing activities on insurance contract liabilities, and a full twelve months of income from 2015 2016 2017 the employee benefits business purchased in the prior year. These items were partially offset by unfavourable policyholder behaviour in In-force Management and less favourable mortality experience in International.
3.7
5.0
3.5
The after-tax profit margin for Group Benefits increased to 5.0% in 2017 from 3.5% in 2016 driven by improved profitability, a result of our pricing actions, investment in claims management and expense initiatives.
Growth Insurance sales increased by US$93 million in 2017 compared to 2016, reflecting a 9% increase in Group Benefits driven by increased sales of medical stop-loss insurance and a 34% increase in International, maintaining a leadership position in that market.
Profitability and Growth by Business Unit
Group Benefits Group Benefits’ reported net income was US$140 million in 2017, compared to US$73 million in 2016. Reported net income in 2017 compared to 2016 reflected improvements in morbidity and mortality experience, realization of acquisition related operating expense synergies, a full twelve months of income from the acquired employee benefits business purchased in the prior year, and the favourable impact of ACMA. These items were partially offset by acquisition, integration and restructuring costs related to the acquisition of the U.S. employee benefits business in 2016.
Sales in Group Benefits in 2017 of US$863 million increased 9% compared to 2016 and business in-force of US$3.9 billion as at December 31, 2017 increased 2% compared to 2016, reflecting our approach to improving profitability while continuing to grow the business.
International International’s reported net income was US$347 million in 2017, compared to US$222 million in 2016. Reported net income in 2017 compared to 2016 reflected the net positive impact of ACMA as well as improved market impacts. These items were partially offset by less favourable mortality experience and increased operating expense costs.
Sales in International life insurance in 2017 were US$95 million, an increase of 34% compared to 2016.
In-Force Management In-force Management’s reported net loss was US$247 million in 2017, compared to net income of US$90 million in 2016. Reported net loss in 2017 compared to reported net income in 2016 reflected the unfavourable ACMA, unfavourable impact of the U.S. tax reform, the adverse impact of changes in interest rates, and unfavourable policyholder behaviour experience, partially offset by more favourable mortality experience, and favourable investing activity.
28 Sun Life Financial Inc. Annual Report 2017 Management’s Discussion and Analysis

3. SLF Asset Management
SLF Asset Management segment is composed of MFS and SLIM. MFS is a premier global asset management firm which offers a comprehensive selection of financial products and services that deliver superior value and actively manages assets for retail and institutional investors around the world. SLIM is an institutional investment management business with operations in the U.S. and Canada. SLIM delivers liability driven investing, alternative fixed income and real estate solutions to Clients.
Business Profile
Business Units
• MFS Investment Management (“MFS”) • Sun Life Investment Management (“SLIM”)
2017 Highlights • SLF Asset Management ended the fourth quarter with $677.6 billion in assets under management consisting of $618.3 billion
(US$491.6 billion) from MFS Investment Management (“MFS”) and $59.3 billion from Sun Life Investment Management (“SLIM”).
• Strong investment performance with 84%, 79% and 92% of MFS’s U.S. retail mutual fund assets ranked in the top half of their Lipper categories based on three-, five- and ten-year performance, respectively, as of December 31, 2017.
• The Bentall Kennedy Group of Companies (“Bentall Kennedy”) was ranked among the top five firms globally in the 2017 Global Real Estate Sustainability Benchmark rankings. This is the seventh year that the team at Bentall Kennedy has received this recognition.
• Sun Life Institutional Investments (Canada) (“SLIIC”), our liability driven investing and alternative investments business created in 2014, which is part of SLIM, was named the fastest growing asset money manager in Canada in the $1 billion to $10 billion assets under management category - by Benefits Canada in its 2017 Top 40 Money Managers Report.
• SLIM generated strong net inflows of $6.1 billion in 2017.
Strategy and Outlook The SLF Asset Management strategy is to design and deliver investment products through MFS and SLIM that will deliver growth in traditional active asset management as well as liability-driven investing and alternative asset classes.
MFS competes primarily in the Global Institutional and US Retail Markets. SLIM leverages Sun Life’s long-standing expertise in LDI and private asset class investments to offer customized investment solutions to third-party institutional investors.
MFS: Provide excellent service to Clients seeking actively managed investments MFS’s active management strategy focuses on delivering value to our Clients over the long term and our strong relative performance puts us in a competitive position over other asset managers. Notwithstanding a move by some investors to follow passive strategies, MFS is well positioned to attract flows from all Client sectors that are seeking risk managed capital appreciation over the long term based on our disciplined, long-term approach with a successful track record. Specifically, we will focus on the following: • Delivering superior investment performance and continue to raise the bar in providing exceptional service based on a deep
understanding of Client needs • Continuing to improve our infrastructure through the launch of our new Client Connect project which will allow us to share Client
information across teams and maintain a world-class level of Client service. Additionally, MFS will roll-out a new trading system that utilizes the latest cutting edge technology in order to continue to deliver superior results to our Clients
• Expanding our global fixed income capabilities in strategies targeted to the institutional marketplace and our Blended Research products, which combine both fundamental and quantitative research
Leverage the SLIM portfolio of companies to develop new products and expand distribution The SLIM portfolio of companies includes Bentall Kennedy, Prime Advisors, Inc. (“Prime Advisors”), Ryan Labs Asset Management Inc. (“Ryan Labs”), and SLIIC. SLIM is well positioned to take advantage of three key trends in our target markets: increased allocations to fixed income by pension funds looking to de-risk; out-sourcing of asset management by insurance companies; and, increased demand for alternatives due to low nominal interest rates.
Specifically, we will focus on the following: • Delivering superior investment performance • Expanding our distribution team, particularly in the U.S., to broaden our market coverage • Expanding our product line-up with offerings that leverage our existing investment capabilities • Investigating opportunities to expand through acquisition and lift-outs
Outlook In the Asset Management industry, we see the shift to passive investing continuing, with retail and institutional investors decreasing allocations to active equity while passive, fixed income and alternatives gain share. This has led to fee erosion, and net outflows from MFS’ key asset classes. We also foresee a trend of increasing consolidation, as fee erosion and a shift to passive increase the importance of scale. As an at scale global manager with capabilities across all traditional asset classes, MFS is well positioned to compete in this environment.
The current relatively long bull markets in equities, bonds and real estate have led to higher valuations, which may slow new allocations to LDI and alternative yield products from institutional investors as they await a market correction. For SLIM, the tailwinds supporting institutional demand for LDI and alternative yield products are expected to remain strong into the future although competition is increasing as more managers attempt to enter the space.
Management’s Discussion and Analysis Sun Life Financial Inc. Annual Report 2017 29

Business Units
Business Description Market position
MFS • Actively manages assets for retail and institutional investors, including • Over US$490 billion in AUM pension plans, sovereign wealth funds, investment authorities, and • The 10th largest U.S. Retail funds endowments and foundations manager(1)
• Retail products are distributed through financial advisors, brokerages, and other professionals
• Institutional products are distributed by an internal sales force, which is aided by a network of independent consultants
SLIM • SLIM delivers liability driven investing, alternative fixed income and real • Over $59.3 billion in AUM estate solutions to Clients through a portfolio of companies, including: • Net sales of $6.1 billion in 2017, • Bentall Kennedy, a real estate investment manager operating in Canada $4.5 billion in 2016
and the U.S. • Prime Advisors, Inc., a U.S.-based investment management firm
specializing in customized fixed income portfolios primarily for U.S. insurance companies
• Ryan Labs Asset Management Inc., a New York-based asset manager specializing in fixed income and liability-driven investing
• Sun Life Institutional Investments (Canada) Inc., a Canadian institutional asset manager which provides investment expertise in alternative asset classes and liability-driven investing to pension funds and other institutional investors
• Institutional products are distributed by an internal sales force, which is aided by a network of independent consultants
(1) As reported by Strategic insight based on AUM as of December 31, 2017.
Financial and Business Results
SLF Asset Management (C$ millions) 2017 2016 2015
Reported net income Fair value adjustments on MFS’s share-based payment awards
U.S. tax reform(2)
Underlying net income(1)
653 (81) (78) 812
729 30 —
699
691 (9) —
700
Assets under management (C$ billions)(1) 677.6 624.8 629.6 Gross sales (C$ billions)(1) 117.3 116.3 99.5 Net sales (C$ billions)(1) (22.4) (12.2) (19.9)
MFS (C$ millions) Reported net income
Fair value adjustments on MFS’s share-based payment awards U.S. tax reform(2)
612 (81) (95)
700 30 —
679 (9) —
Underlying net income(1)
Assets under management (C$ billions)(1)
Gross sales (C$ billions)(1)
Net sales (C$ billions)(1)
(US$ millions) Reported net income
Fair value adjustments on MFS’s share-based payment awards U.S. tax reform(2)
788 618.3 106.5 (28.5)
471 (64) (75)
670
571.6 108.2 (16.7)
528 22 —
688
571.9 96.5
(20.5)
531 (9) —
Underlying net income(1) 610 506 540
Pre-tax operating profit margin ratio(1) 38% 36% 40% Average net assets (US$ billions)(1) 460.5 421.7 434.0 Assets under management (US$ billions)(1) 491.6 425.6 413.2 Gross sales (US$ billions)(1) 82.1 81.7 75.8 Net sales (US$ billions)(1) (21.8) (12.6) (15.7)
SLIM (C$ millions) Reported net income
U.S. tax reform(2)
41 17
29 —
12 —
Underlying net income(1) 24 29 12
Assets under management (C$ billions)(1) 59.3 53.2 57.8 Gross sales (C$ billions)(1) 10.8 8.1 3.1 Net sales (C$ billions)(1) 6.1 4.5 0.5
(1) Represents a non-IFRS financial measure. See section L - Non-IFRS Financial Measures in this document. (2) The U.S. tax reform of $(78) million consists of a charge of $32 million relating to the revaluation of its deferred tax balances, consisting of a charge of $49 million for MFS,
partially offset by a benefit of $17 million for SLIM, and a one-time charge on the deemed repatriation of foreign earnings of $46 million for MFS in the fourth quarter of 2017.
30 Sun Life Financial Inc. Annual Report 2017 Management’s Discussion and Analysis

Profitability SLF Asset Management’s reported net income in 2017 was $653 million, compared to
Assets Under Management (U.S. $ billions)
$729 million in 2016. Underlying net income was $812 million in 2017, compared to $699 million MFS SLIM in 2016. The impact from the movement of the Canadian dollar in 2017 relative to average exchange rates in 2016 decreased reported net income and underlying net income by $14 million +9%(1)
and $17 million, respectively. 47.1 41.9
425.639.7
SLF Asset Management’s reported net income decreased in 2017 compared to the same period in 2016 primarily due to the impact of the U.S. Tax reform. Underlying net income increased primarily driven by the results of MFS.
Growth SLF Asset Management’s AUM was $677.6 billion in 2017, compared to $624.8 billion in 2016. The increase was primarily due to asset appreciation of $116.0 billion, partially offset by the strengthening Canadian dollar relative to exchange rates at the end of 2016 of $42.3 billion and 2015 2016 2017 net outflows of $22.4 billion.
413.2 491.6
(1) Compound annual growth rate
Profitability and Growth by Business Unit MFS MFS’s reported net income for 2017 was US$471 million, compared to US$528 million for 2016, which reflected the Fair value adjustments on MFS’s share-based payment awards and the impact related to the U.S. tax reform. MFS’s underlying net income was US$610 million in 2017, compared to US$506 million in 2016. MFS’s underlying net income in U.S. dollars for the year ended December 31, 2017 increased compared to the same period in the prior year, primarily due to higher average net assets, expense management, and lower taxes.
AUM ended 2017 at US$491.6 billion, an increase of 16% for the year, primarily driven by gross sales of US$82.1 billion and asset appreciation of US$87.8 billion, partially offset by redemptions of US$103.8 billion. In 2017, Mutual funds experienced US$0.9 billion in net outflows while managed funds had net outflows of US$20.8 billion, primarily driven by institutional Client portfolio re-balancing and the trend to passive investing.
SLIM SLIM’s reported net income for the year ended December 31, 2017 was C$41 million, increased compared to C$29 million in 2016, primarily due to a benefit related to the U.S. tax reform. SLIM’s underlying net income for the year ended December 31, 2017 was $24 million, compared to $29 million in 2016.
SLIM’s AUM was C$59.3 billion as at December 31, 2017, compared to C$53.2 billion as at December 31, 2016. This increase was mainly driven by $10.8 billion gross sales and $1.4 billion asset appreciation, partially offset by redemptions and currency impact due to the strengthening of the Canadian dollar relative to the exchange rates at the end of the fourth quarter of 2016.
Management’s Discussion and Analysis Sun Life Financial Inc. Annual Report 2017 31

4. SLF Asia
Sun Life Financial’s history in Asia dates back to the early 1890’s. Today, SLF Asia operates in seven markets serving over 16 million Clients offering life, health and wealth management solutions, through a multi-channel distribution approach, that provide Client value. Sun Life is well positioned in Asia with the seven markets it operates in accounting for over 80% of higher growth markets in Asia’s GDP and life insurance premiums with high potential for growth.
Business Profile
2017 Highlights • During the year, we strengthened our market position across our businesses, including the completed acquisition of FWD’s
pension business in Hong Kong that allows us to distribute our Mandatory Provident Fund products through FWD’s agency force.
• We continued to enhance our distribution capabilities in 2017 with a 10-year arrangement with CIMB Principal Asset Management (CPAM), allowing us access to CPAM’s 8,000 agents in Malaysia and our arrangement with U Mobile, one of Malaysia’s fastest growing telecommunications companies, to offer life insurance via a telco service. In Vietnam, we opened 14 new sales offices across the country and signed a three-year arrangement with Timo, Vietnam’s leading digital banking platform.
• Across the region we have rolled out a number of initiatives focused on our Clients: • We launched a Real Time Active Listening program in the Philippines, Hong Kong, Indonesia, and Malaysia to gather
immediate feedback from our Clients on their experiences with us. • We launched a series of social media campaigns across the region, accompanied by fitness events and health awareness
workshops in each country, to reinforce the Sun Life purpose of helping Clients achieve financial security and live healthier lives. For example, we conducted the “Asia Diabetes Awareness Study” in Hong Kong, the Philippines, Indonesia, and Vietnam as a part of our global commitment to raise awareness for diabetes and we launched a collection of digital films in the Philippines to encourage more Clients to pursue their financial well-being.
• Overall, in Asia, Sun Life ranked as one of the top six insurance brands in the 2017 list of Campaign Asia’s Top 1000 Brands by marketing authority Campaign Asia, a confirmation that our brand equity is growing in the region.
Strategy and Outlook To support our purpose to help Clients achieve lifetime financial security and live healthier lives, we aim to establish a leadership position in Asia through distribution excellence in higher growth markets, building a strong suite of products, and enhancing our brand strength. We will continue to invest in digital capabilities such as mobile apps and web portals to make it easier for Clients to do business with us and leverage our data analytics to help improve Client experience while maintaining strong financial and risk management discipline and establishing a strong foundation of values, people and partnerships.
Specifically, we will focus on the following:
Putting the Client at the centre of everything we do • Develop and enhance Client portals and apps to empower and make it easier for Clients to interact with us • Deliver an omni-channel experience engaging Clients where, when and how they wish • Enhance our proactive Client-centric approach to enhance the Client experience to increase persistency and decrease
problems and complaints
Achieve scale in our current markets by entering new channels while deepening our presence in current channels • Further invest in building distribution scale and quality in newer markets such as Malaysia and Vietnam • Expand and enhance multi-channel distribution networks in our markets • Continue momentum in our wealth businesses in India, Hong Kong, and the Philippines
Establish a seamless Client experience with a connected and integrated digital ecosystem • Implement Advisor and Client Apps and Point of Sales system in our markets • Build on our capability to provide integrated user experiences to engage, capture and capitalize on key value drivers for Clients • Continue to create meaningful, personal and integrated Client interactions by enhancing our capabilities to capture, translate
and utilize information to generate insights to benefit our Clients
Distribution excellence in higher growth markets • Delivering on our Most Respected Advisor initiatives to achieve distribution excellence in all channels • Strengthen relationships with our bancassurance partners with a focus on bringing distribution excellence to quality partners
Outlook We expect that Asia’s economic growth will continue to underpin the expansion of the life insurance industry. This, combined with favourable demographics, low penetration rates for insurance and significant growth of the middle class, will provide tremendous opportunities for SLF Asia. On the other hand, changing regulatory regimes, increased competition from new entrants in the Asian market, and economic and geo-political uncertainty continue to pose challenges to our businesses. Our current strong market positions, key strategic partnerships and our ability to leverage our global expertise positions us well for the future.
32 Sun Life Financial Inc. Annual Report 2017 Management’s Discussion and Analysis

Business Markets
Business Description Market Position
Philippines(1)
Hong Kong
Indonesia
Vietnam
Malaysia(8)
India(10)
China(13)
• Individual and group life and health insurance products to individuals and businesses through a multi-channel distribution network
• Mutual funds to individual and institutional Clients through agency, bank partners, and direct distribution
• #1 ranked insurance company(2)
• 2nd largest mutual fund operation in the country(3)
• Individual life and health insurance to individuals and businesses through agency and brokerage distribution
• Mandatory Provident Fund and pension administration to individuals and businesses through agency and brokerage distribution
• Top 10 in Agency for Life Insurance(4)
• Top 5 MPF provider based on AUM, #2 based on net inflows(5)
• Individual life and health insurance, and creditor life insurance through a multi-channel distribution network, including an exclusive bancassurance partnership with CIMB Niaga, the 5th largest bank in the country
• Ranked in the Top 15 overall and Top 10 in Agency(6)
• Individual insurance and pensions distributed through agency, corporate sales and digital distribution channels
• Ranked in the Top 15(7)
• Individual and group insurance through banks and telco arrangements, including an exclusive bancassurance agreement with CIMB Group, Malaysia’s 2nd largest bank
• The fastest growing insurance company in Malaysia and #3 in Bancassurance(9)
• Individual and group insurance, savings and retirement products through a multi-channel distribution network
• Mutual fund products to both individual and institutional investors through independent financial advisors, banks, and direct distribution channels
• 3rd largest mutual fund operation in the country(11)
• Top 10 life insurance company in India(12)
• Individual life and health insurance and savings products distributed through a multi-channel distribution network
• Institutional asset management, passive third party asset management and debt financing business through direct distribution
• Top 15 among multinationals(14)
(1) Philippines: Includes a Joint venture with the Yuchengco Group - Sun Life Grepa Financial, Inc. (49%). (2) Insurance Commission of the Philippines, based on 2016 total premium income for Sun Life of Canada (Philippines). (3) Philippine Investment Funds Association, based on third quarter 2017 ending assets under management. (4) Insurance Authority of Hong Kong, Provisional Statistics on Hong Kong Long Term Insurance Business, based on third quarter 2017 year to date annualized first year premiums. (5) Mercer MPF Report (as at September 29, 2017). (6) Indonesia Life Insurance Association industry report, based on third quarter 2017 year to date annualized first year premiums. (7) Third quarter of 2017 year to date annualized first year premiums based on data shared among industry players. (8) Malaysia: Joint ventures with Khazanah Nasional Berhad and CIMB Group Holdings Berhad - Sun Life Malaysia Assurance Berhad (49%), Sun Life Malaysia Takaful Berhad
(49%). (9) Life Insurance Association of Malaysia; Insurance Services Malaysia Berhad; Based on the third quarter 2017 year to date annualized first year premium for conventional and
takaful business. (10) India: Joint ventures with the Aditya Birla Group - Aditya Birla Sun Life Insurance Company Limited (49%), Aditya Birla Sun Life Asset Management Company Limited
(“Aditya Birla Sun Life AMC Limited”) (49%). (11) Association of Mutual Funds in India, based on closing assets under management as at December 31, 2017. (12) Insurance Regulatory Authority of India, based on third quarter 2017 year to date first year premiums among private players. (13) China: Joint ventures with the China Everbright Group: Sun Life Everbright Life Insurance Company Limited (24.99%), Sun Life Everbright Asset Management Co., Ltd (24.74%). (14) China Insurance Regulatory Commission, based on gross premiums for third quarter 2017 year to date (excluding universal and variable universal life insurance deposits and
pension companies).
Financial and Business Results
($ millions) 2017 2016 2015
Reported net income 326 309 311 Market related impacts(1) (19) (13) 19 Assumption changes and management actions(1) 15 (6) 40 Acquisition, integration and restructuring(2)(3) — 33 —
Underlying net income(2) 330 295 252
Reported ROE (%)(2) 7.6 7.9 9.2 Underlying ROE (%)(2) 7.7 7.5 7.4
Insurance Sales(2) 687 660 535 Wealth Sales(2) 13,056 8,849 7,070
(1) See section L - Non-IFRS Financial Measures in this document for a breakdown of components within this adjustment. (2) Represents a non-IFRS financial measure. See section L - Non-IFRS Financial Measures in this document. (3) In 2016, Acquisition, integration and restructuring amounts relate primarily to an adjustment for a non-cash gain of $37 million to our reported net income as a result of both
remeasuring our existing investment to fair value upon acquiring control over the operations of Sun Life Vietnam Insurance Company Limited (“Sun Life Vietnam”) and remeasuring our existing investment to fair value upon acquiring control over the operations of PT CIMB Sun Life in Indonesia, partially offset by acquisition and integration costs.
Management’s Discussion and Analysis Sun Life Financial Inc. Annual Report 2017 33

661
Profitability Individual Insurance Sales Reported net income was $326 million in 2017, compared to $309 million in ($ millions)
2016. Underlying net income in 2017 was $330 million, compared to Philippines Hong Kong Indonesia$295 million in the prior year. The impact from the movement in the Canadian Vietnam Malaysia Indiadollar in 2017 relative to average exchange rates in 2016 decreased reported
net income and underlying net income by $18 million and $19 million, China respectively. +16%(1)
628 Reported net income in 2017 compared to 2016 reflected favourable impact from ACMA, partially offset by higher unfavourable market related impacts, primarily driven by interest rate and equity market changes. 2016 reflected the
488favourable impact of acquisition, integration and restructuring amounts related to remeasuring our existing investment to fair value upon acquiring control over the operations of Sun Life Vietnam Insurance Company Limited (“Sun Life Vietnam”) and over the operations of Sun Life Financial Indonesia. Underlying net income in 2017 compared to 2016 reflected growth in fee income business and higher level of gains from available for sale (“AFS”) assets.
Growth SLF Asia insurance sales were $687 million in 2017, compared to $660 million in 2016. Total individual insurance sales in 2017 increased 5% from 2016. On a constant currency basis, individual insurance sales increased 9% driven by our increase in ownership in Indonesia, Vietnam and India, as well as organic growth in all markets except Hong Kong.
(1) Compound annual growth rate SLF Asia wealth sales were $13.1 billion in 2017, compared to $8.8 billion in 2016. Wealth sales grew by 49% on a constant currency basis over 2016, driven by exceptional growth in our mutual fund operations in India and the Philippines, as well as our Hong Kong pensions business.
Profitability and Growth by Business Market We continued to build our agency and alternate distribution channels, leverage a more balanced product portfolio and increase efficiency and productivity while maintaining Client focus.
Philippines - On a local currency basis, individual insurance sales were up 8% from 2016. Mutual and managed fund AUM were C$2.1 billion as at the end of 2017, 73% higher than 2016, measured in local currency.
Agency headcount reached approximately 11,200 at the end of 2017, 21% higher than 2016.
Hong Kong - On a local currency basis, individual insurance sales were down 15% from 2016, with 16% growth in the agency channel more than offset by 50% lower in the broker channel. AUM in our pension business reached C$10 billion, up 61% from 2016, measured in local currency.
Agency headcount grew 6% from 2016 to approximately 2,050 at the end of 2017.
Indonesia - On a local currency basis, our individual life insurance sales in Indonesia were up 33% from 2016, driven primarily by organic growth in the agency and bancassurance channels and increase in our ownership in PT CIMB Sun Life.
Agency headcount increased to approximately 10,300 in 2017.
Vietnam - On a local currency basis, individual insurance sales grew by 33% from 2016, driven primarily by growth in the agency channel and by increase in our ownership.
Agency headcount was almost 3,800 at the end of 2017, up 29% from 2016.
Malaysia - On a local currency basis, individual insurance sales in Malaysia were up 9% in 2017 compared to 2016, driven by growth in the bancassurance channel.
India - On a local currency basis, individual life insurance sales at BSLI were up 53% from 2016, driven by growth in both the agency and bancassurance channels and by increase in our ownership.
On a local currency basis, gross sales of equity and fixed income funds in Aditya Birla Sun Life AMC Limited were up 52%, and total AUM increased 35% from 2016.
Total AUM for Aditya Birla Sun Life AMC Limited at the end of 2017 were C$50 billion, of which C$24 billion is reported in our AUM.
China - On a local currency basis, sales of individual insurance products by Sun Life Everbright Life Insurance Company Limited (“SLEB”) were up 27% in 2017 compared to 2016, with 13% growth in the agency channel, 19% in bancassurance and 43% in telemarketing.
Agency headcount reached approximately 4,100 at the end of 2017, up 59% from 2016.
34 Sun Life Financial Inc. Annual Report 2017 Management’s Discussion and Analysis
2015 2016 2017

5. Corporate
Corporate includes the results of our United Kingdom business (SLF U.K.) and Corporate Support.
Business Units
Business Description
SLF U.K. • SLF U.K. has a run-off block of business consisting of approximately 633,000 in-force life and pension policies, with approximately £12.2 billion of AUM. Since December 2010, SLF U.K. has been closed to new business and focuses on supporting existing Clients. Most administrative functions have been outsourced to external service providers which are managed by an in-house management team.
Corporate Support • Corporate Support operations consist of the expenses, debt charges, investment income, capital and other items not allocated to Sun Life Financial’s other business segments, as well as the Company’s Run-off reinsurance business. Coverage in our Run-off reinsurance business includes long-term care, medical coverage, and guaranteed minimum income and death benefit coverage. The block also includes group long-term disability and personal accident which are 100% retroceded.
Financial and Business Results
Summary statements of operations ($ millions) 2017 2016 2015
SLF U.K. 181 184 200 Corporate Support (282) (181) (174)
Reported net income (loss) (101) 3 26 Market related impacts(1) 5 (13) 14 Assumption changes and management actions(1)(2) 55 14 11 Acquisition, integration and restructuring (3) (55) (5) (17) U.S. tax reform(2) (54) — —
Underlying net income (loss)(4) (52) 7 18
(1) See section L - Non-IFRS Financial Measures in this document for a breakdown of components within this adjustment. (2) U.S. tax reform impact of $(54) million includes $5 million of ACMA, which is excluded from ACMA of $55 million. (3) In 2017, the amount consists primarily of the impact in the fourth quarter of 2017 of the Company’s plan to enhance business processes and organizational structures and
capabilities. The amount in 2016 and 2015 primarily included Acquisition, integration and restructuring amounts consisted primarily of acquisition and integration costs from Bentall Kennedy Group of Companies, Prime Advisors, Inc. and Ryan Labs Asset Management Inc. in Corporate Support in 2016.
(4) Represents a non-IFRS financial measure. See section L - Non-IFRS Financial Measures in this document.
Profitability Reported net loss was $101 million in the Corporate segment in 2017, compared to a reported net income of $3 million in 2016, reflected the unfavourable impact of acquisition, integration and restructuring amounts and the impact of the U.S. tax reform, partially offset by the favourable impact of ACMA. Underlying net loss was $52 million in 2017, compared to underlying net income of $7 million in 2016. The impact from the movement of the Canadian dollar relative to average exchange rates in 2017 increased reported and underlying net loss by $15 million and $9 million, respectively.
Profitability by Business Unit
SLF U.K. SLF U.K.‘s reported net income was $181 million in 2017, compared to $184 million in 2016. Reported net income in 2017 compared to 2016 reflected the favourable impact of ACMA, improved equity markets and favourable mortality experience, offset by lower level of gains from investing activity on insurance contract liabilities and impacts from the treatment of policyholder tax losses.
Corporate Support In Corporate Support, the reported net loss was $282 million in 2017, compared to a reported net loss of $181 million in 2016. The increase in loss in 2017 relative to 2016 is primarily due to the impact of the U.S. tax reform and the restructuring charge related to actions to enhance business processes and organizational structures.
H. Investments
The Company strives to ensure that all general fund investments are properly aligned with business objectives, meeting policyholder obligations, and that adequate liquidity is maintained at all times. Consideration is given in our investment process to a wide range of factors, including ensuring attractive risk and return profiles, appropriate diversification by asset type, credit exposure and sector, financial condition of issuers and borrowers, quality and value of underlying security and macro- and micro-economic
Management’s Discussion and Analysis Sun Life Financial Inc. Annual Report 2017 35

developments and trends including prospects for specific industry sectors. The Risk & Conduct Review Committee of the Board of Directors approves policies that contain prudent standards and procedures for the investment of our general fund assets. These policies include requirements, restrictions and limitations for interest rate, credit, equity market, real estate market, liquidity, concentration, currency, and derivative risks. Compliance with these policies is monitored on a regular basis and reported annually to the Risk & Conduct Review Committee. The Governance, Nomination & Investment Committee of the Board of Directors monitors the Company’s Investment Plan and investment performance, oversees practices, procedures and controls related to the management of the general fund investment portfolio, and reviews corporate governance guidelines and processes.
1. Investment Profile We had total general fund invested assets of $146.1 billion as at December 31, 2017, compared to $142.4 billion as at December 31, 2016. The increase in general fund invested assets was primarily due to changes in operating activity and net fair value growth, partially offset by the currency impact of the strengthening Canadian dollar and the net redemption of subordinated debt. Our general fund invested assets are well diversified across investment types, geographies and sectors with the majority of our portfolio invested in fixed income high quality assets.
Additional detail on our investments is provided in Notes 5 and 6 to our 2017 Annual Consolidated Financial Statements. The following chart sets out the composition of our general fund invested assets(1).
As at December 31, 2017 December 31, 2016 $146.1 billion $142.4 billion
Cash, cash equivalents and short-term securities 6% 6%
Debt securities 50% 50%
Equity securities 4% 4%
Mortgages and loans 29% 29%
Investment properties 5% 5%
Other(2) 6% 6%
(1) The values and ratios presented are based on the carrying value of the respective asset categories. Generally the carrying values for invested assets are equal to their fair values; however our mortgages and loans are generally carried at amortized cost. As at December 31, 2017, the fair value of mortgages and loans was $45.4 billion ($43.1 billion as at December 31, 2016) and the carrying value of mortgages and loans was $42.8 billion ($40.8 billion as at December 31, 2016). For invested assets supporting insurance contracts, in the event of default, if the amounts recovered are insufficient to satisfy the related insurance contract liability cash flows that the assets are intended to support, credit exposure may be greater than the carrying value of the assets.
(2) Consists of: Other invested assets (3%), Policy loans (2%), Derivative assets (1%) for 2017 and 2016.
2. Debt Securities Our debt securities portfolio is actively managed through a regular program of purchases and sales aimed at optimizing yield, quality and liquidity, while ensuring that it remains well diversified and duration-matched to insurance contract liabilities. With the exception of certain countries where we have business operations, including Canada, the United States, the United Kingdom and the Philippines, our exposure to debt securities from any single country did not exceed 1% of total invested assets on our Consolidated Statements of Financial Position as at December 31, 2017.
Debt Securities by Issuer and Industry Sector December 31, 2017 December 31, 2016
($ millions) Total % of Total Total % of Total
Debt securities issued or guaranteed by: Canadian federal government 5,198 7% 4,771 7% Canadian provincial and municipal government 13,296 18% 12,600 17% U.S. government and agency 2,049 3% 1,890 3% Other foreign government 6,113 9% 6,344 9%
Total government issued or guaranteed debt securities 26,656 37% 25,605 36% Corporate debt securities by industry sector:
Financials 9,561 12% 9,303 13% Utilities 7,306 10% 7,201 10% Consumer discretionary 2,961 4% 3,158 4% Industrials 4,797 7% 4,811 7% Consumer staples 2,271 3% 2,695 4% Telecommunication services 2,061 3% 2,074 3% Energy 4,112 6% 4,416 6% Real estate 2,579 4% 2,301 3% Materials 1,473 2% 1,466 2% Other 2,943 4% 2,911 4%
Total corporate debt securities 40,064 55% 40,336 56% Asset-backed securities 5,899 8% 5,946 8%
Total debt securities 72,619 100% 71,887 100%
36 Sun Life Financial Inc. Annual Report 2017 Management’s Discussion and Analysis

Debt Securities by Credit Rating The credit risk ratings in the following table were established in accordance with the internal rating process described in this MD&A under the heading J - Risk Management - 8 - Risk Categories - Credit Risk Management Governance and Control.
Our debt securities with a credit rating of “A” or higher represented 70.6% of the total debt securities as at December 31, 2017, compared to 69.6% as at December 31, 2016. Debt securities with a credit rating of “BBB” or higher represented 98.3% of total debt securities as at December 31, 2017, compared to 97.6% as at December 31, 2016.
As at December 31, 2017 December 31, 2016 $72.6 billion $71.9 billion
AAA 18% 18%
AA 22% 19%
A 31% 33%
BBB 27% 28%
BB and lower 2% 2%
Debt Securities by Geography The carrying value of FVTPL and AFS debt securities by geographic location is presented in the following table.
December 31, 2017 December 31, 2016
FVTPL debt AFS debt FVTPL debt AFS debt
($ millions) securities securities Total % of Total securities securities Total % of Total
Debt securities
Canada 24,132 4,114 28,246 39% 22,507 3,589 26,096 36%
United States 20,758 5,719 26,477 36% 21,469 5,910 27,379 38%
Europe 8,923 1,402 10,325 14% 9,087 1,507 10,594 15%
Asia 3,694 571 4,265 6% 3,841 651 4,492 6%
Other 2,460 846 3,306 5% 2,562 764 3,326 5%
Total debt securities 59,967 12,652 72,619 100% 59,466 12,421 71,887 100%
Our gross unrealized losses as at December 31, 2017 for FVTPL and AFS debt securities were $0.3 billion and $0.1 billion, respectively, compared with $0.7 billion and $0.1 billion, respectively, as at December 31, 2016.
3. Equities
Our equity portfolio is well diversified with approximately 58% of our portfolio invested in exchange-traded funds as at December 31, 2017, compared to 57% as at December 31, 2016. Exchange-traded fund holdings are primarily in the S&P/Toronto Stock Exchange (“TSX”) 60 Index Fund and Standard & Poor’s Depository Receipts. The carrying value of equities by issuer geography as at December 31, 2017 is set out in the following table.
Equities by Issuer Geography
December 31, 2017 December 31, 2016
FVTPL AFS FVTPL AFS ($ millions) equities equities Total % of Total equities equities Total % of Total
Equity securities
Canada 3,282 53 3,335 55% 3,404 37 3,441 60%
United States 765 671 1,436 24% 757 538 1,295 22%
Europe 404 6 410 7% 729 6 735 13%
Asia 613 212 825 14% 114 177 291 5%
Other 14 — 14 —% 12 — 12 —%
Total equity securities 5,078 942 6,020 100% 5,016 758 5,774 100%
Excluding exchange-traded funds and mutual funds, there were no issuers exceeding 1% of the equity portfolio as at December 31, 2017.
Management’s Discussion and Analysis Sun Life Financial Inc. Annual Report 2017 37

4. Mortgages and Loans Mortgages and loans disclosures in this section are presented at their carrying value on our Consolidated Statements of Financial Position. Our mortgage portfolio consisted almost entirely of first mortgages and our loan portfolio consisted of private placement loans.
The carrying value of mortgages and loans by geographic location is presented in the following table(1).
Mortgages and Loans by Geography
December 31, 2017 December 31, 2016
($ millions) Mortgages Loans Total % of Total Mortgages Loans Total % of Total
Canada 8,390 13,265 21,655 51% 8,234 13,120 21,354 52%
United States 7,103 9,542 16,645 39% 7,162 8,562 15,724 39%
Europe — 2,706 2,706 6% — 1,668 1,668 4%
Asia — 265 265 1% — 247 247 1%
Other — 1,534 1,534 3% — 1,782 1,782 4%
Total 15,493 27,312 42,805 100% 15,396 25,379 40,775 100%
(1) The geographic location for mortgages is based on the location of the property and for loans it is based on the country of the creditor’s parent.
Mortgage Portfolio As at December 31, 2017, we held $15.5 billion of mortgages, compared to $15.4 billion as at December 31, 2016. Our mortgage portfolio consists entirely of commercial mortgages, as presented in the following table.
December 31, 2017 December 31, 2016
($ millions) Insured Uninsured Total Insured Uninsured Total
Mortgages
Retail — 4,291 4,291 — 4,480 4,480
Office — 4,261 4,261 — 4,408 4,408
Multi-family residential 2,921 1,661 4,582 2,782 1,398 4,180
Industrial and land — 1,660 1,660 — 1,725 1,725
Other 250 449 699 154 449 603
Total mortgages 3,171 12,322 15,493 2,936 12,460 15,396
% of total mortgages 20% 80% 100% 19% 81% 100%
As at December 31, 2017, 30% of our commercial mortgage portfolio consisted of multi-family residential mortgages; there are no single family residential mortgages. Our uninsured commercial portfolio had a weighted average loan-to-value ratio of approximately 55% as at December 31, 2017, consistent with December 31, 2016. While we generally limit the maximum loan-to-value ratio to 75% at issuance, we may invest in mortgages with a higher loan-to-value ratio in Canada if the mortgage is insured by the Canada Mortgage and Housing Corporation (“CMHC”). The estimated weighted average debt service coverage for our uninsured commercial portfolio is 1.77 times. Of the $3.2 billion of multi-family residential mortgages in the Canadian commercial mortgage portfolio, 91% were insured by the CMHC.
Loan Portfolio As at December 31, 2017, we held $27.3 billion of loans, compared to $25.4 billion as at December 31, 2016. Private placement loans provide diversification by type of loan, industry segment and borrower credit quality. The private placement loan portfolio consists of senior secured and unsecured loans to large- and mid-market sized corporate borrowers, securitized lease/loan obligations secured by a variety of assets, and project finance loans in sectors such as power and infrastructure.
The credit risk ratings in the following chart were established in accordance with the internal rating process described in this MD&A under the heading J - Risk Management - 8 - Risk Categories - Credit Risk Management Governance and Control. As at December 31, 2017, 97% of our total loan portfolio is investment grade, consistent with December 31, 2016.
Loans by Credit Ratings Loans by Sector As at December 31, 2017 December 31, 2016 As at December 31, 2017 December 31, 2016
$27.3 billion $25.4 billion $27.3 billion $25.4 billion
AAA 2% 2% Corporate Issued Loans 66% 66%
AA 13% 14% Canadian provincial and 24% 25% municipal government
A 43% 45%
U.S. government & agency 7% 7%BBB 39% 36%
Other foreign government 3% 2%BB & lower 3% 3%
Canadian federal government <0.5% <0.5%Impaired <0.5% <0.5%
38 Sun Life Financial Inc. Annual Report 2017 Management’s Discussion and Analysis

Mortgages and Loans Past Due or Impaired The gross carrying value and allowance for mortgages and loans past due or impaired are presented in the following table.
December 31, 2017
Gross carrying value Allowance for losses
($ millions) Mortgages Loans Total Mortgages Loans Total
Not past due 15,482 27,180 42,662 — — — Past due:
Past due less than 90 days — 71 71 — — — Past due 90 days or more — — — — — —
Impaired 33 89 122 22(1) 28 50 Total 15,515 27,340 42,855 22 28 50
December 31, 2016
Gross carrying value Allowance for losses
($ millions) Mortgages Loans Total Mortgages Loans Total
Not past due 15,378 25,379 40,757 — — —
Past due: Past due less than 90 days 2 — 2 — — —
Past due 90 days or more — — — — — —
Impaired 39 7 46 23(1) 7 30
Total 15,419 25,386 40,805 23 7 30
(1) Includes $20 million of sectoral provisions as at December 31, 2017, and $21 million of sectoral provisions as at December 31, 2016.
Our impaired mortgages and loans, net of allowance for losses, were $72 million as at December 31, 2017, compared to $16 million as at December 31, 2016. The increase of $56 million in impaired loans was primarily due to the addition of two creditors in the first quarter of 2017.
5. Derivatives
The fair value of derivative assets held by the Company was $1,478 million, while the fair value of derivative liabilities was $1,756 million as at December 31, 2017, compared to a fair value of derivative assets of $1,608 million and a fair value of derivative liabilities of $2,512 million as at December 31, 2016.
We use derivative instruments to manage risks related to interest rate, equity market, and currency fluctuations and in replication strategies to reproduce permissible investments. Our use of derivatives in these risk mitigation strategies does not mitigate all risk exposure; rather, they are used to keep us within our risk tolerance limits.
In addition to the general policies and monitoring, we use a variety of tools in counterparty risk management. Over-the-counter (“OTC”) derivative transactions are executed under International Swaps and Derivatives Association (“ISDA”) Master Agreements. A Credit Support Annex accompanies most of the ISDAs, which establish requirements for collateral.
Derivative Instruments The values associated with our derivative instruments are presented in the following table. Notional amounts serve as the basis for payments calculated under derivatives contracts and are not exchanged.
($ millions) 2017 2016
As at December 31
Net fair value (278) (904)
Total notional amount 54,121 54,350
The total notional amount of our derivatives decreased to $54.1 billion as at December 31, 2017 from $54.4 billion as at December 31, 2016.
The net fair value of derivatives was a net liability of $278 million as at December 31, 2017, compared to a net liability of $904 million as at December 31, 2016. The increase in net fair value was primarily due to the impact of the strengthening of the Canadian dollar against the U.S. dollar on foreign exchange contracts, partially offset by upward shifts in the yield curve.
Certain of our derivatives are designated in qualifying hedging relationships for accounting purposes, and represented $0.8 billion, or 1.5% of the total notional amount. Derivatives are designated in hedging relationships for accounting purposes to minimize accounting mismatches. These hedging relationships are documented at inception and hedge effectiveness is assessed on a quarterly basis.
Management’s Discussion and Analysis Sun Life Financial Inc. Annual Report 2017 39

Our derivatives designated in qualifying hedging relationships for accounting purposes include interest rate swaps, foreign exchange agreements, equity forwards and, previously, currency swaps. We designate certain interest rate swaps in fair value hedging relationships to hedge interest rate exposure on AFS assets. We also designate certain foreign exchange agreements in fair value and cash flow hedging relationships to manage foreign currency fluctuations associated with AFS assets. Additionally, we designate certain equity forwards in cash flow hedging relationships for anticipated payments of awards under certain stock-based compensation plans.
Credit Equivalent Amount As the regulator of the Canadian insurance industry, OSFI provides guidelines to quantify the use of derivatives. The credit equivalent amount, a measure used to approximate the potential credit exposure, is determined as the replacement cost of the derivative contracts having a positive fair value plus an amount representing the potential future credit exposure.
The risk-weighted credit equivalent amount is a measure used to determine the amount of capital necessary to support derivative transactions for certain Canadian regulatory purposes. It is determined by weighting the credit equivalent amount according to the nature of the derivative and the creditworthiness of the counterparties.
($ millions) 2017 2016
Credit equivalent Risk Credit Risk
amount weighted equivalent weighted (“CEA”)(1) CEA(1) amount(1) CEA(1)
Foreign exchange contracts 405 3.7 315 2.8
Interest rate contracts 135 1.7 177 2.2
Equity and other contracts 21 0.2 18 0.2
Total 561 5.6 510 5.2
(1) Amounts presented are net of collateral received
Credit Default Swaps By Underlying Financial Instrument Credit Rating Credit default swaps (“CDS”) are derivative contracts that transfer credit risk related to an underlying referenced financial instrument from one counterparty to another. The purchaser receives protection against the decline in the value of the referenced financial instrument as a result of specified credit events such as default or bankruptcy. The seller receives a periodic premium in return for payment contingent on a credit event affecting the referenced financial instrument. CDS index contracts are those where the underlying referenced financial instruments are a group of assets. The Company enters into credit derivatives to replicate credit exposure of an underlying reference security and enhance investment returns. The credit risk ratings of the underlying reference securities for single name contracts were established in accordance with the internal rating process described in section J - Risk Management - 8 - Risk Categories - Credit Risk Management Governance and Control.
The following table provides a summary of the credit default swap protection sold by credit rating of the underlying reference security.
($ millions) 2017 2016
Notional Notional amount Fair value amount Fair value
Single name CDS contracts
AA 67 1 88 1
A 584 15 491 5
BBB 446 9 284 2
Total single name CDS contracts 1,097 25 863 8
CDS index contracts 24 — 42 —
Total credit default swap contracts 1,121 25 905 8
Additional detail on our derivative portfolio by derivative type is provided in Note 6.A.iv to our 2017 Annual Consolidated Financial Statements.
40 Sun Life Financial Inc. Annual Report 2017 Management’s Discussion and Analysis

6. Investment Properties Office, retail and industrial properties are the major components of our investment properties portfolio, representing approximately 82% as at December 31, 2017.
Investment Properties by Type and Geography December 31, 2017
Multi-family ($ millions) Office(1) Industrial Retail residential Other Total % Total
Canada 1,966 1,000 1,177 921 196 5,260 74% United States 907 318 386 — 120 1,731 25% Europe 24 12 38 — 2 76 1% Total 2,897 1,330 1,601 921 318 7,067 100%
December 31, 2016
Multi-family ($ millions) Office Industrial Retail residential Other Total % of Total
Canada 1,680 964 1,031 818 220 4,713 72%
United States 878 372 459 — 97 1,806 27%
Europe 24 9 39 — 1 73 1%
Total 2,582 1,345 1,529 818 318 6,592 100%
(1) As a result of the relocation of our head office location, the December 31, 2017 balance includes the reclassification of our former head office location in the second quarter of 2017, previously classified as owner-occupied, with a fair value of $259 million at the time of transfer from Other Assets to Investment properties. The reclassification recognized revaluation surplus of $172 million which was recorded as an increase of $139 million of accumulated other comprehensive income, net of taxes of $33 million.
7. Impaired Assets Financial assets that are classified as FVTPL, which represented 46% of our invested assets as at December 31, 2017, do not have allowances for losses since changes in the fair value of these assets are recorded to income and the assets are recorded at fair value on our Consolidated Statements of Financial Position. In the event of default, if the amounts recovered are insufficient to satisfy the related insurance contract liability cash flows that the assets are intended to support, credit exposure may be greater than the carrying value of the asset.
In the absence of objective evidence of impairment, impairment losses are not recognized on AFS debt securities, equity securities and other invested assets. If the amortized cost of these assets is greater than their fair values, unrealized losses are recognized in other comprehensive income (“OCI”). Unrealized losses may be due to interest rate fluctuations or depressed fair values in sectors which have experienced strong negative market performance.
Additional detail on our impairment policy is provided in Note 1.iii to our 2017 Annual Consolidated Financial Statements.
8. Asset Default Provision We make provisions for possible future credit events in the determination of our insurance contract liabilities. The amount of the provision for asset default included in insurance contract liabilities is based on possible reductions in future investment yields that vary by factors such as type of asset, asset credit quality (rating), duration and country of origin. To the extent that an asset is written off, or disposed of, any amounts that were set aside in our insurance contract liabilities for possible future asset defaults in respect of that asset are released.
Our asset default provision reflects the provision relating to future credit events for fixed income assets currently held by the Company that support our insurance contract liabilities. Our asset default provision as at December 31, 2017 was $2,288 million for losses related to possible future credit events for fixed income assets currently held by the Company that support our insurance contract liabilities. This represents 2.3% of the fixed income assets supporting insurance contract liabilities reported on our Consolidated Statements of Financial Position as at December 31, 2017.
Our asset default provision as at December 31, 2017 was $41 million higher than the provision as at December 31, 2016, primarily due to increases in the provision for assets purchased, net of dispositions offset by strengthening of the Canadian dollar and the release of provisions on fixed income assets supporting our insurance contract liabilities.
The following table sets out the changes in our asset default provision for existing fixed income investments.
($ millions) 2017 2016
Opening balance 2,247 2,077
Purchases, dispositions and net asset movement(1) 398 477
Changes in assumptions and methodologies (16) (2)
Changes in ratings 11 44
Release of provisions(2) (272) (271)
Currency (80) (78)
Closing balance 2,288 2,247
(1) Net movement reflects the fluctuation in the value of FVTPL assets arising from movements in interest rates, credit spreads and other factors that impact the market value of fixed income investments.
(2) This amount represents the orderly release of provisions for future credit events held in insurance contract liabilities.
Management’s Discussion and Analysis Sun Life Financial Inc. Annual Report 2017 41

I. Capital and Liquidity Management
Capital and liquidity management is core to our business as an insurance company. We ensure adequate capital for the protection of our policyholders, Clients and creditors, while managing capital adequacy and allocation across our businesses for the benefit of our shareholders. In addition, we maintain strong financial flexibility by ensuring that sufficient liquid assets are available to cover our anticipated payment obligations and funding requirements. We invest in various types of assets with a view to matching them with liabilities of various durations.
The regulatory environments in which we operate are expected to evolve as governments and regulators work to develop the appropriate level of financial regulation required to ensure that capital, liquidity and risk management practices are sufficient to withstand severe economic downturns.
Life Insurance Capital Adequacy Test OSFI has implemented a revised regulatory capital framework referred to as LICAT in Canada effective January 1, 2018. See section F - Financial Strength in this document for additional information.
1. Capital
We have a capital risk policy designed to maintain a strong capital position and to provide the flexibility necessary to take advantage of growth opportunities, to support the risk associated with our businesses and to optimize shareholder return. Our capital risk policy is also intended to provide an appropriate level of risk management over capital adequacy risk, which is defined as the risk that capital is not or will not be sufficient to withstand adverse economic conditions, to maintain financial strength, or to allow the Company and its subsidiaries to take advantage of opportunities for expansion. Our capital base is structured to exceed minimum regulatory and internal capital targets and to maintain strong credit and financial strength ratings, while maintaining a capital-efficient structure. Capital is managed both on a consolidated basis under principles that consider all the risks associated with the business as well as at the business group level under the principles appropriate to the jurisdictions in which we operate. The capital of our foreign subsidiaries is managed on a local statutory basis in a manner commensurate with their individual risk profiles.
Sun Life Financial, including all of its business groups, engages in a capital planning process annually in which capital deployment options, capital raising and dividend recommendations are presented to the Board of Directors. Capital reviews are regularly conducted which consider the potential impacts under various business, interest rate and equity market scenarios. Relevant components of these capital reviews, including dividend recommendations, are presented to the Risk & Conduct Review Committee of the Board of Directors on a quarterly basis. The Board of Directors is responsible for the approval of our annual capital plan and quarterly shareholder dividends.
The Company’s capital risk policy establishes policies, operating guidelines and procedures that govern the management of capital. The capital risk policy is reviewed annually by the Risk & Conduct Review Committee and any changes are approved by the Board of Directors. Our Corporate Treasury and Risk Management functions are responsible for the development and implementation of the capital risk policy.
The Company’s capital base consists mainly of common shareholders’ equity. Other sources of capital include preferred shareholders’ equity and subordinated debt issued by SLF Inc. and Sun Life Assurance. For Canadian regulatory purposes, our capital also includes innovative capital instruments issued by Sun Life Capital Trust and Sun Life Capital Trust II.
The following table summarizes the sources of our capital and our capital position over the past two years. Notes 13, 14, 15 and 21 to our 2017 Annual Consolidated Financial Statements include additional details on our capital.
($ millions) 2017 2016
Subordinated debt 3,437 3,836
Innovative capital instruments(1) 699 698
Equity
Participating policyholders’ equity 650 412
Preferred shareholders’ equity 2,257 2,257
Common shareholders’ equity 20,064 19,699
Total equity 22,971 22,368
Total capital 27,107 26,902
Financial leverage ratio(2) 23.6% 25.2%
(1) Innovative capital instruments are presented net of associated transaction costs and consist of SLEECS, which were issued by Sun Life Capital Trust and Sun Life Capital Trust II. SLEECS qualify as capital for Canadian regulatory purposes. However, under IFRS they are reported as Senior debentures in our Annual and Interim Consolidated Financial Statements.
(2) Represents a non-IFRS financial measure. See section L - Non-IFRS Financial Measures in this document.
Our total capital consists of subordinated debt and other capital instruments, participating policyholders’ equity and total shareholders’ equity which includes common shareholders’ equity and preferred shareholders’ equity.
Common shareholders’ equity was $20.1 billion as at December 31, 2017, compared with $19.7 billion as at December 31, 2016. The $0.4 billion increase was due to common shareholders’ net income and OCI, partially offset by dividends on common shares.
42 Sun Life Financial Inc. Annual Report 2017 Management’s Discussion and Analysis

The table below provides the earliest par call and maturity dates for our subordinated debt, innovative capital instruments and preferred shares outstanding as at December 31, 2017.
Description Interest Rate
Earliest Par Call Date/Redemption Date(1) Maturity
Principal/ Face Amount ($ millions)
Subordinated Debt Issued by Sun Life Assurance 6.30% Debentures, Series 2 6.30% n/a 2028 150
Subordinated Debt Issued by SLF Inc. Series 2007-1 5.40% May 29, 2037 2042 400
Series 2008-1 5.59% January 30, 2018 2023 400
Series 2014-1 2.77% May 13, 2019 2024 250
Series 2015-1 2.60% September 25, 2020 2025 500
Series 2016-1 3.10% February 19, 2021 2026 350
Series 2016-2 3.05% September 19, 2023 2028 1000
Series 2017-1 2.75% November 23, 2022 2027 400
Trust Units Issued by Sun Life Capital Trust SLEECS - Series B 7.09% June 30, 2032 Perpetual 200
Debt Securities Issued by Sun Life Capital Trust II SLEECS - Series 2009-1 5.86% December 31, 2019 2108 500
Class A Preferred Shares Issued by SLF Inc. Series 1 4.75% Any time Perpetual 400
Series 2 4.80% Any time Perpetual 325
Series 3 4.45% Any time Perpetual 250
Series 4 4.45% Any time Perpetual 300
Series 5 4.50% Any time Perpetual 250
Series 8R(2) 2.275% June 30, 2020 Perpetual 130
Series 9QR(3) Floating June 30, 2020(5) Perpetual 150
Series 10R(2) 2.842% September 30, 2021 Perpetual 173
Series 11QR(4) Floating September 30, 2021(5) Perpetual 27
Series 12R(2) 3.806% December 31, 2021 Perpetual 300
(1) The earliest date on which the Company has the option, but not the obligation, to call securities for redemption at their par value. (2) On the earliest redemption date and every five years thereafter, the dividend rate will reset to an annual rate equal to the 5-year Government of Canada bond yield plus a
spread specified for each series. The specified spread for Class A shares is: Series 8R - 1.41%, Series 10R - 2.17% and Series 12R - 2.73%. On the earliest redemption date and every five years thereafter, holders will have the right, at their option, to convert their shares into the series that is one number higher than their existing series.
(3) Holders of Series 9QR Shares will be entitled to receive quarterly floating rate non-cumulative dividends at an annual rate equal to the then 3-month Government of Canada treasury bill yield plus 1.41%. Holders of the Series 9QR Shares will have the right, at their option, to convert their Series 9QR Shares into Series 8R Shares on June 30, 2020, and on June 30 every five years thereafter.
(4) Holders of Series 11QR Shares will be entitled to receive quarterly floating rate non-cumulative dividends at an annual rate equal to the then 3-month Government of Canada treasury bill yield plus 2.17%. Holders of the Series 11QR Shares will have the right, at their option, to convert their Series 11QR Shares into Series 10R Shares on September 30, 2021, and on September 30 every five years thereafter.
(5) Redeemable on the redemption date and every five years thereafter, in whole or in part, at par, and on any other date at $25.50 per share.
The following table shows the number of common shares and stock options outstanding of SLF Inc. for the last two years.
Number of Common Shares Outstanding (in millions) 2017 2016
Balance, beginning of year 613.6 612.3
Stock options exercised 0.4 1.3
Common shares repurchased (3.5) —
Balance, end of year 610.5 613.6
Number of Stock Options Outstanding (in millions) 2017 2016
Balance, beginning of year 3.4 4.8
Options issued 0.4 0.4
Options exercised, forfeited or expired (0.8) (1.8)
Balance, end of year 3.0 3.4
Under our Canadian Dividend Reinvestment and Share Purchase Plan (the “Plan”), Canadian-resident common and preferred shareholders may choose to have their dividends automatically reinvested in common shares of SLF Inc. and may also purchase
Management’s Discussion and Analysis Sun Life Financial Inc. Annual Report 2017 43

common shares through the Plan with cash. For dividend reinvestments, we may, at our option, issue common shares from treasury at a discount of up to 5% to the volume weighted average trading price or direct that common shares be purchased on behalf of participants on the open market through the Toronto Stock Exchange (“TSX”) and alternative Canadian trading platforms (the “Exchanges”) at the market price. Common shares of SLF Inc. acquired by participants through optional cash purchases may also be issued from treasury or purchased through the Exchanges at SLF Inc.’s option, in either case at no discount. Commencing with the dividends payable on March 31, 2016 and until further notice, common shares purchased under the Plan were purchased on the open market. There are no applicable discounts because the common shares are being purchased on the open market and are not being issued from treasury.
SLF Inc. grants stock options to certain employees. These options are granted at the closing price of SLF Inc.’s common shares on the TSX on the grant date.
As at February 2, 2018, SLF Inc. had 610,523,548 common shares, 2,963,903 options to acquire SLF Inc. common shares, and 92,200,000 Class A Shares outstanding.
2. Capital Adequacy OSFI has implemented a revised regulatory capital framework referred to as LICAT in Canada effective January 1, 2018. See section F - Financial Strength in this document for additional information.
SLF Inc. SLF Inc. is a non-operating insurance company and was subject to OSFI’s MCCSR capital rules as of December 31, 2017. In accordance with this guideline, SLF Inc. manages its capital in a manner commensurate with its risk profile and control environment, and SLF Inc.’s regulated subsidiaries comply with the capital adequacy requirements imposed in the jurisdictions in which they operate. SLF Inc.‘s consolidated capital position is above its internal target. Effective January 1, 2016, regulated insurance holding companies and non-operating insurance companies (collectively, “Insurance Holding Companies”) were subject to the MCCSR capital rules which have been established by OSFI. As at December 31, 2017, SLF Inc.’s MCCSR ratio was 246%. For additional information, refer to section F. Financial Strength in this document.
Sun Life Assurance Sun Life Assurance, SLF Inc.’s principal operating life insurance subsidiary in Canada, was subject to OSFI’s MCCSR capital rules as of December 31, 2017. The Company expects to maintain an MCCSR ratio for Sun Life Assurance at or above 200%. With an MCCSR ratio of 221% as at December 31, 2017, Sun Life Assurance’s capital ratio is well above OSFI’s supervisory ratio of 150% and regulatory minimum ratio of 120%. The MCCSR calculation involves using qualifying models or applying quantitative factors to specific assets and liabilities based on a number of risk components to arrive at required capital and comparing this requirement to available capital to assess capital adequacy. Certain of these risk components, along with available capital, are sensitive to changes in equity markets and interest rates as outlined in the Risk Management section of this MD&A.
As at December 31, 2017, Sun Life Assurance’s MCCSR ratio was 221%, compared to 226% as at December 31, 2016. For additional information, refer to section F. Financial Strength in this document.
The following table shows the components of Sun Life Assurance’s MCCSR ratio for the last two years.
Sun Life Assurance MCCSR
($ millions) 2017 2016
Capital available
Retained earnings and contributed surplus 12,503 11,871
Accumulated other comprehensive income 981 1,509
Common and preferred shares 5,946 5,946
Innovative capital instruments and subordinated debt 1,049 1,048
Other (2) 46
Less:
Goodwill 2,146 2,242
Non-life investments and other 2,329 2,225
Total capital available 16,002 15,953
Required capital
Asset default and market risks 3,991 4,109
Insurance risks 2,065 1,797
Interest rate risks 1,186 1,156
Total capital required 7,242 7,062
MCCSR ratio 221% 226%
Foreign Life Insurance Companies Foreign subsidiaries and foreign operations of SLF Inc. must comply with local capital or solvency requirements in the jurisdictions in which they operate. Our operations maintained capital levels above the minimum local regulatory requirements during 2017. Additional information on capital and regulatory requirements for our foreign subsidiaries and foreign operations is provided in SLF Inc.’s AIF under the heading Regulatory Matters.
44 Sun Life Financial Inc. Annual Report 2017 Management’s Discussion and Analysis

In the U.S., as at December 31, 2017, we have two internal reinsurance arrangements with affiliated reinsurance companies, in Delaware and Vermont, relating to our closed block of individual universal life insurance products with no-lapse guarantee benefits issued in the U.S. The Delaware reinsurance structure was established in 2013 and finances excess U.S. statutory reserves for certain universal life policies issued between January 2000 and February 2006. The financing of U.S. statutory reserve requirements in excess of those required under IFRS for the Delaware reinsurance company is supported by a guarantee from SLF Inc. The Vermont reinsurance structure was established in 2007 for certain policies issued between March 2006 and December 2008. Under the Vermont reinsurance structure, the related excess U.S. statutory reserve requirements are funded through a longterm financing arrangement established with an unrelated financial institution.
3. Shareholder Dividends
The declaration, amount and payment of dividends by SLF Inc. is subject to the approval of our Board of Directors and is dependent on our results of operations, our reported net income, financial condition, cash requirements and contractual restrictions. Capital management activities, as well as regulatory considerations and macro-economic factors including the economic outlook for the jurisdictions in which we do business, are also considered along with other factors. The Board of Directors reviews the level of dividends on a quarterly basis.
A regular and appropriate level of dividend payout and growth provides a stable source of return to common shareholders.
We target a dividend payout ratio of between 40% and 50% based on underlying net income, except where circumstances and the factors noted above would suggest a different ratio.
During 2017, our dividend payout ratio to common shareholders based on our reported net income was 50% and on an underlying net income basis was 42%.
SLF Inc. increased its common shareholders’ dividend for the fourth quarter of 2017 to $0.455. Total common shareholder dividends declared in 2017 were $1.745 per share, compared to $1.620 in 2016.
Dividends declared Amount per share 2017 2016 2015
Common shares 1.745 1.62 1.51
Class A preferred shares
Series 1 1.187500 1.187500 1.187500
Series 2 1.200000 1.200000 1.200000
Series 3 1.112500 1.112500 1.112500
Series 4 1.112500 1.112500 1.112500
Series 5 1.125000 1.125000 1.125000
Series 8R(1)(2) 0.568800 0.568800 0.828100
Series 9QR(3) 0.493900 0.476000 0.243300
Series 10R(1)(4) 0.710500 0.908900 0.975000
Series 11QR(5) 0.683900 0.169000 —
Series 12R(1)(6) 0.951500 1.062500 1.062500
(1) On the redemption date and every five years thereafter, the dividend rate will reset to an annual rate equal to the 5-year Government of Canada bond yield plus a yield specified for each series. The specified yield for Class A shares is: Series 8R - 1.41%, Series 10R - 2.17% and Series 12R - 2.73%. On the earliest redemption date and every five years thereafter, holders will have the right, at their option, to convert their shares into the series that is one number higher than their existing series.
(2) The dividend rate was reset on June 30, 2015 to a fixed annual dividend rate of 2.275% until the redemption date June 30, 2020. (3) Holders of the Series 9QR Shares are entitled to receive quarterly floating rate non-cumulative dividends at an annual rate equal to the then 3-month Government of Canada
treasury bill yield plus 1.41%. Holders of the Series 9QR Shares will have the right, at their option, to convert their Series 9QR Shares into Series 8R Shares on June 30, 2020 and on June 30 every five years thereafter.
(4) The dividend rate was reset on September 30, 2016 to a fixed annual dividend rate of 2.842% until the redemption date September 30, 2021. (5) Holders of the Series 11QR Shares are entitled to receive quarterly floating rate non-cumulative dividends at an annual rate equal to the then 3-month Government of
Canada treasury bill yield plus 2.17%. Holders of the Series 11QR Shares will have the right, at their option, to convert their Series 11QR Shares into Series 10R Shares on September 30, 2021 and on September 30 every five years thereafter.
(6) The dividend rate was reset on December 31, 2016 to a fixed annual dividend rate of 3.806% until the redemption date December 31, 2021.
4. Principal Sources and Uses of Funds
Our primary source of funds is cash provided by operating activities, including premiums, investment management fees and net investment income. These funds are used primarily to pay policy benefits, dividends to policyholders, claims, commissions, operating expenses, interest expenses and shareholder dividends. Excess cash flows generated from operating activities are generally invested to support future payment requirements. We also raise funds from time to time, through borrowing and issuing of securities, to finance growth, acquisitions or other needs.
As at December 31, 2017, we maintained net cash, cash equivalents and short-term securities totaling $8.8 billion. In addition to providing for near-term funding commitments, cash, cash equivalents and short-term securities include amounts that support short-term payment obligations.
Net cash, cash equivalents and short-term securities increased $297 million in 2017. Cash flows generated by operating activities were $1,984 million in 2017, compared to $3,668 million in 2016. Cash used in financing activities in 2017 increased by
Management’s Discussion and Analysis Sun Life Financial Inc. Annual Report 2017 45

$476 million from 2016. Investing activities decreased cash by $339 million during 2017, compared to $1,893 million in 2016 due to the acquisition of U.S. employee benefits business in 2016. The strengthening of the Canadian dollar against foreign currencies decreased cash balances by $179 million in 2017, compared to $235 million in 2016.
($ millions) 2017 2016
Net cash provided by operating activities 1,984 3,668
Net cash provided by (used in) investing activities (339) (1,893)
Net cash provided by (used in) financing activities (2,019) (1,543)
Changes due to fluctuations in exchange rates (179) (235)
Increase (decrease) in cash and cash equivalents (553) (3)
Net cash and cash equivalents, beginning of year 6,509 6,512
Net cash and cash equivalents, end of year 5,956 6,509
Short-term securities, end of year 2,794 1,944
Net cash, cash equivalents and short-term securities, end of year 8,750 8,453
5. Liquidity
We generally maintain an overall asset liquidity profile that exceeds requirements to fund insurance contract liabilities under prescribed adverse liability demand scenarios. To strengthen our liquidity further, we actively manage and monitor our: • capital levels • asset levels • matching position • diversification and credit quality of investments • cash forecasts and actual amounts against established targets
We are subject to various regulations in the jurisdictions in which we operate. The ability of SLF Inc.’s subsidiaries to pay dividends and transfer funds is regulated in certain jurisdictions and may require local regulatory approvals and the satisfaction of specific conditions in certain circumstances. Through effective cash management and capital planning, SLF Inc. ensures that its subsidiaries, as a whole and on a stand-alone basis, are properly funded and maintain adequate liquidity to meet obligations, both individually and in aggregate.
The legal entity, SLF Inc. (the ultimate parent company) and its wholly-owned holding companies had $2,019 million in cash and other liquid assets as at December 31, 2017. See section F - Financial Strength for more information.
We maintain various credit facilities for general corporate purposes, as set out in the table below. Unless otherwise noted, all amounts are in Canadian dollars.
($ millions) December 31, 2017 December 31, 2016
Credit Facility Amount Utilized Expiry Amount Utilized Expiry
Committed US $400 US $ 1 2021 US $500 US $ 77 2018
Uncommitted US $100 US $74 n/a n/a n/a n/a
Uncommitted $225 $93 n/a $205 $101 n/a
Uncommitted US $ 25 US $12 n/a US $ 25 US $ 12 n/a
The agreement relating to our committed credit facility contains typical covenants for investment grade companies regarding solvency, credit ratings and financial strength, all of which were met as at December 31, 2017. These covenants include, but are not limited to, the maintenance of total equity by SLF Inc. of at least $12 billion, tested as of the last day of each fiscal quarter. SLF Inc.’s total equity was $23.0 billion as at December 31, 2017.
Our failure to comply with the covenants under the committed credit facility would, subject to grace periods in the case of certain covenants, result in an event of default. This could require us to repay any outstanding borrowings or to cash collateralize letters of credit under the facility. A failure by SLF Inc. (or any of its subsidiaries) to pay an obligation due for an amount exceeding $250 million would also result in an event of default under the committed credit facility described above.
Based on our historical cash flows and liquidity management processes, we believe that the cash flows from our operating activities will continue to provide sufficient liquidity for us to satisfy debt service obligations and to pay other expenses as they fall due.
46 Sun Life Financial Inc. Annual Report 2017 Management’s Discussion and Analysis

J. Risk Management
1. Risk Management Framework The Company has an established Risk Management Framework (“Risk Framework”) approved by the Board of Directors that prescribes a comprehensive set of protocols and programs that need to be followed in conducting business activities. The risks that arise when providing products and services to Clients, which are in line with our purpose to help our Clients achieve lifetime financial security and live healthier lives, are managed within these protocols and programs. Effective risk management is critical to the overall profitability, competitive market positioning and long-term financial viability of the Company. While all risk cannot necessarily be eliminated, the Risk Framework seeks to ensure that risks to a business undertaking are appropriately managed to achieve the Company’s business objectives over time and are not expected to exceed pre-established boundaries for risk taking. The Risk Framework, corporate strategy, and business objectives, are all aligned and risk management protocols and programs are embedded within every business segment.
Risk Management Framework
Ind
epen
den
t Assu
rance b
y Intern
al Au
dit
or E
xternal In
dep
end
ent R
eviews
Bu
sin
ess
Pla
n a
nd
Str
ateg
y
Risk Culture and Philosophy
Operational
Risk
Liquidity Risk
Insurance
Risk
Credit
Risk
Business &
Strategic Risk
Market
Risk
Report
Risks Identify Risks
Measu
reR
isks
ManageRisks
Mon
itor
Ris
ks
Ris
kApp
etite
Risk Governance
Mo
nito
rR
isks
Manage Risks
Mea
sure
Ris
ks
Risk
Managem
ent Policies Risk Univ
erse
2. Risk Universe As a large financial services organization operating in a complex industry, the Company encounters a variety of risks. We are subject to financial and insurance risks that are connected to our liabilities and also in connection with the management and performance of our assets, including how we match returns from assets with the payment of liabilities to our Clients. We also face risks in formulating our business strategy and business objectives, in carrying on our business activities in the pursuit of our strategy and objectives, and from external factors such as changes in the economic, political, competitive and regulatory environments. The Risk Framework covers all risks and these have been grouped into six major categories: credit, market, insurance, business and strategic, operational and liquidity risks. The Risk Framework sets out the key risk management processes in the areas of risk: appetite, identification, measurement, management, monitoring and reporting. The Risk Framework sets out both qualitative and quantitative measures and processes to control the risk the Company will bear in respect of each of these categories of risk and in aggregate.
3. Risk Culture and Philosophy Our Risk Framework recognizes the importance of risk culture in the effective management of the Company’s risks. Risk culture relates to how we behave and respond, in addition to the requirements we set. It enables and rewards taking the right risks in an informed manner. It facilitates effective challenge and being transparent about risks and outcomes without fear of reprisal. It drives us to understand Client needs and preferences so that we can act in their best interests. Our risk culture is supported by a strong tone from the top which emanates from the Board of Directors and cascades through the Board Committees, our Chief Executive Officer (“CEO”) and other executive officers, management and staff. A key premise of our risk management culture is that all employees have an important role to play in managing the Company’s risks. In order to support employees in fulfilling their role, we have taken action to ensure our risk protocols and procedures are well defined and embedded in our day-to-day business activities, assess that appropriate resources and training are provided, establish and communicate a common risk philosophy and a high bar for integrity and conduct, and encourage every employee to openly identify risk exposures and communicate escalating risk concerns. The following six elements are foundational to our risk culture: • Establishing tone from the top
Management’s Discussion and Analysis Sun Life Financial Inc. Annual Report 2017 47

• Encouraging transparency in risk-taking • Performing effective challenge in conducting business decisions • Aligning incentives and risk management practices • Effectively communicating the risk culture expectations • Establishing clear accountabilities
Our risk management program is embedded in the Company’s culture, which encourages ownership and responsibility for risk management at all levels. Our compensation programs are aligned to the organization’s risk management practices through our governance structure for the design and approval of incentive compensation plans and processes used to support the alignment of compensation and risk management. We continuously reinforce and embed the culture through communication and training on the risk culture elements at various forums and across various levels through training on the code of conduct annually, reinforcing accountability through performance reviews and compensation, and through defining roles, responsibilities and expectations in the risk management policies.
The Risk Framework sets out the Company’s risk philosophy and includes the following core principles.
Strategic Alignment Our corporate strategy and business objectives are required to be established within the boundaries set out in the Risk Framework and the Risk Appetite Policy. This requires us to consider whether a business activity will result in a risk profile that we are willing to accept and which we are prepared to manage. We have established a range of explicit risk appetite limits and control points for credit, market, insurance, operational and liquidity risks. Business and strategic risk is managed through our strategic and business planning process and controls over the implementation of these strategic and business plans. Risks associated with activities outside our risk appetite or outside the acceptable defined risks are avoided.
Stakeholder Interests Our Risk Appetite Policy considers the interests of a large number of key stakeholders, including policyholders, shareholders, debt-holders, employees, regulators, distributors, rating agencies and other capital markets participants. The Policy describes how to balance the needs, expectations, risk and reward perspectives, and investment horizons of these different stakeholders.
Effective risk management requires that objectives and incentives be aligned to ensure management’s decisions are aligned with the Company’s risk philosophy and risk appetite. To ensure this, the business plans and strategies are independently tested to ensure that they operate within the boundaries and requirements set out in the Risk Framework and the Risk Appetite Policy, and the results of this testing are reported to the Board of Directors. Compensation programs for employees are approved by the Board of Directors and the Board Committees and are aligned with the Company’s risk philosophy, values, business and risk management strategies, and the long-term interests of stakeholders. In establishing annual performance objectives, we consider risk management goals to ensure that business decisions are consistent with the desired risk and return profile of the Company.
Capability Alignment We seek out profitable risk-taking opportunities in those areas where we have established risk management skills and capabilities. Conversely, we endeavour to avoid or transfer risks that are beyond our risk-taking capability. Our ability to measure and evaluate risks, the quality of our risk governance and control environment, the depth and quality of our risk responses and the robustness of our pricing strategies are particularly important capabilities that we assess.
Portfolio Perspective In evaluating a particular risk, consideration is given to a portfolio perspective of risk and return including the explicit recognition of the impacts of diversification and concentration and how different risks interact with each other. This perspective is extended to the development of risk mitigation and pricing strategies, recognizing that often the most cost-effective way of managing risk involves utilizing available relationships already inherent in our business.
Risk-Adjusted Returns The financial return metrics which are used to assess business activities are required to be risk-adjusted. Financial return metrics are developed in consideration of the constraints set out in the Risk Appetite Policy, and reflect the expected costs of mitigation and the cost of risk capital required to support the risk taking activity.
4. Risk Appetite Our Risk Appetite Policy defines the amount and type of risk we are willing to accept in pursuit of our business objectives, and is approved by the Board of Directors. It is forward-looking and our strategic plan, capital plan, business plan and business objectives are established within its boundaries.
The Company’s risk appetite seeks to balance the various needs, expectations, risk and reward perspectives and investment horizons of key stakeholders. In particular, our risk appetite supports the pursuit of shareholder value while ensuring that the Company’s ability to pay claims and fulfill policyholder commitments is not compromised.
The Company’s risk appetite is the primary mechanism to communicate its risk philosophy and the boundaries of permissible risk-taking across the enterprise. It ensures that business activities are assessed against performance criteria that are appropriately risk-adjusted. Our risk appetite supports the objective of maintaining adequate capital, managing return on equity, managing earnings volatility, managing long-term profitability and managing liquidity. To accomplish this, our risk appetite includes a wide array of qualitative and quantitative standards that reflect the Company’s overall risk management principles and values.
We generally accept diversifiable risks and utilize risk pooling to create portfolios with relatively low liability volatility. We take risk where we have internal expertise such as actuarial, underwriting, claims management, investment and distribution or where
48 Sun Life Financial Inc. Annual Report 2017 Management’s Discussion and Analysis

reinsurance partners are able to supplement our internal expertise. We prefer risks where it is possible to diversify across various segments including products, geographies, distribution channels or asset classes in order to maximize diversification opportunities.
Our Risk Appetite Policy sets out specific constraints which define the aggregate level of risk that the Company is willing to accept. We translate our risk appetite constraints into specific risk limits by risk class and business segment. Our risk profile is measured, managed and monitored regularly to ensure that we operate within our risk appetite. Our risk appetite limits are reviewed periodically to reflect the risks and opportunities inherent in our evolving business strategies and operating environment.
5. Risk Governance Our Risk Framework sets out lines of responsibility and authority for risk-taking, governance and control. These governance requirements are summarized below.
Board of Directors
Risk & Conduct Review
Committee
Management Resources Committee
Governance Nomination
& Investment Committee
Audit Committee
Board Committees
Investment & Credit Risk Committee
Operational Risk & Compliance
Committee
Corporate Asset Liability Management Committee
Insurance Risk Committee
Executive Risk Committee
Senior Management Committees
Board of Directors Our Board of Directors is ultimately responsible for ensuring the oversight of all risks across the enterprise and has primary responsibility for taking action to ensure risk management policies, programs and practices are in place. By approving our Risk Framework and the Risk Appetite Policy, and providing ongoing oversight of the risk management programs, the Board of Directors monitors that the principal risks are appropriately identified and managed. The Board of Directors oversees business and strategic risk through review and approval of the business and strategic plans, and regularly discusses key themes, issues and risks emerging in connection with the design or implementation of these plans.
The Risk & Conduct Review Committee is a standing committee of the Board whose primary functions are to assist the Board of Directors with oversight of the management of risk enterprise-wide, and of the risk management function to ensure that management has in place policies, processes and controls designed to identify and effectively manage the significant risks to which the Company is exposed and has sufficient capital to underpin those risks. The committee regularly monitors that the risk profile is within the agreed risk appetite of the Company and that the Company’s capital position is in compliance with regulatory capital requirements, and recommends to the Board for approval, and monitors, the specific risk limits allocated to the businesses and the annual Capital Plan. The Committee meets with senior business and functional leaders who have first-hand knowledge of risks and the risk management programs, oversees the effectiveness of the risk management function, and obtains reports from internal audit on the effectiveness of risk controls within the business and risk function. The committee also oversees risk management activities of our subsidiaries and risk posed to the Company through its joint venture arrangements. It reviews and approves all risk management policies and reviews compliance with those policies. In addition, where the Board has allocated oversight of specific risk management programs to other Board committees, the Risk & Conduct Review Committee is tasked with providing the Board with an integrated view of oversight of all risk management programs across all Board committees. The committee also oversees compliance with legal and regulatory requirements and the identification and management of compliance risk.
The Governance, Nomination & Investment Committee is responsible for assisting the Board of Directors in reviewing and monitoring the Company’s Investment Plan and investment performance, overseeing investment practices, procedures and controls related to the management of the general fund investment portfolio and the Company’s asset management businesses, and reviewing and approving transactions, either separately or jointly with the Risk & Conduct Review Committee, where the acquisition of individual investments for the General Account would, on their own, exceed certain limits or ranges in the Investment and Credit Risk Management Policy. In addition, the Committee is also responsible for developing effective corporate governance
Management’s Discussion and Analysis Sun Life Financial Inc. Annual Report 2017 49

guidelines and processes including policies and processes to sustain ethical behaviour, and developing processes to assess the effectiveness of the Board and its Committees.
The Audit Committee is responsible for assisting the Board of Directors in overseeing the integrity of financial statements and related information provided to shareholders and others, compliance with financial regulatory requirements, adequacy and effectiveness of the internal controls implemented and maintained by management, and assessing the qualifications, independence and performance of the external auditor.
The Management Resources Committee is responsible for assisting the Board of Directors in ensuring we have the leadership resources for succession of senior executive positions and programs to effectively attract, retain, develop and reward executives for achieving our strategic objectives. The Management Resources Committee reviews the design, approval and governance of material incentive programs to align business objectives and incentives to ensure that these incentive programs do not encourage excessive risk taking, and reviews the implications of key enterprise risks, including human resources risks, on compensation design and human resources practices. In addition, the Management Resources Committee reviews and makes recommendations to the Board with respect to compensation matters, including the remuneration of executives who have a material impact on the risk exposure of the company.
Senior Management Committees The Executive Risk Committee (ERC) provides executive management oversight of the Company’s enterprise risk management activities. This includes the review and articulation of the risk appetite, review that the risk profile is within the agreed risk appetite, and review that there are policies, processes and controls in place to identify and effectively manage the significant risks, in accordance with the risk appetite and overall objective of promoting a balanced business and product model that will achieve agreed upon risk-adjusted returns and allocate capital accordingly.
The Investment & Credit Risk Committee is responsible for reviewing matters related to the management of the Company’s general fund assets which includes providing oversight and direction on the current and potential credit and investment risk exposures facing the Company and mitigating strategies to ensure that effective credit risk management practices and controls are in place.
The Corporate Asset Liability Management Committee is responsible for providing executive oversight and direction for the effective measurement, control and management of the market and liquidity risks in the design and operation of general fund investment strategies for efficiently discharging the Company’s general fund liabilities.
The Operational Risk & Compliance Committee is responsible for providing oversight of the Company’s operational and compliance risk management practices, current and emerging operational risk exposures, and the processes to ensure ongoing identification of major operational and compliance risks facing the Company.
The Insurance Risk Committee is responsible for providing oversight and direction on insurance risk exposures facing the Company and to ensure that effective insurance risk management practices and controls are in place.
Accountabilities Primary accountability for risk management is delegated by the Board of Directors to our CEO, and the CEO further delegates responsibilities throughout the Company through management authorities and responsibilities. The CEO delegates accountability for risk management to our executive officers, who are accountable for ensuring the management of risk in the scope of their business accountability is in accordance with the Board-approved Risk Framework, Risk Appetite Policy and risk management policies.
We have adopted the three lines of defence model to provide a consistent, transparent and clearly documented allocation of accountability and segregation of functional responsibilities. This segregation of responsibility helps to establish a robust control framework that promotes transparent and independent challenge of all risk taking activities, and encourages that all functions engage in self-critical examination to foster continuous improvement of the management of risk in our business.
The first line of defence is represented by business segment management who own the risks that are intrinsic to the business and have the primary responsibility to identify, measure, manage, monitor and report these risks.
The second line of defence includes the Chief Risk Officer (“CRO”) and various functional heads who are responsible for providing independent oversight of our Company-wide risk management programs. The CRO is responsible for developing our Risk Framework and Risk Appetite Policy, and for overseeing the development and implementation of risk management strategies aimed at optimizing the risk-return profile of the Company. The CRO is supported by a network of business segment risk officers. The functional heads support the CRO in the implementation and communication of our Risk Framework and Risk Appetite Policy.
The Internal Audit function is the third line of defence and is responsible for providing independent assurance to the Audit Committee on whether all significant risks are identified and appropriately reported to the Board Committees and executive officers, and assessing whether these risks are effectively controlled. Additionally, the Risk & Conduct Review Committee may engage third-party independent reviews to supplement the third line of defence review of the effectiveness of the Company’s risk management programs.
6. Risk Management Policies In order to support the effective communication, implementation and governance of our Risk Framework, we have codified our processes and operational requirements in a comprehensive series of risk management policies and operating guidelines. These policies and guidelines promote the application of a consistent approach to managing risk exposures across our global business platform. The Board of Directors and Board Committees regularly review and approve significant changes to the risk management policies and also regularly review management’s reporting and attestation on compliance to these policies.
50 Sun Life Financial Inc. Annual Report 2017 Management’s Discussion and Analysis

7. Risk Management Process
The risk management process as set out in our Risk Framework is described below:
Risk Identification and Measurement All business segments employ a common approach to identify and measure risks. Business segments have accountability for identifying and managing risks facing their business. We have a process to identify and monitor emerging risks that may have a material impact on our finances, operations or reputation. We evaluate potential correlations between various risk events and categories, and monitor emerging risks, regulatory and rating agency requirements, and industry developments.
Risk measurement involves determining and evaluating potential risk exposures, and includes a number of techniques such as monitoring key risk indicators, assessing probability and severity of risks, and conducting stress testing.
A robust stress testing program is an essential component of the Company’s Risk Framework used to measure, monitor and mitigate the Company’s risk exposures and ensure ongoing capital adequacy under plausible stress events. Stress testing is performed on key metrics such as earnings, regulatory capital ratios and liquidity to identify and monitor potential vulnerabilities to key risk drivers and ensure that the Company is operating within its risk appetite.
We develop and test a range of scenarios based on our internal assessment and regulatory guidance. Sensitivity testing is conducted on a regular basis and measures the earnings and regulatory capital impact from changes in underlying risk factors. Sensitivity testing is performed for individual risks and for consolidated risk exposures at different levels of stress and at various levels of aggregation. Scenario testing involves changes to a number of risk factors to assess the impact of and interaction between these risk factors. These scenarios include integrated scenario testing, reverse scenario testing and key assumption sensitivity testing. We also use the Dynamic Capital Adequacy Testing (“DCAT”) process, as required by our regulator, to project income and capital for a five-year period under plausible adverse scenarios.
Risk Management, Monitoring and Reporting Risk management decisions are formed by evaluating how well the outcomes of the risk measurements and risk assessments for a business activity conform to our risk appetite, including an assessment of risk-adjusted return.
Monitoring processes include oversight by the Board of Directors, which is exercised through Board Committees and senior management committees described in the section of this MD&A under the heading Risk Governance.
Senior management committees, Board Committees and the Board of Directors regularly review reports that summarize our risk profile, including the exposures across our principal risks including any changes in risk trends and emerging risks. These committees also review the effectiveness of the mitigation strategies presented in the reports. On a regular basis, the Board of Directors and the Board Committees review and approve any significant changes to key policies for the management of risk and review compliance with these policies.
8. Risk Categories
methodologies for managing these risks. The shaded text and tables represent an integral part of our audited annual Consolidated Financial
considered carefully together with other information in this MD&A and in our 2017 AIF, our 2017 Consolidated Financial Statements and other reports and materials that we file with securities regulators.
The shaded text and tables in the following section of this MD&A represent our disclosure on credit, market and liquidity risks in accordance with IFRS 7 Financial Instruments - Disclosures and includes a discussion on how we measure risk and our objectives, policies and
Statements for the year ended December 31, 2017. The shading in this section does not imply that these disclosures are of any greater importance than non-shaded tables and text, and the Risk Management disclosure should be read in its entirety. This information should be
In this section, segregated funds include segregated fund guarantees, variable annuities and investment products, and includes Run-off reinsurance in our Corporate business segment.
Our Risk Framework has grouped all risks into six major risk categories: credit, market, insurance, business and strategic, operational and liquidity risks.
i. Credit Risk
Risk Description Credit risk is the possibility of loss from amounts owed by our borrowers or financial counterparties. We are subject to credit risk in connection with issuers of securities held in our investment portfolio, debtors, structured securities, reinsurers, counterparties (including derivative, repurchase agreement and securities lending counterparties), other financial institutions and other entities. Losses may occur when a counterparty fails to make timely payments pursuant to the terms of the underlying contractual arrangement or when the counterparty’s credit rating or risk profile otherwise deteriorates. Credit risk can also arise in connection with deterioration in the value of, or ability to realize, any underlying security that may be used as collateral for the debt obligation. Credit risk can occur as a result of broad economic conditions, challenges within specific sectors of the economy, or from issues affecting individual companies. Events that result in defaults, impairments or downgrades of the securities in our investment portfolio would cause the Company to record realized or unrealized losses and may cause an increase in our provisions for asset default, adversely impacting earnings.
Management’s Discussion and Analysis Sun Life Financial Inc. Annual Report 2017 51
Credit Risk Management Governance and Control We employ a wide range of credit risk management practices and controls, as outlined below: • Credit risk governance practices are in place, including independent monitoring and review and reporting to senior management
and the Risk & Conduct Review Committee. • Risk appetite limits have been established for credit risk. • Income and regulatory capital sensitivities are monitored, managed and reported against pre-established risk limits. • Comprehensive Investment and Credit Risk Management Policy, guidelines and practices are in place. • Specific investment diversification requirements are in place, such as defined investment limits for asset class, geography, and
industry. • Risk-based credit portfolio, counterparty, and sector exposure limits have been established. • Mandatory use of credit quality ratings for portfolio investments has been established and is reviewed regularly. These internal
rating decisions for new fixed income investments and ongoing review of existing rating decisions are independently adjudicated by corporate risk management.
• Comprehensive due diligence processes and ongoing credit analyses are conducted. • Regulatory solvency requirements include risk-based capital requirements and are monitored regularly. • Comprehensive compliance monitoring practices and procedures including reporting against pre-established investment limits
are in place. • Reinsurance exposures are monitored to ensure that no single reinsurer represents an undue level of credit risk. • Stress-testing techniques, such as DCAT, are used to measure the effects of large and sustained adverse credit developments. • Insurance contract liabilities are established in accordance with Canadian actuarial standards of practice. • Internal capital targets are established at an enterprise level to cover all risks and are above minimum regulatory and
supervisory levels. Actual capital levels are monitored to ensure they exceed internal targets.
Our core principles of credit risk management include asset diversification, fundamental research and analysis of cash flows, proactive and continuous risk monitoring, active management and relative value assessment, all with the objective of optimizing risk-adjusted returns, with due consideration for the impacts of capital and taxation.
We rate fixed income investments primarily through the use of internally developed scorecards which combine an estimated probability of default, and loss given default to determine an expected loss and credit risk rating. This rating is expressed using a 22-point scale that is generally consistent with those used by external rating agencies, and is based on detailed examination of the borrower’s, or issuer’s, credit quality and the characteristics of the specific instrument. The probability of default assessment is based on borrower-level or issuer-level analysis, which encompasses an assessment of industry risk, business strategy, competitiveness, strength of management and other financial information. The loss given default assessment is based on instrument-level analysis, which considers the impact of guarantees, covenants, liquidity and other structural features. These scorecards provide input to stochastic value-at-risk models and are used to stress test the portfolio, which provide insight into the distribution and characteristics of credit risk within our portfolios. In accordance with our policies and under normal circumstances, our ratings cannot be higher than the highest rating provided by certain Nationally Recognized Statistical Rating Organizations (“NRSROs”). Certain assets, including those in our sovereign debt and asset-backed securities portfolios, are assigned a rating based on ratings provided by NRSROs using a priority sequence order of Standard & Poor’s, Moody’s, Fitch and DBRS Limited.
Additional information on credit risk can be found in Note 6 to our 2017 Annual Consolidated Financial Statements and in the Risk Factors section in our AIF.
ii. Market Risk
Risk Description We are exposed to financial and capital market risk, which is defined as the risk that the fair value or future cash flows of an insurance contract or financial instrument will fluctuate because of changes or volatility in market prices. Market risk includes equity, interest rate and spread, real estate and foreign currency risks.
Market Risk Management Governance and Control We employ a wide range of market risk management practices and controls, as outlined below: • Market risk governance practices are in place, including independent monitoring and review and reporting to senior
management and the Risk & Conduct Review Committee. • Risk appetite limits have been established for equity, interest rate, real estate and foreign currency risks. • Income and regulatory capital sensitivities are monitored, managed and reported against pre-established risk limits. • Comprehensive asset-liability management and hedging policies, programs and practices are in place. • Regulatory solvency requirements include risk-based capital requirements and are monitored regularly. • Product Design and Pricing Policy requires a detailed risk assessment and pricing provisions for material risks. • Stress-testing techniques, such as DCAT, are used to measure the effects of large and sustained adverse market movements. • Insurance contract liabilities are established in accordance with Canadian actuarial standards of practice. • Internal capital targets are established at an enterprise level to cover all risks and are above minimum regulatory and
supervisory levels. Actual capital levels are monitored to ensure they exceed internal targets.
Specific market risks and our risk management strategies are discussed below in further detail.
Equity Risk Equity risk is the potential for financial loss arising from declines or volatility in equity market prices. We are exposed to equity risk from a number of sources. A portion of our exposure to equity risk arises in connection with benefit guarantees on segregated fund contracts. These benefit guarantees may be triggered upon death, maturity, withdrawal or annuitization. The cost of providing for
52 Sun Life Financial Inc. Annual Report 2017 Management’s Discussion and Analysis

these guarantees is uncertain, and will depend upon a number of factors including general capital market conditions, underlying fund performance, policyholder behaviour, and mortality experience, which may result in negative impacts on our net income and capital.
We generate revenue in our asset management businesses and from certain insurance and annuity contracts where fees are levied on account balances that are affected directly by equity market levels. Accordingly, we have further exposure to equity risk as adverse fluctuations in the market value of such assets will result in corresponding adverse impacts on our revenue and net income. In addition, declining and volatile equity markets may have a negative impact on sales and redemptions (surrenders) in these businesses, and this may result in further adverse impacts on our net income and financial position.
We also have direct exposure to equity markets from the investments supporting other general account liabilities, surplus, and employee benefit plans. These exposures fall within our risk-taking philosophy and appetite, and are therefore generally not hedged.
Interest Rate and Spread Risk Interest rate and spread risk is the potential for financial loss arising from changes or volatility in interest rates or spreads when asset cash flows and the policy obligations they support are not matched. This may result in the need to either sell assets to meet policy payments and expenses or reinvest excess asset cash flows in unfavourable interest rate or spread environments. The impact of changes or volatility in interest rates or spreads is reflected in the valuation of our financial assets and liabilities for insurance contracts.
Our primary exposure to interest rate and spread risk arises from certain general account products and segregated fund contracts which contain explicit or implicit investment guarantees in the form of minimum crediting rates, guaranteed premium rates, settlement options and benefit guarantees. If investment returns fall below guaranteed levels, we may be required to increase liabilities or capital in respect of these contracts. The guarantees attached to these products may be applicable to both past premiums collected and future premiums not yet received. Segregated fund contracts provide benefit guarantees that are linked to underlying fund performance and may be triggered upon death, maturity, withdrawal or annuitization. These products are included in our asset-liability management program and the residual interest rate exposure is managed within our risk appetite limits.
Declines in interest rates or narrowing spreads can result in compression of the net spread between interest earned on investments and interest credited to policyholders. Declines in interest rates or narrowing spreads may also result in increased asset calls, mortgage prepayments and net reinvestment of positive cash flows at lower yields, and therefore adversely impact our profitability and financial position. Negative interest rates may additionally result in losses on our cash deposits and low or negative returns on our fixed income assets impacting our profitability. In contrast, increases in interest rates or a widening of spreads may have a material impact on the value of fixed income assets, resulting in depressed market values, and may lead to losses in the event of the liquidation of assets prior to maturity.
Significant changes or volatility in interest rates or spreads could have a negative impact on sales of certain insurance and annuity products, and adversely impact the expected pattern of redemptions (surrenders) on existing policies. Increases in interest rates or widening spreads may increase the risk that policyholders will surrender their contracts, potentially forcing us to liquidate assets at a loss and accelerate recognition of certain acquisition expenses. While we have established hedging programs in place and our insurance and annuity products often contain surrender mitigation features, these may not be sufficient to fully offset the adverse impact of the underlying losses.
We also have direct exposure to interest rates and spreads from investments supporting other general account liabilities, surplus and employee benefit plans. Lower interest rates or a narrowing of spreads will result in reduced investment income on new fixed income asset purchases. Conversely, higher interest rates or wider spreads will reduce the value of our existing assets. These exposures fall within our risk-taking philosophy and appetite and are therefore generally not hedged.
A sustained low interest rate environment may adversely impact our earnings, regulatory capital requirements and our ability to implement our business strategy and plans in several ways, including: • Lower sales of certain insurance and wealth products, which can in turn pressure our operating expense levels; • Shifts in the expected pattern of redemptions (surrenders) on existing policies; • Higher hedging costs; • Higher new business strain reflecting lower new business profitability; • Reduced return on new fixed income asset purchases; • The impact of changes in actuarial assumptions; • Impairment of goodwill; and • Additional valuation allowances against our deferred tax assets.
Market Risk Sensitivities We utilize a variety of methods and measures to quantify our market risk exposures. These include duration management, key rate duration techniques, convexity measures, cash flow gap analysis, scenario testing, and sensitivity testing of earnings and regulatory capital ratios versus risk appetite limits which are calibrated to our risk appetite.
Our net income(1) is affected by the determination of policyholder obligations under our annuity and insurance contracts. These amounts are determined using internal valuation models and are recorded in our Annual Consolidated Financial Statements, primarily as Insurance contract liabilities. The determination of these obligations requires management to make assumptions about the future level of equity market performance, interest rates, credit and swap spreads and other factors over the life of our products. Differences between our actual experience and our best estimate assumptions are reflected in our Annual Consolidated Financial Statements. Refer to Additional Cautionary Language and Key Assumptions Related to Sensitivities in this section for important additional information regarding these estimates.
(1) Net income refers to common shareholders’ net income in section J - Risk Management in this document.
Management’s Discussion and Analysis Sun Life Financial Inc. Annual Report 2017 53

The market value of our investments in fixed income and equity securities fluctuates based on movements in interest rates and equity markets. The market value of fixed income assets designated as AFS that are held primarily in our surplus segment increases with declining interest rates and decreases with rising interest rates. The market value of equities designated as AFS and held primarily in our surplus segment increases (decreases) with rising (declining) equity markets. Changes in the market value of AFS assets flow through OCI and are only recognized in net income when realized upon sale, or when considered impaired. The amount of realized gains (losses) recorded in net income in any period is equal to the unrealized gains (losses) or OCI position at the start of the period plus the change in market value during the current period up to the point of sale for those securities that were sold during the period. The sale or impairment of AFS assets held in surplus can therefore have the effect of modifying our net income sensitivity.
We realized $41 million (pre-tax) in net gains on the sale of AFS assets during the fourth quarter of 2017 and $195 million in 2017 ($41 million pre-tax in the fourth quarter of 2016, and $223 million in 2016). The net unrealized gains or OCI position on AFS fixed income and equity assets were $171 million and $175 million, respectively, after-tax as at December 31, 2017 ($86 million and $125 million, respectively, after-tax as at December 31, 2016).
The following table sets out the estimated immediate impact on, or sensitivity of our net income and OCI, and Sun Life Assurance’s MCCSR ratio to certain instantaneous changes in interest rates and equity market prices as at December 31, 2017 and December 31, 2016.
Interest Rate and Equity Market Sensitivities As at December 31, 2017(1) ($ millions, unless otherwise noted)
100 basis point 50 basis point 50 basis point 100 basis point Interest rate sensitivity(2)(6) decrease decrease increase increase
Potential impact on net income(3)(6) $ (250) $ (100) $ 50 $ 100 Potential impact on OCI $ 550 $ 250 $ (250) $ (550)
9% points 4% points 4% points 7% points Potential impact on MCCSR(4) decrease decrease increase increase
Equity markets sensitivity(5) 25% decrease 10% decrease 10% increase 25% increase Potential impact on net income(3) $ (300) $ (100) $ 100 $ 300 Potential impact on OCI $ (200) $ (50) $ 50 $ 200
4% points 1% points 2% points 3% points Potential impact on MCCSR(4) decrease decrease increase increase
As at December 31, 2016(1)
($ millions, unless otherwise noted)
100 basis point 50 basis point 50 basis point 100 basis point Interest rate sensitivity(2)(6) decrease decrease increase increase
Potential impact on net income(3)(6) $ (200) $ (100) $ 50 $ 50
Potential impact on OCI $ 550 $ 250 $ (250) $ (500)
8% points 3% points 4% points 7% points Potential impact on MCCSR(4) decrease decrease increase increase
Equity markets sensitivity(5) 25% decrease 10% decrease 10% increase 25% increase
Potential impact on net income(3) $ (300) $ (100) $ 100 $ 250
Potential impact on OCI $ (150) $ (50) $ 50 $ 150
3% points 1% points 2% points 4% points Potential impact on MCCSR(4) decrease decrease increase increase
(1) Net income and OCI sensitivities have been rounded to the nearest $50 million. The sensitivities exclude the market impacts on the income from our joint ventures and associates, which we account for on an equity basis.
(2) Interest rate sensitivities assume a parallel shift in assumed interest rates across the entire yield curve as at December 31, 2017 and December 31, 2016, with no change to the ASB promulgated Ultimate Reinvestment Rate (“URR”). Variations in realized yields based on factors such as different terms to maturity and geographies may result in realized sensitivities being significantly different from those illustrated above. Sensitivities include the impact of re-balancing interest rate hedges for dynamic hedging programs at 10 basis point intervals (for 50 basis point changes in interest rates) and at 20 basis point intervals (for 100 basis point changes in interest rates).
(3) The market risk sensitivities include the estimated mitigation impact of our hedging programs in effect as at December 31, 2017 and December 31, 2016, and include new business added and product changes implemented prior to such dates.
(4) The MCCSR sensitivities illustrate the impact on Sun Life Assurance as at December 31, 2017 and December 31, 2016. This excludes the impact on assets and liabilities that are in SLF Inc. but not included in Sun Life Assurance.
(5) Represents the respective change across all equity markets as at December 31, 2017 and December 31, 2016. Assumes that actual equity exposures consistently and precisely track the broader equity markets. Since in actual practice equity-related exposures generally differ from broad market indices (due to the impact of active management, basis risk and other factors), realized sensitivities may differ significantly from those illustrated above. Sensitivities include the impact of re-balancing equity hedges for dynamic hedging programs at 2% intervals (for 10% changes in equity markets) and at 5% intervals (for 25% changes in equity markets).
(6) The majority of interest rate sensitivity, after hedging, is attributed to individual insurance products. We also have interest rate sensitivity, after hedging, from our fixed annuity and segregated funds products.
Our net income and MCCSR sensitivities to changes in interest rates and equity markets have changed since December 31, 2016. The increase in sensitivities is primarily the result of ACMA during 2017.
54 Sun Life Financial Inc. Annual Report 2017 Management’s Discussion and Analysis

The above sensitivities were determined using a 50 basis point change in interest rates and a 10% change in our equity markets because we believe that these market shocks were reasonably possible as at December 31, 2017. We have also disclosed the impact of a 100 basis point change in interest rates and a 25% change in equity markets to illustrate that significant changes in interest rates and equity market levels may result in other than proportionate impacts on our sensitivities at more significant market movements.
Credit Spread and Swap Spread Sensitivities We have estimated the immediate impact or sensitivity of our net income attributable to certain instantaneous changes in credit and swap spreads. The credit spread sensitivities reflect the impact of changes in credit spreads on our asset and liability valuations (including non-sovereign fixed income assets, provincial governments, corporate bonds, and other fixed income assets). The swap spread sensitivities reflect the impact of changes in swap spreads on swap-based derivative positions and liability valuations.
Credit Spread Sensitivities ($ millions, after-tax) Net income sensitivity(1)(2) 50 basis point decrease 50 basis point increase
December 31, 2017 (100) 100 December 31, 2016 (125) 125
(1) Sensitivities have been rounded to the nearest $25 million. (2) In most instances, credit spreads are assumed to revert to long-term insurance contract liability assumptions generally over a five-year period.
Swap Spread Sensitivities ($ millions, after-tax) Net income sensitivity(1) 20 basis point decrease 20 basis point increase
December 31, 2017 25 (25) December 31, 2016 25 (25)
(1) Sensitivities have been rounded to the nearest $25 million.
The credit and swap spread sensitivities assume a parallel shift in the indicated spreads across the entire term structure. Variations in realized spread changes based on different terms to maturity, geographies, asset classes and derivative types, underlying interest rate movements, and ratings may result in realized sensitivities being significantly different from those provided above. The credit spread sensitivity estimates exclude any credit spread impact that may arise in connection with asset positions held in segregated funds. Spread sensitivities are provided for the consolidated entity and may not be proportional across all reporting segments. Refer to Additional Cautionary Language and Key Assumptions Related to Sensitivities in this section for important additional information regarding these estimates.
Market Risk Management Strategies Market risk is managed at all stages during the product life cycle including product design and development, ongoing review and positioning of our suite of products, and ongoing asset-liability management and hedge re-balancing.
We have implemented asset-liability management and hedging programs involving regular monitoring and adjustment of market risk exposures using assets, derivative instruments and repurchase agreements to maintain market risk exposures within our risk appetite. The general availability and cost of these hedging instruments may be adversely impacted by a number of factors including changes in interest rates, increased volatility in capital markets, and changes in the general market and regulatory environment within which these hedging programs operate. In particular, regulations for over-the-counter derivatives could impose additional costs and could affect our hedging strategy. In addition, these programs may themselves expose us to other risks.
Our market risk management strategies are developed based on policies and operating guidelines at the enterprise level, business segment level and product level. Liabilities having a similar risk profile are grouped together and a customized investment and hedging strategy is developed and implemented to optimize return within our risk appetite limits.
In general, market risk exposure is mitigated by the assets supporting our products. This includes holdings of fixed income assets such as bonds and mortgages. Derivative instruments may supplement these assets to reduce the risk from cash flow mismatches and mitigate the market risk associated with liability features and optionality. The following table sets out the use of derivatives across a number of our products as at December 31, 2017.
Management’s Discussion and Analysis Sun Life Financial Inc. Annual Report 2017 55

Asset-Liability Management Applications for Derivative Usage The primary uses of derivatives are set out in the table below.
Products/Application Uses of Derivative Derivatives Used General asset-liability management To manage the sensitivity of the Interest rate swaps, swaptions, floors interest rate risk exposure for most duration gap between assets and and bond futures insurance and annuity products liabilities to interest rate changes
Guarantees on insurance and annuity To limit potential financial losses from Swaptions, floors, interest rate swaps, contracts - minimum interest rate significant reductions in asset earned futures on interest rates and spread guarantees, guaranteed surrender rates relative to contract guarantees locks on interest rates values and guaranteed annuitization options
Segregated fund guarantees To manage the exposure of product Put and call options on equity indices, guarantees sensitive to movement in futures on equity indices, interest rate equity market and interest rate levels swaps and futures, and foreign
exchange forwards
Currency exposure in relation to asset- To reduce the sensitivity to currency Currency swaps and forwards liability management fluctuations by matching the value and
cash flows of specific assets denominated in one currency with the value and cash flows of the corresponding liabilities denominated in another currency
Credit exposure To replicate credit exposures and Credit default swaps enhance investment returns
General Account Insurance and Annuity Products Most of our expected sensitivity to changes in interest rates and about two-thirds of our expected sensitivity to changes in equity markets are derived from our general account insurance and annuity products. We have implemented market risk management strategies to mitigate a portion of the market risk related to our general account insurance and annuity products.
Individual insurance products include universal life and other long-term life and health insurance products. Major sources of market risk exposure for individual insurance products include the reinvestment risk related to future premiums on regular premium policies, asset reinvestment risk on both regular premium and single premium policies and the guaranteed cost of insurance. Interest rate risk for individual insurance products is typically managed on a duration basis, within tolerance ranges set out in the applicable investment policy or guidelines. Targets and limits are established so that the level of residual exposure is commensurate with our risk appetite. Exposures are monitored frequently, and assets are re-balanced as necessary to maintain compliance within policy limits using a combination of assets and derivative instruments. A portion of the longer-term cash flows are backed with equities and real estate.
For participating insurance products and other insurance products with adjustability features, the investment strategy objective is to provide a total rate of return given a constant risk profile over the long term.
Fixed annuity products generally provide the policyholder with a guaranteed investment return or crediting rate. Interest rate risk for these products is typically managed on a duration basis, within tolerance ranges set out in the applicable investment guidelines. Targets and limits are established such that the level of residual exposure is commensurate with our risk appetite. Exposures are monitored frequently, and are re-balanced as necessary to maintain compliance within prescribed tolerances using a combination of fixed income assets and derivative instruments.
Certain insurance and annuity products contain minimum interest rate guarantees. Market risk management strategies are implemented to limit potential financial loss due to reductions in asset earned rates relative to contract guarantees. These typically involve the use of hedging strategies utilizing interest rate derivatives such as interest rate floors, swaps and swaptions.
Certain insurance and annuity products contain features which allow the policyholders to surrender their policy at book value. Market risk management strategies are implemented to limit the potential financial loss due to changes in interest rate levels and policyholder behaviour. These typically involve the use of hedging strategies such as dynamic option replication and the purchase of interest rate swaptions.
Certain products have guaranteed minimum annuitization rates. Market risk management strategies are implemented to limit the potential financial loss and typically involve the use of fixed income assets, interest rate swaps, and swaptions.
Segregated Fund Guarantees Approximately one-third of our equity market sensitivity and a small amount of interest rate risk sensitivity as at December 31, 2017 are derived from segregated fund products. These products provide benefit guarantees, which are linked to underlying fund performance and may be triggered upon death, maturity, withdrawal or annuitization. The cost of providing these guarantees is uncertain and depends upon a number of factors including general capital market conditions, our hedging strategies, policyholder behaviour and mortality experience, each of which may result in negative impacts on net income and capital.
56 Sun Life Financial Inc. Annual Report 2017 Management’s Discussion and Analysis

The following table provides information with respect to the guarantees provided for our segregated fund products.
Segregated Fund Risk Exposures ($ millions)
December 31, 2017 Insurance contract
Fund value Amount at Risk(1) Value of guarantees(2) liabilities(3)
SLF Canada 12,448 315 10,875 399 SLF U.S. 3,727 250 3,755 107 Run-off reinsurance(4) 2,534 375 1,546 385 Total 18,709 940 16,176 891
December 31, 2016
Insurance contract Fund value Amount at Risk(1) Value of guarantees(2) liabilities(3)
SLF Canada 12,354 348 10,961 499
SLF U.S. 4,361 430 4,681 171
Run-off reinsurance(4) 2,695 494 1,864 469
Total 19,410 1,272 17,506 1,139
(1) The Amount at Risk represents the excess of the value of the guarantees over fund values on all policies where the value of the guarantees exceeds the fund value. The Amount at Risk is not currently payable as the guarantees are only payable upon death, maturity, withdrawal or annuitization if fund values remain below guaranteed values.
(2) For guaranteed lifetime withdrawal benefits, the value of guarantees is calculated as the present value of the maximum future withdrawals assuming market conditions remain unchanged from current levels. For all other benefits, the value of guarantees is determined assuming 100% of the claims are made at the valuation date.
(3) The insurance contract liabilities represent management’s provision for future costs associated with these guarantees and include a provision for adverse deviation in accordance with Canadian actuarial standards of practice.
(4) The Run-off reinsurance business includes risks assumed through reinsurance of variable annuity products issued by various North American insurance companies between 1997 and 2001. This line of business is part of a closed block of reinsurance, which is included in the Corporate segment.
The movement of the items in the table above from December 31, 2016 to December 31, 2017 primarily resulted from the following factors:
(i) the total fund values decreased due to the strengthening of the Canadian dollar against the U.S. dollar and the net redemptions from legacy business, this was partially offset by favourable equity market movements;
(ii) the amount at risk decreased due to the strengthening of the Canadian dollar against the U.S. dollar, favourable equity market movements and the net redemptions from legacy business;
(iii) the total value of guarantees decreased due to the strengthening of the Canadian dollar against the U.S. dollar and the net redemptions from legacy business; and
(iv) the total insurance contract liabilities decreased due to the strengthening of the Canadian dollar against the U.S. dollar, favourable equity market movements, and the net redemptions from legacy business.
Segregated Fund Hedging Our hedging programs use derivative instruments to mitigate the interest and equity related exposure of our segregated fund contracts. As at December 31, 2017, over 90% of our segregated fund contracts, as measured by associated fund values, were included in a hedging program. While a large percentage of contracts are included in the hedging program, not all of our market risk exposure related to these contracts is hedged. For those segregated fund contracts included in the hedging program, we generally hedge the value of expected future net claims costs and associated margins.
Management’s Discussion and Analysis Sun Life Financial Inc. Annual Report 2017 57

The following table illustrates the impact of our hedging program related to our sensitivity to a 50 basis point and 100 basis point decrease in interest rates and a 10% and 25% decrease in equity markets for segregated fund contracts as at December 31, 2017 and December 31, 2016.
Impact of Segregated Fund Hedging ($ millions)
December 31, 2017 Changes in interest rates(3) Changes in equity markets(4)
50 basis point 100 basis point Net income sensitivity(1)(2) decrease decrease 10% decrease 25% decrease Before hedging (200) (400) (150) (450) Hedging impact 200 400 100 350 Net of hedging — — (50) (100)
December 31, 2016
Changes in interest rates(3) Changes in equity markets(4)
50 basis point 100 basis point Net income sensitivity(1)(2) decrease decrease 10% decrease 25% decrease
Before hedging (250) (550) (200) (550)
Hedging impact 250 550 150 450
Net of hedging — — (50) (100)
(1) Net income sensitivities have been rounded to the nearest $50 million. (2) Since the fair value of benefits being hedged will generally differ from the financial statement value (due to different valuation methods and the inclusion of valuation margins
in respect of financial statement values), this will result in residual volatility to interest rate and equity market shocks in net income and capital. The general availability and cost of these hedging instruments may be adversely impacted by a number of factors, including volatile and declining equity and interest rate market conditions.
(3) Represents a parallel shift in assumed interest rates across the entire yield curve as at December 31, 2017 and December 31, 2016, with no change to the ASB promulgated URR. Variations in realized yields based on factors such as different terms to maturity and geographies may result in realized sensitivities being significantly different from those illustrated above. Sensitivities include the impact of re-balancing interest rate hedges for dynamic hedging programs at 10 basis point intervals (for 50 basis point changes in interest rates) and at 20 basis point intervals (for 100 basis point changes in interest rates).
(4) Represents the respective change across all equity markets as at December 31, 2017 and December 31, 2016. Assumes that actual equity exposures consistently and precisely track the broader equity markets. Since in actual practice equity-related exposures generally differ from broad market indices (due to the impact of active management, basis risk and other factors), realized sensitivities may differ significantly from those illustrated above. Sensitivities include the impact of re-balancing equity hedges for dynamic hedging programs at 2% intervals (for 10% changes in equity markets) and at 5% intervals (for 25% changes in equity markets).
Our hedging strategy is applied both at the line of business or product level and at the Company level using a combination of longer-dated put options and dynamic hedging techniques (i.e., frequent re-balancing of short-dated interest rate and equity derivative contracts). We actively monitor our overall market exposure and may implement tactical hedge overlay strategies (primarily in the form of futures contracts) in order to align expected earnings sensitivities with risk management objectives.
Real Estate Risk Real estate risk is the potential for financial loss arising from fluctuations in the value of, or future cash flows from our investments in real estate. We are exposed to real estate risk and may experience financial losses resulting from the direct ownership of real estate investments or indirectly through fixed income investments secured by real estate property, leasehold interests, ground rents, and purchase and leaseback transactions. Real estate price risk may arise from external market conditions, inadequate property analysis, inadequate insurance coverage, inappropriate real estate appraisals, or from environmental risk exposures. We hold direct real estate investments that support general account liabilities and surplus, and fluctuations in value will impact our profitability and financial position. A material and sustained increase in interest rates may lead to deterioration in real estate values. An instantaneous 10% decrease in the value of our direct real estate investments as at December 31, 2017 would decrease net income(1) by approximately $250 million ($200 million decrease as at December 31, 2016). Conversely, an instantaneous 10% increase in the value of our direct real estate investments as at December 31, 2017 would increase net income by approximately $250 million ($200 million increase as at December 31, 2016).
Foreign Currency Risk Foreign currency risk is the result of mismatches in the currency of our assets and liabilities (inclusive of capital), and cash flows. This risk may arise from a variety of sources such as foreign currency transactions and services, foreign currency hedging, investments denominated in foreign currencies, investments in foreign subsidiaries and net income from foreign operations. Changes or volatility in foreign exchange rates could adversely affect our financial condition and results of operations.
As an international provider of financial services, we operate in a number of countries, with revenues and expenses denominated in several local currencies. In each country in which we operate, we generally maintain the currency profile of assets to match the currency of aggregate liabilities and required surplus. This approach provides an operational hedge against disruptions in local operations caused by currency fluctuations. Foreign currency derivative contracts such as currency swaps and forwards are used as a risk management tool to manage the currency exposure in accordance with our Asset Liability Management Policy. As at December 31, 2017 and December 31, 2016, the Company did not have a material foreign currency risk exposure on a functional currency basis.
Changes in exchange rates can affect our net income and surplus when financial results in functional currencies are translated into Canadian dollars. Net income earned outside of Canada is generally not currency hedged and a weakening in the local currency of our foreign operations relative to the Canadian dollar can have a negative impact on our net income reported in Canadian currency. A strengthening in the local currency of our foreign operations relative to the Canadian dollar would have the opposite effect. Regulatory capital ratios could also be impacted by changes in exchange rates.
(1) Net income sensitivities have been rounded to the nearest $25 million.
58 Sun Life Financial Inc. Annual Report 2017 Management’s Discussion and Analysis

Additional Cautionary Language and Key Assumptions Related to Sensitivities Our market risk sensitivities are measures of our estimated change in net income and OCI for changes in interest rates and equity market price levels described above, based on interest rates, equity market prices and business mix in place as at the respective calculation dates. These sensitivities are calculated independently for each risk factor, generally assuming that all other risk variables stay constant. The sensitivities do not take into account indirect effects such as potential impacts on goodwill impairment or valuation allowances on deferred tax assets. The sensitivities are provided for the consolidated entity and may not be proportional across all reporting segments. Actual results can differ materially from these estimates for a variety of reasons, including differences in the pattern or distribution of the market shocks, the interaction between these risk factors, model error, or changes in other assumptions such as business mix, effective tax rates, policyholder behaviour, currency exchange rates and other market variables relative to those underlying the calculation of these sensitivities. The extent to which actual results may differ from the indicative ranges will generally increase with larger capital market movements. Our sensitivities as at December 31, 2016 have been included for comparative purposes only.
We have also provided measures of our net income sensitivity to instantaneous changes in credit spreads, swap spreads, real estate price levels, and capital sensitivities to changes in interest rates and equity price levels. The real estate sensitivities are non-IFRS financial measures. For additional information, see section L - Non-IFRS Financial Measures in this document. The cautionary language which appears in this section is also applicable to the credit spread, swap spread, real estate, and MCCSR ratio sensitivities. In particular, these sensitivities are based on interest rates, credit and swap spreads, equity market, and real estate price levels as at the respective calculation dates and assume that all other risk variables remain constant. Changes in interest rates, credit and swap spreads, equity market, and real estate prices in excess of the ranges illustrated may result in otherthan-proportionate impacts.
As these market risk sensitivities reflect an instantaneous impact on net income, OCI and Sun Life Assurance’s MCCSR ratio, they do not include impacts over time such as the effect on fee income in our asset management businesses.
The sensitivities reflect the composition of our assets and liabilities as at December 31, 2017 and December 31, 2016, respectively. Changes in these positions due to new sales or maturities, asset purchases/sales, or other management actions could result in material changes to these reported sensitivities. In particular, these sensitivities reflect the expected impact of hedging activities based on the hedge programs in place as at the December 31 calculation dates. The actual impact of hedging activity can differ materially from that assumed in the determination of these indicative sensitivities due to ongoing hedge re-balancing activities, changes in the scale or scope of hedging activities, changes in the cost or general availability of hedging instruments, basis risk (i.e., the risk that hedges do not exactly replicate the underlying portfolio experience), model risk, and other operational risks in the ongoing management of the hedge programs or the potential failure of hedge counterparties to perform in accordance with expectations.
The sensitivities are based on methods and assumptions in effect as at December 31, 2017 and December 31, 2016, as applicable. Changes in the regulatory environment, accounting or actuarial valuation methods, models, or assumptions (including changes to the ASB promulgated URR) after those dates could result in material changes to these reported sensitivities. Changes in interest rates and equity market prices in excess of the ranges illustrated may result in other than proportionate impacts.
Our hedging programs may themselves expose us to other risks, including basis risk (i.e., the risk that hedges do not exactly replicate the underlying portfolio experience), volatility risk, derivative counterparty credit risk, and increased levels of liquidity risk, model risk and other operational risks. These factors may adversely impact the net effectiveness, costs, and financial viability of maintaining these hedging programs and therefore adversely impact our profitability and financial position. While our hedging programs are intended to mitigate these effects (e.g., hedge counterparty credit risk is managed by maintaining broad diversification, dealing primarily with highly rated counterparties, and transacting through over-the-counter contracts cleared through central clearing houses, exchange-traded contracts or bilateral over-the-counter contracts negotiated directly between counterparties that include applicable credit support annexes), residual risk, potential reported earnings and capital volatility remain.
For the reasons outlined above, our sensitivities should only be viewed as directional estimates of the underlying sensitivities of each factor under these specialized assumptions, and should not be viewed as predictors of our future net income, OCI, and capital. Given the nature of these calculations, we cannot provide assurance that actual impact will be consistent with the estimates provided.
Information related to market risk sensitivities and guarantees related to segregated fund products should be read in conjunction with the information contained in the sections in this MD&A under the section M - Accounting and Control Matters - 1 - Critical Accounting Policies and Estimates. Additional information on market risk can be found in Note 6 of our 2017 Annual Consolidated Financial Statements and the Risk Factors section in our AIF.
iii. Insurance Risk
Risk Description Insurance risk is the uncertainty of product performance due to differences between the actual experience and expected experience in the areas of policyholder behaviour, mortality, morbidity, and longevity. In addition, product design and pricing, expense and reinsurance risks impact multiple risk categories, including insurance risk.
Insurance Risk Management Governance and Control We employ a wide range of insurance risk management practices and controls, as outlined below: • Insurance risk governance practices are in place, including independent monitoring and review and reporting to senior
management and the Risk & Conduct Review Committee.
Management’s Discussion and Analysis Sun Life Financial Inc. Annual Report 2017 59

• Risk appetite limits have been established for policyholder behaviour, mortality and morbidity, and longevity risks. • Income and regulatory capital sensitivities are monitored, managed and reported against pre-established risk limits. • Comprehensive Insurance Risk Policy, guidelines and practices are in place. • The global underwriting manual aligns underwriting practices with our corporate risk management standards and ensures a
consistent approach in insurance underwriting. • Board-approved maximum retention limits (amounts issued in excess of these limits are reinsured) are in place. • Detailed procedures, including criteria for approval of risks and for claims adjudication are established and monitored for each
business segment. • Underwriting and risk selection standards are established and overseen by the corporate underwriting and claims risk
management function. • Diversification and risk pooling is managed by aggregation of exposures across product lines, geography and distribution
channels. • The Insurance Risk Policy, and Investment and Credit Risk Management Policy establish acceptance criteria and protocols to
monitor the level of reinsurance ceded to any single reinsurer or group of reinsurers. • Reinsurance counterparty risk is monitored, including through annual reporting to the Risk & Conduct Review Committee. • Concentration risk exposure is monitored on group policies in a single location to avoid a catastrophic event occurrence
resulting in a significant impact. • Various limits, restrictions and fee structures are introduced into plan designs in order to establish a more homogeneous policy
risk profile and limit potential for anti-selection. • Regulatory solvency requirements include risk-based capital requirements and are monitored regularly. • The Product Design and Pricing Policy requires detailed risk assessment and pricing provision for material risks. • Company specific and industry level experience studies and sources of earnings analysis are monitored and factored into
valuation, renewal and new business pricing processes. • Stress-testing techniques, such as DCAT, are used to measure the effects of large and sustained adverse movements in
insurance risk factors. • Insurance contract liabilities are established in accordance with Canadian actuarial standards of practice. • Internal capital targets are established at an enterprise level to cover all risks and are above minimum regulatory and
supervisory levels. Actual capital levels are monitored to ensure they exceed internal targets.
We use reinsurance to limit losses, minimize exposure to significant risks and to provide additional capacity for growth. Our Insurance Risk Policy sets maximum global retention limits and related management standards and practices which are applied to reduce our exposure to large claims. Amounts in excess of the Board-approved maximum retention limits are reinsured. On a single life or joint-first-to-die basis our retention limit is $25 million in Canada and is US$25 million outside of Canada. For survivorship life insurance, our maximum global retention limit is $30 million in Canada and is US$30 million outside of Canada. In certain markets and jurisdictions retention levels below the maximum are applied. Reinsurance is utilized for numerous products in most business segments, and placement is done on an automatic basis for defined insurance portfolios and on a facultative basis for individual risks with certain characteristics.
Our reinsurance coverage is well diversified and controls are in place to manage exposure to reinsurance counterparties. Reinsurance exposures are monitored to ensure that no single reinsurer represents an undue level of credit risk. This includes performing periodic due diligence on our reinsurance counterparties as well as internal credit assessments on counterparties with which we have material exposure. While reinsurance arrangements provide for the recovery of claims arising from the liabilities ceded, we retain primary responsibility to the policyholders.
Specific insurance risks and our risk management strategies are discussed below in further detail.
Policyholder Behaviour Risk We can incur losses due to adverse policyholder behaviour relative to the assumptions used in the pricing and valuation of products with regard to lapse of policies or exercise of other embedded policy options.
Uncertainty in policyholder behaviour can arise from several sources including unexpected events in the policyholder’s life circumstances, the general level of economic activity (whether higher or lower than expected), changes in pricing and availability of current products, the introduction of new products, changes in underwriting technology and standards, as well as changes in our financial strength or reputation. Uncertainty in future cash flows affected by policyholder behaviour can be further exacerbated by irrational behaviour during times of economic turbulence or at key option exercise points in the life of an insurance contract.
Various types of provisions are built into many of our products to reduce the impact of uncertain policyholder behaviour. These provisions include: • Surrender charges which adjust the payout to the policyholder by taking into account prevailing market conditions. • Limits on the amount that policyholders can surrender or borrow. • Restrictions on the timing of policyholders’ ability to exercise certain options. • Restrictions on both the types of funds Clients can select and the frequency with which they can change funds. • Policyholder behaviour risk is also mitigated through reinsurance on some insurance contracts.
Mortality and Morbidity Risk Mortality and morbidity risk is the risk that future experience could be worse than the assumptions used in the pricing and valuation of products. Mortality and morbidity risk can arise in the normal course of business through random fluctuation in realized experience, through catastrophes, or in association with other risk factors such as product development and pricing or model risk. Adverse mortality and morbidity experience could also occur through systemic anti-selection, which could arise due to poor plan design, or underwriting process failure or the development of investor-owned and secondary markets for life insurance policies.
The risk of adverse morbidity experience also increases during economic slowdowns, especially with respect to disability coverages, as well as with increases in high medical treatment costs and growth in utilization of specialty drugs. This introduces the
60 Sun Life Financial Inc. Annual Report 2017 Management’s Discussion and Analysis

potential for adverse financial volatility in our financial results. External factors including medical advances could adversely affect our life insurance, health insurance, critical illness, disability, long-term care insurance and annuity businesses.
Detailed uniform underwriting procedures have been established to determine the insurability of applicants and to manage exposure to large claims. These underwriting requirements are regularly scrutinized against industry guidelines and oversight is provided through a corporate underwriting and claim management function.
We do not have a high degree of concentration risk to single individuals or groups due to our well-diversified geographic and business mix. The largest portion of mortality risk within the Company is in North America. Individual and group insurance policies are underwritten prior to initial issue and renewals, based on risk selection, plan design, and rating techniques.
The Insurance Risk Policy approved by the Risk & Conduct Review Committee includes limits on the maximum amount of insurance that may be issued under one policy and the maximum amount that may be retained. These limits vary by geographic region and amounts in excess of limits are reinsured to ensure there is no exposure to unreasonable concentration of risk.
Longevity Risk Longevity risk is the potential for economic loss, accounting loss or volatility in earnings arising from adverse changes in rates of mortality improvement relative to the assumptions used in the pricing and valuation of products. This risk can manifest itself slowly over time as socioeconomic conditions improve and medical advances continue. It could also manifest itself more quickly, for example, due to medical breakthroughs that significantly extend life expectancy. Longevity risk affects contracts where benefits or costs are based upon the likelihood of survival (for example, annuities, pensions, pure endowments, reinsurance, segregated funds, and specific types of health contracts). Additionally, our longevity risk exposure is exacerbated for certain annuity products such as guaranteed annuity options by an increase in equity market levels.
To improve management of longevity risk, we monitor research in the fields which could result in mortality improvement. Stress-testing techniques are used to measure and monitor the impact of extreme mortality improvement on the aggregate portfolio of insurance and annuity products as well as our own pension plans.
Product Design and Pricing Risk Product design and pricing risk is the risk a product does not perform as expected, causing adverse financial consequences. This risk may arise from deviations in realized experience versus assumptions used in the pricing of products. Risk factors include uncertainty concerning future investment yields, policyholder behaviour, mortality and morbidity experience, sales levels, mix of business, expenses and taxes. Although some of our products permit us to increase premiums or adjust other charges and credits during the life of the policy or contract, the terms of these policies or contracts may not allow for sufficient adjustments to maintain expected profitability. This could have an adverse effect on our profitability and capital position.
Our Product Design and Pricing Policy, approved by the Risk & Conduct Review Committee, establishes the framework governing our product design and pricing practices and is designed to align our product offerings with our strategic objectives and risk-taking philosophy. Consistent with this policy, product development, design and pricing processes have been implemented throughout the Company. New products follow a stage-gate process with defined management approvals based on the significance of the initiative, and each initiative is subject to a risk assessment process to identify key risks and risk mitigation requirements, and is reviewed by multiple stakeholders. Additional governance and control procedures are listed below: • Pricing models, methods, and assumptions are subject to periodic internal peer reviews. • Experience studies, sources of earnings analysis, and product dashboards are used to monitor actual experience against those
assumed in pricing and valuation. • On experience rated, participating, and adjustable products, emerging experience is reflected through changes in policyholder
dividend scales as well as other policy adjustment mechanisms such as premium and benefit levels. • Limits and restrictions may be introduced into the design of products to mitigate adverse policyholder behaviour or apply upper
thresholds on certain benefits.
Expense Risk Expense risk is the risk that future expenses are higher than the assumptions used in the pricing and valuation of products. This risk can arise from general economic conditions, unexpected increases in inflation, slower than anticipated growth, or reduction in productivity leading to increases in unit expenses. Expense risk occurs in products where we cannot or will not pass increased costs onto the Client and will manifest itself in the form of a liability increase or a reduction in expected future profits.
We closely monitor expenses through an annual budgeting process and ongoing monitoring of any expense gaps between unit expenses assumed in pricing and actual expenses.
Reinsurance Risk We purchase reinsurance for certain risks underwritten by our various insurance businesses. Reinsurance risk is the risk of financial loss due to adverse developments in reinsurance markets (for example, discontinuance or diminution of reinsurance capacity, or an increase in the cost of reinsurance), insolvency of a reinsurer or inadequate reinsurance coverage.
Changes in reinsurance market conditions, including actions taken by reinsurers to increase rates on existing and new coverage and our ability to obtain appropriate reinsurance, may adversely impact the availability or cost of maintaining existing or securing new reinsurance capacity, with adverse impacts on our business strategies, profitability and financial position. There is an increased possibility of rate increases or renegotiation of legacy reinsurance contracts by our reinsurers, as the global reinsurance industry continues to review and optimize their business models. In addition, changes to the regulatory treatment of reinsurance arrangements could have an adverse impact on our capital position.
We have an Insurance Risk Policy, and Investment and Credit Risk Management Policy approved by the Risk & Conduct Review Committee which set acceptance criteria and processes to monitor the level of reinsurance ceded to any single reinsurer or group
Management’s Discussion and Analysis Sun Life Financial Inc. Annual Report 2017 61

of reinsurers. These policies also set out criteria for determining which reinsurance companies qualify as suitable reinsurance counterparties and require that all agreements include provisions to allow action to be taken, such as recapture of ceded risk (at a potential cost to the Company), in the event that the reinsurer loses its legal ability to carry on business through insolvency or regulatory action. Periodic due diligence is performed on the reinsurance counterparties with which we do business and internal credit assessments are performed on reinsurance counterparties with which we have material exposure. Reinsurance counterparty credit exposures are monitored closely and reported annually to the Risk & Conduct Review Committee.
New sales of our products can be discontinued or changed to reflect developments in the reinsurance markets. Rates for in-force reinsurance treaties can be either guaranteed or adjustable for the life of the ceded policy. There is generally more than one reinsurer supporting a reinsurance pool to diversify this risk.
Additional information on insurance risk can be found in Note 7 to our 2017 Annual Consolidated Financial Statements and in the Risk Factors section in our AIF.
iv. Business and Strategic Risk
Risk Description Business and strategic risk includes risks related to changes in the economic or political environment, changes in distribution channels or Client behaviour, changes in the competitive environment, risks relating to the design or implementation of our business strategy, and changes in the legal or regulatory environment.
Business and Strategic Risk Management Governance and Control We employ a wide range of business and strategic risk management practices and controls, as outlined below: • Business and strategic risk governance practices are in place, including independent monitoring and review and reporting to
senior management, the Board of Directors and the Board Committees. • Business and strategic risk is managed through our strategic and business planning process and controls over the
implementation of these plans. These plans are reviewed and discussed by our Executive Team and the key themes, issues and risks emerging are discussed by the Board of Directors and the Board Committees.
• Our business and strategic plans are subject to approval by the Board of Directors, which also receives regular reviews of implementation progress against key business plan objectives.
• Comprehensive policies including the Risk Framework, Risk Appetite Policy, Product Design and Pricing Policy, and Capital Risk Policy are in place.
• Our corporate strategy and business objectives are established within the boundaries of the Risk Appetite Policy. Our business strategies and plans are designed to align with our risk appetite, our capital position and our financial performance objectives.
• Our risk appetite is periodically assessed, taking into consideration the economic and regulatory environments in which we operate.
• Merger, acquisition and divestiture transactions are governed by a Board-approved risk management policy and significant transactions require the approval of the Board of Directors.
• Stress-testing techniques, such as DCAT, are used to measure the effects of large and sustained adverse scenarios. • Key and emerging risks are identified, monitored and reported, including emerging regulatory changes that may have a material
impact on our finances, operations or reputation. • Internal capital targets are established at an enterprise level to cover all risks and are above minimum regulatory and
supervisory levels. Actual capital levels are monitored to ensure they exceed internal targets.
Specific business and strategic risks are discussed below in further detail.
Economic and Political Risk We operate in various geographies and our business and financial operations are susceptible to regional and global economic, political and regulatory changes. We may be affected by economic and capital markets conditions and economic shocks around the globe as a result of increasingly connected global markets. Factors such as changes in interest rates, foreign exchange rates, market volatility, housing prices, consumer spending, saving and debt, business investment and inflation around the globe can affect the business and economic environments in which we operate. Continued economic and political uncertainty may give rise to increased business and strategic risks including those associated with industry restructuring, mergers and acquisitions, changing competitive dynamics and changes in the legal, regulatory and tax regimes in which our businesses operate. In addition, adverse economic conditions often arise in conjunction with volatile and deteriorating capital markets conditions, which can have an adverse impact on Client behaviour and in turn on our sales and profitability, credit and financial strength ratings, and capital and liquidity positions.
Implementation of Business Strategy Our business strategies and plans are dependent on the successful execution of organizational and strategic initiatives designed to support the growth of our business. Our ability to manage the execution of these initiatives effectively and prioritize initiatives directly affects our ability to execute our strategies. Identifying and implementing the right set of initiatives is critical to achieving our business plan targets. Failure to implement these initiatives could also lead to cost structure challenges.
Distribution Risk Failure to achieve planned distribution scale or appropriate and compliant distribution of products could materially impact our financial and strategic objectives. This includes the inability to attract and retain intermediaries and agents at a cost that is financially feasible to the Company, or to develop digital sales and Client support capabilities and technologies. Distribution risk may also be influenced where our distribution or product strategy and related services (including digital sales and Client support capabilities and technologies) are not developed, modified or executed in line with our strategic objectives or in consideration of the changes in Client behaviour or our regulatory environment. In addition, the lack of a well-diversified distribution model in the jurisdictions in which we do business may cause over-reliance on agency channel or key partners.
62 Sun Life Financial Inc. Annual Report 2017 Management’s Discussion and Analysis

Competition Risk Competition from insurance companies, banks, asset managers, mutual fund companies, financial planners and other service providers (including new entrants and non-traditional financial services companies) is intense, and could adversely affect our business in certain countries.
The businesses in which we engage are highly competitive and our ability to sell our products is dependent on many factors, including scale, price and yields offered, distribution channels, digital capabilities, financial strength ratings, range of product lines and product quality, brand strength, investment performance, historical dividend levels and the ability to provide value added services to distributors and Clients. In certain markets, some of our competitors may be superior to us on one or more of these factors. Our competitors have significant potential to disrupt our business through targeted strategies to reduce our market share which may include targeting our key people or bancassurance partners and other distributors or aggressively pricing their products. Our ability to achieve our business plans and strategies depends significantly upon our capacity to anticipate and respond quickly to these competitive pressures.
Technology is driving rapid change in the financial services sector and is enabling new entrants to compete or offer services to our competitors to enhance their ability to compete in certain segments of the insurance, wealth and asset management markets. The emergence of new technologies such as robotic process automation, artificial intelligence, blockchain and data analytics may have an impact on the financial services sector and how companies interact with their stakeholders. Our current competitors or new entrants may use these or other new technologies to provide services in various areas such as customized pricing, proactive outreach to Clients and targeted marketing in order to strengthen their Client relationships and influence Client behaviour. The impact of disruption from changing technology and innovation by traditional and non-traditional competitors who may offer a better user experience, functionality or lower priced products and may have lower distribution costs will require us to adapt at a more rapid pace and may create margin pressures. The risk of disruption may also impact our distribution models as new and low cost digital-based business models emerge in connection with the distribution of financial services and products, such as insurtechs and robo-advisors. These risks are evolving rapidly with an increasing number of digital users and are difficult to anticipate and respond to proactively, and may adversely impact our profitability and financial position.
Investment Performance Investment performance risk is the possibility that we fail to achieve the desired return objectives on our investment portfolio, or that our asset management businesses fail to design or execute investment strategies in order to achieve competitive returns on the products and managed accounts offered by these businesses. Failure to achieve investment objectives may adversely affect our revenue and profitability through slower growth prospects and adverse impacts on policyholder or Client behaviour.
Changes in Legal and Regulatory Environment Most of our businesses are subject to extensive regulation and supervision. Changes to legislation, regulations or government policies, or the manner in which they are interpreted or enforced, may require that we make significant changes to our strategy, may result in increased implementation costs and diversion of resources to manage the change, could impact financial reporting, accounting processes and capital requirements, and could impact the ability of sales intermediaries to distribute our products, all of which could have an adverse effect on our business and operations. Our failure to comply with existing and evolving regulatory requirements could also result in regulatory sanctions and could affect our relationships with regulatory authorities and our ability to execute our business strategies and plans.
These changes could impact our capital requirements, the regulatory framework for our products and services, the regulation of selling practices, sales intermediaries (such as bancassurance) and product offerings (such as prescription drugs), solvency requirements, executive compensation, corporate governance practices and could impose restrictions on our foreign operations, which may include changes to the limits on foreign ownership of local companies.
International Operations The future success of our businesses in our international operations depends in large part on our ability to grow and compete in the markets where we operate. Challenges in these markets pose strategic and execution risk including our ability to attract and retain qualified employees and executives with local experience and critical skills, political, legal, economic, competition or other risks, risks associated with joint venture operations, developing and executing our risk management practices, and our ability to attract, retain, expand and diversify distribution channels.
Mergers, Acquisitions and Divestitures We regularly explore opportunities to selectively acquire other businesses or to divest ourselves of all or part of certain businesses, in support of our growth and strategic objectives. These transactions introduce the risk of financial loss due to a potential failure to achieve the expected financial or other strategic objectives. There is a risk that we may be unable to make an appropriate acquisition in a desired market or business line or are unable to realize the financial and strategic benefits of the transactions due to competitive factors, regulatory requirements or other factors. These risks could adversely impact our ability to achieve our financial and strategic objectives.
Additional information on business and strategic risk can be found in the Risk Factors section in our AIF.
v. Operational Risk
Risk Description Operational risk is the risk of loss (financial and non-financial) resulting from inadequate or failed internal processes, people and systems or from external events. Operational risk is present in all of our business activities and encompasses a broad range of risks as described below. Operational risk management is embedded in the practices utilized to manage other risks and, therefore, if not managed effectively, operational risk can impact our ability to manage other key risks.
Management’s Discussion and Analysis Sun Life Financial Inc. Annual Report 2017 63

Operational Risk Management Governance and Control We employ a wide range of operational risk management practices and controls, as outlined below: • Operational risk governance practices are in place, including independent monitoring and review and reporting to senior
management and the Board Committees. • Comprehensive Operational Risk Management Framework, Policies, guidelines and practices are in place. • Our governance practices, corporate values, Code of Conduct and Company-wide approach to managing risk set the
foundation for mitigating operational risks. • Our Code of Conduct sets the tone for a strong ethical culture, and we regularly review and update the Code of Conduct to
ensure that it continues to meet the expectations of regulators and other stakeholders. All our directors and employees must reconfirm annually their understanding of and commitment to comply with the Code of Conduct.
• We have established appropriate internal controls and systems, compensation programs, and seek to hire and retain competent people throughout the organization and provide ongoing training to our people.
• Stress-testing techniques, such as DCAT, are used to measure the effects of large and sustained adverse scenarios. • We mitigate a portion of our operational risk exposure through our corporate insurance program by purchasing insurance
coverage that seeks to provide insurance against unexpected material losses resulting from events such as criminal activity, property loss or damage and liability exposures, or that satisfies legal requirements and contractual obligations.
• Internal capital targets are established at an enterprise level to cover all risks and are above minimum regulatory and supervisory levels. Actual capital levels are monitored to ensure they exceed internal targets.
Specific operational risks and our risk management strategies are discussed below in further detail.
Information Security and Privacy Risks Technology is used in almost all aspects of our business and operations, and as part of our Client strategy, we are investing in enhancing the digital side of our business by digitizing interactions and processes, using digital to be more personal, proactive and predictive with our Clients and building new digital business models.
Our business and the successful implementation of our digital strategy are dependent on various factors including maintaining a secure environment for our Clients, employees and other parties’ information. This requires the effective and secure use of information technology systems, including controls around logical access, physical access and data management. We engage with various stakeholders through various technologies, including digital, mobile applications and other technologies as they emerge, including cloud computing, artificial intelligence and robotics. We use these technologies to collect, process and maintain information relating to business transactions and financial reporting, as well as the personal information of our Clients and employees. We also obtain services from a wide range of third-party service providers and have outsourced certain business and information technology functions to third parties in various jurisdictions.
We continue to make investments in technology, processes and cyber security professionals to position us to be better prepared to deal with the evolving threat landscape. Our security framework includes policies and procedures that are aligned with recognized industry standards and are compliant with applicable laws and regulations. We have well-established security controls (including logical, physical and data management controls) and processes that are intended to protect information and computer systems including threat monitoring, information security risk assessments and privacy impact assessments. The framework also includes technology, process and behavioural based controls to protect our information systems and the data entrusted to us by our Clients and employees. As part of the overall security program, we provide security awareness training sessions for all new employees and on an annual basis thereafter.
In particular, privacy breaches could occur and may result in unauthorized access and disclosure or use of personal information. Many jurisdictions in which we do business are developing and implementing reporting requirements relating to cyber security and more stringent consumer privacy legislation. Our global privacy program requires adherence to our global privacy commitment, local laws and local privacy policies. We monitor emerging privacy legislation and we have established a network of privacy officers in the business segments to monitor and provide guidance on handling personal information and for reporting privacy incidents to appropriate management for response and resolution. In addition, we conduct privacy impact assessments, training and regular monitoring and reporting to help mitigate these risks.
Social media risks could also significantly impact our reputation due to the broad reach and real-time interaction of such media. We monitor social media to enable us to take action to mitigate an event that could potentially have a negative impact on our brand.
Human Resources Risk We operate in an increasingly competitive and global business environment and ensuring our ability to attract, retain and enable high performing talent that is diverse and engaged is essential to meeting the needs of our Clients. The loss of our top talent could have a material adverse effect on our reputation and business objectives given their skills, knowledge of our business, Client relationships, industry affiliations and experience, and the potential difficulty of promptly finding qualified replacements. Our ability to achieve business objectives could be adversely affected if we are unable to attract, retain or effectively deploy resources with the in-depth knowledge and necessary skills required, or are unable to design compensation programs that effectively drive employee behaviour.
To mitigate this risk, we have comprehensive Human Resource policies, practices and programs in place. Our talent acquisition, rewards and development programs seek to attract, build and retain top talent and create strong succession plans. We also measure and monitor employee engagement regularly to ensure we create and maintain a work environment where all employees are welcome and able to contribute effectively.
Regulatory Compliance, Legal and Conduct Risk We are subject to extensive regulatory oversight by insurance and financial services regulators in the jurisdictions in which we conduct business. In recent years, there has been an increased focus by regulators globally on Client fairness, conduct, anti-money laundering, privacy and data governance. Failure to comply with applicable laws or to conduct our business consistent with
64 Sun Life Financial Inc. Annual Report 2017 Management’s Discussion and Analysis
changing regulatory or public expectations could adversely impact our reputation and may lead to regulatory investigations, examinations, proceedings, settlements, penalties, fines, restrictions on our business, litigation or an inability to carry out our business strategy.
Our Chief Compliance Officer oversees our comprehensive Company-wide compliance framework, which is consistent with regulatory guidance from OSFI and other regulators. This framework promotes proactive, risk-based management of compliance and regulatory risk, and includes: Company-wide and business segment policies, standards and operating guidelines, programs to promote awareness of laws and regulations that impact us, ongoing monitoring of emerging legal issues and regulatory changes and training programs. There are also new employee orientation programs that include anti-money laundering and anti-terrorist financing, anti-bribery and corruption, privacy and information security risk management. To ensure effective oversight and implementation, the framework is supported by a network of compliance officers and the general counsel in each business segment. The Chief Compliance Officer reports regularly to the Board of Directors and Board Committees on the state of compliance, key compliance risks, emerging regulatory trends, escalation of key issues and key risk indicators.
Execution and Integration Risks Relating to Mergers, Acquisitions and Divestitures We regularly explore opportunities to acquire other financial services businesses or to divest ourselves of all or part of certain businesses, in support of our growth and strategy goals. We have previously announced acquisitions in various markets and have increased our ownership interests in certain of our joint ventures and associates in Asia. These and future transactions introduce the risks related to completing the transactions as planned including effective separation and integration of the transferred businesses, effective or efficient integration, restructuring or reorganization of the businesses after the transactions have closed, and motivating and retaining personnel to effectively execute these transactions. In addition, the integration of operations and differences in organizational culture may require the dedication of significant management resources, which may distract management’s attention from our day-to-day business. These risks could have an impact on our business relationship with various stakeholders including future employees, Clients, distributors and partners. Anticipated cost synergies or other expected benefits may not materialize due to a failure to successfully integrate the acquired business with our existing operations.
To mitigate this risk, we have established procedures to oversee the execution and integration of merger and acquisition transactions. Regular updates on the execution and integration risks relating to these transactions are provided to the Board of Directors, Board Committees and senior management committees, as appropriate.
Information Technology Risk The use of technology and computer systems is essential in supporting and maintaining business operations. We use technology to support virtually all aspects of our business and operations. The rapidly changing business environment increases the risk of our technology strategy not being agile enough to adapt to new business demands in a timely manner leading to financial losses, increased costs and the inability to meet Client needs.
To manage the risks associated with our technology infrastructure and applications, we have implemented a number of policies, guidelines, and controls through our technology approval and risk governance model to ensure ongoing systems availability, stability, and currency. A system development methodology and process has also been designed and implemented.
Third-Party Risk We engage in a variety of third-party relationships, including distributors, independent contractors, outsourcing service providers and suppliers. Our profitability or reputation could be impacted if these third parties are unable to meet their ongoing service commitments or perform to expected standards.
To manage these risks, we have established Company-wide policies and guidelines which are consistent with OSFI’s and other local regulatory requirements. Our outsourcing and supplier risk management programs include specific requirements, guidelines and methodologies to effectively identify, assess, manage, monitor and report on the outsourcing and supplier risks.
Business Disruption Risk Our businesses are dependent on the availability of trained employees, physical locations to conduct operations, and access to technology. A significant business disruption to our operations can result if one or more of these key elements are negatively impacted.
To manage this risk, we have implemented a business continuity program to facilitate the recovery of critical business operations. This program encompasses business continuity planning, crisis management and disaster recovery. Our policy, guidelines, and operating procedures establish consistent processes designed to ensure that key business functions can continue and normal operations can resume effectively and efficiently should a major disruption occur. Each business area maintains its own business continuity plan under the oversight of the business continuity program and these elements are updated and tested on a regular basis. In addition, we conduct mandatory business continuity awareness training for all employees annually and have off-site backup facilities and failover capability designed to minimize downtime and accelerate recovery time in the event of a major disruption.
Model Risk We use complex models to support many business functions including product development and pricing, capital management, valuation, financial reporting, planning, hedging, asset-liability management and risk management. Model risk is the risk of loss, either in the form of financial loss, inappropriate or poor business decisions, damage to reputation, or other adverse impact, arising from inaccurate model outputs or incorrect use or interpretation of model outputs.
To manage model risk, we have established robust, Company-wide model risk management procedures over the models’ life cycle with respect to building, using, changing and retiring models. The policy and operating guidelines set out minimum, risk-based requirements to ensure that models are effectively controlled, maintained and appropriately understood by users.
Management’s Discussion and Analysis Sun Life Financial Inc. Annual Report 2017 65

Information Management Risk As an international provider of financial services, we deal with extensive information across a number of countries. Our business decisions are dependent on the accuracy and completeness of the underlying data and information. Information management risk is the inability to capture, manage, retain and dispose records and data, and the inability to provide data on a timely and accurate basis to support business decisions. Failure to manage these risks could have financial or reputational impacts, and may lead to regulatory proceedings, penalties and litigation.
To manage and monitor information management risk, we have an internal control framework, data governance and record management practices in place to ensure accuracy and completeness of the underlying data as well as retention of the information.
Environmental Risk Our financial performance may be adversely affected if we do not adequately prepare for the direct or indirect negative impacts of environmental events and developments, including those related to physical impacts of climate change and the shift towards a lower-carbon economy. These events and developments may include increased frequency and severity of natural or human-made environmental disasters, and emerging regulatory and public policy developments, and their impacts on our operations, invested assets, suppliers and Clients. External factors such as stakeholder expectations around environmental performance, resource constraints, impact of climate change and costs associated with adaptation are also potential sources of environmental risk. These risks may also affect our Clients and our suppliers, which could have a negative impact on our operations and performance. Further, an environmental issue on a property owned, leased or managed by us or on any property with which we are affiliated could have financial or reputational impacts.
We maintain an environmental risk management program to help protect investment assets (primarily real estate, mortgage and certain private fixed income assets) from losses due to environmental issues and to help ensure compliance with applicable laws. An important aspect of the program is an assessment of new investment assets for existing and potential environmental risks. Additionally, all employees who are involved in underwriting and asset management investments in real estate and private debt secured by real estate, complete environmental training and provide annual sign-off on compliance with the Company’s environmental guidelines. We have programs in place across our real estate portfolio to identify and mitigate environmental risks, to conserve energy and to reduce waste. Environmental factors are incorporated into initial and ongoing reviews and assessments of public fixed income, private fixed income, real estate and commercial mortgage investments. Our cross-functional North American Investments Environmental Committee works to identify and assess environmental risks across our investment assets. Our International Sustainability Council convenes on broader environmental and sustainability issues. We report on environmental management annually in our Sustainability Report reviewed by the Governance, Nomination & Investment Committee.
Additional information on operational risk can be found in the Risk Factors section in our AIF.
vi. Liquidity Risk
Risk Description Liquidity risk is the possibility that we will not be able to fund all cash outflow commitments and collateral requirements as they fall due. This includes the risk of being forced to sell assets at depressed prices resulting in realized losses on sale. This risk also includes restrictions on our ability to efficiently allocate capital among our subsidiaries due to various market and regulatory constraints on the movement of funds. Our funding obligations arise in connection with the payment of policyholder benefits, expenses, reinsurance settlements, asset purchases, investment commitments, interest on debt, and dividends on common and preferred shares. Sources of available cash flow include general fund premiums and deposits, investment related inflows (such as maturities, principal repayments, investment income and proceeds of asset sales), proceeds generated from financing activities, and dividends and interest payments from subsidiaries. We have various financing transactions and derivative contracts under which we may be required to pledge collateral or to make payments to our counterparties for the decline in market value of specified assets. The amount of collateral or payments required may increase under certain circumstances (such as changes to interest rates, credit spreads, equity markets or foreign exchange rates), which could adversely affect our liquidity.
Liquidity Risk Management Governance and Control We generally maintain a conservative liquidity position and employ a wide range of liquidity risk management practices and controls, which are described below: • Liquidity risk governance practices are in place, including independent monitoring and review and reporting to senior
management and the Risk & Conduct Review Committee. • Liquidity is managed in accordance with our Asset Liability Management Policy and operating guidelines. • Liquidity contingency plans are maintained for the management of liquidity in the event of a liquidity crisis. • Stress testing is performed by comparing liquidity coverage ratios under a one-month stress scenario to our policy thresholds.
These liquidity ratios are measured and managed at the enterprise and legal entity levels. • Stress testing of our collateral is performed by comparing collateral coverage ratios to our policy threshold. • Cash Management and asset-liability management programs support our ability to maintain our financial position by ensuring
that sufficient cash flow and liquid assets are available to cover potential funding requirements. We invest in various types of assets with a view of matching them to our liabilities of various durations.
• Internal capital targets are established at an enterprise level to cover all risks and are above minimum regulatory and supervisory levels. Actual capital levels are monitored to ensure they exceed internal targets.
• We actively manage and monitor our capital and asset levels, and the diversification and credit quality of our investments. • Various credit facilities for general corporate purposes are maintained.
66 Sun Life Financial Inc. Annual Report 2017 Management’s Discussion and Analysis

The following table summarizes the contractual maturities of our significant financial liabilities and contractual commitments as at December 31, 2017 and December 31, 2016:
Financial Liabilities and Contractual Obligations
December 31, 2017 ($ millions)
Within 1 year
1 year to 3 years
3 years to 5 years
Over 5 years Total
Insurance and investment contract liabilities(1) $10,242 $7,552 $7,729 $242,181 $267,704 Senior debentures and unsecured financing(2) 120 516 489 4,393 5,518 Subordinated debt(2) 126 251 251 4,229 4,857 Bond repurchase agreements 1,976 — — — 1,976 Accounts payable and accrued expenses 5,814 — — — 5,814 Secured borrowings from mortgage securitization 81 333 398 701 1,513 Borrowed funds(2) 80 52 49 83 264 Total liabilities $18,439 $8,704 $8,916 $251,587 $287,646 Contractual commitments(3)
Contractual loans, equities and mortgages $ 1,138 $ 820 $ 214 $ 761 $ 2,933 Operating leases 116 207 148 452 923 Total contractual commitments $ 1,254 $1,027 $ 362 $ 1,213 $ 3,856 December 31, 2016 ($ millions)
Within 1 year
1 year to 3 years
3 years to 5 years
Over 5 years Total
Insurance and investment contract liabilities(1) $10,249 $8,393 $8,363 $226,117 $253,122
Senior debentures and unsecured financing(2) 110 520 485 4,392 5,507
Subordinated debt(2) 150 299 299 4,696 5,444
Bond repurchase agreements 1,789 — — — 1,789
Accounts payable and accrued expenses 6,530 — — — 6,530
Secured borrowings from mortgage securitization 22 251 419 597 1,289
Borrowed funds(2) 97 49 53 132 331
Total liabilities $18,947 $9,512 $9,619 $235,934 $274,012
Contractual commitments(3)
Contractual loans, equities and mortgages $ 987 $ 461 $ 30 $ 908 $ 2,386
Operating leases 109 212 152 471 944
Total contractual commitments $ 1,096 $ 673 $ 182 $ 1,379 $ 3,330
(1) These amounts represent the undiscounted estimated cash flows of insurance and investment contract liabilities on our Consolidated Statements of Financial Position. These cash flows include estimates related to the timing and payment of death and disability claims, policy surrenders, policy maturities, annuity payments, minimum guarantees on segregated fund products, policyholder dividends, amounts on deposit, commissions and premium taxes offset by contractual future premiums and fees on in-force contracts. These estimated cash flows are based on the best estimated assumptions used in the determination of insurance and investment contract liabilities. Due to the use of assumptions, actual cash flows will differ from these estimates.
(2) Payments due based on maturity dates and include expected interest payments. Actual redemption of certain securities may occur sooner as some include an option for the issuer to call the security at par at an earlier date.
(3) Contractual commitments and operating lease commitments are not reported on our Consolidated Statements of Financial Position. Additional information on these commitments is included in Note 23 of our 2017 Annual Consolidated Financial Statements.
Additional information on liquidity risk can be found in Note 6 to our 2017 Annual Consolidated Financial Statements and the Risk Factors section in our AIF.
Management’s Discussion and Analysis Sun Life Financial Inc. Annual Report 2017 67

K. Additional Financial Disclosure
1. Items related to Statement of Operations
i. Business Group Summary Statement of Operations
2017 2016
SLF Asset ($ millions, after-tax) SLF Canada SLF U.S. Management SLF Asia Corporate Total Total
Net premiums 8,002 5,955 — 1,216 108 15,281 15,048
Net investment income 4,133 2,442 45 1,144 447 8,211 7,945
Fee income 1,132 233 4,037 394 46 5,842 5,580
Revenue 13,267 8,630 4,082 2,754 601 29,334 28,573
Gross claims and benefits paid and Changes in insurance/investment contract liabilities 12,175 7,488 — 1,626 253 21,542 20,721
Operating expenses, commissions and other expenses(1) 3,276 1,890 2,976 905 329 9,376 8,720
Reinsurance expenses (recoveries) (3,557) (679) — (182) 45 (4,373) (4,313)
Total benefits and expenses 11,894 8,699 2,976 2,349 627 26,545 25,128
Income tax expense (benefit) 197 (381) 453 51 (18) 302 619
Preferred shareholders’ dividends — — — — 93 93 96
Participating policyholders’ income and non-controlling interests in net income of subsidiaries 213 4 — 28 — 245 245
Reported net income (loss) 963 308 653 326 (101) 2,149 2,485
(1) Includes net transfer to (from) segregated funds, premium taxes and interest expense.
SLF Canada Revenue was $13.3 billion in 2017, an increase of $1.1 billion from 2016, primarily due to higher net premiums in Individual and GB, increases in the fair value of FVTPL assets and increased fee income from Individual and GRS.
SLF U.S. Revenue for the year ended December 31, 2017 was US$6.6 billion ($8.63 billion), an increase of US$0.6 billion from 2016, primarily due to an increase in net investment income of US$0.3 billion combined with an increase in net premiums of US$0.3 billion. The increase in net investment income was largely due to increases in the fair value of FVTPL assets. The increase in net premiums was driven by growth in all business units.
SLF Asset Management Revenue for the year ended December 31, 2017 was $4.1 billion, compared to $3.9 billion in 2016. The increase was primarily due to the higher fee income in MFS, partially offset by the currency impact from the change in the Canadian dollar.
SLF Asia SLF Asia’s revenue was $2.8 billion in 2017 compared to $3.0 billion in 2016 largely due to lower net premiums in Hong Kong and the currency impact from the change in the Canadian dollar, partially offset by increases in the fair value of FVTPL assets in 2017.
ii. Revenue Revenue includes: (i) premiums received on life and health insurance policies and fixed annuity products, net of premiums ceded to reinsurers; (ii) net investment income comprised of income earned on general fund assets, realized gains and losses on AFS assets and changes in the value of derivative instruments and assets designated as FVTPL and currency changes on assets and liabilities; and (iii) fee income received for services provided. Premium and deposit equivalents from ASO, as well as deposits received by the Company on investment contracts such as segregated funds, mutual funds and managed funds are not included in revenue; however, the Company does receive fee income from these contracts, which is included in revenue. Fee income and ASO premium and deposit equivalents are an important part of our business and as a result, revenue does not fully represent sales and other activity taking place during the respective periods.
Net investment income can experience volatility arising from the quarterly fluctuation in the value of FVTPL assets and foreign currency changes on assets and liabilities, which may in turn affect the comparability of revenue from period to period. The change in fair value of FVTPL assets is driven largely by market related factors such as interest rates, credit spreads and equity returns. The debt and equity securities that support insurance contract liabilities are generally designated as FVTPL and changes in fair values of these assets are recorded in net investment income in our Consolidated Statements of Operations. Changes in the fair
68 Sun Life Financial Inc. Annual Report 2017 Management’s Discussion and Analysis

values of the FVTPL assets supporting insurance contract liabilities are largely offset by a corresponding change in the liabilities.
Revenue ($ millions) 2017 2016 2015
Premiums
Gross
Life insurance 8,831 8,894 7,462
Health insurance 8,519 7,909 6,474
Annuities 2,488 2,624 2,888
19,838 19,427 16,824
Ceded
Life insurance (1,659) (1,772) (1,962)
Health insurance (2,554) (2,247) (4,093)
Annuities (344) (360) (374)
(4,557) (4,379) (6,429)
Net premiums 15,281 15,048 10,395
Net investment income (loss) Interest and other investment income 5,413 5,489 5,288
Fair value(1) and foreign currency changes on assets and liabilities 2,603 2,233 (1,961)
Net gains (losses) on AFS assets 195 223 228
Net investment income (loss) 8,211 7,945 3,555
Fee income 5,842 5,580 5,324
Total revenue 29,334 28,573 19,274
Adjusted revenue(2) 30,129 29,098 26,268 (1) Represents the change in fair value of fair value through profit or loss (“FVTPL”) assets and liabilities. (2) Adjusted revenue is a non-IFRS financial measure that excludes from revenue the impact of Constant Currency Adjustment, FV Adjustment and Reinsurance in SLF
Canada’s Group Operations Adjustment as described in section L - Non-IFRS Financial Measures in this document.
Revenue of $29.3 billion in 2017 was up $0.7 billion from revenue of $28.6 billion in 2016. The increase was primarily driven by higher net premium revenue in SLF Canada and SLF U.S., increased net gains in the fair value of FVTPL assets largely due to slightly lower interest rates and tightening credit spreads in 2017, as well as higher fee income from SLF Asset Management, SLF Canada and SLF Asia, partially offset by lower net premium revenue in SLF Asia and currency impact from the change in the Canadian dollar. The strengthening of the Canadian dollar relative to average exchange rates in 2016 decreased revenue by $412 million. Adjusted revenue in 2017 was $30.1 billion, an increase of $1.0 billion from 2016. The increase in adjusted revenue was primarily attributable to higher net premium revenue in SLF Canada and SLF U.S., increased fee income from SLF Asset Management, SLF Canada and SLF Asia, partially offset by lower net premium revenue in SLF Asia.
Gross premiums were $19.8 billion in 2017, up from $19.4 billion in 2016. The increase of $0.4 billion in gross premiums was primarily driven by increases in GB and Individual Insurance in SLF Canada, partially offset by decreases in Hong Kong in SLF Asia and the currency impact from the strengthening Canadian dollar.
Ceded premiums in 2017 were $4.6 billion, compared to $4.4 billion from 2016. The increase of $0.2 billion was primarily attributable to increases in GB in SLF Canada, partially offset by the net impact of recapturing certain reinsurance treaties in In-force management in SLF U.S. The impact of the ceded premiums was largely offset in recovered claims and benefits that were recorded as reinsurance recoveries in our Consolidated Statements of Operations.
Net investment income in 2017 was $8.2 billion, up $0.3 billion from $7.9 billion in 2016. The increase in net investment income was primarily due to increases in the fair value of FVTPL assets compared to the prior year in SLF Canada, SLF U.S. and SLF Asia.
Fee income was $5.8 billion in 2017, compared to $5.6 billion in 2016. The increase was mainly driven by increased fee income in SLF Asset Management, SLF Canada and SLF Asia, partially offset by the currency impact from the strengthening Canadian dollar.
iii. Benefits and Expenses Total benefits and expenses were $26.5 billion in 2017, up $1.4 billion from $25.1 billion in 2016.
($ millions) 2017 2016 2015
Benefits and Expenses Gross claims and benefits paid 15,353 15,210 14,086
Changes in insurance/investment contract liabilities(1) 6,189 5,511 727
Reinsurance expenses (recoveries) (4,373) (4,313) (6,146)
Commissions 2,403 2,372 2,100
Operating expenses 6,410 6,000 5,037
Other(2) 563 348 571
Total benefits and expenses 26,545 25,128 16,375 (1) Includes increase (decrease) in insurance contract liabilities, decrease (increase) in reinsurance assets, increase (decrease) in investment contract liabilities. (2) Other includes net transfer to (from) segregated funds, premium taxes and interest expense.
Management’s Discussion and Analysis Sun Life Financial Inc. Annual Report 2017 69
Gross claims and benefits paid in 2017 were $15.4 billion, up $0.1 billion from 2016 primarily as a result of increases in GB in SLF Canada, partially offset by the currency impact from the strengthening Canadian dollar.
Changes in insurance/investment contract liabilities and reinsurance assets of $6.2 billion, increased by $0.7 billion over 2016. The change was primarily attributable to an increase in the fair value of assets supporting insurance contract liabilities in 2017.
Commission expenses of $2.4 billion in 2017 remained largely unchanged from 2016.
Operating expenses of $6.4 billion in 2017 were $0.4 billion higher than 2016. Expenses increased primarily as a result of SLF Asset Management, SLF Canada, SLF Asia, the acquisition of the U.S. employee benefits business in 2016 and a one-time restructuring cost of $60 million. Offsetting these increases is a currency impact of $102 million from the strengthening of the Canadian dollar. Additional information on operating expenses can be found in Note 18 in our 2017 Annual Consolidated Financial Statements.
Other expenses of $0.6 billion were up $0.3 billion from 2016 primarily as a result of a decrease in net transfers from segregated funds.
iv. Taxes
Income Taxes In 2017, we had an income tax expense of $302 million on reported net income before taxes of $2,789 million, which resulted in an effective income tax rate of 10.8%. This compares to an income tax expense of $619 million on reported net income before taxes of $3,445 million and an effective income tax rate of 18.0% in 2016.
On an underlying basis(1), in 2017, we had an income tax expense of $692 million on our underlying net income before taxes of $3,381 million, representing an effective income tax rate of 20.5%. This compares to an income tax expense of $653 million on our underlying net income before taxes of $3,129 million and an effective income tax rate of 20.9% in 2016.
See section D - Profitability - vi - Income taxes for additional information on our effective tax rates for 2017.
Other Taxes In addition to income taxes, we pay various indirect taxes in jurisdictions in which we carry on business. Indirect taxes include premium taxes, investment income tax, payroll related taxes, property taxes, sales taxes, business taxes and other taxes, as follows:
($ millions) 2017 2016
Income tax expense 302 619
Indirect taxes
Premium taxes (net of premium taxes on ceded business)(1) 350 312
Payroll taxes 156 154
Property taxes 127 134
Goods and services tax (GST), harmonized tax (HST) and other sales taxes 118 103
Business taxes and other 24 18
Total indirect taxes 775 721
Total taxes 1,077 1,340
Reported effective income tax rate 10.8% 18.0%
Total taxes as a percentage of net income before deduction of total taxes 30.2% 32.2%
(1) Premium taxes include investment income tax.
2. Items related to Statement of Financial Position i. Changes in Liabilities and Shareholders’ Equity Insurance contract liabilities balances before Other policy liabilities and assets of $111.1 billion as at December 31, 2017 increased by $2.6 billion compared to December 31, 2016, mainly due to balances arising from new policies and changes in balances on in-force policies (which include fair value changes on FVTPL assets supporting insurance contract liabilities) including the increase as a result of the U.S. tax reform as described in section D - Profitability - iv - U.S. tax reform, partially offset by the currency impact of the strengthening of the Canadian dollar relative to exchange rates at December 31, 2016.
Shareholders’ equity, including preferred share capital, was $22.3 billion as at December 31, 2017, compared to $22.0 billion as at December 31, 2016. The $0.3 billion increase in shareholders’ equity was primarily due to: (i) shareholders’ net income of $2.2 billion in 2017, before preferred share dividends of $93 million; (ii) revaluation surplus from the transfer to investment properties of our former head office location of $139 million; (iii) net unrealized gains on AFS assets in OCI of $135 million; and (iv) $15 million from stock options exercised and $3 million from stock-based compensation; partially offset by (v) common share dividend payments of $1,066 million; (vi) a decrease of $730 million from the change of the Canadian dollar relative to exchange rates at the end of the fourth quarter of
2016; (vii) a decrease of $175 million from the repurchase and cancellation of common shares; (viii) changes in the remeasurement of defined benefit plans of $69 million; and (ix) a decrease of $31 million from OCI of joint ventures and associates.
(1) Our effective income tax rate on underlying net income is calculated using underlying net income and income tax expense associated with underlying net income, which excludes amounts attributable to participating policyholders.
70 Sun Life Financial Inc. Annual Report 2017 Management’s Discussion and Analysis

ii. Off-Balance Sheet Arrangements In the normal course of business, we are engaged in a variety of financial arrangements. The principal purposes of these arrangements are to earn management fees and additional spread on a matched book of business and to reduce financing costs.
While most of these activities are reflected on our balance sheet with respect to assets and liabilities, certain of them are either not recorded on our balance sheet or are recorded on our balance sheet in amounts that differ from the full contract or notional amounts. The types of off-balance sheet activities we undertake primarily include asset securitizations and securities lending.
Asset Securitizations In the past, we sold mortgage or bond assets to non-consolidated structured entities, which may also purchase investment assets from third parties. Our securitized AUM held by these non-consolidated structured entities were $1 million as at December 31, 2017, compared to $2 million as at December 31, 2016.
However, the majority of our securitization activities are recorded on our Consolidated Statements of Financial Position. We securitize multi-residential mortgages under the National Housing Act Mortgage-Backed Securities program sponsored by the CMHC. The securitization of the multi-residential mortgages with the CMHC does not qualify for de-recognition and remains on our Consolidated Statements of Financial Position. Additional information on this program can be found in Note 5 to our 2017 Annual Consolidated Financial Statements.
Securities Lending We lend securities in our investment portfolio to other institutions for short periods to generate additional fee income. We conduct our program only with well-established, reputable banking institutions that carry a minimum credit rating of “AA”. Collateral, which exceeds the fair value of the loaned securities, is deposited by the borrower with a lending agent, usually a securities custodian, and maintained by the lending agent until the underlying security has been returned to us. We monitor the fair value of the loaned securities on a daily basis with additional collateral obtained or refunded as the fair value fluctuates. Certain arrangements allow us to invest the cash collateral received for the securities loaned. Loaned securities are recognized in our Consolidated Statements of Financial Position as Invested Assets. As at December 31, 2017, we loaned securities with a carrying value of $1.5 billion for which the collateral held was $1.5 billion. This compares to loaned securities of $1.5 billion, with collateral of $1.6 billion as at December 31, 2016.
iii. Goodwill and Intangibles Impairment The Company completed its annual goodwill and indefinite life intangible asset impairment testing in the fourth quarter of 2017. There were no goodwill impairment charges in 2017 or 2016. No impairment charges on intangible assets were recognized in 2017 or 2016.
iv. Commitments, Guarantees, Contingencies and Reinsurance Matters In the normal course of business, we enter into leasing agreements, outsourcing arrangements and agreements involving indemnities to third parties. We are also engaged in arbitration proceedings from time to time with certain companies that have contracts to provide reinsurance to the Company. Information regarding our commitments, guarantees and contingencies are summarized in Note 23 to our 2017 Annual Consolidated Financial Statements. A table summarizing our significant financial liabilities and contractual obligations can be found in this MD&A in the section J - Risk Management - 8 - Risk Categories - vi Liquidity Risk.
3. Fourth Quarter 2017 Profitability The following table reconciles our net income measures and sets out the impact that other notable items had on our net income in the fourth quarter of 2017 and 2016. All factors discussed in this document that impact our underlying net income are also applicable to reported net income.
Q4’17 Q4’16
($ millions, after-tax)
Reported net income 207 728
Market related impacts(1) (57) 162
Assumption changes and management actions(1)(2) (34) 10
Other adjustments(1) (92) (4)
U.S. tax reform(2) (251) —
Underlying net income(3) 641 Reported ROE(3) 4.1% 14.8%
Underlying ROE(3) 12.7% 11.4%
Experience related items(4)
Impact of investment activity on insurance contract liabilities 15 15
Mortality 11 (4)
Morbidity 10 (13)
Credit 23 22
Lapse and other policyholder behaviour (12) (7)
Expenses (57) (76)
Other 4 22 (1) See section L - Non-IFRS Financial Measures in this document for a breakdown of components within this adjustment. (2) U.S. tax reform of $(251) million includes $(288) million ($(444) million pre-tax) of ACMA, which is excluded from the ACMA of $(34) million. (3) Represents a non-IFRS financial measure. See section L - Non-IFRS Financial Measures in this document. (4) Experience related items reflect the difference between actual experience during the reporting period and best estimate assumptions used in the determination of our
insurance contract liabilities.
Management’s Discussion and Analysis Sun Life Financial Inc. Annual Report 2017 71
560

Reported net income was $207 million in the fourth quarter of 2017 compared to $728 million in the fourth quarter of 2016. Underlying net income was $641 million compared to $560 million in the fourth quarter of 2016. Reported net income compared to the fourth quarter of 2016 reflected mainly driven by the unfavourable impact of the U.S. tax reform, the restructuring charge, and the impact from interest rates. Underlying net income compared to the fourth quarter of 2016 reflected the growth in our wealth businesses and favourable morbidity and mortality experience.
In the fourth quarter of 2017, our effective tax rates on reported net income and underlying net income were (36.7)% and 21.5%, respectively.
Performance by Business Group - Fourth Quarter We manage our operations and report our financial results in five business segments. The following section describes the operations and financial performance of SLF Canada, SLF U.S., SLF Asset Management, SLF Asia and Corporate.
The following table sets out the differences between our reported net income (loss) and underlying net income (loss) by business segment.
Q4’17 Q4’16
SLF SLF Asset ($ millions, after-tax) Canada SLF U.S. Management SLF Asia Corporate Total Total
Reported net income (loss) 172 (25) 114 83 (137) 207 728
Market related impacts(1) (38) (19) — — — (57) 162
Assumption changes and management actions(1)(3) (24) (3) — 3 (10) (34) 10
Other adjustments(1) 2 (10) (34) — (50) (92) (4)
U.S. tax reform(3) — (119) (78) — (54) (251) —
Underlying net income (loss)(2) 232 126 226 80 (23) 641 560
(1) See section L - Non-IFRS Financial Measures in this document for a breakdown of components within this adjustment. (2) Represents a non-IFRS financial measure. See section L - Non-IFRS Financial Measures in this document. (3) U.S. tax reform of $(251) million includes $(288) million ($(444) million pre-tax) of ACMA, which is excluded from the ACMA of $(34) million.
SLF Canada SLF Canada’s reported net income was $172 million in the fourth quarter of 2017, compared to $398 million in the fourth quarter of 2016. Underlying net income in the fourth quarter of 2017 was $232 million, compared to $243 million in the fourth quarter of 2016. Reported net income in the fourth quarter of 2017 compared to the fourth quarter of 2016 reflected unfavourable market related impacts primarily driven by interest rates and lower equity market gains partially offset by real estate appreciation, and the unfavourable impact of ACMA in the fourth quarter of 2017 within Individual Insurance & Wealth. Underlying net income in the fourth quarter of 2017 decreased compared to the fourth quarter of 2016 due to the release of a litigation provision which increased 2016 underlying net income.
SLF U.S. SLF U.S.‘s reported net loss was US$19 million ($25 million) in the fourth quarter of 2017, compared to net income of US$80 million ($106 million) in the fourth quarter of 2016. Underlying net income was US$99 million ($126 million) in the fourth quarter of 2017, compared to US$65 million ($87 million) in the fourth quarter of 2016. The impact from the movement of the Canadian dollar in the fourth quarter of 2017 relative to average exchange rates in the fourth quarter of 2016 decreased underlying net income by $6 million.
Reported net loss in the fourth quarter of 2017 compared to reported net income in the fourth quarter of 2016 reflected the unfavourable impact of the U.S. tax reform and market related impacts driven by interest rates, largely in In-force Management.
Underlying net income was up 52% in U.S. dollars from the fourth quarter 2016 resulting in after-tax profit margin for Group Benefits(1) to increase to 5.0% from 3.5% for the comparable period in 2016. This reflects our improved underwriting experience in the group life and disability businesses, as our pricing actions, investments in claims management and expense initiatives, as well as progress on the integration of the U.S. employee benefits business acquired in 2016, continue to progress. These results also reflected more favourable mortality experience in In-force Management, partially offset by lapse and other policyholder experience in In-force Management.
SLF Asset Management SLF Asset Management’s reported net income was $114 million in the fourth quarter of 2017, compared to $198 million in the fourth quarter of 2016 and underlying net income of $226 million in the fourth quarter of 2017, compared to $188 million in the fourth quarter of 2016. SLF Asset Management’s reported and underlying net income increased in the fourth quarter of 2017 compared to the same period in 2016 primarily due to MFS’s results, as described below. The impact from the movement of the Canadian dollar in the fourth quarter of 2017 relative to average exchange rates in the fourth quarter of 2016 decreased reported net income and underlying net income by $6 million and $11 million, respectively.
MFS’s reported net income was US$72 million in the fourth quarter of 2017, compared to US$142 million in the fourth quarter of 2016. MFS’s reported net income compared to the fourth quarter of 2016 reflects the charge related to the U.S. tax reform and the Fair value adjustments on MFS’s share-based payment awards. MFS’s underlying net income was US$174 million in the fourth quarter of 2017, compared to US$135 million in the fourth quarter of 2016, primarily due to higher average net assets and lower taxes. MFS’s pre-tax operating profit margin ratio was 40% in the fourth quarter of 2017, up from 35% in the fourth quarter of 2016.
(1) Based on underlying net income, on a trailing four quarters basis, and which is described in section L - Non-IFRS Financial Measures in this document.
72 Sun Life Financial Inc. Annual Report 2017 Management’s Discussion and Analysis

SLIM’s reported net income and underlying net income was C$23 million in the fourth quarter of 2017, compared to C$9 million in the fourth quarter of 2016.
SLF Asia SLF Asia’s reported net income was $83 million in the fourth quarter of 2017, compared to $58 million in the fourth quarter of 2016. Underlying net income was $80 million, compared to $62 million in the fourth quarter of 2016. The impact from the movement of the Canadian dollar in the fourth quarter of 2017 relative to average exchange rates in the fourth quarter of 2016 reduced both reported net income and underlying net income by $5 million, respectively.
Reported net income in the fourth quarter of 2017 compared to the fourth quarter of 2016 reflected favourable impact of ACMA, partially offset by less favourable market related impacts, primarily driven by interest rate changes. Underlying net income in the fourth quarter of 2017, compared to the fourth quarter of 2016, reflected growth in fee income business and contribution from our joint ventures.
Corporate Corporate had reported net loss of $137 million in the fourth quarter of 2017, compared to reported loss of $32 million in the fourth quarter of 2016. Underlying net loss was $23 million, compared to underlying net loss of $20 million in the fourth quarter of 2016. The impact from the movement of the Canadian dollar relative to average exchange rates in the fourth quarter of 2017 relative to average exchange rates in the fourth quarter of 2016 increased reported net income by $1 million.
SLF’s United Kingdom business unit’s (“SLF U.K.”) reported net income was $6 million in the fourth quarter of 2017, compared to $26 million in the fourth quarter of 2016. SLF U.K.‘s reported net income compared to the fourth quarter of 2016 reflected impacts from the treatment of policyholder tax losses, ACMA, and a lower level of gains from investing activity on insurance contract liabilities, partially offset by favourable mortality.
Corporate Support had a reported net loss of $143 million in the fourth quarter of 2017, compared to an reported net loss of $58 million in the fourth quarter of 2016. Net loss in the fourth quarter of 2017 increased relative to the same period in 2016, was primarily due to the impact of the U.S. tax reform and the Company’s plan to enhance business processes and organizational structures and capabilities.
Growth - Fourth Quarter Revenue for the fourth quarter of 2017 was $8.6 billion, compared to $2.4 billion in the fourth quarter of 2016. Revenues increased primarily as a result of the increases in the fair value of FVTPL assets largely due to the decreases in interest rates in the fourth quarter in 2017 compared to increases in interest rates in the same period last year and also impacts from interest rates derivatives. The currency impact from the change in the Canadian dollar relative to average exchange rates in the fourth quarter of 2016 decreased revenue by $198 million. Adjusted revenue was $8.0 billion for the fourth quarter of 2017, largely unchanged from the fourth quarter of 2016.
Premiums and deposits were $41.0 billion for the quarter ended December 31, 2017, compared to $42.4 billion for the quarter ended December 31, 2016. The decrease was primarily driven by currency impact of $1.7 billion from the strengthening Canadian dollar, lower segregated fund deposits and decreased net premium revenue, partially offset by higher fund sales. Total adjusted premiums and deposits in the fourth quarter of 2017 were up $0.3 billion compared to the same period in the prior year. The increase was mainly due to higher fund sales, partially offset by lower segregated fund deposits and net premium revenue.
Management’s Discussion and Analysis Sun Life Financial Inc. Annual Report 2017 73

4. Previous Quarters The following table provides a summary of our results for the eight most recently completed quarters. A more complete discussion of our historical quarterly results can be found in our interim and annual MD&As for the relevant periods.
Quarterly results
($ millions, unless otherwise noted) Q4’17 Q3’17 Q2’17 Q1’17 Q4’16 Q3’16 Q2’16 Q1’16
Total revenue 8,648 5,555 8,122 7,009 2,366 7,892 9,533 8,782
Common shareholders’ net income (loss)
Reported 207 817 574 551 728 737 480 540
Underlying(1) 641 643 689 573 560 639 554 582
Diluted EPS ($)
Reported 0.34 1.32 0.93 0.89 1.18 1.20 0.78 0.88
Underlying(1) 1.05 1.05 1.12 0.93 0.91 1.04 0.90 0.95
Basic reported EPS ($)
Reported 0.34 1.33 0.93 0.90 1.19 1.20 0.78 0.88
Reported net income (loss) by segment
SLF Canada 172 340 185 266 398 184 185 169
SLF U.S. (25) 195 101 37 106 253 54 95
SLF Asset Management 114 185 183 171 198 181 173 177
SLF Asia 83 93 77 73 58 92 68 91
Corporate (137) 4 28 4 (32) 27 — 8
Total reported net income (loss) 207 817 574 551 728 737 480 540
Underlying net income (loss) by segment(1)
SLF Canada(1) 232 222 266 229 243 226 200 218
SLF U.S.(1) 126 161 143 77 87 135 114 111
SLF Asset Management(1) 226 204 199 183 188 188 153 170
SLF Asia(1) 80 90 81 79 62 80 85 68
Corporate(1) (23) (34) — 5 (20) 10 2 15
Total underlying net income (loss)(1) 641 643 689 573 560 639 554 582
(1) Represents a non-IFRS financial measure. See section L - Non-IFRS Financial Measures in this document.
Third Quarter 2017 Reported net income was $817 million in the third quarter of 2017, reflecting favourable market related activity primarily driven by interest rates and changes in the fair values of real estate, and favourable impact of ACMA, partially offset by the unfavourable impact of the movement of the Canadian dollar and other adjustments compared to the third quarter of 2016. Underlying net income was $643 million, reflecting favourable mortality experience, growth in fee income on our wealth businesses and new business gains, partially offset by a lower level of gains from investing activity.
Second Quarter 2017 Reported net income was $574 million in the second quarter of 2017, reflecting the unfavourable effect of market related impacts driven by interest rate changes, the unfavourable impact of acquisition, integration and restructuring amounts, fair value adjustments on MFS’s share-based payment awards, and certain hedges in SLF Canada that do not qualify for hedge accounting. Reported net income also reflected the factors discussed in underlying net income. Underlying net income was $689 million, reflecting business growth, gains from investing activity on insurance contract liabilities, positive credit experience and favourable morbidity and mortality experience, partially offset by unfavourable lapse and other policyholder experience, unfavourable expense experience, including investment in growing our businesses, and unfavourable other experience.
First Quarter 2017 Reported net income was $551 million in the first quarter of 2017, reflecting the favourable effect of market related impacts partially offset by the unfavourable impact of acquisition, integration and restructuring amounts and fair value adjustments on MFS’s share-based payment awards. Reported net income also reflected the factors discussed in underlying net income. Underlying net income was $573 million, reflecting favourable mortality experience in SLF Canada and SLF U.K. and gains from investing activities on insurance contract liabilities, partially offset by lapse and other policyholder behaviour experience and unfavourable mortality experience in SLF U.S.
Fourth Quarter 2016 Reported net income was $728 million in the fourth quarter of 2016, reflecting favourable interest rate impacts. Reported net income also reflected factors discussed in underlying net income. Underlying net income was $560 million, reflecting positive credit experience and a lower level of gains from investing activity on insurance contract liabilities. This was partially offset by unfavourable expense experience, reflecting incentive compensation costs arising from overall strong business performance and investment in growing our businesses. We also experienced unfavourable morbidity results mainly in the U.S.
74 Sun Life Financial Inc. Annual Report 2017 Management’s Discussion and Analysis

Third Quarter 2016 Reported net income was $737 million in the third quarter of 2016, reflecting favourable equity markets, interest rates, and ACMA. Reported net income also reflected factors discussed in underlying net income. Underlying net income was $639 million, reflecting higher levels of gains from investment activities on insurance contract liabilities, positive credit experience, and other experience items. This was partially offset by mortality and expense experience, including investment in growing our businesses.
Second Quarter 2016 Reported net income was $480 million in the second quarter of 2016, reflecting unfavourable impact of interest rates. Reported net income also reflected factors discussed in underlying net income. Underlying net income was $554 million, reflecting unfavourable morbidity experience, mainly in SLF U.S. Group Benefits notably from the stop-loss insurance business, and expense experience including investment in growing our businesses. This was partially offset by gains from investment activity on insurance contract liabilities and positive credit experience.
First Quarter 2016 Reported net income was $540 million in the first quarter of 2016, reflecting unfavourable impacts from interest rates and equity markets. Reported net income also reflected factors discussed in underlying net income. Underlying net income was $582 million, reflecting favourable impact of strong investing activities and positive morbidity experience.
L. Non-IFRS Financial Measures
i. Updates to Non-IFRS Measures
Beginning in 2017, we stopped reporting operating net income and its related measures, operating earnings per share (“EPS”) and operating return on equity (“ROE”), in order to streamline our use of non-IFRS financial measures. The adjustments previously used to derive operating net income will continue to be used to derive underlying net income.
ii. Underlying Net Income and Underlying EPS
Underlying net income (loss) and financial measures based on underlying net income (loss), including underlying EPS or underlying loss per share, and underlying ROE, are non-IFRS financial measures. Underlying net income (loss) removes from reported net income (loss) the impact of the following items that create volatility in our results under IFRS and when removed assist in explaining our results from period-to-period: (a) market related impacts, which include: (i) impact of returns in equity markets, net of hedging, above or below our best estimate
assumptions of approximately 2% per quarter in the reporting period. Equity market impact also includes the impact of the basis risk inherent in our hedging program, which is the difference between the return on underlying funds of products that provide benefit guarantees and the return on the derivative assets used to hedge those benefit guarantees; (ii) the impact of changes in interest rate that differ from our best estimate assumptions in the reporting period and on the value of derivative instruments used in our hedging programs including changes in credit and swap spreads, and any changes to the assumed fixed income reinvestment rates in determining the actuarial liabilities; and (iii) the impact of changes in the fair value of investment properties in the reporting period.
(b) assumption changes and management actions, which include: (i) the impact of revisions to the methods and assumptions used in determining our liabilities for insurance contracts and investment contracts and (ii) the impact on insurance contracts and investment contracts of actions taken by management in the current reporting period, referred to as management actions which include, for example, changes in the prices of in-force products, new or revised reinsurance on in-force business, and material changes to investment policies for assets supporting our liabilities;
(c) Other adjustments:
(i) certain hedges in SLF Canada that do not qualify for hedge accounting - this adjustment enhances the comparability of our net income from period to period, as it reduces volatility to the extent it will be offset over the duration of the hedges;
(ii) fair value adjustments on MFS’s share-based payment awards, that are settled with MFS’s own shares and accounted for as liabilities and measured at fair value each reporting period until they are vested, exercised and repurchased - this adjustment enhances the comparability of MFS’s results with publicly traded asset managers in the United States;
(iii) acquisition, integration and restructuring amounts (including impacts related to acquiring and integrating acquisitions); and (iv) other items that are unusual or exceptional in nature.
All factors discussed in this document that impact our underlying net income are also applicable to reported net income.
All EPS measures in this document refer to fully diluted EPS, unless otherwise stated. As noted above, underlying EPS excludes the dilutive impact of convertible instruments.
Management’s Discussion and Analysis Sun Life Financial Inc. Annual Report 2017 75

The following table sets out the amounts that were excluded from our underlying net income (loss) and underlying EPS, and provides a reconciliation to our reported net income (loss) and EPS based on IFRS. A reconciliation of our underlying net income to our reported net income for the fourth quarters of 2017 and 2016 is provided in this MD&A in section K - Additional Financial Disclosure - 3 - Fourth Quarter 2017 Profitability.
Reconciliations of Select Net Income Measures
($ millions, unless otherwise noted) 2017 2016 2015
Reported net income 2,149 2,485 2,185
Equity market impact
Impact from equity market changes 68 62 (99)
Basis risk impact (6) (11) (29)
Equity market impact 62 51 (128)
Interest rate impact
Impact of interest rate changes (79) 45 3
Impact of credit spread movements (54) (41) 33
Impact of swap spread movements (24) 30 29
Interest rate impact(1) (157) 34 65
Impact of changes in the fair value of investment properties 88 22 20
Market related impacts(3) (7) 107 (43)
Assumption changes and management actions(2)(3) 81 45 (9)
Other adjustments:
Certain hedges in SLF Canada that do not qualify for hedge accounting (16) (5) 21
Fair value adjustments on MFS’s share-based payment awards (81) 30 (9)
Acquisition, integration and restructuring (123) (27) (80)
Total of other adjustments (220) (2) (68)
U.S. tax reform(2) (251) — —
Underlying net income 2,546 2,335 2,305
Reported EPS (diluted) ($) 3.49 4.03 3.55
Market related impacts ($) (0.01) 0.18 (0.07)
Assumption changes and management actions ($) 0.13 0.07 (0.01)
Certain hedges in SLF Canada that do not qualify for hedge accounting ($) (0.03) (0.01) 0.03
Fair value adjustments on MFS’s share-based payment awards ($) (0.13) 0.05 (0.01)
Acquisition, integration and restructuring ($) (0.20) (0.04) (0.13)
U.S. tax reform ($) (0.41) — —
Impact of convertible securities on diluted EPS ($) (0.01) (0.02) (0.02)
Underlying EPS (diluted) ($) 4.15 3.80 3.76
(1) Our exposure to interest rates varies by product type, line of business, and geography. Given the long-term nature of our business, we have a higher degree of sensitivity in respect of interest rates at long durations.
(2) U.S. tax reform of $(251) million includes $(288) million ($(444) million pre-tax) of ACMA, which is excluded from the ACMA of $81 million. (3) See section L - Non-IFRS Financial Measures in this document for a breakdown of components within this adjustment.
The following table shows the pre-tax amount of underlying net income adjustments:
($ millions, unless otherwise noted) 2017 2016 2015
Reported net income (after tax) 2,149 2,485 2,185
Underlying net income adjustments (pre-tax):
Market related impacts(1) (79) 67 9
Assumption changes and management actions(1)(2) (61) 10 (54)
Other adjustments(1) (297) (40) (85)
U.S. tax reform(2) (444) — —
Total underlying net income adjustments (pre-tax) (881) 37 (130)
Tax related to underlying net income adjustments 484 113 10
Underlying net income(3) (after tax) 2,546 2,335 2,305
(1) See section L - Non-IFRS Financial Measures in this document for a breakdown of components within this adjustment. (2) U.S. tax reform of $(444) million (pre-tax) is shown separately, and is excluded from ACMA of $(61) million (pre-tax). (3) Represents a non-IFRS financial measure. See section L - Non-IFRS Financial Measures in this document.
Tax related to underlying net income adjustments may vary from the expected effective tax rate range reflecting the mix of business based on the Company’s international operations. The aggregate tax effect depends on whether the underlying adjustment increases and reductions to pre-tax income occurred in high or low tax jurisdictions.
76 Sun Life Financial Inc. Annual Report 2017 Management’s Discussion and Analysis
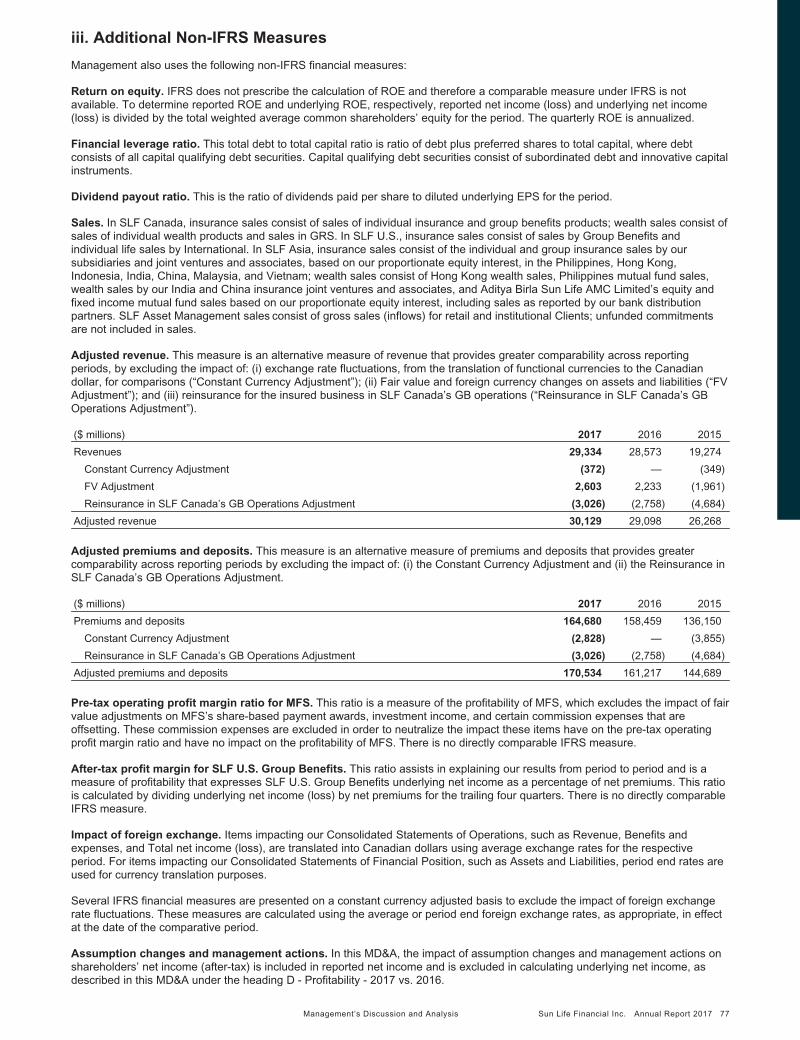
iii. Additional Non-IFRS Measures Management also uses the following non-IFRS financial measures:
Return on equity. IFRS does not prescribe the calculation of ROE and therefore a comparable measure under IFRS is not available. To determine reported ROE and underlying ROE, respectively, reported net income (loss) and underlying net income (loss) is divided by the total weighted average common shareholders’ equity for the period. The quarterly ROE is annualized.
Financial leverage ratio. This total debt to total capital ratio is ratio of debt plus preferred shares to total capital, where debt consists of all capital qualifying debt securities. Capital qualifying debt securities consist of subordinated debt and innovative capital instruments.
Dividend payout ratio. This is the ratio of dividends paid per share to diluted underlying EPS for the period.
Sales. In SLF Canada, insurance sales consist of sales of individual insurance and group benefits products; wealth sales consist of sales of individual wealth products and sales in GRS. In SLF U.S., insurance sales consist of sales by Group Benefits and individual life sales by International. In SLF Asia, insurance sales consist of the individual and group insurance sales by our subsidiaries and joint ventures and associates, based on our proportionate equity interest, in the Philippines, Hong Kong, Indonesia, India, China, Malaysia, and Vietnam; wealth sales consist of Hong Kong wealth sales, Philippines mutual fund sales, wealth sales by our India and China insurance joint ventures and associates, and Aditya Birla Sun Life AMC Limited’s equity and fixed income mutual fund sales based on our proportionate equity interest, including sales as reported by our bank distribution partners. SLF Asset Management sales consist of gross sales (inflows) for retail and institutional Clients; unfunded commitments are not included in sales.
Adjusted revenue. This measure is an alternative measure of revenue that provides greater comparability across reporting periods, by excluding the impact of: (i) exchange rate fluctuations, from the translation of functional currencies to the Canadian dollar, for comparisons (“Constant Currency Adjustment”); (ii) Fair value and foreign currency changes on assets and liabilities (“FV Adjustment”); and (iii) reinsurance for the insured business in SLF Canada’s GB operations (“Reinsurance in SLF Canada’s GB Operations Adjustment”).
($ millions) 2017 2016 2015
Revenues 29,334 28,573 19,274
Constant Currency Adjustment (372) — (349)
FV Adjustment 2,603 2,233 (1,961)
Reinsurance in SLF Canada’s GB Operations Adjustment (3,026) (2,758) (4,684)
Adjusted revenue 30,129 29,098 26,268
Adjusted premiums and deposits. This measure is an alternative measure of premiums and deposits that provides greater comparability across reporting periods by excluding the impact of: (i) the Constant Currency Adjustment and (ii) the Reinsurance in SLF Canada’s GB Operations Adjustment.
($ millions) 2017 2016 2015
Premiums and deposits 164,680 158,459 136,150
Constant Currency Adjustment (2,828) — (3,855)
Reinsurance in SLF Canada’s GB Operations Adjustment (3,026) (2,758) (4,684)
Adjusted premiums and deposits 170,534 161,217 144,689
Pre-tax operating profit margin ratio for MFS. This ratio is a measure of the profitability of MFS, which excludes the impact of fair value adjustments on MFS’s share-based payment awards, investment income, and certain commission expenses that are offsetting. These commission expenses are excluded in order to neutralize the impact these items have on the pre-tax operating profit margin ratio and have no impact on the profitability of MFS. There is no directly comparable IFRS measure.
After-tax profit margin for SLF U.S. Group Benefits. This ratio assists in explaining our results from period to period and is a measure of profitability that expresses SLF U.S. Group Benefits underlying net income as a percentage of net premiums. This ratio is calculated by dividing underlying net income (loss) by net premiums for the trailing four quarters. There is no directly comparable IFRS measure.
Impact of foreign exchange. Items impacting our Consolidated Statements of Operations, such as Revenue, Benefits and expenses, and Total net income (loss), are translated into Canadian dollars using average exchange rates for the respective period. For items impacting our Consolidated Statements of Financial Position, such as Assets and Liabilities, period end rates are used for currency translation purposes.
Several IFRS financial measures are presented on a constant currency adjusted basis to exclude the impact of foreign exchange rate fluctuations. These measures are calculated using the average or period end foreign exchange rates, as appropriate, in effect at the date of the comparative period.
Assumption changes and management actions. In this MD&A, the impact of assumption changes and management actions on shareholders’ net income (after-tax) is included in reported net income and is excluded in calculating underlying net income, as described in this MD&A under the heading D - Profitability - 2017 vs. 2016.
Management’s Discussion and Analysis Sun Life Financial Inc. Annual Report 2017 77

Note 10.A of our Annual Consolidated Financial Statements shows the pre-tax impact of method and assumption changes on shareholder and participating policyholder Insurance Contract Liabilities net of reinsurance assets, excluding changes in other policy liabilities and assets.
The MD&A view of assumption changes and management actions is the impact on shareholders’ net income (after tax). The Annual Consolidated Financial Statement view is a component of the change in total company liabilities. The following table provides a reconciliation of the differences between the two measures:
($ millions) 2017 2016 2015
Impact of method and assumption changes on Insurance Contract Liabilities (pre-tax)(1) 173 (35) (311)
Less: Participating Policyholders(2)(7) 181 181 30
Impact of method and assumption changes excluding participating policyholders (pre-tax) (8) (216) (341)
Less: Tax (51) (114) (79)
Impact of method and assumption changes excluding participating policyholders (after-tax) 43 (102) (262)
Add: Management Actions (after-tax)(3) (243) 153 214
Other (after-tax)(4) (7) (6) (2)
Assumption changes and management actions (after-tax)(5)(6)(8) (207) 45 (50)
(1) Note 10.A of our Annual Consolidated Financial Statements shows the pre-tax impact of method and assumption changes on shareholder and participating policyholder Insurance contract liabilities net of reinsurance assets, excluding changes in other policy liabilities and assets. The amount shown in the table above is the shareholders’ income impact related to the amount shown in Note 10.A of our Annual Consolidated Financial Statements.
(2) Adjustment to remove the pre-tax impact of method and assumption changes on amounts attributed to participating policyholders. (3) Adjustment to include the after-tax impact of management actions on insurance contract liabilities and investment contract liabilities which include, for example, changes in
the prices of in-force products, new or revised reinsurance on in-force business, and material changes to investment policies for assets supporting our liabilities. In the second quarter of 2017, management actions were mainly in SLF U.S., primarily comprised of the expected impact of recapturing certain reinsurance treaties and the expected cost of reinsurance in certain other treaties.
(4) Adjustments to include the after-tax impact of method and assumption changes on investment contracts and other policy liabilities. (5) Includes the tax impacts of assumption changes and management actions on insurance contract liabilities and investment contract liabilities, reflecting the tax rates in the
jurisdictions in which we do business. (6) Assumption changes and management actions is included in reported net income and is excluded in calculating underlying net income, in this MD&A under the heading D
Profitability - 2017 vs. 2016. (7) 2017 included an update to the SLF Canada participating individual life business to reflect mortality experience in first quarter of 2017 and $46 million decrease as a result of
the U.S. tax reform in fourth quarter of 2017. (8) During 2017, the impact on reported net income of an increase of $81 million is presented as an adjustment to arrive at underlying net income as Assumption changes and
management actions. The impact on reported net income of a decrease of $288 million ($444 million pre-tax) related to the U.S. tax legislation changes enacted on December 22, 2017, included in the $(207) million above, is included as part of the U.S. tax reform impact that is reported separately as an adjustment to arrive an underlying net income (see section D - Profitability - iv - U.S. tax reform).
Real estate market sensitivities. Real estate market sensitivities are non-IFRS financial measures for which there are no directly comparable measures under IFRS so it is not possible to provide a reconciliation of these amounts to the most directly comparable IFRS measures.
Other. Management also uses the following non-IFRS financial measures for which there are no comparable financial measures in IFRS: (i) ASO premium and deposit equivalents, mutual fund sales, managed fund sales, insurance sales, and total premiums and deposits; (ii) AUM, mutual fund assets, managed fund assets, other AUM, and assets under administration; (iii) the value of new business, which is used to measure the estimated lifetime profitability of new sales and is based on actuarial calculations; and (iv) assumption changes and management actions, which is a component of our sources of earnings disclosure. Sources of earnings is an alternative presentation of our Consolidated Statements of Operations that identifies and quantifies various sources of income. The Company is required to disclose its sources of earnings by its principal regulator, OSFI.
M. Accounting and Control Matters
1. Critical Accounting Policies and Estimates
Our significant accounting and actuarial policies are described in Notes 1, 2, 3, 5, 6, 7 and 10 of our 2017 Annual Consolidated Financial Statements. Management must make judgments involving assumptions and estimates, some of which may relate to matters that are inherently uncertain, under these policies. The estimates described below are considered particularly significant to understanding our financial performance. As part of our financial control and reporting, judgments involving assumptions and estimates are reviewed by the independent auditor and by other independent advisors on a periodic basis. Accounting policies requiring estimates are applied consistently in the determination of our financial results.
Benefits to Policyholders General The liabilities for insurance contracts represent the estimated amounts which, together with estimated future premiums and net investment income, will provide for outstanding claims, estimated future benefits, policyholders’ dividends, taxes (other than income taxes), and expenses on in-force insurance contracts.
In determining our liabilities for insurance contracts, assumptions must be made about mortality and morbidity rates, lapse and other policyholder behaviour, interest rates, equity market performance, asset default, inflation, expenses, and other factors over the life of our products. Most of these assumptions relate to events that are anticipated to occur many years in the future. Assumptions require significant judgment and regular review and, where appropriate, revision.
78 Sun Life Financial Inc. Annual Report 2017 Management’s Discussion and Analysis

We use best estimate assumptions for expected future experience and apply margins for adverse deviations to provide for uncertainty in the choice of the best estimate assumptions. The amount of insurance contract liabilities related to the application of margins for adverse deviations to best estimate assumptions is called a provision for adverse deviations.
Best Estimate Assumptions Best estimate assumptions are intended to be current, neutral estimates of the expected outcome as guided by Canadian actuarial standards of practice. The choice of best estimate assumptions takes into account current circumstances, past experience data (Company and/or industry), the relationship of past to expected future experience, anti-selection, the relationship among assumptions, and other relevant factors. For assumptions on economic matters, the assets supporting the liabilities and the expected policy for asset-liability management are relevant factors.
Margins for Adverse Deviations The appropriate level of margin for adverse deviations on an assumption is guided by Canadian actuarial standards of practice. For most assumptions, the standard range of margins for adverse deviations is 5% to 20% of the best estimate assumption, and the actuary chooses from within that range based on a number of considerations related to the uncertainty in the determination of the best estimate assumption. The level of uncertainty, and hence the margin chosen, will vary by assumption and by line of business and other factors. Considerations that would tend to indicate a choice of margin at the high end of the range include: • The statistical credibility of the Company’s experience is too low to be the primary source of data for choosing the best estimate
assumption • Future experience is difficult to estimate • The cohort of risks lacks homogeneity • Operational risks adversely impact the ability to estimate the best estimate assumption • Past experience may not be representative of future experience and the experience may deteriorate
Provisions for adverse deviations in future interest rates are included by testing a number of scenarios of future interest rates, some of which are prescribed by Canadian actuarial standards of practice, and determining the liability based on the range of possible outcomes. A scenario of future interest rates includes, for each forecast period between the statement of financial position date and the last liability cash flow, interest rates for risk-free assets, premiums for asset default, rates of inflation, and an investment strategy consistent with the Company’s investment policy. The starting point for all future interest rate scenarios is consistent with the current market environment. If few scenarios are tested, the liability would be at least as great as the largest of the outcomes. If many scenarios are tested, the liability would be within a range defined by the average of the outcomes that are above the 60th percentile of the range of outcomes and the corresponding average for the 80th percentile.
Provisions for adverse deviations in future equity returns are included by scenario testing or by applying margins for adverse deviations. In blocks of business where the valuation of liabilities uses scenario testing of future equity returns, the liability would be within a range defined by the average of the outcomes that are above the 60th percentile of the range of outcomes and the corresponding average for the 80th percentile. In blocks of business where the valuation of liabilities does not use scenario testing of future equity returns, the margin for adverse deviations on common share dividends is between 5% and 20%, and the margin for adverse deviations on capital gains would be 20% plus an assumption that those assets reduce in value by 20% to 50% at the time when the reduction is most adverse. A 30% reduction is appropriate for a diversified portfolio of North American common shares and, for other portfolios, the appropriate reduction depends on the volatility of the portfolio relative to a diversified portfolio of North American common shares.
In choosing margins, we ensure that, when taken one at a time, each margin is reasonable with respect to the underlying best estimate assumption and the extent of uncertainty present in making that assumption, and also that, in aggregate, the cumulative impact of the margins for adverse deviations is reasonable with respect to the total amount of our insurance contract liabilities. Our margins are generally stable over time and are generally only revised to reflect changes in the level of uncertainty in the best estimate assumptions. Our margins tend to be at the high end of the range for expenses and in the mid-range or higher for other assumptions. When considering the aggregate impact of margins, the actuary assesses the consistency of margins for each assumption across each block of business to ensure there is no double counting or omission and to avoid choosing margins that might be mutually exclusive. In particular, the actuary chooses similar margins for blocks of business with similar characteristics, and also chooses margins that are consistent with other assumptions, including assumptions about economic factors. The actuary is guided by Canadian actuarial standards of practice in making these professional judgments about the reasonableness of margins for adverse deviations.
The best estimate assumptions and margins for adverse deviations are reviewed at least annually and revisions are made when appropriate. The choice of assumptions underlying the valuation of insurance contract liabilities is subject to external actuarial peer review.
Critical Accounting Estimates Significant factors affecting the determination of policyholders’ benefits, the methodology by which they are determined, their significance to the Company’s financial condition and results of operations are described below.
Non-fixed Income Market Movements We are exposed to equity markets through our segregated fund products (including variable annuities) that provide guarantees linked to underlying fund performance and through insurance products where the insurance contract liabilities are supported by non-fixed income assets.
For segregated fund products (including variable annuities), we have implemented hedging programs involving the use of derivative instruments to mitigate a large portion of the equity market risk associated with the guarantees. The cost of these hedging programs is reflected in the liabilities. The equity market risk associated with anticipated future fee income is not hedged.
Management’s Discussion and Analysis Sun Life Financial Inc. Annual Report 2017 79

The majority of non-fixed income assets that are designated as FVTPL support our participating and universal life products where investment returns are passed through to policyholders through routine changes in the amount of dividends declared or in the rate of interest credited. In these cases, changes in non-fixed income asset values are largely offset by changes in insurance contract liabilities.
Interest Rates We generally maintain distinct asset portfolios for each major line of business. In the valuation of insurance contract liabilities, the future cash flows from insurance contracts and the assets that support them are projected under a number of interest rate scenarios, some of which are prescribed by Canadian actuarial standards of practice. Reinvestments and disinvestments take place according to the specifications of each scenario, and the liability is set based on the range of possible outcomes.
For certain products, including participating insurance and certain forms of universal life policies and annuities, policyholders share investment performance through routine changes in the amount of dividends declared or in the rate of interest credited. These products generally have minimum interest rate guarantees.
Hedging programs are in place to help mitigate the impact of interest rate movements.
Mortality Mortality refers to the rates at which death occurs for defined groups of people. Life insurance mortality assumptions are generally based on the past five to ten years of experience. Our experience is combined with industry experience where our own experience is insufficient to be statistically valid. Assumed mortality rates for life insurance and annuity contracts include assumptions about future mortality improvement based on recent trends in population mortality and our outlook for future trends.
Morbidity Morbidity refers to both the rates of accident or sickness and the rates of recovery therefrom. Most of our disability insurance is marketed on a group basis. We offer critical illness policies on an individual basis in Canada and Asia, long-term care on an individual basis in Canada, and medical stop-loss insurance is offered on a group basis in the U.S. In Canada, group morbidity assumptions are based on our five-year average experience, modified to reflect any emerging trend in recovery rates. For longterm care and critical illness insurance, assumptions are developed in collaboration with our reinsurers and are largely based on their experience. In the United States, our experience is used for both medical stop-loss and disability assumptions, with some consideration of industry experience.
Policy Termination Rates Policyholders may allow their policies to lapse prior to the end of the contractual coverage period by choosing not to continue to pay premiums or by surrendering their policy for the cash surrender value. Assumptions for lapse experience on life insurance are generally based on our five-year average experience. Lapse rates vary by plan, age at issue, method of premium payment, and policy duration.
Premium Payment Patterns For universal life contracts, it is necessary to set assumptions about premium payment patterns. Studies prepared by industry or the actuarial profession are used for products where our experience is insufficient to be statistically valid. Premium payment patterns usually vary by plan, age at issue, method of premium payment, and policy duration.
Expense Future policy-related expenses include the costs of premium collection, claims adjudication and processing, actuarial calculations, preparation and mailing of policy statements, and related indirect expenses and overhead. Expense assumptions are mainly based on our recent experience using an internal expense allocation methodology. Inflationary increases assumed in future expenses are consistent with the future interest rates used in scenario testing.
Asset Default As required by Canadian actuarial standards of practice, insurance contract liabilities include a provision for possible future default of the assets supporting those liabilities. The amount of the provision for asset default included in the insurance contract liabilities is based on possible reductions in future investment yield that vary by factors such as type of asset, asset credit quality (rating), duration, and country of origin. The asset default assumptions are comprised of a best estimate plus a margin for adverse deviations, and are intended to provide for loss of both principal and income. Best estimate asset default assumptions by asset category and geography are derived from long-term studies of industry experience and the Company’s experience. Margins for adverse deviation are chosen from the standard range (of 25% to 100%) as recommended by Canadian actuarial standards of practice based on the amount of uncertainty in the choice of best estimate assumption. The credit quality of an asset is based on external ratings if available (public bonds) and internal ratings if not (mortgages and loans). Any assets without ratings are treated as if they are rated below investment grade.
In contrast to asset impairment provisions and changes in FVTPL assets arising from impairments, both of which arise from known credit events, the asset default provision in the insurance contract liabilities covers losses related to possible future (unknown) credit events. Canadian actuarial standards of practice require the asset default provision to be determined taking into account known impairments that are recognized elsewhere on the statement of financial position. The asset default provision included in the insurance contract liabilities is reassessed each reporting period in light of impairments, changes in asset quality ratings, and other events that occurred during the period.
80 Sun Life Financial Inc. Annual Report 2017 Management’s Discussion and Analysis

Sensitivities to Best Estimate Assumptions The sensitivities presented below are forward-looking statements. They include measures of our estimated net income sensitivity to changes in the best estimate assumptions in our insurance contract liabilities based on a starting point and business mix as at December 31, 2017 and as at December 31, 2016, reflecting the update of actuarial method and assumption changes described in this MD&A under the heading Assumption Changes and Management Actions and, where appropriate, taking into account hedging programs in place as at December 31, 2017 and December 31, 2016 described in this MD&A under the heading Market Risk. These sensitivities represent the Company’s estimate of changes in best estimate assumptions that are reasonably likely based on the Company’s and/or the industry’s historical experience and industry standards and best practices as at December 31, 2017 and December 31, 2016. We have also disclosed in the table below the impact of 100 and 50 basis point changes in risk free interest rates and 25% and 10% changes in equity markets to illustrate the impact of immediate market shocks.
Changes to the starting point for interest rates, equity market prices and business mix will result in different estimated sensitivities. Additional information regarding equity and interest rate sensitivities, including key assumptions, can be found under the heading J - Risk Management - 8 - Risk Categories - Market Risk Sensitivities in this document. The following table summarizes the impact these sensitivities would have on our net income.
Critical Accounting Estimate Sensitivity 2017 2016
($ millions, after-tax)
Interest Rates 100 basis point parallel decrease in interest rates across the entire yield curve (250) (200)
50 basis point parallel decrease in interest rates across the entire yield curve (100) (100)
50 basis point parallel increase in interest rates across the entire yield curve 50 50
100 basis point parallel increase in interest rates across the entire yield curve 100 50
Equity Markets 25% decrease across all equity markets (300) (300)
10% decrease across all equity markets (100) (100)
10% increase across all equity markets 100 100
25% increase across all equity markets 300 250
1% reduction in assumed future equity and real estate returns (485) (445)
Mortality 2% increase in the best estimate assumption for insurance products - where higher mortality would be financially adverse (55) (35)
2% decrease in the best estimate assumption for annuity products - where lower mortality would be financially adverse (120) (120)
Morbidity 5% adverse change in the best estimate assumption (175) (150)
Policy Termination Rates 10% decrease in the termination rate - where fewer terminations would be financially adverse (240) (235)
10% increase in the termination rate - where more terminations would be financially adverse (175) (130)
Operating Expenses and Inflation 5% increase in unit maintenance expenses (160) (170)
Fair Value of Assets and Liabilities Debt securities, equity securities and certain other invested assets are designated as FVTPL or AFS and are recorded at fair value in our Consolidated Statements of Financial Position. Changes in fair value of assets designated as FVTPL, and realized gains and losses on sale of FVTPL assets are recorded in income. Changes in fair value of AFS assets are recorded in OCI. For foreign currency translation, exchange differences calculated on the amortized cost of AFS debt securities are recognized in income and other changes in carrying amount are recognized in OCI. The exchange differences from the translation of AFS equity securities and other invested assets are recognized in OCI. Net impairment losses and realized gains and losses on sale of AFS assets are reclassified from OCI to income.
The fair value of government and corporate debt securities is determined using quoted prices in active markets for identical or similar securities. When quoted prices in active markets are not available, fair value is determined using market standard valuation methodologies, which include discounted cash flow analysis, consensus pricing from various broker dealers that are typically the market makers, or other similar techniques. The assumptions and valuation inputs in applying these market standard valuation methodologies are determined primarily using observable market inputs, which include, but are not limited to, benchmark yields, reported trades of identical or similar instruments, broker-dealer quotes, issuer spreads, bid prices, and reference data including market research publications. In limited circumstances, non-binding broker quotes are used.
The fair value of asset-backed securities is determined using quoted prices in active markets for identical or similar securities, when available, or valuation methodologies and valuation inputs similar to those used for government and corporate debt securities. Additional valuation inputs include structural characteristics of the securities, and the underlying collateral performance, such as prepayment speeds and delinquencies. Expected prepayment speeds are based primarily on those previously experienced in the market at projected future interest rate levels. In instances where there is a lack of sufficient observable market data to value the securities, non-binding broker quotes are used.
The fair value of equity securities is determined using quoted prices in active markets for identical securities or similar securities. When quoted prices in active markets are not available, fair value is determined using equity valuation models, which include discounted cash flow analysis and other techniques that involve benchmark comparison. Valuation inputs primarily include projected future operating cash flows and earnings, dividends, market discount rates, and earnings multiples of comparable companies.
Management’s Discussion and Analysis Sun Life Financial Inc. Annual Report 2017 81

Mortgages and loans are generally carried at amortized cost. The fair value of mortgages and loans, for disclosure purposes, is determined by discounting the expected future cash flows using a current market interest rate applicable to financial instruments with a similar yield, credit quality and maturity characteristics. Valuation inputs typically include benchmark yields and risk-adjusted spreads from current lending activities or loan issuances. The risk-adjusted spreads are determined based on the borrower’s credit and liquidity, as well as term and other loan-specific features. Long-term mortgages and loans are generally categorized in Level 3 of the fair value hierarchy. The significant unobservable input is a portion of these risk adjusted spreads at or beyond the 20 year point for mortgages and at or beyond the 10 year point for loans.
Derivative financial instruments are recorded at fair value with changes in fair value recorded in income unless the derivative is part of a qualifying hedging relationship for accounting purposes. The fair value of derivative financial instruments depends upon derivative types. The fair value of exchange-traded futures and options is determined using quoted prices in active markets, while the fair value of OTC derivatives is determined using pricing models, such as discounted cash flow analysis or other market standard valuation techniques, with primarily observable market inputs. Valuation inputs used to price OTC derivatives may include swap interest rate curves, foreign exchange spot and forward rates, index prices, the value of underlying securities, projected dividends, volatility surfaces, and in limited circumstances, counterparty quotes.
The fair value of OTC derivative financial instruments also includes credit valuation adjustments to reflect the credit risk of both the derivative counterparty and ourselves as well as the impact of contractual factors designed to reduce our credit exposure, such as collateral and legal rights of offset under master netting agreements. Inputs into determining the appropriate credit valuation adjustments are typically obtained from publicly available information and include credit default swap spreads when available, credit spreads derived from specific bond yields, or published cumulative default experience data adjusted for current trends when credit default swap spreads are not available.
The fair value of other invested assets is determined using quoted prices in active markets for identical securities or similar securities. When quoted prices in active markets are not available, fair value is determined using equity valuation models, which include discounted cash flow analysis and other techniques that involve benchmark comparison. Valuation inputs primarily include projected future operating cash flows and earnings, dividends, market discount rates, and earnings multiples of comparable companies.
Investment properties are recorded at fair value with changes in fair value recorded in income. The fair value of investment properties is generally determined using property valuation models that are based on expected capitalization rates and models that discount expected future net cash flows at current market interest rates reflective of the characteristics, location, and market of each property. Expected future net cash flows include contractual and projected cash flows and forecasted operating expenses, and take into account interest, rental and occupancy rates derived from market surveys. The estimates of future cash inflows, in addition to expected rental income from current leases, include projected income from future leases based on significant assumptions that are consistent with current market conditions. The future rental rates are estimated based on the location, type and quality of the properties, and take into account market data and projections at the valuation date. The fair values are typically compared to market-based information for reasonability, including recent transactions involving comparable assets. The methodologies and inputs used in these models are in accordance with real estate industry valuation standards. Valuations are prepared externally or internally by professionally accredited real estate appraisers.
The fair value of short-term securities is approximated by their carrying amount adjusted for credit risk where appropriate.
Due to their nature, the fair value of policy loans and cash are assumed to be equal to their carrying values, which is the amount these assets are recorded at in our Consolidated Statements of Financial Position.
Investments for accounts of segregated fund holders are recorded at fair value with changes in fair value recorded in net realized and unrealized gains (losses) within the segregated fund and are not recorded in our Consolidated Statements of Operations. The fair value of investments for accounts of segregated fund holders is determined using quoted prices in active markets or independent valuation information provided by investment managers. The fair value of direct investments within investments for accounts of segregated fund holders, such as short-term securities and government and corporate debt securities, is determined according to valuation methodologies and inputs described above in the respective asset type sections.
The fair value of the secured borrowings from mortgage securitization is based on the methodologies and assumptions as described above for asset-backed securities.
The methodologies and assumptions for determining the fair values of investment contract liabilities are included in Note 10.B of our 2017 Annual Consolidated Financial Statements.
We categorize our assets and liabilities carried at fair value, based on the priority of the inputs to the valuation techniques used to measure fair value, into a three-level fair value hierarchy as follows:
Level 1: Fair value is based on the unadjusted quoted prices for identical assets or liabilities in an active market. The types of assets and liabilities classified as Level 1 generally include cash and cash equivalents, certain U.S. government and agency securities, exchange-traded equity securities, and certain segregated and mutual fund units held for account of segregated fund holders.
Level 2: Fair value is based on quoted prices for similar assets or liabilities traded in active markets, or prices from valuation techniques that use significant observable inputs, or inputs that are derived principally from or corroborated with observable market data through correlation or other means. The types of assets and liabilities classified as Level 2 generally include Canadian federal, provincial and municipal government, other foreign government and corporate debt securities, certain asset-backed securities, OTC derivatives, and certain segregated and mutual fund units held for account of segregated fund holders.
82 Sun Life Financial Inc. Annual Report 2017 Management’s Discussion and Analysis

Level 3: Fair value is based on valuation techniques that require one or more significant inputs that are not based on observable market inputs. These unobservable inputs reflect our expectations about the assumptions market participants would use in pricing the asset or liability. The types of assets and liabilities classified as Level 3 generally include certain corporate bonds, certain other invested assets, and investment properties.
As pricing inputs become more or less observable, assets are transferred between levels in the hierarchy. Total gains and losses in income and OCI are calculated assuming transfers into or out of Level 3 occur at the beginning of the period. For a financial instrument that transfers into Level 3 during the reporting period, the entire change in fair value for the period is included in the Level 3 reconciliation schedule in Note 5 to our 2017 Annual Consolidated Financial Statements. For transfers out of Level 3 during the reporting period, the change in fair value for the period is excluded from the Level 3 reconciliation schedule in Note 5 to our 2017 Annual Consolidated Financial Statements. Transfers into Level 3 occur when the inputs used to price the financial instrument lack observable market data and as a result, no longer meet the Level 1 or 2 criteria at the reporting date. Transfers out of Level 3 occur when the pricing inputs become more transparent and satisfy the Level 1 or 2 criteria at the reporting date.
Transfers into and out of Level 3 for financial assets were $512 million and $546 million for the year ended December 31, 2017, respectively, compared to $88 million and $375 million, respectively, for the year ended December 31, 2016. The total amount of the net realized/unrealized gains/(losses) related to financial instruments transferred out of Level 3 during the period, which were excluded from the Level 3 reconciliation, was a gain of $14 million as at December 31, 2017 compared to a loss of $4 million as at December 31, 2016.
Additional information on the fair value measurement of investments can be found in Note 5 of our 2017 Annual Consolidated Financial Statements.
Impairment Management assesses debt and equity securities, mortgages and loans and other invested assets for objective evidence of impairment at each reporting date. Financial assets are impaired and impairment losses are incurred if there is objective evidence of impairment as a result of one or more loss events that have an impact on the estimated future cash flows that can be reliably estimated. Objective evidence of impairment generally includes significant financial difficulty of the issuer, including actual or anticipated bankruptcy or defaults and delinquency in payments of interest or principal or disappearance of an active market for the financial assets. All equity instruments in an unrealized loss position are reviewed to determine if objective evidence of impairment exists. Objective evidence of impairment for an investment in an equity instrument or other invested asset also includes, but is not limited to, the financial condition and near-term prospects of the issuer, including information about significant changes with adverse effects that have taken place in the technological, market, economic or legal environment in which the issuer operates, and a significant or prolonged decline in the fair value of an equity instrument or other invested asset below its cost.
Additional information on the impairment of financial assets can be found in Notes 1 and 6 of our 2017 Annual Consolidated Financial Statements.
Goodwill Goodwill represents the excess of the cost of an acquisition over the fair value of the net identifiable tangible and intangible assets of the acquired businesses. Goodwill is carried at original cost less any impairment subsequently incurred. Goodwill is assessed for impairment annually or more frequently if events or circumstances occur that may result in the recoverable amount of a cash generating unit (“CGU”) falling below its carrying value. A CGU is the smallest identifiable group of assets that generates cash inflows that are largely independent of cash inflows from other groups of assets. The goodwill balances are allocated to either individual or groups of CGUs that are expected to benefit from the synergies of the business combination. Goodwill impairment is quantified by comparing a CGU’s or a group of CGU’s carrying value to its recoverable amount, which is the higher of fair value less cost to sell and value in use. Impairment losses are recognized immediately and cannot be reversed in future periods.
No impairment charges were recognized in 2017. We had a carrying value of $5.2 billion in goodwill as at December 31, 2017. Additional information on goodwill can be found in Note 9 of our 2017 Annual Consolidated Financial Statements.
Intangible Assets Intangible assets consist of finite life and indefinite life intangible assets. Finite life intangible assets are amortized on a straight-line basis over varying periods of up to 40 years, and are charged through operating expenses. The useful lives of finite life intangible assets are reviewed annually, and the amortization is adjusted as necessary. Indefinite life intangibles are not amortized, and are assessed for impairment annually or more frequently if events or changes in circumstances indicate that the asset may be impaired. Impairment is assessed by comparing the carrying values of the indefinite life intangible assets to their recoverable amounts. If the carrying values of the indefinite life intangibles exceed their recoverable amounts, these assets are considered impaired, and a charge for impairment is recognized in our Consolidated Statements of Operations. The recoverable amount of intangible assets is determined using various valuation models, which require management to make certain judgments and assumptions that could affect the estimates of the recoverable amount. There were no impairment charges in 2017 and 2016.
As at December 31, 2017 our finite life intangible assets had a carrying value of $1,046 million, which reflected the value of the field force, asset administration contracts, and Client relationships acquired as part of the Clarica, CMG Asia, Genworth EBG, Ryan Labs, Prime Advisors, Bentall Kennedy, and the U.S. employee benefits business acquisitions, as well as software costs. Our indefinite life intangible assets had a carrying value of $621 million as at December 31, 2017. The value of the indefinite life intangible assets reflected fund management contracts of MFS and Bentall Kennedy.
Income Taxes Income tax assets and liabilities for the current and prior periods are measured at the amount expected to be recovered from or paid to the taxation authorities. Deferred income tax is provided using the liability method. Our provision for income taxes is calculated based on the tax rates and tax laws that have been enacted or substantially enacted by the end of the reporting period.
Management’s Discussion and Analysis Sun Life Financial Inc. Annual Report 2017 83

As a multinational organization, we are subject to taxation in numerous jurisdictions. We seek to operate in a tax efficient manner while ensuring that we are in compliance with all laws and regulations. The determination of the required provision for current and deferred income taxes requires that we interpret tax legislation in the jurisdictions in which we operate and that we make assumptions about the expected timing of realization of deferred income tax assets and liabilities. Tax laws are complex and their interpretation requires significant judgment. The provision for income taxes reflects management’s interpretation of the relevant tax laws and its best estimate of the income tax implications of the transactions and events during the period. We believe that our provisions for uncertain tax positions appropriately reflect the risk of tax positions that are under audit, dispute or appeal with tax authorities, or which are otherwise considered to involve uncertainty. The adequacy of our tax provision is reviewed at the end of each reporting period. To the extent that our interpretations differ from those of tax authorities or the timing of realization is not as expected, the provision for income taxes may increase or decrease in future periods to reflect actual experience. The amount of any increase or decrease cannot be reasonably estimated.
Deferred income tax assets are recognized for all deductible temporary differences, carry forward of unused tax losses and unused tax credits to the extent that it is probable that taxable profit will be available against which the temporary differences, unused tax losses and unused tax credits can be utilized. At each reporting period, we assess all available evidence, both positive and negative, to determine the amount of deferred income tax assets to be recorded. If it is probable that the benefit of tax losses and tax deductions will not be realized, a deferred income tax asset is not recognized. The assessment requires significant estimates and judgment about future events based on the information available at the reporting date. On December 22, 2017 due to enactment of new U.S. tax law, the U.S. federal corporate tax rate decreased from 35% to 21% effective January 1, 2018. As a result, deferred tax assets and liabilities relating to U.S. temporary differences were revalued at the tax rate expected to apply when the liability is settled or the asset is realized, which decreased to 21%. A tax benefit of $53 million has been recognized in income tax expense for the current period.
From time to time, local governments, in countries in which we operate, enact changes to statutory corporate income tax rates. These changes require us to review and re-measure our deferred tax assets and liabilities as of the date of enactment. As of December 31, 2017, our net deferred tax asset in the Consolidated Statements of Financial Position was $892 million, primarily in Canada. Any future tax rate reductions in jurisdictions where we carry a net deferred tax asset, could result in a reduction in the carrying value of the deferred tax asset and a corresponding income tax expense at the time of substantial enactment of a rate reduction.
Pension Plans and Other Post-Retirement Benefits The Company sponsors defined benefit pension plans and defined contribution plans for eligible employees. All of our material defined benefit plans worldwide are closed to new entrants with new hires participating in defined contribution plans. Our defined benefit pension plans offer benefits based on length of service and final average earnings and certain plans offer some indexation of benefits. We maintain certain supplementary non-contributory defined benefit pension arrangements for eligible employees, which are primarily for benefits which are in excess of local tax limits. In addition to these plans, in some countries the Company sponsors certain post-retirement benefit plans (for medical, dental and/or life insurance benefits) for eligible qualifying employees and their dependents who meet certain requirements.
In Canada, since January 1, 2009, all new employees participate in a defined contribution plan, while existing employees continue to accrue future benefits in the prior plan which provides a defined benefit plan and an optional contributory defined contribution plan.
With the closure of the Canadian defined benefit plans to new entrants, the volatility associated with future service accruals for active members has been limited and will decline over time. As at December 31, 2017, there are no active members in the U.K. and no active employees accruing future service benefits in the U.S. defined benefit plans.
The major risks remaining in relation to past service obligations are increases in liabilities due to a decline in discount rates, greater life expectancy than assumed and adverse asset returns. We continue to implement our plan to de-risk our material defined benefit pension plans Company-wide by systematically shifting the pension asset mix towards liability matching investments over the next few years. The target for our significant plans is to minimize volatility in funded status arising from changes in discount rates and exposure to equity markets.
Due to the long-term nature of these defined benefit plans, the calculation of benefit expenses and accrued benefit obligations depends on various assumptions, including discount rates, rates of compensation increases, health care cost trend rates, retirement ages, mortality rates and termination rates. Based upon consultation with external pension actuaries, management determines the assumptions used for these plans on an annual basis. The discount rate used for our material defined benefit plans is determined with reference to market yields of high-quality corporate bonds that are denominated in the same currency in which the benefits will be paid, and that have terms to maturity approximating the terms of obligations.
Actual experience may differ from that assumed, which would impact the valuation of defined benefit plans and the level of benefit expenses recognized in future years. Details of our pension and post-retirement benefit plans and the key assumptions used for the valuation these plans are included in Note 25 of our 2017 Annual Consolidated Financial Statements.
2. Changes in Accounting Policies We have included in this section a summary of changes in accounting policies. Where there are references to Notes, these are part of our 2017 Annual Consolidated Financial Statements.
Amended International Financial Reporting Standards Adopted in 2017 The following amendments are effective for annual periods beginning on or after January 1, 2017, and did not have a material impact on our Consolidated Financial Statements.
84 Sun Life Financial Inc. Annual Report 2017 Management’s Discussion and Analysis
In January 2016, the IASB issued narrow-scope amendments to IAS 12 Income Taxes (“IAS 12”). The amendments clarify how to account for deferred tax assets related to unrealized losses on debt instruments measured at fair value. These amendments were applied retrospectively.
In January 2016, the IASB issued Disclosure Initiative (Amendments to IAS 7), which amends IAS 7 Statement of Cash Flows. The amendments require entities to provide disclosure that enables users of financial statements to evaluate changes in liabilities arising from financing activities, including both changes arising from cash flows and non-cash changes. These amendments were applied prospectively.
In December 2016, the IASB issued Annual Improvements to IFRSs 2014-2016 Cycle, which includes a minor amendment to IFRS 12 Disclosure of Interests in Other Entities (“IFRS 12”). The amendment provides clarification guidance to the scope of IFRS 12 and was applied retrospectively.
New and Amended International Financial Reporting Standards to be Adopted in 2018 The following new and amended IFRS were issued by the IASB and are expected to be adopted by us in 2018.
In May 2014, the IASB issued IFRS 15 Revenue from Contracts with Customers (“IFRS 15”), which replaces IAS 11 Construction Contracts, IAS 18 Revenue and various interpretations. Amendments to IFRS 15 were issued in September 2015 and April 2016. IFRS 15 establishes principles about the nature, amount, timing, and uncertainty of revenue arising from contracts with customers. IFRS 15 requires entities to recognize revenue to reflect the transfer of goods or services to customers measured at the amounts an entity expects to be entitled to in exchange for those goods or services. Insurance contracts and revenues arising from those contracts, primarily premium revenue, are not within the scope of this standard. Revenues from service contracts and service components of investment contracts that are reported in Fee income and primarily arises from our asset management businesses are within the scope of IFRS 15. IFRS 15 also provides guidance related to the costs to obtain and to fulfill a contract. IFRS 15 is effective for annual periods beginning on or after January 1, 2018 and is to be applied retrospectively, or on a cumulative retrospective basis. We will be adopting IFRS 15 on a retrospective basis. The adoption of IFRS 15 is not expected to have a material impact on our Consolidated Financial Statements.
In June 2016, the IASB issued Classification and Measurement of Share-based Payment Transactions, which amends IFRS 2 Share-based Payment. The amendments clarify how to account for certain types of share-based payment transactions, such as the effects of vesting and non-vesting conditions on the measurement of cash-settled share-based payments. These amendments are effective for annual periods beginning on or after January 1, 2018, and are applicable to awards granted on or after that date and to unvested and vested but unexercised awards outstanding at that date. We will be adopting the amendments prospectively. We do not expect the adoption of these amendments to have a material impact on our Consolidated Financial Statements.
In September 2016, the IASB issued Amendments to IFRS 4 to allow insurance entities whose predominant activities are to issue contracts within the scope of IFRS 4 an optional temporary exemption from applying IFRS 9 Financial Instruments (“IFRS 9”) until 2021 (“deferral approach”). We qualify and will elect the deferral approach permitted under the amendments effective January 1, 2018. Consequently, we will continue to apply IAS 39 Financial Instruments: Recognition and Measurement (“IAS 39”), the existing financial instrument standard until 2021.
In December 2016, the IASB issued Annual Improvements to IFRSs 2014-2016 Cycle, which includes minor amendments to IFRS 1 First-time Adoption of International Financial Reporting Standards and IAS 28 Investments in Associates and Joint Ventures (“IAS 28”) that are effective for annual periods beginning on or after January 1, 2018. We do not expect the adoption of these amendments to have a material impact on our Consolidated Financial Statements.
In December 2016, the IASB issued Transfers of Investment Property (Amendments to IAS 40). The amendments to IAS 40 Investment Property clarify that an entity shall transfer property to, or from, investment property when, and only when, there is evidence of a change in use. The amendments are effective for annual periods beginning on or after January 1, 2018. We do not expect the adoption of these amendments to have a material impact on our Consolidated Financial Statements.
In December 2016, the IASB issued IFRIC 22 Foreign Currency Transactions and Advance Consideration (“IFRIC 22”), which was developed by the IFRS Interpretations Committee. IFRIC 22 clarifies that for purposes of determining the exchange rate in transactions which include the receipt or payment of advance consideration in a foreign currency, the date of the transaction is the date of initial recognition of the non-monetary prepayment asset or deferred income liability. IFRIC 22 is effective for annual periods beginning on or after January 1, 2018. We do not expect IFRIC 22 to have a material impact on our Consolidated Financial Statements.
New and Amended International Financial Reporting Standards to be Adopted in 2019 or Later The following new and amended standards were issued by the IASB and are expected to be adopted by us in 2019 or later.
In July 2014, the IASB issued the final version of IFRS 9, which replaces IAS 39. IFRS 9 includes guidance on the classification and measurement of financial instruments, impairment of financial assets, and hedge accounting. Financial asset classification is based on the cash flow characteristics and the business model in which an asset is held. The classification determines how a financial instrument is accounted for and measured. IFRS 9 also introduces an impairment model for financial instruments not measured at fair value through profit or loss that requires recognition of expected losses at initial recognition of a financial instrument and the recognition of full lifetime expected losses if certain criteria are met. In addition, a new model for hedge accounting was introduced to achieve better alignment with risk management activities. This standard is effective for annual periods beginning on or after January 1, 2018. In October 2017, the IASB issued narrow-scope amendments to IFRS 9. The amendments clarify the classification of certain prepayable financial assets and the accounting of financial liabilities following modification. The amendments are effective for annual periods beginning on or after January 1, 2019. However, pursuant to the
Management’s Discussion and Analysis Sun Life Financial Inc. Annual Report 2017 85

aforementioned amendments to IFRS 4, we will elect the deferral approach permitted under IFRS 4 to continue to apply IAS 39 until 2021. We are currently assessing the impact that IFRS 9, along with these amendments, will have on our Consolidated Financial Statements.
In January 2016, the IASB issued IFRS 16 Leases (“IFRS 16”), which replaces IAS 17 Leases, and related interpretations. IFRS 16 sets out the principles for the recognition, measurement, presentation and disclosure of leases for both lessees and lessors. For lessees, IFRS 16 removes the classification of leases as either operating or financing and requires that all leases be recognized on the statement of financial position, with certain exemptions that include leases of 12 months or less. The accounting for lessors is substantially unchanged. The standard is effective for annual periods beginning on or after January 1, 2019, to be applied retrospectively, or on a modified retrospective basis. We are currently assessing the impact the adoption of this standard will have on our Consolidated Financial Statements.
In May 2017, the IASB issued IFRS 17 Insurance Contracts (“IFRS 17”), which replaces IFRS 4 Insurance Contracts. IFRS 17 establishes the principles for the recognition, measurement, presentation and disclosure of insurance contracts. IFRS 17 requires entities to measure insurance contract liabilities at their current fulfillment values using one of three measurement models, depending on the nature of the contract. IFRS 17 is effective for annual periods beginning on or after January 1, 2021. IFRS 17 will affect how we account for our insurance contracts and how we report our financial performance in our consolidated statement of operations. The adoption of IFRS 17 will be a significant initiative for us and the industry. In order to ensure effective implementation, we have established a transition program for IFRS 17 and are in the planning phase of this program, which includes developing a detailed project plan, determining resource requirements, developing education programs and assessing both the potential financial statement and business implications of the standard. We have regular discussions on application and interpretation of IFRS 17 with our peers in Canada through industry and professional associations and are also monitoring and participating in international developments related to the adoption and interpretation of this standard.
In June 2017, the IASB issued IFRIC 23 Uncertainty over Income Tax Treatments (“IFRIC 23”), which was developed by the IFRS Interpretations Committee. IFRIC 23 clarifies how to apply the recognition and measurement requirements in IAS 12 when there is uncertainty over income tax treatments, and requires an entity to determine whether tax treatments should be considered collectively or independently. In addition, IFRIC 23 addresses the assumptions an entity should make about the examination of tax treatments by taxation authorities, as well as how an entity should consider changes in facts and circumstances. IFRIC 23 also provides guidance on how to determine taxable profit (tax loss), tax bases, unused tax losses, unused tax credits, and tax rates, based on whether it is probable that a tax authority will accept an uncertain tax treatment used, or proposed to be used, by an entity in its income tax filings. IFRIC 23 is effective for annual periods beginning on or after January 1, 2019 and is to be applied retrospectively, or on a cumulative retrospective basis. We are currently assessing the impact that IFRIC 23 will have on our Consolidated Financial Statements.
In October 2017, the IASB issued narrow-scope amendments to IAS 28. The amendments clarify that long-term interests in an associate or joint venture to which the equity method is not applied should be accounted for following the requirements of IFRS 9. The amendments are effective for annual periods beginning on or after January 1, 2019, and are to be applied retrospectively with certain exceptions. As we will not adopt IFRS 9 until 2021, we will be required to apply IAS 39 to the long-term interests in associates or joint ventures covered by these amendments. We are currently assessing the impact the adoption of these amendments will have on our Consolidated Financial Statements.
In December 2017, the IASB issued Annual Improvements to IFRSs 2015-2017 Cycle, which includes minor amendments to four IFRS standards. The amendments are effective for annual periods beginning on or after January 1, 2019. We are currently assessing the impact the adoption of these amendments will have on our Consolidated Financial Statements.
In February 2018, the IASB issued Plan Amendment, Curtailment or Settlement which amends IAS 19 Employee Benefits (“IAS 19”). Under IAS 19, when an amendment, curtailment or settlement of a defined benefit pension plan occurs, the net defined benefit liability or asset is remeasured. The amendments require an entity to use the updated assumptions from this remeasurement to determine current service cost and net interest for reporting periods after the change to the plan. The amendments are applicable to plan amendments, curtailments or settlements occurring on or after January 1, 2019. We are currently assessing the impact the adoption of these amendments will have on our Consolidated Financial Statements.
3. Disclosure Controls and Procedures The Company has established disclosure controls and procedures that are designed to provide reasonable assurance that all relevant information is gathered and reported to senior management, including the Company’s President and CEO, Executive Vice-President and Chief Financial Officer (“CFO”), and Executive Vice-President, Chief Legal Officer and Public Affairs, on a timely basis so that appropriate decisions can be made regarding public disclosure.
An evaluation of the effectiveness of our disclosure controls and procedures, as defined under rules adopted by the Canadian securities regulatory authorities and the SEC, as of December 31, 2017, was carried out under the supervision of and with the participation of the Company’s management, including the CEO and the CFO. Based on our evaluation, the CEO and the CFO concluded that the design and operation of these disclosure controls and procedures were effective as of December 31, 2017.
Management’s Report on Internal Control over Financial Reporting Management is responsible for establishing and maintaining adequate internal control over financial reporting to provide reasonable assurance regarding the reliability of our financial reporting and the preparation of our financial statements in accordance with IFRS.
Due to its inherent limitations, internal control over financial reporting may not prevent or detect misstatements on a timely basis. Projections of any evaluation of the effectiveness of internal control over financial reporting to future periods are subject to the risk that the controls may become inadequate because of changes in conditions, or that the degree of compliance with the policies or procedures may deteriorate.
86 Sun Life Financial Inc. Annual Report 2017 Management’s Discussion and Analysis
We conducted an assessment of the effectiveness of our internal control over financial reporting, as of December 31, 2017, based on the framework and criteria established in Internal Control-Integrated Framework (2013), issued by the Committee of Sponsoring Organizations of the Treadway Commission. Based on that assessment, we have concluded that our internal control over financial reporting was effective as of December 31, 2017.
Our internal control over financial reporting, as of December 31, 2017, has been audited by the Company’s external auditor, Deloitte LLP, Independent Registered Public Accounting Firm, who also audited our Annual Consolidated Financial Statements for the year ended December 31, 2017. As stated in the Report of Independent Registered Public Accounting Firm, they have expressed an unqualified opinion on our internal control over financial reporting as of December 31, 2017.
Changes in Internal Control over Financial Reporting No changes were made in our internal control over financial reporting for the period which began on January 1, 2017 and ended December 31, 2017 that have materially affected or are reasonably likely to materially affect our internal control over financial reporting.
N. Legal and Regulatory Proceedings
We are regularly involved in legal actions, both as a defendant and as a plaintiff. Information on legal and regulatory proceedings can be found in Note 23 of our 2017 Annual Consolidated Financial Statements.
O. Forward-looking statements
From time to time, the Company makes written or oral forward-looking statements within the meaning of certain securities laws, including the “safe harbour” provisions of the United States Private Securities Litigation Reform Act of 1995 and applicable Canadian securities legislation. Forward-looking statements contained in this MD&A include statements (i) relating to our growth strategies, financial objectives, future results of operations, and strategic goals; (ii) concerning the expected impact of the U.S. employee benefits business acquisition completed in 2016 on earnings per share, excluding transaction and integration costs and our expected pre-tax run rate synergies which are described in this MD&A under the heading G - Performance by Business Group - 2 - SLF U.S.; (iii) concerning our medium-term financial objectives which are described in this MD&A under the heading B. Overview - 2- Financial Objectives, (collectively, our “medium-term financial objectives”); (iv) relating to productivity and expense initiatives, growth initiatives, outlook, and other business objectives; (v) relating to the expected impact of the U.S. tax reform on the Company’s tax expense (vi) relating to our expected tax range for future years; (vii) that are predictive in nature or that depend upon or refer to future events or conditions; (viii) set out in this document under the heading J - Risk Management - 7 Risk Categories - Market Risk - Interest Rate and Equity Market Sensitivities; (ix) relating to cash flows, anticipated payment obligations, funding requirements and our ability to meet these obligations; (x) relating to tax provisions; (xi) relating to risks and uncertainties; and (xii) that include words such as “achieve”, “aim”, “ambition”, “anticipate”, “aspiration”, “assumption”, “believe”, “could”, “estimate”, “expect”, “goal”, “initiatives”, “intend”, “may”, “objective”, “outlook”, “plan”, “project”, “seek”, “should”, “strategy”, “strive”, “target”, “will” and similar expressions are forward-looking statements. Forward-looking statements include the information concerning our possible or assumed future results of operations. These statements represent our current expectations, estimates and projections regarding future events and are not historical facts. Forward-looking statements are not a guarantee of future performance and involve risks and uncertainties that are difficult to predict. Future results and shareholder value may differ materially from those expressed in these forward-looking statements due to, among other factors, the matters set out in this MD&A under the headings B - Overview - 2 - Financial Objectives, D - Profitability - 2017 vs. 2016; I - Capital and Liquidity Management; J - Risk Management; and M - Accounting and Control Matters - 2 - Critical Accounting Policies and Estimates and in SLF Inc.’s 2017 AIF under the heading Risk Factors, and the factors detailed in SLF Inc.’s other filings with Canadian and U.S. securities regulators, which are available for review at www.sedar.com and www.sec.gov.
Medium-Term Financial Objectives The Company’s medium-term financial objectives set out in B - Overview - 2 - Financial Objectives are forward-looking non-IFRS financial measures. Our ability to achieve those objectives is dependent on our success in achieving growth initiatives and business objectives and on certain key assumptions that include: (i) no significant changes in the level of interest rates; (ii) average total equity market return of approximately 8% per annum; (iii) credit experience in line with best estimate actuarial assumptions; (iv) no significant changes in the level of our regulatory capital requirements; (v) no significant changes to our effective tax rate; (vi) no significant change in the number of shares outstanding; (vii) other key assumptions include: no material changes to our hedging program, hedging costs that are consistent with our best estimate assumptions, no material assumption changes including updates to the economic scenario generator and no material accounting standard changes, and (viii) our best estimate actuarial assumptions used in determining our insurance and investment contract liabilities. Our underlying ROE is dependent upon capital levels and options for deployment of excess capital. Our medium-term financial objectives do not reflect the indirect effects of interest rate and equity market movements including the potential impacts on goodwill or the current valuation allowance on deferred tax assets as well as other items that may be non-operational in nature.
Our target dividend payout ratio of 40%-50% of our underlying net income assumes that economic conditions and our results will enable us to maintain our payout ratio in the target range, while maintaining a strong capital position. The declaration, amount and payment of dividends is subject to the approval of SLF Inc.’s Board of Directors and our compliance with the capital requirements in the Insurance Companies Act (Canada). Additional information on dividends is provided in the section I - Capital and Liquidity Management - Shareholder Dividends in this MD&A.
Management’s Discussion and Analysis Sun Life Financial Inc. Annual Report 2017 87

Although considered reasonable by the Company, we may not be able to achieve our medium-term financial objectives as the assumptions on which these objectives were based may prove to be inaccurate. Accordingly, our actual results could differ materially from our medium-term financial objectives as described in the section B - Overview - 2 - Financial Objectives in this MD&A. Our medium-term financial objectives do not constitute guidance.
The Company does not undertake any obligation to update or revise its forward-looking statements to reflect events or circumstances after the date of this document or to reflect the occurrence of unanticipated events, except as required by law.
Risk Factors Important risk factors that could cause our assumptions and estimates, and expectations and projections to be inaccurate and our actual results or events to differ materially from those expressed in or implied by the forward-looking statements contained in this document, including our medium-term financial objectives, are set out below. The realization of our forward-looking statements, including our ability to meet our medium-term financial objectives, essentially depends on our business performance which, in turn, is subject to many risks. Factors that could cause actual results to differ materially from expectations include, but are not limited to: credit risks - related to issuers of securities held in our investment portfolio, debtors, structured securities, reinsurers, counterparties, other financial institutions and other entities; market risks - related to the performance of equity markets; changes or volatility in interest rates or credit spreads or swap spreads; real estate investments; and fluctuations in foreign currency exchange rates; insurance risks - related to policyholder behaviour; mortality, morbidity and longevity; product design and pricing; the impact of higher-than-expected future expenses; and the availability, cost and effectiveness of reinsurance; business and strategic risks - related to global economic and political conditions; the design and implementation of business strategies; changes in distribution channels or Client behaviour including risks relating to market conduct by intermediaries and agents; the impact of competition; the performance of our investments and investment portfolios managed for Clients such as segregated and mutual funds; changes in the legal or regulatory environment, including capital requirements and tax laws; tax matters, including estimates and judgments used in calculating taxes; our international operations, including our joint ventures; market conditions that affect our capital position or ability to raise capital; downgrades in financial strength or credit ratings; and the impact of mergers, acquisitions and divestitures; operational risks - related to breaches or failure of information system security and privacy, including cyber-attacks; our ability to attract and retain employees; legal, regulatory compliance and market conduct, including the impact of regulatory inquiries and investigations; the execution and integration of mergers, acquisitions and divestitures; our information technology infrastructure; a failure of information systems and Internet-enabled technology; dependence on third-party relationships, including outsourcing arrangements; business continuity; model errors; information management; the environment, environmental laws and regulations and third-party policies; and liquidity risks - the possibility that we will not be able to fund all cash outflow commitments as they fall due.
88 Sun Life Financial Inc. Annual Report 2017 Management’s Discussion and Analysis

C O N S O L I D A T E D
F INANC IAL STATEMENTS A N D N O T E S
FINANCIAL REPORTING RESPONSIBILITIES 90
CONSOLIDATED FINANCIAL STATEMENTS 91 Consolidated Statements of Operations 91
Consolidated Statements of Comprehensive Income (Loss) 92 Consolidated Statements of Financial Position 93
Consolidated Statements of Changes in Equity 94 Consolidated Statements of Cash Flows 95
NOTES TO THE CONSOLIDATED FINANCIAL STATEMENTS 96 Significant Accounting Policies Note 1 96
Changes in Accounting Policies Note 2 104 Acquisitions Note 3 106
Segmented Information Note 4 107 Total Invested Assets and Related Net Investment Income Note 5 110
Financial Instrument Risk Management Note 6 117 Insurance Risk Management Note 7 127
Other Assets Note 8 130 Goodwill and Intangible Assets Note 9 130
Insurance Contract Liabilities and Investment Contract Liabilities Note 10 133 Reinsurance Note 11 139
Other Liabilities Note 12 140 Senior Debentures and Innovative Capital Instruments Note 13 141
Subordinated Debt Note 14 142 Share Capital Note 15 143
Interests in Other Entities Note 16 144 Fee Income Note 17 146
Operating Expenses Note 18 147 Share-Based Payments Note 19 147
Income Taxes Note 20 149 Capital Management Note 21 151
Segregated Funds Note 22 152 Commitments, Guarantees and Contingencies Note 23 154
Related Party Transactions Note 24 155 Pension Plans and Other Post-Retirement Benefits Note 25 156
Earnings (Loss) Per Share Note 26 159 Accumulated Other Comprehensive Income (Loss) and Non-Controlling Interests Note 27 160
Subsequent Events Note 28 160
APPOINTED ACTUARY’S REPORT 161
REPORTS OF INDEPENDENT REGISTERED PUBLIC ACCOUNTING FIRM 162
Consolidated Financial Statements Sun Life Financial Inc. Annual Report 2017 89

Financial Reporting Responsibilities
Management is responsible for preparing the Consolidated Financial Statements. This responsibility includes selecting appropriate accounting policies and making estimates and other judgments consistent with International Financial Reporting Standards. The financial information presented elsewhere in the annual report to shareholders is consistent with these Consolidated Financial Statements.
The Board of Directors (“Board”) oversees management’s responsibilities for financial reporting. An Audit Committee of non-management directors is appointed by the Board to review the Consolidated Financial Statements and report to the Board prior to their approval of the Consolidated Financial Statements for issuance to shareholders. Other key responsibilities of the Audit Committee include reviewing the Company’s existing internal control procedures and planned revisions to those procedures, and advising the Board on auditing matters and financial reporting issues.
Management is also responsible for maintaining systems of internal control that provide reasonable assurance that financial information is reliable, that all financial transactions are properly authorized, that assets are safeguarded, and that Sun Life Financial Inc. and its subsidiaries, collectively referred to as “the Company”, adhere to legislative and regulatory requirements. These systems include the communication of policies and the Company’s Code of Business Conduct throughout the organization. Internal controls are reviewed and evaluated by the Company’s internal auditors.
Management conducted an assessment of the effectiveness of the Company’s internal control over financial reporting, as of December 31, 2017, based on the framework and criteria established in Internal Control – Integrated Framework (2013), issued by the Committee of Sponsoring Organizations of the Treadway Commission. Based on that assessment, management has concluded that the Company’s internal control over financial reporting was effective as of December 31, 2017.
The Audit Committee also conducts such review and inquiry of management and the internal and external auditors as it deems necessary towards establishing that the Company is employing appropriate systems of internal control, is adhering to legislative and regulatory requirements and is applying the Company’s Code of Business Conduct. Both the internal and external auditors and the Company’s Appointed Actuary have full and unrestricted access to the Audit Committee with and without the presence of management.
The Office of the Superintendent of Financial Institutions, Canada conducts periodic examinations of the Company. These examinations are designed to evaluate compliance with provisions of the Insurance Companies Act (Canada) and to ensure that the interests of policyholders, depositors, and the public are safeguarded. The Company’s foreign operations and foreign subsidiaries are examined by regulators in their local jurisdictions.
The Company’s Appointed Actuary, who is a member of management, is appointed by the Board to discharge the various actuarial responsibilities required under the Insurance Companies Act (Canada), and conducts the valuation of the Company’s actuarial liabilities. The role of the Appointed Actuary is described in more detail in Note 10. The report of the Appointed Actuary accompanies these Consolidated Financial Statements.
The Company’s external auditor, Deloitte LLP, Independent Registered Public Accounting Firm, has audited the Company’s internal control over financial reporting as of December 31, 2017, in addition to auditing the Company’s Consolidated Financial Statements for the years ended December 31, 2017 and December 31, 2016. Its reports to the Board and shareholders express unqualified opinions and accompany these Consolidated Financial Statements. Deloitte LLP meets separately with both management and the Audit Committee to discuss the results of its audit.
Dean A. Connor Kevin D. Strain, CPA, CA President and Chief Executive Officer Executive Vice-President and Chief Financial Officer
Toronto, Ontario, Canada February 14, 2018
90 Sun Life Financial Inc. Annual Report 2017 Consolidated Financial Statements

CONSOLIDATED STATEMENTS OF OPERATIONS
For the years ended December 31, (in millions of Canadian dollars except for per share amounts) 2017 2016
Revenue Premiums
Gross $ 19,838 $ 19,427
Less: Ceded 4,557 4,379
Net premiums 15,281 15,048
Net investment income (loss):
Interest and other investment income (Note 5) 5,413 5,489
Fair value and foreign currency changes on assets and liabilities (Note 5) 2,603 2,233
Net gains (losses) on available-for-sale assets 195 223
Net investment income (loss) 8,211 7,945
Fee income (Note 17) 5,842 5,580
Total revenue 29,334 28,573
Benefits and expenses Gross claims and benefits paid (Note 10) 15,353 15,210
Increase (decrease) in insurance contract liabilities (Note 10) 5,327 5,391
Decrease (increase) in reinsurance assets (Note 10) 821 133
Increase (decrease) in investment contract liabilities (Note 10) 41 (13)
Reinsurance expenses (recoveries) (Note 11) (4,373) (4,313)
Commissions 2,403 2,372
Net transfer to (from) segregated funds (Note 22) (119) (307)
Operating expenses (Note 18) 6,410 6,000
Premium taxes 379 339
Interest expense 303 316
Total benefits and expenses 26,545 25,128
Income (loss) before income taxes 2,789 3,445
Less: Income tax expense (benefit) (Note 20) 302 619
Total net income (loss) 2,487 2,826
Less: Net income (loss) attributable to participating policyholders and non-controlling interests 245 245
Shareholders’ net income (loss) 2,242 2,581
Less: Preferred shareholders’ dividends 93 96
Common shareholders’ net income (loss) $ 2,149 $ 2,485
Average exchange rates during the reporting periods: U.S. dollars 1.30 1.33
Earnings (loss) per share (Note 26) Basic earnings (loss) per share $ 3.51 $ 4.05
Diluted earnings (loss) per share $ 3.49 $ 4.03
Dividends per common share $ 1.745 $ 1.620
The attached notes form part of these Consolidated Financial Statements.
Consolidated Financial Statements Sun Life Financial Inc. Annual Report 2017 91

CONSOLIDATED STATEMENTS OF COMPREHENSIVE INCOME (LOSS)
For the years ended December 31, (in millions of Canadian dollars) 2017 2016
Total net income (loss) $ 2,487 $ 2,826
Other comprehensive income (loss), net of taxes: Items that may be reclassified subsequently to income:
Change in unrealized foreign currency translation gains (losses): Unrealized gains (losses) (737) (636)
Change in unrealized gains (losses) on available-for-sale assets: Unrealized gains (losses) 247 117 Reclassifications to net income (loss) (112) (131)
Change in unrealized gains (losses) on cash flow hedges: Unrealized gains (losses) 3 5 Reclassifications to net income (loss) (8) (14)
Share of other comprehensive income (loss) in joint ventures and associates: Unrealized gains (losses) (31) (68) Reclassifications to net income (loss) upon change in control (Note 3) – (8)
Total items that may be reclassified subsequently to income (638) (735)
Items that will not be reclassified subsequently to income:
Remeasurement of defined benefit plans (69) (73)
Revaluation surplus on transfer to investment properties (Note 5.A) 139 –
Total items that will not be reclassified subsequently to income 70 (73)
Total other comprehensive income (loss) (568) (808)
Total comprehensive income (loss) 1,919 2,018
Less: Participating policyholders’ and non-controlling interests’ comprehensive income (loss) 238
Shareholders’ comprehensive income (loss) $ 1,681 $ 1,775
INCOME TAXES INCLUDED IN OTHER COMPREHENSIVE INCOME (LOSS)
For the years ended December 31, (in millions of Canadian dollars) 2017 2016
Income tax benefit (expense): Items that may be reclassified subsequently to income:
Unrealized foreign currency translation gains / losses $ – $ 1
Unrealized gains / losses on available-for-sale assets (92) (58)
Reclassifications to net income for available-for-sale assets 39 48
Unrealized gains / losses on cash flow hedges (1) (6)
Reclassifications to net income for cash flow hedges 3 5
Total items that may be reclassified subsequently to income (51) (10)
Items that will not be reclassified subsequently to income:
Remeasurement of defined benefit plans 22 32
Revaluation surplus on transfer to investment properties (Note 5.A) (33) –
Total items that will not be reclassified subsequently to income (11) 32
Total income tax benefit (expense) included in other comprehensive income (loss) $ (62) $ 22
The attached notes form part of these Consolidated Financial Statements.
92 Sun Life Financial Inc. Annual Report 2017 Consolidated Financial Statements
243
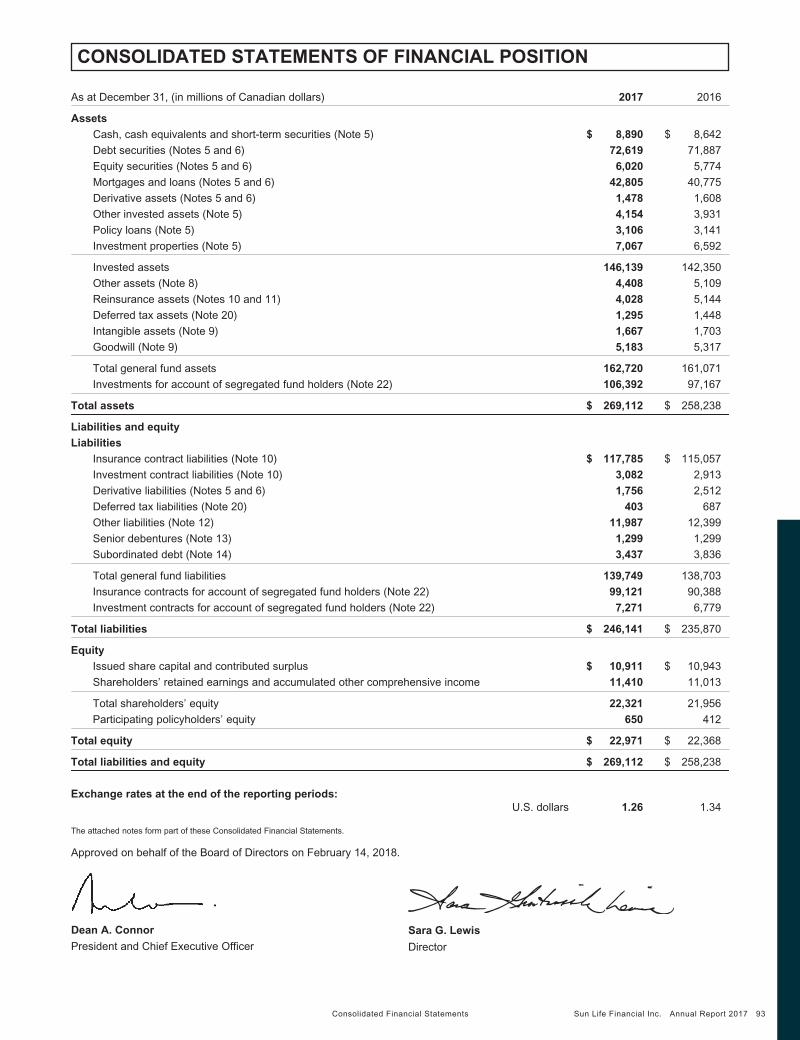
CONSOLIDATED STATEMENTS OF FINANCIAL POSITION
As at December 31, (in millions of Canadian dollars) 2017 2016
Assets Cash, cash equivalents and short-term securities (Note 5) $ 8,890 $ 8,642
Debt securities (Notes 5 and 6) 72,619 71,887
Equity securities (Notes 5 and 6) 6,020 5,774
Mortgages and loans (Notes 5 and 6) 42,805 40,775
Derivative assets (Notes 5 and 6) 1,478 1,608
Other invested assets (Note 5) 4,154 3,931
Policy loans (Note 5) 3,106 3,141
Investment properties (Note 5) 7,067 6,592
Invested assets 146,139 142,350
Other assets (Note 8) 4,408 5,109
Reinsurance assets (Notes 10 and 11) 4,028 5,144
Deferred tax assets (Note 20) 1,295 1,448
Intangible assets (Note 9) 1,667 1,703
Goodwill (Note 9) 5,183 5,317
Total general fund assets 162,720 161,071
Investments for account of segregated fund holders (Note 22) 106,392 97,167
Total assets $ 269,112 $ 258,238
Liabilities and equity Liabilities
Insurance contract liabilities (Note 10) $ 117,785 $ 115,057
Investment contract liabilities (Note 10) 3,082 2,913
Derivative liabilities (Notes 5 and 6) 1,756 2,512
Deferred tax liabilities (Note 20) 403 687
Other liabilities (Note 12) 11,987 12,399
Senior debentures (Note 13) 1,299 1,299
Subordinated debt (Note 14) 3,437 3,836
Total general fund liabilities 139,749 138,703
Insurance contracts for account of segregated fund holders (Note 22) 99,121 90,388
Investment contracts for account of segregated fund holders (Note 22) 7,271 6,779
Total liabilities $ 246,141 $ 235,870
Equity Issued share capital and contributed surplus $ 10,911 $ 10,943
Shareholders’ retained earnings and accumulated other comprehensive income 11,410 11,013
Total shareholders’ equity 22,321 21,956
Participating policyholders’ equity 650 412
Total equity $ 22,971 $ 22,368
Total liabilities and equity $ 269,112 $ 258,238
Exchange rates at the end of the reporting periods: U.S. dollars 1.26 1.34
The attached notes form part of these Consolidated Financial Statements.
Approved on behalf of the Board of Directors on February 14, 2018.
Dean A. Connor Sara G. Lewis President and Chief Executive Officer Director
Consolidated Financial Statements Sun Life Financial Inc. Annual Report 2017 93

CONSOLIDATED STATEMENTS OF CHANGES IN EQUITY
For the years ended December 31, (in millions of Canadian dollars) 2017 2016
Shareholders: Preferred shares (Note 15)
Balance, beginning and end of year $ 2,257 $ 2,257
Common shares (Note 15) Balance, beginning of year 8,614 8,567
Stock options exercised 18 47
Common shares purchased for cancellation (50) –
Balance, end of year 8,582 8,614
Contributed surplus Balance, beginning of year 72 76
Share-based payments 3 4
Stock options exercised (3) (8)
Balance, end of year 72 72
Retained earnings Balance, beginning of year 9,360 7,891
Net income (loss) 2,242 2,581
Dividends on common shares (1,066) (986)
Dividends on preferred shares (93) (96)
Common shares purchased for cancellation (Note 15) (125) –
Transactions with non-controlling interests (Note 3) – (30)
Transfer from accumulated other comprehensive income (loss) (13) –
Balance, end of year 10,305 9,360
Accumulated other comprehensive income (loss), net of taxes (Note 27) Balance, beginning of year $ 1,653 $ 2,459
Total other comprehensive income (loss) for the year (561) (806)
Transfer to retained earnings 13 –
Balance, end of year 1,105 1,653
Total shareholders’ equity, end of year $ 22,321 $ 21,956
Participating policyholders: Balance, beginning of year $ 412 168
Net income (loss) 245 246
Total other comprehensive income (loss) for the year (Note 27) (7) (2)
Total participating policyholders’ equity, end of year $ 650 $ 412
Total equity $ 22,971 $ 22,368
The attached notes form part of these Consolidated Financial Statements.
94 Sun Life Financial Inc. Annual Report 2017 Consolidated Financial Statements

CONSOLIDATED STATEMENTS OF CASH FLOWS
For the years ended December 31, (in millions of Canadian dollars) 2017 2016
Cash flows provided by (used in) operating activities(1)
Income (loss) before income taxes
Adjustments:
Interest expense related to financing activities
Increase (decrease) in insurance and investment contract liabilities
Decrease (increase) in reinsurance assets
Realized and unrealized (gains) losses and foreign currency changes on invested assets
Sales, maturities and repayments of invested assets
Purchases of invested assets
Income taxes received (paid)
Mortgage securitization (Note 5)
Other operating activities
$ 2,789
247 5,368 821
(2,798) 55,973 (60,633)
(436) 214 439
$ 3,445
269
5,378
133
(2,456)
47,115
(49,786)
(310)
474
(594)
Net cash provided by (used in) operating activities 1,984 3,668
Cash flows provided by (used in) investing activities Net (purchase) sale of property and equipment
Investment in and transactions with joint ventures and associates (Note 16)
Dividends received from joint ventures and associates (Note 16)
Acquisitions, net of cash and cash equivalents acquired (Note 3)(2)
Other investing activities
(182) (121) 36 (61) (11)
(131)
(366)
20
(1,316)
(100)
Net cash provided by (used in) investing activities (339) (1,893)
Cash flows provided by (used in) financing activities Increase in (repayment of) borrowed funds
Issuance of subordinated debt, net of issuance costs (Note 14)
Redemption of senior debentures and subordinated debt (Notes 13 and 14)
Issuance of common shares on exercise of stock options
Transactions with non-controlling interests (Note 3)
Common shares purchased for cancellation (Note 15)
Dividends paid on common and preferred shares
Interest expense paid
(45) 398 (800) 15 –
(175) (1,155) (257)
(610)
1,343
(950)
39
(46)
–
(1,074)
(245)
Net cash provided by (used in) financing activities (2,019) (1,543)
Changes due to fluctuations in exchange rates (179) (235)
Increase (decrease) in cash and cash equivalents
Net cash and cash equivalents, beginning of year
(553) 6,509
(3)
6,512
Net cash and cash equivalents, end of year
Short-term securities, end of year
5,956 2,794
6,509
1,944
Net cash, cash equivalents and short-term securities, end of year (Note 5) $ 8,750 $ 8,453
(1) Balances in 2016 have been changed to conform with current year presentation. (2) Consists of total cash consideration paid of $100 ($1,379 in 2016), less cash and cash equivalents acquired of $39 ($63 in 2016).
The attached notes form part of these Consolidated Financial Statements.
Consolidated Financial Statements Sun Life Financial Inc. Annual Report 2017 95

Notes to the Consolidated Financial Statements
(Amounts in millions of Canadian dollars except for per share amounts and where otherwise stated. All amounts stated in U.S. dollars are in millions.)
1. Significant Accounting Policies
Description of Business Sun Life Financial Inc. (“SLF Inc.”) is a publicly traded company domiciled in Canada and is the holding company of Sun Life Assurance Company of Canada (“Sun Life Assurance”). Both companies are incorporated under the Insurance Companies Act (Canada), and are regulated by the Office of the Superintendent of Financial Institutions, Canada (“OSFI”). SLF Inc. and its subsidiaries are collectively referred to as “us”, “our”, “ours”, “we”, “the Enterprise”, or “the Company”. We are an internationally diversified financial services organization providing savings, retirement, and pension products, and life and health insurance to individuals and groups through our operations in Canada, the United States (“U.S.”), Asia, and the United Kingdom (“U.K.”). We also operate mutual fund and investment management businesses, primarily in Canada, the U.S., and Asia.
Statement of Compliance We prepared our Consolidated Financial Statements in accordance with International Financial Reporting Standards (“IFRS”) as issued and adopted by the International Accounting Standards Board (“IASB”). Our accounting policies have been applied consistently within our Consolidated Financial Statements.
Basis of Presentation Our Consolidated Statements of Financial Position are presented in the order of liquidity and each statement of financial position line item includes both current and non-current balances, as applicable.
We have defined our reportable segments and the amounts disclosed for those segments based on our management structure and the manner in which our internal financial reporting is conducted. Transactions between segments are executed and priced on an arm’s-length basis in a manner similar to transactions with third parties.
The significant accounting policies used in the preparation of our Consolidated Financial Statements are summarized below and are applied consistently by us.
Estimates, Assumptions and Judgments The application of our accounting policies requires estimates, assumptions and judgments as they relate to matters that are inherently uncertain. We have established procedures to ensure that our accounting policies are applied consistently and that the processes for changing methodologies for determining estimates are controlled and occur in an appropriate and systematic manner.
Use of Estimates and Assumptions The preparation of our Consolidated Financial Statements requires us to make estimates and assumptions that affect the application of our policies and the reported amounts of assets, liabilities, revenue and expenses. Key sources of estimation uncertainty include the measurement of insurance contract liabilities and investment contract liabilities, determination of fair value, impairment of financial instruments, determination and impairment of goodwill and intangible assets, and determination of provisions and liabilities for pension plans, other post-retirement benefits, income taxes, and the determination of fair value of share-based payments. Actual results may differ from our estimates thereby impacting our Consolidated Financial Statements. Information on our use of estimates and assumptions are discussed in this Note.
Judgments In preparation of these Consolidated Financial Statements, we use judgments to select assumptions and determine estimates as described above. We also use judgment when applying accounting policies and when determining the classification of insurance contracts, investment contracts and service contracts; the substance of whether our relationship with a structured entity, subsidiary, joint venture or associate constitutes control, joint control or significant influence; functional currencies; contingencies; acquisitions; deferred income tax assets; and the determination of cash generating unit (“CGU”).
96 Sun Life Financial Inc. Annual Report 2017 Notes to Consolidated Financial Statements

Significant estimates and judgments have been made in the following areas and are discussed as noted:
Insurance contract and investment contract Note 1 Insurance Contract Liabilities and Investment Contract Liabilities assumptions and measurement Note 10 Insurance Contract Liabilities and Investment Contract Liabilities
Determination of fair value Note 1 Basis of Consolidation
Note 1 Determination of Fair Value
Note 3 Acquisitions
Note 5 Total Invested Assets and Related Net Investment Income
Impairment of financial instruments Note 1 Financial Assets Excluding Derivative Financial Instruments
Note 6 Financial Instrument Risk Management
Income taxes Note 1 Income Taxes
Note 20 Income Taxes
Pension plans Note 1 Pension Plans and Other Post-Retirement Benefits
Note 25 Pension Plans and Other Post-Retirement Benefits
Goodwill and intangible assets on acquisition and Note 1 Goodwill impairment Note 1 Intangible Assets
Note 3 Acquisitions
Note 9 Goodwill and Intangible Assets
Determination of control for purpose of consolidation Note 1 Basis of Consolidation
Note 16 Interests in Other Entities
Share-based payments Note 19 Share-Based Payments
Basis of Consolidation Our Consolidated Financial Statements include the results of operations and the financial position of subsidiaries, which includes structured entities controlled by us, after intercompany balances and transactions have been eliminated. Subsidiaries are fully consolidated from the date we obtain control, and deconsolidated on the date control ceases. The acquisition method is used to account for the acquisition of a subsidiary from an unrelated party at the date that control is obtained, with the difference between the consideration transferred and the fair value of the subsidiary’s net identifiable assets acquired recorded as goodwill. Judgment is required to determine fair value of the net identifiable assets acquired in a business combination.
We control an entity when we have power over an entity, exposure to or rights to variable returns from our involvement with an entity, and the ability to affect our returns through our power over an entity. Power exists when we have rights that give us the ability to direct the relevant activities, which are those activities that could significantly affect the entity’s returns. Power can be obtained through voting rights or other contractual arrangements. Judgment is required to determine the relevant activities and which party has power over these activities. When we have power over and variable returns from an entity, including an investment fund that we manage, we also apply significant judgment in determining whether we are acting as a principal or agent. To make this determination, we consider factors such as how much discretion we have regarding the management of the investment fund and the magnitude and extent of variability associated with our interests in the fund. If we determine we are the principal rather than the agent, we would consolidate the assets and liabilities of the fund. Interests held by external parties in investment funds that we consolidate are recorded as third-party interest in consolidated investment funds in Other liabilities. If we lose control of an entity, the assets and liabilities of that entity are derecognized from our Consolidated Statements of Financial Position at the date at which control is lost and any investment retained is re-measured to fair value.
A joint venture exists when SLF Inc., or one of its subsidiaries, has joint control of a joint arrangement and has rights to the net assets of the arrangement. Joint control is the contractually agreed sharing of control and exists only when the decisions about the relevant activities require the unanimous consent of the parties sharing control. Associates are entities over which SLF Inc. or its subsidiaries are able to exercise significant influence. Significant influence is the power to participate in the financial and operating policy decisions of an investee but not have control or joint control over those decisions. Significant influence is generally presumed to exist when SLF Inc. or its subsidiaries hold greater than 20% of the voting power of the investee but does not have control or joint control. The equity method is used to account for our interests in joint ventures and associates. A joint operation exists when SLF Inc., or one of its subsidiaries, has joint control of an arrangement that gives it rights to the assets and obligations for the liabilities of the operation, rather than the net assets of the arrangement. For joint operations, we record our share of the assets, liabilities, revenue and expenses of the joint operation. Judgment is required to determine whether contractual arrangements between multiple parties results in control, joint control or significant influence, with consideration of the relevant activities of the entity, voting rights, representation on boards of directors and other decision-making factors. Judgment is also required to determine if a joint arrangement is a joint venture or joint operation, with consideration of our rights and obligations and the structure and legal form of the arrangement.
Determination of Fair Value Fair value is the price that would be received to sell an asset or paid to transfer a liability in an orderly transaction between market participants. Fair value is measured using the assumptions that market participants would use when pricing an asset or liability. We determine fair value by using quoted prices in active markets for identical or similar assets or liabilities. When quoted prices in active markets are not available, fair value is determined using valuation techniques that maximize the use of observable inputs. When observable valuation inputs are not available, significant judgment is required to determine fair value by assessing the valuation techniques and valuation inputs. The use of alternative valuation techniques or valuation inputs may result in a different fair value. A description of the fair value methodologies, assumptions, valuation techniques, and valuation inputs by type of asset is included in Note 5.
Notes to Consolidated Financial Statements Sun Life Financial Inc. Annual Report 2017 97

Foreign Currency Translation Translation of Transactions in Foreign Currencies The financial results of SLF Inc. and its subsidiaries, joint ventures and associates are prepared in the currency in which they conduct their ordinary course of business, which is referred to as functional currency. Transactions occurring in currencies other than the functional currency are translated to the functional currency using the spot exchange rates at the dates of the transactions.
Monetary assets and liabilities in foreign currencies are translated to the functional currency at the exchange rate at the statement of financial position date. Non-monetary assets and liabilities in foreign currencies that are held at fair value are translated using the exchange rate at the statement of financial position date, while non-monetary assets and liabilities that are measured at historical cost are translated using the exchange rate at the date of the transaction.
The resulting exchange differences from the translation of monetary items and non-monetary items held at fair value, with changes in fair value recorded to income, are recognized in our Consolidated Statements of Operations. For monetary assets classified as available-for-sale (“AFS”), translation differences calculated on amortized cost are recognized in our Consolidated Statements of Operations and other changes in carrying amount are recognized in other comprehensive income (“OCI”). The exchange differences from the translation of non-monetary items classified as AFS are recognized in OCI.
Translation to the Presentation Currency In preparing our Consolidated Financial Statements, the financial statements of foreign operations are translated from their respective functional currencies to Canadian dollars, our presentation currency. Assets and liabilities are translated at the closing exchange rate at the statement of financial position date, and income and expenses are translated using the average exchange rates. The accumulated gains or losses arising from translation of functional currencies to the presentation currency, net of the effect of any hedges, are included as a separate component of OCI within equity. Upon disposal of a foreign operation that includes loss of control, significant influence or joint control, the cumulative exchange gain or loss related to that foreign operation is recognized in income.
Invested Assets Financial Assets Excluding Derivative Financial Instruments Financial assets include cash, cash equivalents and short-term securities, debt securities, equity securities, mortgages and loans, financial assets included in other invested assets and policy loans. Financial assets are designated as financial assets at fair value through profit or loss (“FVTPL”) or AFS assets, or are classified as loans and receivables at initial recognition.
The following table summarizes the financial assets included in our Consolidated Statements of Financial Position and the asset classifications applicable to these assets:
Cash, cash equivalents and short-term securities FVTPL
Debt securities FVTPL and AFS
Equity securities FVTPL and AFS
Mortgages and loans Loans and receivables
Other invested assets FVTPL and AFS
Policy loans Loans and receivables
Mortgages and loans include mortgages, loans and debt securities not quoted in an active market. Financial assets included in Other invested assets include investments in limited partnerships, segregated funds and mutual funds. Cash equivalents are highly liquid instruments with a term to maturity of three months or less, while short-term securities have a term to maturity exceeding three months but less than one year. Policy loans are fully secured by the policy values on which the loans are made. The accounting for each asset classification is described in the following sections.
i) Initial Recognition and Subsequent Measurement Generally, debt securities, equity securities and other invested assets supporting our insurance contract liabilities or investment contract liabilities measured at fair value are designated as FVTPL, while debt securities, equity securities and other invested assets not supporting our insurance contract liabilities or that are supporting investment contract liabilities measured at amortized cost are designated as AFS. Mortgages and loans and policy loans are classified as loans and receivables. Financial assets are recognized in the Consolidated Statements of Financial Position on their trade dates, which are the dates that we commit to purchase or sell the assets. Originated mortgages and loans are recognized in the Consolidated Statements of Financial Position on their funding dates.
Financial Assets at Fair Value Through Profit or Loss Financial assets at FVTPL include financial assets that are held for trading (“HFT”), as well as financial assets that have been designated as FVTPL at initial recognition. A financial asset is classified as HFT if it is acquired principally for the purpose of selling in the near term. A financial asset can be designated as FVTPL if it eliminates or significantly reduces a measurement or recognition inconsistency that would otherwise arise from measuring assets or liabilities or recognizing the gains and losses on them on different bases; or if a group of financial assets, financial liabilities or both, is managed and its performance is evaluated on a fair value basis. Cash equivalents and short-term securities have been classified as HFT.
Generally, debt securities, equity securities and other invested assets supporting insurance contract liabilities or investment contract liabilities measured at fair value have been designated as FVTPL. This designation has been made to eliminate or significantly reduce the measurement inconsistency that would arise due to the measurement of the insurance contract or investment contract liabilities, which are based on the carrying value of the assets supporting those liabilities. Because the carrying value of insurance contract liabilities is determined by reference to the assets supporting those liabilities, changes in the insurance contract liabilities generally offset changes in the fair value of debt securities classified as FVTPL, except for changes that are due to impairment. The majority of equity securities and other invested assets classified as FVTPL are held to support products where investment returns are passed through to policyholders and therefore, changes in the fair value of those assets are significantly offset by changes in insurance contract liabilities.
98 Sun Life Financial Inc. Annual Report 2017 Notes to Consolidated Financial Statements

Financial assets classified as FVTPL are recorded at fair value in our Consolidated Statements of Financial Position and transaction costs are expensed immediately. Changes in fair value as well as realized gains and losses on sale are recorded in Fair value and foreign currency changes on assets and liabilities in our Consolidated Statements of Operations. Interest income earned and dividends received are recorded in Interest and other investment income in our Consolidated Statements of Operations.
Available-for-Sale Financial Assets Financial assets classified as AFS are recorded at fair value in our Consolidated Statements of Financial Position and transaction costs are capitalized on initial recognition. Transaction costs for debt securities are recognized in income using the effective interest method, while transaction costs for equity securities and other invested assets are recognized in income when the asset is derecognized. Changes in fair value are recorded to unrealized gains and losses in OCI. For foreign currency translation, exchange differences calculated on the amortized cost of AFS debt securities are recognized in income and exchange differences calculated on other changes in carrying amount are recognized in OCI. The exchange differences from the translation of AFS equity securities and other invested assets are recognized in OCI. Interest income earned and dividends received are recorded in Interest and other investment income in our Consolidated Statements of Operations. Net impairment losses and realized gains and losses on the sale of assets classified as AFS are reclassified from accumulated OCI to Net gains (losses) on available-for-sale assets in our Consolidated Statements of Operations.
Loans and Receivables Loans and receivables are generally carried at amortized cost. Transaction costs for mortgages and loans are capitalized on initial recognition and are recognized in income using the effective interest method. Realized gains and losses on the sale of mortgages and loans, interest income earned, and fee income are recorded in Interest and other investment income in our Consolidated Statements of Operations.
ii) Derecognition Financial assets are derecognized when our rights to contractual cash flows expire, when we transfer substantially all our risks and rewards of ownership, or when we no longer retain control.
iii) Impairment Financial assets are assessed for impairment on a quarterly basis. Financial assets are impaired and impairment losses are incurred if there is objective evidence of impairment as a result of one or more loss events and that event has an impact on the estimated future cash flows that can be reliably estimated. Objective evidence of impairment generally includes significant financial difficulty of the issuer, including actual or anticipated bankruptcy or defaults and delinquency in payments of interest or principal or disappearance of an active market for that financial asset. Objective evidence of impairment for an investment in an equity instrument or other invested asset also includes, but is not limited to, the financial condition and near-term prospects of the issuer, including information about significant changes with adverse effects that have taken place in the technological, market, economic, or legal environment in which the issuer operates that may indicate that the carrying amount will not be recovered, and a significant or prolonged decline in the fair value of an equity instrument or other invested asset below its cost. Management exercises considerable judgment in assessing for objective evidence of impairment. Due to the inherent risks and uncertainties in our evaluation of assets or groups of assets for objective evidence of impairment, the actual impairment amount and the timing of the recognition of impairment may differ from management assessment. The impairment assessment process is discussed in Note 6.
Financial Assets at Fair Value Through Profit or Loss Since financial assets classified as FVTPL are carried at fair value with changes in fair value recorded to income, any reduction in value of the assets due to impairment is already reflected in income. However, the impairment of assets classified as FVTPL generally impacts the change in insurance contract liabilities due to the impact of asset impairment on estimates of future cash flows.
Available-for-Sale Financial Assets When there is objective evidence that a financial asset classified as AFS is impaired, the loss in accumulated OCI is reclassified to Net gains (losses) on available-for-sale assets in our Consolidated Statements of Operations. Following impairment loss recognition, a debt security continues to be carried at fair value with changes in fair value recorded in OCI, and it is assessed quarterly for further impairment loss or reversal. Subsequent losses on an impaired equity security or other invested asset, including losses relating to foreign currency changes, are reclassified from OCI to income in subsequent reporting periods until the asset is derecognized. Once an impairment loss on a debt security classified as AFS is recorded to income, any reversal of impairment loss through income occurs only when the recovery in fair value is objectively related to an event occurring after the impairment was recognized. Impairment losses on an equity security or other invested asset classified as AFS are not reversed through income.
Loans and Receivables If an impairment loss on an individual mortgage or loan has been incurred, the amount of the loss is measured as the difference between the asset’s carrying amount and the present value of the estimated future cash flows discounted at the asset’s original effective interest rate. For collateralized financial assets, the present value of the estimated future cash flows reflects the cash flows that may result from foreclosure less costs to sell, whether or not foreclosure is probable. If no evidence of impairment exists for an individually assessed mortgage or loan, it is included in a group of loans with similar credit risk characteristics and collectively assessed for impairment.
When an impairment loss has been incurred, the carrying amount of the asset is reduced through the use of an allowance account, and the amount of the loss is recognized in income. If the impairment loss subsequently decreases and the decrease can be related objectively to an event occurring after the initial impairment charge was recognized, the previous impairment charge is reversed by adjusting the allowance account and the reversal is recognized in income. Interest income is recognized on impaired mortgages and loans using the effective interest rate method and it is based on the estimated future cash flows used to measure the impairment loss. Changes in the allowance account, other than write-offs net of recoveries, are charged against Interest and other investment income in our Consolidated Statements of Operations. Write-offs, net of recoveries, are deducted from the allowance account when there is no realistic prospect of recovery, which is typically not before derecognition of the asset through foreclosure or sale.
Notes to Consolidated Financial Statements Sun Life Financial Inc. Annual Report 2017 99
Collateral Cash received (pledged) as collateral is recognized (derecognized) in our Consolidated Statements of Financial Position with corresponding amounts recognized in Other liabilities (Other assets), respectively. All other types of assets received (pledged) as collateral are not recognized (derecognized) in our Consolidated Statements of Financial Position.
Derivative Financial Instruments All derivative financial instruments are recorded at fair value in our Consolidated Statements of Financial Position. Derivatives with a positive fair value are recorded as Derivative assets while derivatives with a negative fair value are recorded as Derivative liabilities.
The accounting for the changes in fair value of a derivative instrument depends on whether or not it is designated as a hedging instrument for hedge accounting purposes. Changes in (i) fair value of derivatives that are not designated for hedge accounting purposes, which are defined as derivative investments, and (ii) embedded derivatives that are bifurcated, are recorded in Fair value and foreign currency changes on assets and liabilities in our Consolidated Statements of Operations. Income earned or paid on these derivatives is recorded in Interest and other investment income in our Consolidated Statements of Operations. Hedge accounting is applied to certain derivatives to reduce income statement volatility. When certain qualification criteria are met, hedge accounting recognizes the offsetting effects of hedging instruments and hedged items in income or defers the effective portion of changes in fair value of hedging instruments in OCI until there is a recognition event, such as the occurrence of a forecasted transaction or the disposal of an investment in a foreign operation, or hedge accounting is discontinued. All hedging relationships are documented at inception and hedge effectiveness is assessed at inception and on a quarterly basis to determine whether the hedging instruments are highly effective in offsetting changes attributable to the hedged risk in the fair value or cash flows of the hedged items.
Fair Value Hedges Certain interest rate swaps and foreign currency forwards are designated as hedging instruments in fair value hedges of the interest rate or foreign exchange rate risks associated with AFS assets. Changes in fair value of the derivatives are recorded in Interest and other investment income in our Consolidated Statements of Operations. The change in fair value of the AFS assets related to the hedged risk is reclassified from OCI to income. As a result, ineffectiveness, if any, is recognized in income to the extent that changes in fair value of the derivatives and AFS assets do not offset. Interest income earned and paid on the AFS assets and swaps in the fair value hedging relationships are recorded in Interest and other investment income in our Consolidated Statements of Operations.
Cash Flow Hedges Certain equity and foreign currency forwards are designated as hedging instruments in cash flow hedges for anticipated payments of awards under certain share-based payment plans and for anticipated foreign currency purchases of foreign operations. Changes in the fair value of derivatives for the effective portion of the hedge are recognized in OCI, while the ineffective portion of the hedge and any items excluded from the hedging relationship, such as the spot-to-forward differential, are recognized in Interest and other investment income in our Consolidated Statements of Operations. A portion of the amount recognized in OCI related to the equity forwards is reclassified to income as a component of Operating expenses as the liabilities for the share-based payment awards are accrued over the vesting period. A portion of the amounts recognized in OCI related to the foreign currency forwards would be reclassified to income upon disposal or impairment of the foreign operations. All amounts recognized in, or reclassified from, OCI are net of related taxes.
Embedded Derivatives An embedded derivative is a component of a host contract that modifies the cash flows of the host contract in a manner similar to a derivative, according to a specified interest rate, financial instrument price, foreign exchange rate, underlying index or other variable. We are required to separate embedded derivatives from the host contract, if an embedded derivative has economic and risk characteristics that are not closely related to the host contract, meets the definition of a derivative, and the combined contract is not measured at fair value with changes recognized in income. If an embedded derivative is bifurcated for accounting purposes from the host contract, it will be accounted for as a derivative. For further details on embedded derivatives in insurance contracts, see the Insurance Contract Liabilities accounting policy in this Note.
Investment Properties Investment properties are real estate held to earn rental income, for capital appreciation, or both. Properties held to earn rental income or for capital appreciation that have an insignificant portion that is owner-occupied are classified as investment properties. Properties that do not meet these criteria are classified as property and equipment, included in Other assets as described below. Expenditures related to ongoing maintenance of properties incurred subsequent to acquisition are expensed. Investment properties are initially recognized at cost in our Consolidated Statements of Financial Position. Various costs incurred associated with the acquisition of an investment property are either capitalized or expensed depending on whether or not the acquisition is considered a business combination. Investment properties are subsequently measured at fair value with changes in value recorded to Fair value and foreign currency changes on assets and liabilities in our Consolidated Statements of Operations.
When the use of a property changes from owner-occupied to investment property, any gain arising on the remeasurement of the property to fair value at the date of transfer is recognized in our Consolidated Statements of Operations to the extent that it reverses a previous impairment loss. Any remaining increase is recognized in OCI.
Other Invested Assets – Non-Financial Assets Other invested assets also include non-financial assets such as investments in joint ventures and associates, which are accounted for using the equity method. Investments in joint ventures and associates are initially recorded at cost. The investment in joint ventures and associates is increased by our share of capital contributions and for purchases of additional interests and is reduced by distributions received. In addition, subsequent adjustments to the investment are made for our share of net income or loss and our share of OCI. Our share of net income is recorded in Interest and other investment income in our Consolidated Statements of Operations and our share of OCI is recorded in our Consolidated Statements of Comprehensive Income (Loss). Impairment losses on equity method investments are recognized when events or changes in circumstances indicate that they are impaired. The impairment loss recognized is the difference between the carrying amount and the recoverable amount.
100 Sun Life Financial Inc. Annual Report 2017 Notes to Consolidated Financial Statements

Other Assets Other assets which are measured at amortized cost include accounts receivable and investment income due and accrued, deferred acquisition costs, and property and equipment. Deferred acquisition costs arising from service contracts or from service components of investment contracts are amortized over the expected life of the contracts based on the future expected fees. Owner-occupied properties are amortized to their residual value over 25 to 49 years. Furniture, computers, and other office equipment, and leasehold improvements are amortized to their residual value over 2 to 20 years.
Reinsurance Assets In the normal course of business, we use reinsurance to limit exposure to large losses. We have a retention policy that requires that such arrangements be placed with well-established, highly-rated reinsurers. Reinsurance assets are measured consistently with the amounts associated with the underlying insurance contracts and in accordance with the terms of each reinsurance contract. Amounts due to or from reinsurers with respect to premiums received or paid claims are included in Other assets and Other liabilities in the Consolidated Statements of Financial Position. Premiums for reinsurance ceded are presented as premiums ceded in the Consolidated Statements of Operations. Reinsurance expenses (recoveries), as presented in our Consolidated Statements of Operations, represent reinsurance expenses and expense recoveries resulting from reinsurance agreements.
Reinsurance assets are subject to impairment testing. If impaired, the carrying value is reduced, and an impairment loss is recognized in Reinsurance expenses (recoveries) in our Consolidated Statements of Operations. Impairment occurs when objective evidence exists (as a result of an event) after the initial recognition of the reinsurance asset indicating that not all amounts due under the terms of the contract will be received, and the impairment can be reliably measured.
Reinsurance assumed is accounted for as an insurance, investment or service contract depending on the underlying nature of the agreement and if it meets the definition of an insurance, investment or service contract. For the accounting for these types of contracts, see the respective policy section in this Note.
Intangible Assets Intangible assets consist of finite life and indefinite life intangible assets. Finite life intangible assets are amortized on a straight-line basis over varying periods of up to 40 years, and are charged through operating expenses. The useful lives of finite life intangible assets are reviewed annually, and the amortization is adjusted as necessary. Indefinite life intangibles are not amortized, and are assessed for impairment annually or more frequently if events or changes in circumstances indicate that the asset may be impaired. Impairment is assessed by comparing the carrying values of the indefinite life intangible assets to their recoverable amounts. If the carrying values of the indefinite life intangibles exceed their recoverable amounts, these assets are considered impaired, and a charge for impairment is recognized in our Consolidated Statements of Operations. The recoverable amount of intangible assets is determined using various valuation models, which require management to make certain judgments and assumptions that could affect the estimates of the recoverable amount.
Goodwill Goodwill represents the excess of the cost of an acquisition over the fair value of the net identifiable tangible and intangible assets of the acquired businesses. It is carried at original cost less any impairment subsequently incurred. Goodwill is assessed for impairment annually or more frequently if events or circumstances occur that may result in the recoverable amount of a CGU or a group of CGUs falling below its carrying value. A CGU is the smallest identifiable group of assets that generates cash inflows that are largely independent of cash inflows from other groups of assets. We exercise significant judgment in determining our CGUs. The factors considered in determining our CGUs include product cash inflows, product distribution, target markets, and how management monitors and evaluates the operations.
The goodwill balances are allocated to either individual or groups of CGUs that are expected to benefit from the synergies of the business combination. Goodwill impairment is quantified by comparing a CGU’s or a group of CGUs’ carrying value to its recoverable amount, which is the higher of fair value less costs of disposal and value in use. Impairment losses are recognized immediately and cannot be reversed in future periods. Significant judgment is involved in estimating the model inputs used to determine the recoverable amount of our CGUs or group of CGUs, including those for discount rates, capital, the value of new business, expenses, cash flow projections, and market multiples, due to the uncertainty and the forward-looking nature of these inputs. The assumptions may differ from the actual experience, and estimates may change from period to period based on future events or revisions of assumptions. These key assumptions are discussed in Note 9.
Insurance Contract Liabilities Insurance contracts are contracts under which we accept significant insurance risk from a policyholder by agreeing to compensate the policyholder if a specified uncertain future event adversely affects the policyholder. The presence of significant insurance risk in individual contracts is assessed by reviewing books of contracts with homogeneous risk features. Judgment is required to determine the classification of a contract as an insurance contract, investment contract or a service contract.
As discussed in the Segregated Funds section of this Note, certain insurance contracts under which the policyholder bears the risks associated with the underlying investments are classified as Insurance contracts for account of segregated fund holders in our Consolidated Statements of Financial Position.
Insurance contract liabilities, including policy benefits payable and provisions for policyholder dividends, are determined in accordance with Canadian accepted actuarial practice and any requirements of OSFI. As confirmed by guidance provided by the Canadian Institute of Actuaries (“CIA”), the current Canadian Asset Liability Method (“CALM”) of valuation of insurance contract liabilities satisfies the IFRS 4 Insurance Contracts (“IFRS 4”) requirements for eligibility for use under IFRS. Under CALM, liabilities are set equal to the statement of financial position value of the assets required to support them.
Some insurance contracts contain discretionary participation features (“DPF”), whereby the policyholder has the right to receive potentially significant additional benefits based on the actual investments and other experience on a block of similar contracts. IFRS allows the non-guaranteed, or participating, elements of such contracts to be classified as either a liability or as equity, depending on the nature of our obligation to the policyholder. The contracts issued by us contain constructive obligations to the policyholder with
Notes to Consolidated Financial Statements Sun Life Financial Inc. Annual Report 2017 101

respect to the DPF of the contracts. We have therefore elected to classify these features as a liability, consistent with accounting treatment under CALM, and in accordance with guidance provided by the CIA.
Derivatives embedded in insurance contracts are treated as separate derivatives and measured at fair value with changes in fair value recognized in income, except when the embedded derivative itself meets the definition of an insurance contract under IFRS, or when the risks and characteristics are closely related to those of the host contracts or when the derivative is the policyholder’s option to surrender an insurance contract for a fixed amount or an amount based on a fixed amount and an interest rate. The derivatives that have not been separated are accounted for as insurance contract liabilities.
Significant judgment is required in determining our liabilities for insurance contracts including the assumptions required for their determination. Application of different assumptions may result in different measurement of the insurance contract liabilities. Actual experience may differ from assumptions, and estimates may change from period to period based on future events or revisions of assumptions. Key assumptions and considerations in choosing assumptions are discussed in Note 10 and sensitivities are discussed in Note 7.
Financial Liabilities Investment Contract Liabilities Contracts issued by us that do not transfer significant insurance risk, but do transfer financial risk from the policyholder to us, are financial liabilities and are accounted for as investment contracts. Service components of investment contracts are treated as service contracts. For further details on how service components of investment contracts are treated, see the Service Contracts accounting policy in this Note.
Liabilities for investment contracts without DPF are measured at FVTPL or amortized cost. Contracts recorded at FVTPL are measured at fair value at inception and each subsequent reporting period. Contracts recorded at amortized cost are initially recognized at fair value, less transaction costs directly attributable to the issue of the contract. These liabilities are derecognized when the obligation of the contract is discharged, cancelled or expired. At each subsequent period, the contracts are measured at amortized cost using the effective interest method. Changes in fair value of investment contract liabilities recorded at FVTPL and amortization on contracts recorded at amortized cost are recorded as an Increase (decrease) in investment contract liabilities in our Consolidated Statements of Operations. Deposits collected from and payments made to contract holders are recorded as an increase and decrease in Investment contract liabilities in our Consolidated Statements of Financial Position.
As discussed in the Segregated Funds section of this Note, certain investment contracts under which the policyholder bears the risks associated with the underlying investments are classified as Investment contracts for account of segregated fund holders in the Consolidated Statements of Financial Position. The accounting for investment contracts that contain DPF is described in the Insurance Contract Liabilities section of this Note.
Other Liabilities Other liabilities, which are measured at amortized cost, include accounts payable, repurchase agreements, accrued expenses and taxes, senior financing and provisions. Liabilities for provisions, other than insurance contract liabilities and investment contract liabilities, are recognized for present legal or constructive obligations as a result of a past event if it is probable that they will result in an outflow of economic resources and the amount can be reliably estimated. The amounts recognized for these provisions are the best estimates of the expenditures required to settle the present obligations or to transfer them to a third party at the statement of financial position date, considering all the inherent risks and uncertainties, as well as the time value of money. These provisions are reviewed as relevant facts and circumstances change.
Senior Debentures and Subordinated Debt Senior debentures and subordinated debt liabilities are recorded at amortized cost using the effective interest method. Transaction costs are recorded as part of the liability and are recognized in income using the effective interest method. These liabilities are derecognized when the obligation of the contract is discharged, cancelled or expired.
Service Contracts Contracts issued by us that do not transfer significant insurance risk and do not transfer financial risk from the policyholder to us are classified as service contracts. Service components of investment contracts are also accounted for as service contracts. Fee income earned from these contracts is described in the Premium and Fee Income Recognition accounting policy section of this Note. Deferred acquisition costs are described under the Other Assets accounting policy section of this Note. Where the cost of meeting the obligations of the contract exceed the economic benefits expected to be received under it, a provision is recognized in Other liabilities.
Segregated Funds Segregated funds are products for which we issue a contract where the benefit amount is directly linked to the fair value of the investments held in the particular segregated fund. Although the underlying assets are registered in our name and the segregated fund contract holder has no direct access to the specific assets, the contractual arrangements are such that the segregated fund policyholder bears the risks and rewards of the fund’s investment performance. In addition, certain contracts include guarantees from us. We derive fee income from segregated funds, which is included in Fee income in our Consolidated Statements of Operations. Policyholder transfers between general funds and segregated funds are included in Net transfer to (from) segregated funds in our Consolidated Statements of Operations. Deposits to segregated funds are reported as increases in segregated funds liabilities and are not reported as revenues in our Consolidated Statements of Operations.
Investments for Account of Segregated Fund Holders Investments for account of segregated fund holders are recorded separately from the Total general fund assets in our Consolidated Statements of Financial Position and are carried at fair value. Fair values are determined using quoted market values or, where quoted market values are not available, estimated fair values as determined by us.
Insurance Contracts for Account of Segregated Fund Holders Insurance contracts for account of segregated fund holders are recorded separately from the Total general fund liabilities in our Consolidated Statements of Financial Position. Insurance contracts under which the segregated fund holders bear the risks associated
102 Sun Life Financial Inc. Annual Report 2017 Notes to Consolidated Financial Statements

with the underlying investments are classified as Insurance contracts for account of segregated fund holders. The liabilities reported as Insurance contracts for account of segregated fund holders are measured at the aggregate of the policyholder account balances. Changes in the fair value of the invested assets of the segregated funds are recorded in net realized and unrealized gains (losses) within the segregated fund and are not recorded in our Consolidated Statements of Operations.
Other assets and liabilities associated with these insurance contracts, such as origination costs and the liabilities associated with guarantees provided by us, are included in general fund liabilities in Insurance contract liabilities in our Consolidated Statements of Financial Position.
Investment Contracts for Account of Segregated Fund Holders Investment contracts for account of segregated fund holders are recorded separately from the Total general fund liabilities in our Consolidated Statements of Financial Position. Investment contracts under which the segregated fund holders bear the risks associated with the underlying investments are classified as Investment contracts for account of segregated fund holders. The liabilities reported as Investment contracts for account of segregated fund holders are measured at the aggregate of the policyholder account balances.
Other liabilities associated with these investment contracts, such as onerous contract provisions required for service components, are included in general fund liabilities in Investment contract liabilities in our Consolidated Statements of Financial Position.
Income Taxes Current income tax assets and liabilities for the current and prior periods are measured at the amount expected to be recovered from or paid to the taxation authorities. Deferred income tax is provided using the liability method on temporary differences at the statement of financial position date between the tax bases of assets and liabilities and their carrying amounts for financial reporting purposes. Current and deferred income tax relating to items recognized, in the current or previous period, in OCI or directly in equity is accordingly recognized in OCI or equity and not in our Consolidated Statements of Operations. Interest and penalties payable to taxation authorities are recorded in Interest expense and Operating expenses, respectively, in our Consolidated Statements of Operations.
Deferred income tax assets and liabilities are calculated based on income tax rates and laws that are expected to apply when the liability is settled or the asset is realized, which are normally those enacted or considered substantively enacted at our Consolidated Statements of Financial Position dates. Deferred income tax assets are recognized for all deductible temporary differences, carry forward of unused tax credits and unused tax losses to the extent that it is probable that future taxable profit will be available against which these assets can be utilized. At each reporting period, we assess all available evidence, both positive and negative, to determine the amount of deferred income tax assets to be recognized. The recognition of deferred income tax assets requires estimates and significant judgment about future events, such as projections of future taxable profits, based on the information available at the reporting date.
The determination of the required provision for current and deferred income taxes requires that we interpret tax legislation in the jurisdictions in which we operate. For each reporting period, our income tax provision reflects our best estimate, based on the information available at the reporting date, of tax positions that are under audit or appeal by relevant tax authorities. To the extent that our estimate of tax positions or the timing of realization of deferred income tax assets or liabilities are not as expected, the provision for income taxes may increase or decrease in the future to reflect the actual experience.
Deferred income tax is provided on temporary differences arising on investments in subsidiaries, joint ventures and associates, except where we control the timing of the reversal of the temporary difference and it is apparent that the temporary difference will not reverse in the foreseeable future. No deferred income tax asset or liability is recognized in relation to temporary differences that arise from the initial recognition of an asset or liability in a transaction that is not a business combination and, at the time of the transaction, did not affect either the accounting profit or taxable profit or loss. Deferred income tax assets and deferred income tax liabilities are offset if a legally enforceable right exists to set off current tax assets against current tax liabilities, the deferred income taxes relate to the same taxable entity and the same taxation authority and we intend either to settle on a net basis, or to realize the asset and settle the liability simultaneously.
In determining the impact of taxes, we are required to comply with Canadian accepted actuarial practice and IFRS. CALM requires that all projected cash flows associated with insurance contract liabilities, including income taxes, be included in the determination of insurance contract liabilities. The insurance contract liabilities are therefore determined including all policy-related income tax effects on a discounted basis, and then adjusted for any related deferred income tax assets and liabilities held in accordance with IFRS. The net result of this adjustment is to leave the discounting effect of the deferred income taxes associated with temporary differences on policy-related tax items in the insurance contract liabilities.
Pension Plans and Other Post-Retirement Benefits For defined benefit plans, the present value of the defined benefit obligation is calculated by independent actuaries using the projected unit credit method, and actuarial assumptions that represent best estimates of future variables that will affect the ultimate cost of these obligations. The discount rate used for our material defined benefit plans is determined with reference to market yields of high-quality corporate bonds that are denominated in the same currency in which the benefits will be paid, and that have terms to maturity approximating the terms of obligations. Plan assets are measured at fair value and are held in separate trustee administered funds. The difference between the fair value of the plan assets and the present value of the defined benefit obligation is recognized on the Consolidated Statements of Financial Position as an asset or liability in Other assets or Other liabilities, respectively.
Costs charged to our Consolidated Statements of Operations include current service cost, any past service costs, any gains or losses from curtailments or settlements, and interest on the net defined benefit liability (asset). Remeasurement of the net defined benefit liability (asset), which includes the impact of changes to the actuarial assumption underlying the liability calculations, liability experience gains or losses, the difference between the return on plan assets and the amount included in the interest on the net defined benefit liability (asset), is reflected immediately in OCI. The calculation of the defined benefit expenses and obligations requires judgment as the recognition is dependent on various actuarial assumptions such as discount rates, health care cost trend rates and projected compensation increases. These key assumptions are discussed in Note 25.
Notes to Consolidated Financial Statements Sun Life Financial Inc. Annual Report 2017 103

Dividends Dividends payable to holders of shares of SLF Inc. are recognized in the period in which they are authorized or approved. Dividends that have been reinvested in additional common shares under the Dividend Reinvestment and Share Purchase Plan (“DRIP”) are also reflected as dividends within retained earnings. Where SLF Inc. has issued common shares from treasury under the DRIP, the additional shares have been reflected in common shares.
Premium and Fee Income Recognition Gross premiums for all types of insurance contracts excluding segregated fund contracts are generally recognized as revenue when due.
Fee income includes fund management and other asset-based fees, commissions from intermediary activities, and fees on service contracts and is recognized when services are rendered.
Share-Based Payments Stock options of SLF Inc. granted to employees are accounted for as equity-settled share-based payment transactions. The total compensation expense for stock options is computed based on the fair value of the stock option at the date of grant and the estimated number of options expected to vest at the end of the vesting period. The expense is recognized over the vesting period as compensation expense in Operating expenses in our Consolidated Statements of Operations, with an offset to contributed surplus in our Consolidated Statements of Changes in Equity. When options are exercised, new common shares are issued, contributed surplus is reversed and the common shares issued are credited to common shares in our Consolidated Statements of Changes in Equity.
Other share-based payment plans based on the value of SLF Inc.’s common shares are accounted for as cash-settled share-based payment transactions. The total liabilities for these plans are computed based on the estimated number of awards expected to vest at the end of the vesting period. The liabilities are recomputed at the end of each reporting period and are measured at the fair value of the award at that reporting date. The liabilities are accrued and expensed on a straight-line basis over the vesting periods. The liabilities are settled in cash at the end of the vesting period.
Share-based payment awards within MFS Investment Management (“MFS”) which are based on their own shares, are accounted for as cash-settled share-based payment awards. The vested and unvested awards, as well as the shares that have been issued under these plans, are recognized as liabilities because the subsidiary has a practice of purchasing the issued shares from employees after a specified holding period. The total liabilities for these plans are computed based on the estimated number of awards expected to vest at the end of the vesting period. The liabilities are accrued over the vesting period and are measured at fair value at each reporting period with the change in fair value recognized as compensation expense in Operating expenses in our Consolidated Statements of Operations. The liabilities are settled in cash when the shares are purchased from the employees.
Basic and Diluted Earnings Per Share (“EPS”) Basic EPS is calculated by dividing the common shareholders’ net income by the weighted average number of common shares issued and outstanding.
Diluted EPS adjusts common shareholders’ net income and the weighted average number of common shares for the effects of all dilutive potential common shares under the assumption that convertible instruments are converted and that outstanding options are exercised. Diluted EPS is calculated by dividing the adjusted common shareholders’ net income by the adjusted weighted average number of common shares outstanding. For convertible instruments, common shareholders’ net income is increased by the after-tax expense on the convertible instrument while the weighted average common shares are increased by the number of common shares that would be issued at conversion. For stock options, it is assumed that the proceeds from the exercise of options whose exercise price is less than the average market price of common shares during the period are used to repurchase common shares at the average market price for the period. The difference between the number of common shares issued for the exercise of the dilutive options and the number of common shares that would have been repurchased at the average market price of the common shares during the period is adjusted to the weighted average number of common shares outstanding.
2. Changes in Accounting Policies
2.A Amended International Financial Reporting Standards Adopted in 2017 The following amendments are effective for annual periods beginning on or after January 1, 2017, and did not have a material impact on our Consolidated Financial Statements.
In January 2016, the IASB issued narrow-scope amendments to IAS 12 Income Taxes (“IAS 12”). The amendments clarify how to account for deferred tax assets related to unrealized losses on debt instruments measured at fair value. These amendments were applied retrospectively.
In January 2016, the IASB issued Disclosure Initiative (Amendments to IAS 7), which amends IAS 7 Statement of Cash Flows. The amendments require entities to provide disclosure that enables users of financial statements to evaluate changes in liabilities arising from financing activities, including both changes arising from cash flows and non-cash changes. These amendments were applied prospectively.
In December 2016, the IASB issued Annual Improvements to IFRSs 2014-2016 Cycle, which includes a minor amendment to IFRS 12 Disclosure of Interests in Other Entities (“IFRS 12”). The amendment provides clarification guidance to the scope of IFRS 12 and was applied retrospectively.
104 Sun Life Financial Inc. Annual Report 2017 Notes to Consolidated Financial Statements

2018 2.B New and Amended International Financial Reporting Standards to be Adopted in
The following new and amended IFRS were issued by the IASB and are expected to be adopted by us in 2018.
In May 2014, the IASB issued IFRS 15 Revenue from Contracts with Customers (“IFRS 15”), which replaces IAS 11 Construction Contracts, IAS 18 Revenue and various interpretations. Amendments to IFRS 15 were issued in September 2015 and April 2016. IFRS 15 establishes principles about the nature, amount, timing, and uncertainty of revenue arising from contracts with customers. IFRS 15 requires entities to recognize revenue to reflect the transfer of goods or services to customers measured at the amounts an entity expects to be entitled to in exchange for those goods or services. Insurance contracts and revenues arising from those contracts, primarily premium revenue, are not within the scope of this standard. Revenues from service contracts and service components of investment contracts that are reported in Fee income and primarily arises from our asset management businesses are within the scope of IFRS 15. IFRS 15 also provides guidance related to the costs to obtain and to fulfill a contract. IFRS 15 is effective for annual periods beginning on or after January 1, 2018 and is to be applied retrospectively, or on a cumulative retrospective basis. We will be adopting IFRS 15 on a retrospective basis. The adoption of IFRS 15 is not expected to have a material impact on our Consolidated Financial Statements.
In June 2016, the IASB issued Classification and Measurement of Share-based Payment Transactions, which amends IFRS 2 Share-based Payment. The amendments clarify how to account for certain types of share-based payment transactions, such as the effects of vesting and non-vesting conditions on the measurement of cash-settled share-based payments. These amendments are effective for annual periods beginning on or after January 1, 2018, and are applicable to awards granted on or after that date and to unvested and vested but unexercised awards outstanding at that date. We will be adopting the amendments prospectively. We do not expect the adoption of these amendments to have a material impact on our Consolidated Financial Statements.
In September 2016, the IASB issued Amendments to IFRS 4 to allow insurance entities whose predominant activities are to issue contracts within the scope of IFRS 4 an optional temporary exemption from applying IFRS 9 Financial Instruments (“IFRS 9”) until 2021 (“deferral approach”). We qualify and will elect the deferral approach permitted under the amendments effective January 1, 2018. Consequently, we will continue to apply IAS 39 Financial Instruments: Recognition and Measurement (“IAS 39”), the existing financial instrument standard until 2021.
In December 2016, the IASB issued Annual Improvements to IFRSs 2014-2016 Cycle, which includes minor amendments to IFRS 1 First-time Adoption of International Financial Reporting Standards and IAS 28 Investments in Associates and Joint Ventures (“IAS 28”) that are effective for annual periods beginning on or after January 1, 2018. We do not expect the adoption of these amendments to have a material impact on our Consolidated Financial Statements.
In December 2016, the IASB issued Transfers of Investment Property (Amendments to IAS 40). The amendments to IAS 40 Investment Property clarify that an entity shall transfer property to, or from, investment property when, and only when, there is evidence of a change in use. The amendments are effective for annual periods beginning on or after January 1, 2018. We do not expect the adoption of these amendments to have a material impact on our Consolidated Financial Statements.
In December 2016, the IASB issued IFRIC 22 Foreign Currency Transactions and Advance Consideration (“IFRIC 22”), which was developed by the IFRS Interpretations Committee. IFRIC 22 clarifies that for purposes of determining the exchange rate in transactions which include the receipt or payment of advance consideration in a foreign currency, the date of the transaction is the date of initial recognition of the non-monetary prepayment asset or deferred income liability. IFRIC 22 is effective for annual periods beginning on or after January 1, 2018. We do not expect IFRIC 22 to have a material impact on our Consolidated Financial Statements.
2.C New and Amended International Financial Reporting Standards to be Adopted in 2019 or Later The following new and amended standards were issued by the IASB and are expected to be adopted by us in 2019 or later.
In July 2014, the IASB issued the final version of IFRS 9, which replaces IAS 39. IFRS 9 includes guidance on the classification and measurement of financial instruments, impairment of financial assets, and hedge accounting. Financial asset classification is based on the cash flow characteristics and the business model in which an asset is held. The classification determines how a financial instrument is accounted for and measured. IFRS 9 also introduces an impairment model for financial instruments not measured at fair value through profit or loss that requires recognition of expected losses at initial recognition of a financial instrument and the recognition of full lifetime expected losses if certain criteria are met. In addition, a new model for hedge accounting was introduced to achieve better alignment with risk management activities. This standard is effective for annual periods beginning on or after January 1, 2018. In October 2017, the IASB issued narrow-scope amendments to IFRS 9. The amendments clarify the classification of certain prepayable financial assets and the accounting of financial liabilities following modification. The amendments are effective for annual periods beginning on or after January 1, 2019. However, pursuant to the aforementioned amendments to IFRS 4, we will elect the deferral approach permitted under IFRS 4 to continue to apply IAS 39 until 2021. We are currently assessing the impact that IFRS 9, along with these amendments, will have on our Consolidated Financial Statements.
In January 2016, the IASB issued IFRS 16 Leases (“IFRS 16”), which replaces IAS 17 Leases, and related interpretations. IFRS 16 sets out the principles for the recognition, measurement, presentation and disclosure of leases for both lessees and lessors. For lessees, IFRS 16 removes the classification of leases as either operating or financing and requires that all leases be recognized on the statement of financial position, with certain exemptions that include leases of 12 months or less. The accounting for lessors is substantially unchanged. The standard is effective for annual periods beginning on or after January 1, 2019, to be applied retrospectively, or on a modified retrospective basis. We are currently assessing the impact the adoption of this standard will have on our Consolidated Financial Statements.
In May 2017, the IASB issued IFRS 17 Insurance Contracts (“IFRS 17”), which replaces IFRS 4. IFRS 17 establishes the principles for the recognition, measurement, presentation and disclosure of insurance contracts. IFRS 17 requires entities to measure insurance contract liabilities at their current fulfillment values using one of three measurement models, depending on the nature of the contract. IFRS 17 is effective for annual periods beginning on or after January 1, 2021 and is to be applied retrospectively to each group of
Notes to Consolidated Financial Statements Sun Life Financial Inc. Annual Report 2017 105

insurance contracts unless impracticable. If, and only if, it is impracticable to apply IFRS 17 retrospectively for a group of insurance contracts, an entity shall apply IFRS 17 using a modified retrospective approach or a fair value approach. IFRS 17 will affect how we account for our insurance contracts and how we report our financial performance in our Consolidated Statements of Operations. We are currently assessing the impact that IFRS 17 will have on our Consolidated Financial Statements.
In June 2017, the IASB issued IFRIC 23 Uncertainty over Income Tax Treatments (“IFRIC 23”), which was developed by the IFRS Interpretations Committee. IFRIC 23 clarifies how to apply the recognition and measurement requirements in IAS 12 when there is uncertainty over income tax treatments, and requires an entity to determine whether tax treatments should be considered collectively or independently. In addition, IFRIC 23 addresses the assumptions an entity should make about the examination of tax treatments by taxation authorities, as well as how an entity should consider changes in facts and circumstances. IFRIC 23 also provides guidance on how to determine taxable profit (tax loss), tax bases, unused tax losses, unused tax credits, and tax rates, based on whether it is probable that a tax authority will accept an uncertain tax treatment used, or proposed to be used, by an entity in its income tax filings. IFRIC 23 is effective for annual periods beginning on or after January 1, 2019 and is to be applied retrospectively, or on a cumulative retrospective basis. We are currently assessing the impact that IFRIC 23 will have on our Consolidated Financial Statements.
In October 2017, the IASB issued narrow-scope amendments to IAS 28. The amendments clarify that long-term interests in an associate or joint venture to which the equity method is not applied should be accounted for following the requirements of IFRS 9. The amendments are effective for annual periods beginning on or after January 1, 2019, and are to be applied retrospectively with certain exceptions. As we will not adopt IFRS 9 until 2021, we will be required to apply IAS 39 to the long-term interests in associates or joint ventures covered by these amendments. We are currently assessing the impact the adoption of these amendments will have on our Consolidated Financial Statements.
In December 2017, the IASB issued Annual Improvements to IFRSs 2015-2017 Cycle, which includes minor amendments to four IFRS standards. The amendments are effective for annual periods beginning on or after January 1, 2019. We are currently assessing the impact the adoption of these amendments will have on our Consolidated Financial Statements.
In February 2018, the IASB issued Plan Amendment, Curtailment or Settlement which amends IAS 19 Employee Benefits (“IAS 19”). Under IAS 19, when an amendment, curtailment or settlement of a defined benefit pension plan occurs, the net defined benefit liability or asset is remeasured. The amendments require an entity to use the updated assumptions from this remeasurement to determine current service cost and net interest for reporting periods after the change to the plan. The amendments are applicable to plan amendments, curtailments or settlements occurring on or after January 1, 2019. We are currently assessing the impact the adoption of these amendments will have on our Consolidated Financial Statements.
3. Acquisitions
Acquisitions Completed in 2017 Acquisition in Sun Life Financial Asia On October 3, 2017, we completed the first stage of our acquisition of the pension business of FWD Life Insurance Company (Bermuda) Limited (“FWD”) for total consideration of approximately $105, consisting of $92 initial cash consideration and estimated contingent consideration of $13 to be paid if certain future performance targets are achieved. The first stage included the acquisition of the Mandatory Provident Fund business and the commencement of an exclusive 15-year distribution agreement with FWD that allows Sun Life Hong Kong Limited to distribute its pension products through FWD’s agency force in Hong Kong. The fair value of the net identifiable assets acquired in the transaction was $89, which included intangible assets of $61 and a related deferred tax liability of $10. The acquired intangible assets consist of client relationships and distribution intangible assets which are subject to amortization on a straight-line basis over their projected economic life of 30 years and 15 years, respectively. We recognized goodwill of $16 as a result of this transaction. The completion of the second and final stage of the transaction involves the purchase of the Occupational Retirement Schemes Ordinance business of FWD, and is expected to close by the end of 2018, subject to the receipt of regulatory approvals and satisfaction of customary closing conditions. These transactions will strengthen our position in the Hong Kong pension market and will be reported in our Sun Life Financial Asia (“SLF Asia”) reportable segment.
Acquisitions Completed in 2016 Acquisition in Sun Life Financial United States On March 1, 2016, we completed the purchase of the U.S. Employee Benefits business of Assurant, Inc. for total consideration of $1,264 which consisted of a ceding commission and a payment for the acquisition of direct subsidiaries. The purchase price included contingent consideration of $21 that was paid in the third quarter of 2016. The acquisition was effected through reinsurance agreements and the direct purchase of 100% of the voting shares of certain legal entities. The results and the net assets acquired, including goodwill, are recorded in our Sun Life Financial United States (“SLF U.S.”) reportable segment in Note 4. The acquisition adds new capabilities and increases the size and scale of this business segment.
106 Sun Life Financial Inc. Annual Report 2017 Notes to Consolidated Financial Statements

The components of the fair value of net identifiable assets recognized from this acquisition consist of the following:
As at March 1, 2016
Fair value of consideration transferred $ 1,264
Fair value of net identifiable assets acquired:
Assets acquired:
Invested assets $ 2,345(1)
Other assets 156
Deferred tax assets 186
Intangible assets 270(2)
Total assets acquired $ 2,957
Liabilities assumed:
Insurance contract liabilities $ 2,248
Other liabilities assumed 105
Total liabilities assumed $ 2,353
Fair value of net identifiable assets acquired $ 604
Goodwill $ 660(3)
(1) Includes cash and cash equivalents of $53, debt securities of $1,828, mortgages and loans of $376, and equity securities of $88. (2) The acquired intangible assets are finite life intangible assets that consist of client relationship intangible assets of $180 and distribution intangible assets of $90 that will be
amortized on a straight-line basis over 15 years. (3) The goodwill represents the excess of the purchase price over the fair value of net assets and includes the benefit of synergies and future business and other economic
benefits arising from this transaction of which $318 is deductible for tax purposes.
Acquisitions in Sun Life Financial Asia During 2016, we acquired full ownership of our joint venture insurance company in Vietnam, PVI Sun Life Insurance Company Limited, subsequently renamed to Sun Life Vietnam Insurance Company Limited (“PVI Sun Life”). On January 7, 2016, we increased our ownership interest in PVI Sun Life, from 49% to 75% by acquiring from PVI Holdings an additional 26% of PVI Sun Life’s charter capital for cash consideration of $49. As a result, we obtained control and re-measured our existing ownership interest in PVI Sun Life at fair value on the acquisition date, resulting in the recognition of a one-time, non-cash gain of $31 recorded in Interest and other investment income in our Consolidated Statements of Operations. This gain consists of $23 related to the difference between the fair value and carrying value of our 49% interest in PVI Sun Life under the equity method of accounting and $8 related to reclassification of cumulative translation difference from accumulated other comprehensive income to net income. The fair value of net identifiable assets includes cash and cash equivalents of $2 and intangible assets of $6. Goodwill arising from this transaction was $51, which primarily reflects expectations of future business. Non-controlling interests arising from acquisition were $18, which were recognized as its proportionate share of the fair value of the net identifiable assets. In connection with this acquisition, we also entered into an agreement that allowed PVI Holdings to sell all of its remaining charter capital in PVI Sun Life to us within a 10-year period, which was recognized as Transaction with non-controlling interests in our Consolidated Statements of Changes in Equity. On November 9, 2016, we acquired the remaining 25% of non-controlling interests from PVI Holdings for cash consideration of $46. As the acquisition of non-controlling interests was accounted for as an equity transaction, the difference between consideration transferred and the reduction of non-controlling interests was recognized directly in shareholders’ equity. Refer to Note 27.B for changes to non-controlling interests during 2016.
On July 1, 2016, we increased our investment in our joint venture in Indonesia, PT CIMB Sun Life from 49% to 100% and simultaneously entered into an extended bancassurance agreement with PT Bank CIMB Niaga to strengthen our distribution capabilities for total consideration of approximately $76, consisting of $54 initial cash consideration and estimated contingent consideration of $22, of which $20 was paid to date and the remaining amount to be paid in 2018. As a result of this transaction, we obtained control and re-measured our existing ownership interest in PT CIMB Sun Life at fair value on the acquisition date, resulting in the recognition of a one-time, non-cash gain of $6 recorded in Interest and other investment income in our Consolidated Statements of Operations, which relates to the difference between the fair value and carrying value of our 49% interest in PT CIMB Sun Life under the equity method of accounting. The fair value of net identifiable assets includes cash and cash equivalents of $8, distribution intangible assets of $67 and a net deferred tax liability of $17. The acquired intangible asset is subject to amortization on a straight-line basis. Goodwill arising from this transaction was $45, which primarily reflects expectations of future business and expense synergies.
The results and the net assets acquired, including goodwill, from these acquisitions are recorded in our SLF Asia reportable segment in Note 4.
4. Segmented Information
We have five reportable segments: SLF Canada, SLF U.S., Sun Life Financial Asset Management (“SLF Asset Management”), SLF Asia, and Corporate.
These reportable segments operate in the financial services industry and reflect our management structure and internal financial reporting. Corporate includes the results of our U.K. business unit (“SLF U.K.”) and our Corporate Support operations, which include run-off reinsurance operations as well as investment income, expenses, capital, and other items not allocated to our other business groups.
Revenues from our reportable segments are derived principally from life and health insurance, investment management and annuities, and mutual funds. Revenues not attributed to the strategic business units are derived primarily from Corporate investments and
Notes to Consolidated Financial Statements Sun Life Financial Inc. Annual Report 2017 107

earnings on capital. Transactions between segments are executed and priced on an arm’s-length basis in a manner similar to transactions with third parties.
The expenses in each business segment may include costs or services directly incurred or provided on their behalf at the enterprise level. For other costs not directly attributable to one of our business segments, we use a management reporting framework that uses assumptions, judgments, and methodologies for allocating overhead costs, and indirect expenses to our business segments.
Intersegment transactions consist primarily of internal financing agreements which are measured at fair values prevailing when the arrangements are negotiated. Intersegment investment income consists primarily of interest paid by SLF U.S. to Corporate. Intersegment fee income is primarily asset management fees paid by SLF Canada and Corporate to SLF Asset Management, and product distribution fees paid by SLF Asset Management to SLF U.S. Intersegment transactions are presented in the Consolidation adjustments column in the following tables.
Management considers its external clients to be individuals and corporations. We are not reliant on any individual client as none are individually significant to our operations.
Results by segment for the years ended December 31, are as follows:
SLF Canada SLF U.S.
SLF Asset Management
SLF Asia Corporate
Consolidation adjustments Total
2017 Gross premiums:
Annuities Life insurance Health insurance
$ 2,464 4,493 4,916
$ – 2,837 3,570
$ – – –
$ – 1,407
19
$ 24 94 14
$ – – –
$ 2,488 8,831 8,519
Total gross premiums Less: ceded premiums Net investment income (loss) Fee income
11,873 3,871 4,133 1,132
6,407 452
2,442 233
– –
45 4,037
1,426 210
1,144 394
132 24
526 118
– –
(79) (72)
19,838 4,557 8,211 5,842
Total revenue Less:
13,267 8,630 4,082 2,754 752 (151) 29,334
Total benefits and expenses
Income tax expense (benefit)
11,894
197
8,699
(381)
2,976
453
2,349
51
778
(18)
(151)
–
26,545
302
Total net income (loss) $ 1,176 $ 312 $ 653 $ 354 $ (8) $ – $ 2,487
Less: Net income (loss) attributable to participating policyholders and non-controlling interests 213 4 – 28 – – 245
Shareholders’ net income (loss) $ 963 $ 308 $ 653 $ 326 $ (8) $ – $ 2,242
2016 Gross premiums:
Annuities Life insurance Health insurance
$ 2,585 4,107 4,368
$ 11 2,734 3,507
$ – – –
$ – 1,954
17
$ 28 99 17
$ – – –
$ 2,624 8,894 7,909
Total gross premiums Less: ceded premiums Net investment income (loss) Fee income
11,060 3,671 3,751 1,026
6,252 565
2,109 228
– –
(3) 3,932
1,971 117 761 341
144 26
1,428 131
– –
(101) (78)
19,427 4,379 7,945 5,580
Total revenue Less:
12,166 8,024 3,929 2,956 1,677 (179) 28,573
Total benefits and expenses
Income tax expense (benefit)
10,797
208
7,450
61
2,807
393
2,581
51
1,672
(94)
(179)
–
25,128
619
Total net income (loss) $ 1,161 $ 513 $ 729 $ 324 $ 99 $ – $ 2,826
Less: Net income (loss) attributable to participating policyholders and non-controlling interests 225 5 – 15 – – 245
Shareholders’ net income (loss) $ 936 $ 508 $ 729 $ 309 $ 99 $ – $ 2,581
108 Sun Life Financial Inc. Annual Report 2017 Notes to Consolidated Financial Statements

Assets and liabilities by segment are as follows:
SLF SLF SLF Asset SLF Consolidation Canada U.S. Management Asia Corporate adjustments Total
As at December 31, 2017 Total general fund assets $ 84,698 $ 43,899 $ 4,115 $ 15,594 $ 14,605 $ (191) $ 162,720 Investments for account of
segregated fund holders $ 87,817 $ 1,196 $ – $ 5,393 $ 11,986 $ – $ 106,392 Total general fund liabilities $ 76,683 $ 39,359 $ 2,346 $ 11,180 $ 10,372 $ (191) $ 139,749
As at December 31, 2016
Total general fund assets $ 82,456 $ 45,066 $ 4,277 $ 15,103 $ 14,341 $ (172) $ 161,071
Investments for account of segregated fund holders $ 79,964 $ 1,269 $ – $ 4,605 $ 11,329 $ – $ 97,167
Total general fund liabilities $ 74,278 $ 40,356 $ 2,384 $ 10,866 $ 10,991 $ (172) $ 138,703
The revenue and assets of our reportable segments differ from geographic segments primarily due to the geographic segmenting of our SLF Asset Management and Corporate segments.
The following table shows revenue by country for SLF Asset Management and Corporate:
SLF Asset Management Corporate
For the years ended December 31, 2017 2016 2017 2016
Revenue:
United States
United Kingdom
Canada(1)
Other countries
$ 3,961 –
121 –
$ 3,791
–
138
–
$ 147 577 20 8
$ 170
1,412
74
21
Total revenue $ 4,082 $ 3,929 $ 752 $ 1,677
(1) Consists of the Canadian operations of the Bentall Kennedy group of companies (“Bentall Kennedy”) and Sun Life Institutional Investments (Canada) Inc. for SLF Asset Management.
The following table shows total assets by country for SLF Asset Management and Corporate:
SLF Asset Management Corporate
As at December 31, 2017 2016 2017 2016
Total general fund assets:
United States
United Kingdom
Canada(1)
Other countries
$ 3,750 –
365 –
$ 3,745
–
532
–
$ 1,984 8,744 3,723 154
$ 2,356
8,731
3,116
138
Total general fund assets $ 4,115 $ 4,277 $ 14,605 $ 14,341
Investment for account of segregated fund holders:
United Kingdom $ – $ – $ 11,986 $ 11,329
Total investment for account of segregated fund holders $ – $ – $ 11,986 $ 11,329
(1) Consists of the Canadian operations of Bentall Kennedy and Sun Life Institutional Investments (Canada) Inc. for SLF Asset Management.
Notes to Consolidated Financial Statements Sun Life Financial Inc. Annual Report 2017 109

5. Total Invested Assets and Related Net Investment Income
5.A Fair Value of Invested Assets 5.A.i Carrying Value and Fair Value of Financial Assets The carrying values and fair values of our financial assets are shown in the following table:
As at December 31, 2017 December 31, 2016
Carrying Fair Carrying Fair value value value value
Assets
Cash, cash equivalents and short-term securities $ 8,890 $ 8,890 $ 8,642 $ 8,642
Debt securities – fair value through profit or loss 59,967 59,967 59,466 59,466
Debt securities – available-for-sale 12,652 12,652 12,421 12,421
Equity securities – fair value through profit or loss 5,078 5,078 5,016 5,016
Equity securities – available-for-sale 942 942 758 758
Mortgages and loans 42,805 45,406 40,775 43,104
Derivative assets 1,478 1,478 1,608 1,608
Other invested assets – fair value through profit or loss(1) 2,211 2,211 2,041 2,041
Other invested assets – available-for-sale(1) 562 562 623 623
Policy loans 3,106 3,106 3,141 3,141
Total financial assets(2) $ 137,691 $ 140,292 $ 134,491 $ 136,820
(1) Other invested assets (FVTPL and AFS) include our investments in segregated funds, mutual funds, and limited partnerships. (2) Invested assets on our Consolidated Statements of Financial Position of $146,139 ($142,350 as at December 31, 2016) includes Total financial assets in this table,
Investment properties of $7,067 ($6,592 as at December 31, 2016), and Other invested assets – non-financial assets of $1,381 ($1,267 as at December 31, 2016).
Derivative liabilities with a fair value of $1,756 ($2,512 as at December 31, 2016) are also included on the Consolidated Statements of Financial Position.
Our mortgages and loans are generally carried at amortized cost. The fair value of mortgages and loans, for disclosure purposes, is determined based on the methodology and assumptions described in Note 5.A.ii. As at December 31, 2017, $38,601 and $6,805 are categorized in Level 2 and Level 3, respectively, of the fair value hierarchy, described in this Note ($38,350 and $4,754 as at December 31, 2016).
Policy loans are carried at their unpaid principal balances. The fair value of policy loans, for disclosure purposes, is approximated by their carrying value, as policy loans are fully secured by policy values on which the loans are made and are categorized in Level 2 of the fair value hierarchy.
5.A.ii Fair Value Methodologies and Assumptions The fair value of government and corporate debt securities is determined using quoted prices in active markets for identical or similar securities. When quoted prices in active markets are not available, fair value is determined using market standard valuation methodologies, which include discounted cash flow analysis, consensus pricing from various broker dealers that are typically the market makers, or other similar techniques. The assumptions and valuation inputs in applying these market standard valuation methodologies are determined primarily using observable market inputs, which include, but are not limited to, benchmark yields, reported trades of identical or similar instruments, broker-dealer quotes, issuer spreads, bid prices, and reference data including market research publications. In limited circumstances, non-binding broker quotes are used.
The fair value of asset-backed securities is determined using quoted prices in active markets for identical or similar securities, when available, or valuation methodologies and valuation inputs similar to those used for government and corporate debt securities. Additional valuation inputs include structural characteristics of the securities, and the underlying collateral performance, such as prepayment speeds and delinquencies. Expected prepayment speeds are based primarily on those previously experienced in the market at projected future interest rate levels. In instances where there is a lack of sufficient observable market data to value the securities, non-binding broker quotes are used.
The fair value of equity securities is determined using quoted prices in active markets for identical securities or similar securities. When quoted prices in active markets are not available, fair value is determined using equity valuation models, which include discounted cash flow analysis and other techniques that involve benchmark comparison. Valuation inputs primarily include projected future operating cash flows and earnings, dividends, market discount rates, and earnings multiples of comparable companies.
The fair value of mortgages and loans, for disclosure purposes, is determined by discounting the expected future cash flows using a current market interest rate applicable to financial instruments with a similar yield, credit quality, and maturity characteristics. Valuation inputs typically include benchmark yields and risk-adjusted spreads from current lending activities or loan issuances. The risk-adjusted spreads are determined based on the borrower’s credit and liquidity, as well as term and other loan-specific features. Long-term mortgages and loans are generally categorized in Level 3 of the fair value hierarchy. The significant unobservable input is a portion of these risk-adjusted spreads at or beyond the 20-year point for mortgages and at or beyond the 10-year point for loans.
The fair value of derivative financial instruments depends upon derivative types. The fair value of exchange-traded futures and options is determined using quoted prices in active markets, while the fair value of over-the-counter (“OTC”) derivatives is determined using pricing models, such as discounted cash flow analysis or other market standard valuation techniques, with primarily observable market inputs. Valuation inputs used to price OTC derivatives may include swap interest rate curves, foreign exchange spot and forward rates,
110 Sun Life Financial Inc. Annual Report 2017 Notes to Consolidated Financial Statements

index prices, the value of underlying securities, projected dividends, volatility surfaces, and in limited circumstances, counterparty quotes. The fair value of OTC derivative financial instruments also includes credit valuation adjustments to reflect the credit risk of both the derivative counterparty and ourselves as well as the impact of contractual factors designed to reduce our credit exposure, such as collateral and legal rights of offset under master netting agreements. Inputs into determining the appropriate credit valuation adjustments are typically obtained from publicly available information and include credit default swap spreads when available, credit spreads derived from specific bond yields, or published cumulative default experience data adjusted for current trends when credit default swap spreads are not available.
The fair value of other invested assets is determined using quoted prices in active markets for identical securities or similar securities. When quoted prices in active markets are not available, fair value is determined using equity valuation models, which include discounted cash flow analysis and other techniques that involve benchmark comparison. Valuation inputs primarily include projected future operating cash flows and earnings, dividends, market discount rates, and earnings multiples of comparable companies.
The fair value of investment properties is generally determined using property valuation models that are based on expected capitalization rates and models that discount expected future net cash flows at current market interest rates reflective of the characteristics, location, and market of each property. Expected future net cash flows include contractual and projected cash flows and forecasted operating expenses, and take into account interest, rental, and occupancy rates derived from market surveys. The estimates of future cash inflows in addition to expected rental income from current leases, include projected income from future leases based on significant assumptions that are consistent with current market conditions. The future rental rates are estimated based on the location, type, and quality of the properties, and take into account market data and projections at the valuation date. The fair values are typically compared to market-based information for reasonability, including recent transactions involving comparable assets. The methodologies and inputs used in these models are in accordance with real estate industry valuation standards. Valuations are prepared externally or internally by professionally accredited real estate appraisers.
The fair value of short-term securities is approximated by their carrying amount, adjusted for credit risk where appropriate.
The fair value of investments for account of segregated fund holders is determined using quoted prices in active markets or independent valuation information provided by investment managers. The fair value of direct investments within investments for account of segregated fund holders, such as short-term securities and government and corporate debt securities, is determined according to valuation methodologies and inputs described above in the respective asset type sections.
The methodologies and assumptions for determining the fair values of investment contract liabilities are included in Note 10.B.
5.A.iii Fair Value Hierarchy We categorize our assets and liabilities carried at fair value, based on the priority of the inputs to the valuation techniques used to measure fair value, into a three-level fair value hierarchy as follows:
Level 1: Fair value is based on the unadjusted quoted prices for identical assets or liabilities in an active market. The types of assets and liabilities classified as Level 1 generally include cash and cash equivalents, certain U.S. government and agency securities, exchange-traded equity securities, and certain segregated and mutual fund units held for account of segregated fund holders.
Level 2: Fair value is based on quoted prices for similar assets or liabilities traded in active markets, or prices from valuation techniques that use significant observable inputs, or inputs that are derived principally from or corroborated with observable market data through correlation or other means. The types of assets and liabilities classified as Level 2 generally include Canadian federal, provincial and municipal government, other foreign government and corporate debt securities, certain asset-backed securities, OTC derivatives, and certain segregated and mutual fund units held for account of segregated fund holders.
Level 3: Fair value is based on valuation techniques that require one or more significant inputs that are not based on observable market inputs. These unobservable inputs reflect our expectations about the assumptions market participants would use in pricing the asset or liability. The types of assets and liabilities classified as Level 3 generally include certain corporate bonds, certain other invested assets, and investment properties.
Notes to Consolidated Financial Statements Sun Life Financial Inc. Annual Report 2017 111

Our assets and liabilities that are carried at fair value on a recurring basis by hierarchy level are as follows:
As at December 31, 2017 December 31, 2016
Level 1 Level 2 Level 3 Total Level 1 Level 2 Level 3 Total
Assets Cash, cash equivalents and
short-term securities Debt securities – fair value
through profit or loss Debt securities –
available-for-sale Equity securities – fair value
through profit or loss Equity securities –
available-for-sale Derivative assets Other invested assets Investment properties
$ 7,683
1,103
818
3,379
710 27 912 –
$ 1,207
58,447
11,698
1,532
194 1,451 140 –
$ – $ 8,890
417 59,967
136 12,652
167 5,078
38 942 – 1,478
1,721 2,773 7,067 7,067
$ 7,742
1,136
610
2,863
584 34
925 –
$ 900
57,888
11,620
2,009
167 1,574
195 –
$ –
442
191
144
7 –
1,544 6,592
$ 8,642
59,466
12,421
5,016
758 1,608 2,664 6,592
Total invested assets measured at fair value
Investments for account of segregated fund holders
$ 14,632
$ 27,481
$ 74,669
$ 77,757
$ 9,546
$ 1,154
$ 98,847
$ 106,392
$ 13,894
$ 26,435
$
$
74,353
69,867
$ 8,920
$ 865
$
$
97,167
97,167
Total assets measured at fair value $ 42,113 $ 152,426 $ 10,700 $ 205,239 $ 40,329 $ 144,220 $ 9,785 $ 194,334
Liabilities Investment contract liabilities Derivative liabilities
$ – $ 5
– $ 1,751
3 –
$ 3 1,756
$ – 7
$ – $ 2,505
3 –
$ 3 2,512
Total liabilities measured at fair value $ 5 $ 1,751 $ 3 $ 1,759 $ 7 $ 2,505 $ 3 $ 2,515
Debt securities – fair value through profit or loss consist of the following:
As at December 31, 2017 December 31, 2016
Level 1 Level 2 Level 3 Total Level 1 Level 2 Level 3 Total
Canadian federal government Canadian provincial and municipal
government U.S. government and agency Other foreign government Corporate Asset-backed securities:
Commercial mortgage-backed securities
Residential mortgage-backed securities
Collateralized debt obligations Other
$ – $ 3,351
– 12,142 1,103 125
– 5,318 – 33,864
– 1,459
– 1,625 – 55 – 508
$ 15
16 3 43 306
1
– – 33
$ 3,366
12,158 1,231 5,361 34,170
1,460
1,625 55 541
$ –
– 1,136
– –
–
– – –
$ 3,101
11,414 56
5,568 34,166
1,697
1,482 47
357
$ 16
38 6
10 287
49
– 29 7
$ 3,117
11,452 1,198 5,578
34,453
1,746
1,482 76
364
Total debt securities – fair value through profit or loss $ 1,103 $ 58,447 $ 417 $ 59,967 $ 1,136 $ 57,888 $ 442 $ 59,466
Debt securities – available-for-sale consist of the following:
As at December 31, 2017 December 31, 2016
Level 1 Level 2 Level 3 Total Level 1 Level 2 Level 3 Total
Canadian federal government Canadian provincial and municipal
government U.S. government and agency Other foreign government Corporate Asset-backed securities:
Commercial mortgage-backed securities
Residential mortgage-backed securities
Collateralized debt obligations Other
$ – $ 1,832
– 1,138 818 – – 752 – 5,838
– 744
– 398 – 345 – 651
$ – $ 1,832
– 1,138 – 818 – 752 56 5,894
– 744
– 398 69 414 11 662
$ –
– 610
– –
–
– – –
$ 1,654
1,148 82
766 5,796
888
501 239 546
$ –
– – –
87
–
– 67 37
$ 1,654
1,148 692 766
5,883
888
501 306 583
Total debt securities – available-for-sale $ 818 $ 11,698 $ 136 $ 12,652 $ 610 $ 11,620 $ 191 $ 12,421
During 2017 and 2016, we did not have any significant transfers between Level 1 and Level 2.
112 Sun Life Financial Inc. Annual Report 2017 Notes to Consolidated Financial Statements

The following table provides a reconciliation of the beginning and ending balances for assets that are categorized in Level 3:
Debt Equity securities – Debt securities – Equity Total invested Investments
fair value securities – fair value securities – Other assets for account of Total assets through profit available-for through available-for invested Investment measured at segregated measured at
For the year ended or loss sale profit or loss sale assets properties fair value fund holders fair value
December 31, 2017 Beginning balance
Included in net income(1)(3)(5)
Included in OCI(3)
Purchases
Sales
Settlements
Transfers into Level 3(2)(6)
Transfers (out) of Level 3(2)
Foreign currency translation(4)
$ 442 (3) –
180 (41) (66) 204 (284) (15)
$ 191 (1) –
215 (2) (5) –
(262) –
$ 144 7 – 34 (7) (7) – – (4)
$ 7 – – 32 – – – – (1)
$ 1,544 (59) 18 505 (318)
– 49 –
(18)
$ 6,592 158 –
448 (277)
– 259 –
(113)
$ 8,920 102 18
1,414 (645) (78) 512 (546) (151)
$ 865 60 –
302 (77) (1) – – 5
$ 9,785 162 18
1,716 (722) (79) 512 (546) (146)
Ending balance $ 417 $ 136 $ 167 $ 38 $ 1,721 $ 7,067 $ 9,546 $ 1,154 $ 10,700
Gains (losses) included in earnings relating to instruments still held at the reporting date(1) $ – $ – $ 8 $ – $ (59) $ 147 $ 96 $ 27 $ 123
December 31, 2016
Beginning balance
Included in net income(1)(3)(5)
Included in OCI(3)
Purchases
Sales
Settlements
Transfers into Level 3(2)
Transfers (out) of Level 3(2)
Foreign currency translation(4)
$ 527
(3)
–
239
(30)
(64)
82
(298)
(11)
$ 105
1
–
175
(3)
(50)
6
(40)
(3)
$ 170
(15)
–
74
(1)
(46)
–
(37)
(1)
$ –
–
–
7
–
–
–
–
–
$ 1,106
7
(11)
615
(175)
–
–
–
2
$ 6,540
70
–
404
(346)
–
–
–
(76)
$ 8,448
60
(11)
1,514
(555)
(160)
88
(375)
(89)
$ 765
24
–
247
(66)
(1)
–
(10)
(94)
$ 9,213
84
(11)
1,761
(621)
(161)
88
(385)
(183)
Ending balance $ 442 $ 191 $ 144 $ 7 $ 1,544 $ 6,592 $ 8,920 $ 865 $ 9,785
Gains (losses) included in earnings relating to instruments still held at the reporting date(1) $ (5) $ – $ (15) $ – $ 7 $ 90 $ 77 $ 20 $ 97
(1) Included in Net investment income (loss) for Total invested assets measured at fair value in our Consolidated Statements of Operations. (2) Transfers into Level 3 occur when the inputs used to price the assets and liabilities lack observable market data, and as a result, no longer meet the Level 1 or 2 definitions at
the reporting date. Transfers out of Level 3 occur when the pricing inputs become more transparent and satisfy the Level 1 or 2 criteria and are primarily the result of observable market data being available at the reporting date, thus removing the requirement to rely on inputs that lack observability.
(3) Total gains and losses in net income (loss) and OCI are calculated assuming transfers into or out of Level 3 occur at the beginning of the period. For an asset or liability that transfers into Level 3 during the reporting period, the entire change in fair value for the period is included in the table above. For transfers out of Level 3 during the reporting period, the change in fair value for the period is excluded from the table above.
(4) Foreign currency translation relates to the foreign exchange impact of translating Level 3 assets and liabilities of foreign subsidiaries from their functional currencies to Canadian dollars.
(5) Investment properties included in net income is comprised of fair value changes on investment properties of $211 ($126 in 2016) net of amortization of leasing commissions and tenant inducements of $53 ($56 in 2016).
(6) Transfers into Level 3 in Investment properties includes the reclassification of our former head office location in the second quarter of 2017, previously classified as owner-occupied with a fair value of $259 at the time of transfer from Other assets to Investment properties. The reclassification recognized a revaluation surplus of $172, which was recorded as an increase of $139 of accumulated other comprehensive income, net of taxes of $33.
Unobservable Inputs and Sensitivity for Level 3 Assets Our assets categorized in Level 3 of the fair value hierarchy are primarily Investment properties, Debt securities, and Other invested assets.
The fair value of Investment properties is determined by using the discounted cash flows methodology as described in Note 5.A.ii. The key unobservable inputs used in the valuation of investment properties as at December 31, 2017 include the following:
• Estimated rental value: The estimated rental value is based on contractual rent and other local market lease transactions net of reimbursable operating expenses. An increase (decrease) in the estimated rental value would result in a higher (lower) fair value. The estimated rental value varies depending on the property types, which include retail, office, and industrial properties. The estimated rental value (in dollars, per square foot, per annum) ranges from $12.00 to $65.00 for retail and office properties and from $3.00 to $11.00 for industrial properties.
• Rental growth rate: The rental growth rate is typically estimated based on expected market behaviour, which is influenced by the type of property and geographic region of the property. An increase (decrease) in the rental growth rate would result in a higher (lower) fair value. The rental growth rate (per annum) ranges from 0.0% to 3.0%.
• Long-term vacancy rate: The long-term vacancy rate is typically estimated based on expected market behaviour, which is influenced by the type of property and geographic region of the property. An increase (decrease) in the long-term vacancy rate would result in a lower (higher) fair value. The long-term vacancy rate ranges from 2.0% to 10.0%.
• Discount rate: The discount rate is derived from market activity across various property types and geographic regions and is a reflection of the expected rate of return to be realized on the investment over the next 10 years. An increase (decrease) in the discount rate would result in a lower (higher) fair value. The discount rate ranges from 4.5% to 11.0%.
• Terminal capitalization rate: The terminal capitalization rate is derived from market activity across various property types and geographic regions and is a reflection of the expected rate of return to be realized on the investment over the remainder of its life after the 10-year period. An increase (decrease) in the terminal capitalization rate would result in a lower (higher) fair value. The terminal capitalization rate ranges from 4.25% to 10.00%.
Changes in the estimated rental value are positively correlated with changes in the rental growth rate. Changes in the estimated rental value are negatively correlated with changes in the long-term vacancy rate, the discount rate, and the terminal capitalization rate.
Notes to Consolidated Financial Statements Sun Life Financial Inc. Annual Report 2017 113

Our Debt securities categorized in Level 3, which are included in Debt securities – FVTPL and Debt securities – AFS in the Level 3 roll forward table, consist primarily of corporate bonds. The fair value of these corporate bonds is generally determined using broker quotes that cannot be corroborated with observable market transactions. Significant unobservable inputs for these corporate bonds would include issuer spreads, which are comprised of credit, liquidity, and other security-specific features of the bonds. An increase (decrease) in these issuer spreads would result in a lower (higher) fair value. Due to the unobservable nature of these broker quotes, we do not assess whether applying reasonably possible alternative assumptions would have an impact on the fair value of the Level 3 corporate bonds. The majority of our debt securities categorized in Level 3 are FVTPL assets supporting insurance contract liabilities. Changes in the fair value of these assets supporting insurance contract liabilities are largely offset by changes in the corresponding insurance contract liabilities under CALM. As a result, though using reasonably possible alternative assumptions may have an impact on the fair value of the Level 3 debt securities, it would not have a significant impact on our Consolidated Financial Statements.
The Other invested assets categorized in Level 3, which are included in Other invested assets – FVTPL and Other invested assets – AFS in the Level 3 roll forward table, consists primarily of limited partnership investments. The fair value of our limited partnership investments are based on net asset value (“NAV”) provided by management of the limited partnership investments. Based on the unobservable nature of these NAVs, we do not assess whether applying reasonably possible alternative assumptions would have an impact on the fair value of the Level 3 limited partnership investments.
Valuation Process for Level 3 Assets Our assets categorized in Level 3 of the fair value hierarchy are primarily Investment properties, Debt securities, and limited partnership investments included in Other invested assets. Our valuation processes for these assets are as follows:
The fair value of Investment properties are based on the results of appraisals performed annually and reviewed quarterly for material changes. The valuation methodology used to determine the fair value is in accordance with the standards of the Appraisal Institute of Canada, the U.S., and the U.K. Investment properties are appraised externally at least once every three years. Investment properties not appraised externally in a given year are reviewed by qualified appraisers. A management committee, including investment professionals, reviews the fair value of Investment properties for overall reasonability.
The fair value of Debt securities is generally obtained by external pricing services. We obtain an understanding of inputs and valuation methods used by external pricing services. When fair value cannot be obtained from external pricing services, broker quotes, or internal models subject to detailed review and validation processes are used. The fair value of debt securities is subject to price validation and review procedures to ensure overall reasonability.
The fair value of limited partnership investments, included in Other invested assets, is based on NAV. The financial statements used in calculating the NAV are generally audited annually. We review the NAV of the limited partnership investments and perform analytical and other procedures to ensure the fair value is reasonable.
5.B Interest and Other Investment Income Interest and other investment income consist of the following:
For the years ended December 31, 2017 2016
Interest income:
Cash, cash equivalents and short-term securities
Debt securities – fair value through profit or loss
Debt securities – available-for-sale
Mortgages and loans
Derivative investments
Policy loans
$ 65 2,292 352
1,928 70
165
$ 35
2,356
366
1,911
82
168
Total interest income
Equity securities – dividends on fair value through profit or loss
Equity securities – dividends on available-for-sale
Investment properties rental income(1)
Investment properties expenses
Other income
Investment expenses and taxes
4,872 159 15
623 (286) 223 (193)
4,918
160
12
629
(292)
247
(185)
Total interest and other investment income $ 5,413 $ 5,489
(1) Comprised of operating lease rental income.
114 Sun Life Financial Inc. Annual Report 2017 Notes to Consolidated Financial Statements

5.C Fair Value and Foreign Currency Changes on Assets and Liabilities Fair value and foreign currency changes on assets and liabilities recorded to net income consist of the following:
For the years ended December 31,
Fair value change:
Cash, cash equivalents and short-term securities
Debt securities
Equity securities
Derivative investments
Other invested assets
$
2017
1 1,630 441 649 59
$
2016
(16)
1,056
512
922
65
Total change in fair value through profit or loss assets and liabilities
Fair value changes on investment properties
Foreign exchange gains (losses)(1)
Fair value and foreign currency changes on assets and liabilities
$
$
2,780 211 (388)
2,603
$
$
2,539
126
(432)
2,233
(1) Primarily arises from the translation of foreign currency denominated AFS monetary assets and mortgage and loans. Any offsetting amounts arising from foreign currency derivatives are included in the fair value change on derivative investments.
5.D Cash, Cash Equivalents and Short-Term Securities Cash, cash equivalents and short-term securities presented in our Consolidated Statements of Financial Position and Net cash, cash equivalents and short-term securities presented in our Consolidated Statements of Cash Flows consist of the following:
As at December 31, 2017 2016
Cash $ 1,504 $ 1,841
Cash equivalents 4,592 4,857
Short-term securities 2,794 1,944
Cash, cash equivalents and short-term securities 8,890 8,642
Less: Bank overdraft, recorded in Other liabilities 140 189
Net cash, cash equivalents and short-term securities $ 8,750 $ 8,453
5.E Gross Unrealized Gains and Gross Unrealized Losses on Available-For-Sale Debt and Equity Securities Gross unrealized gains and gross unrealized losses included in accumulated OCI on AFS debt and equity securities, before the effect of hedge accounting, consist of the following:
As at December 31, 2017 2016
Amortized cost
Gross unrealized
gains
Gross unrealized
(losses) Fair value Amortized
cost
Gross unrealized
gains
Gross unrealized
(losses) Fair value
Debt securities: Canadian federal government Canadian provincial and
municipal government U.S. government and agency Other foreign government Corporate Asset-backed securities:
Commercial mortgage-backed securities
Residential mortgage-backed securities
Collateralized debt obligations
Other
$ 1,873
1,136 822 670
5,586
742
400
413 654
$ 1
17 3 83 326
9
3
1 9
$ (42)
(15) (7) (1) (18)
(7)
(5)
– (1)
$ 1,832
1,138 818 752
5,894
744
398
414 662
$ 1,676
1,143 714 683
5,662
881
507
305 592
$ 10
19 1
92 254
17
3
1 1
$ (32)
(14) (23) (9)
(33)
(10)
(9)
– (10)
$ 1,654
1,148 692 766
5,883
888
501
306 583
Total debt securities Equity securities
12,296 746
452 200
(96) (4)
12,652 942
12,163 594
398 172
(140) (8)
12,421 758
Total AFS debt and equity securities $ 13,042 $ 652 $ (100) $ 13,594 $ 12,757 $ 570 $ (148) $ 13,179
Notes to Consolidated Financial Statements Sun Life Financial Inc. Annual Report 2017 115

5.F Derivative Financial Instruments and Hedging Activities The fair values of derivative financial instruments by major class of derivatives are as follows:
As at December 31, 2017 2016
Fair value Fair value
Assets Liabilities Assets Liabilities
Interest rate contracts $ 1,188 $ (518) $ 1,405 $ (579)
Foreign exchange contracts 177 (1,232) 95 (1,924)
Other contracts 113 (6) 108 (9)
Total derivatives $ 1,478 $ (1,756) $ 1,608 $ (2,512)
The following table presents the fair values of derivative assets and liabilities categorized by type of hedge for accounting purposes and derivative investments:
As at December 31, 2017 2016
Fair value Fair value Total notional Total notional
amount Assets Liabilities amount Assets Liabilities
Derivative investments(1) $ 53,299 $ 1,439 $ (1,575) $ 53,477 $ 1,567 $ (2,304)
Fair value hedges 690 2 (181) 753 – (208)
Cash flow hedges 132 37 – 120 41 –
Total derivatives $ 54,121 $ 1,478 $ (1,756) $ 54,350 $ 1,608 $ (2,512)
(1) Derivative investments are derivatives that have not been designated as hedges for accounting purposes.
We did not have any net investment hedges in 2017 or 2016.
Hedge ineffectiveness recognized in Interest and other investment income consists of the following:
For the years ended December 31, 2017 2016
Fair value hedging ineffectiveness:
Gains (losses) on the hedged items attributable to the hedged risk $ (22) $ (12)
Gains (losses) on the hedging derivatives 19 12
Net ineffectiveness on fair value hedges $ (3) $ –
For cash flow hedges, we had hedge ineffectiveness of $3 in 2017 ($nil in 2016). We expect to reclassify a gain of $7 from accumulated OCI to net income within the next 12 months that relates to cash flow hedges of anticipated award payments under certain share-based payment plans that are expected to occur in 2018, 2019 and 2020. The reclassification of accumulated OCI to income relating to these foreign currency forwards occurs upon disposal or impairment of the foreign operation.
5.G Transfers of Financial Assets We enter into transactions, including mortgage securitization, repurchase agreements and securities lending, where we transfer financial assets while retaining the risks and rewards of ownership of the assets. These transferred financial assets are not derecognized and remain on our Consolidated Statements of Financial Position. The carrying value of the transferred assets and the associated liabilities are described in the sections below.
5.G.i Mortgage Securitization We securitize certain insured fixed rate commercial mortgages through the creation of mortgage-backed securities under the National Housing Act Mortgage-Backed Securities (“NHA MBS”) Program sponsored by the Canada Mortgage and Housing Corporation (“CMHC”). The NHA MBS are then sold to Canada Housing Trust, a government-sponsored security trust that issues securities to third-party investors under the Canadian Mortgage Bond (“CMB”) program. The securitization of these assets does not qualify for derecognition as we have not transferred substantially all of the risks and rewards of ownership. Specifically, we continue to be exposed to pre-payment and interest rate risk associated with these assets. There are no expected credit losses on the securitized mortgages, as the mortgages were already insured by the CMHC prior to securitization. These assets continue to be recognized as Mortgages and loans in our Consolidated Statements of Financial Position. Proceeds from securitization transactions are recognized as secured borrowings and included in Other liabilities in our Consolidated Statements of Financial Position.
Receipts of principal on the securitized mortgages are deposited into a principal reinvestment account (“PRA”) to meet our repayment obligation upon maturity under the CMB program. The assets in the PRA are typically comprised of cash and cash equivalents and certain asset-backed securities. We are exposed to reinvestment risk due to the amortizing nature of the securitized mortgages relative to our repayment obligation for the full principal amount due at maturity. We mitigate this reinvestment risk using interest rate swaps.
The carrying value and fair value of the securitized mortgages as at December 31, 2017 are $1,283 and $1,267, respectively ($1,105 and $1,102 as at December 31, 2016). The carrying value and fair value of the associated liabilities as at December 31, 2017 are $1,355 and $1,346, respectively ($1,141 and $1,153 as at December 31, 2016). The carrying value of asset-backed securities in the PRA as at December 31, 2017 and 2016 are $75 and $40, respectively. There are no cash and cash equivalents in the PRA as at December 31, 2017 and 2016.
116 Sun Life Financial Inc. Annual Report 2017 Notes to Consolidated Financial Statements
The fair value of the secured borrowings from mortgage securitization is based on the methodologies and assumptions for asset-backed securities described in Note 5.A.ii. The fair value of these liabilities is categorized in Level 2 of the fair value hierarchy as at December 31, 2017 and 2016.
5.G.ii Repurchase Agreements We enter into repurchase agreements for operational funding and liquidity purposes. Repurchase agreements have maturities ranging from 8 to 158 days, averaging 82 days, and bear interest at an average rate of 1.25% as at December 31, 2017 (0.69% as at December 31, 2016). The fair values of the transferred assets and the obligations related to their repurchase, which approximate their carrying values, are $1,976 as at December 31, 2017 ($1,789 as at December 31, 2016). These liabilities are categorized in Level 2 of the fair value hierarchy. Collateral primarily consists of cash and cash equivalents as well as government guaranteed securities. Details on the collateral pledged are included in Note 6.A.ii.
5.G.iii Securities Lending The Company engages in securities lending to generate additional income. Certain securities from its portfolio are lent to other institutions for short periods. Collateral exceeding the fair value of the securities lent, is deposited by the borrower with a lending agent, usually a securities custodian, and maintained by the lending agent until the underlying security has been returned to us. The fair value of the securities lent is monitored on a daily basis with additional collateral obtained or refunded as the fair values fluctuate. Collateral primarily consists of Canadian federal and provincial government securities and cash and cash equivalents. Certain arrangements allow us to invest the cash collateral received for the securities lent. The carrying values of the securities lent approximate their fair values. The carrying values of the securities lent and the related collateral held are $1,467 and $1,546 as at December 31, 2017 ($1,483 and $1,562 as at December 31, 2016).
6. Financial Instrument Risk Management
The significant risks related to financial instruments are credit risk, market risk (including equity risk, interest rate and spread risk, and foreign currency risk) and liquidity risk. The following sections describe how we manage these risks.
Some of our financial instruments risk management policies and procedures are described in our Annual Management’s Discussion and Analysis (“MD&A”) for the year ended December 31, 2017. The shaded text and tables in the Risk Management section of the MD&A represent part of our disclosures on credit, market and liquidity risks and include a description of how we measure our risk and our objectives, policies and methodologies for managing these risks. Therefore, the shaded text and tables are an integral part of these Consolidated Financial Statements.
We use derivative instruments to manage market risks related to equity market, interest rate and currency fluctuations and in replication strategies for permissible investments. We do not engage in speculative investment in derivatives. The gap in market sensitivities or exposures between liabilities and supporting assets is monitored and managed within defined tolerance limits, by using derivative instruments, where appropriate. We use models and techniques to measure the effectiveness of our risk management strategies.
6.A Credit Risk Risk Description Credit risk is the possibility of loss from amounts owed by our borrowers or financial counterparties. We are subject to credit risk in connection with issuers of securities held in our investment portfolio, debtors, structured securities, reinsurers, counterparties (including derivative, repurchase agreement and securities lending counterparties), other financial institutions and other entities. Losses may occur when a counterparty fails to make timely payments pursuant to the terms of the underlying contractual arrangement or when the counterparty’s credit rating or risk profile otherwise deteriorates. Credit risk can also arise in connection with deterioration in the value of, or ability to realize, any underlying security that may be used as collateral for the debt obligation. Credit risk can occur as a result of broad economic conditions, challenges within specific sectors of the economy, or from issues affecting individual companies. Events that result in defaults, impairments or downgrades of the securities in our investment portfolio would cause the Company to record realized or unrealized losses and may cause an increase in our provisions for asset default, adversely impacting earnings.
Credit Risk Management Governance and Control We employ a wide range of credit risk management practices and controls, as outlined below:
• Credit risk governance practices are in place, including independent monitoring and review and reporting to senior management and the Risk & Conduct Review Committee.
• Risk appetite limits have been established for credit risk. • Income and regulatory capital sensitivities are monitored, managed and reported against pre-established risk limits. • Comprehensive Investment and Credit Risk Management Policy, guidelines and practices are in place. • Specific investment diversification requirements are in place, such as defined investment limits for asset class, geography, and
industry. • Risk-based credit portfolio, counterparty, and sector exposure limits have been established. • Mandatory use of credit quality ratings for portfolio investments has been established and is reviewed regularly. These internal
rating decisions for new fixed income investments and ongoing review of existing rating decisions are independently adjudicated by corporate risk management.
• Comprehensive due diligence processes and ongoing credit analyses are conducted. • Regulatory solvency requirements include risk-based capital requirements and are monitored regularly. • Comprehensive compliance monitoring practices and procedures including reporting against pre-established investment limits are in
place. • Reinsurance exposures are monitored to ensure that no single reinsurer represents an undue level of credit risk.
Notes to Consolidated Financial Statements Sun Life Financial Inc. Annual Report 2017 117

• Stress-testing techniques, such as Dynamic Capital Adequacy Testing (“DCAT”), are used to measure the effects of large and sustained adverse credit developments.
• Insurance contract liabilities are established in accordance with Canadian actuarial standards of practice. • Internal capital targets are established at an enterprise level to cover all risks and are above minimum regulatory and supervisory
levels. Actual capital levels are monitored to ensure they exceed internal targets.
6.A.i Maximum Exposure to Credit Risk Our maximum credit exposure related to financial instruments as at December 31 is the balance as presented in our Consolidated Statements of Financial Position as we believe that these carrying amounts best represent the maximum exposure to credit risk. The credit exposure for debt securities may be increased to the extent that the amounts recovered from default are insufficient to satisfy the actuarial liability cash flows that the assets are intended to support.
The positive fair value of derivative assets is used to determine the credit risk exposure if the counterparties were to default. The credit risk exposure is the cost of replacing, at current market rates, all derivative contracts with a positive fair value. Additionally, we have credit exposure to items not on the Consolidated Statements of Financial Position as follows:
As at December 31, 2017 2016
Off-balance sheet items:
Loan commitments(1)
Guarantees
$ 1,740 12
$ 1,322
34
Total off-balance sheet items $ 1,752 $ 1,356
(1) Loan commitments include commitments to extend credit under commercial and multi-family residential mortgages and private debt securities not quoted in an active market. Commitments on debt securities contain provisions that allow for withdrawal of the commitment if there is deterioration in the credit quality of the borrower.
6.A.ii Right of Offset and Collateral We invest in financial assets which may be secured by real estate properties, pools of financial assets, third-party financial guarantees, credit insurance, and other arrangements.
For OTC derivatives, collateral is collected from and pledged to counterparties to manage credit exposure according to the Credit Support Annex (“CSA”), which forms part of the International Swaps and Derivatives Association’s (“ISDA”) master agreements. It is common practice to execute a CSA in conjunction with an ISDA master agreement. Under the ISDA master agreements for OTC derivatives, we have a right of offset in the event of default, insolvency, bankruptcy, or other early termination. In the ordinary course of business, bilateral OTC exposures under these agreements are substantially mitigated through associated collateral agreements with a majority of our counterparties.
For exchange-traded derivatives subject to derivative clearing agreements with the exchanges and clearinghouses, there is no provision for set-off at default. Initial margin is excluded from the table below as it would become part of a pooled settlement process.
For repurchase agreements and reverse repurchase agreements, assets are sold or purchased with a commitment to resell or repurchase at a future date. Additional collateral may be pledged to or collected from counterparties to manage credit exposure according to bilateral repurchase or reverse repurchase agreements. In the event of default by a counterparty, we are entitled to liquidate the assets we hold as collateral to offset against obligations to the same counterparty.
In the case of securities lending, assets are lent with a commitment from the counterparty to return at a future date. Cash or securities are received as collateral from the counterparty. In the event of default by the counterparty, we are entitled to liquidate the assets we hold as collateral to offset against obligations to the same counterparty.
We do not offset financial instruments in our Consolidated Statements of Financial Position, as our rights of offset are conditional. The following tables present the effect of conditional netting and similar arrangements. Similar arrangements include global master repurchase agreements, security lending agreements, and any related rights to financial collateral.
As at December 31, 2017 2016
Financial instruments
presented in the Consolidated Statements of
Financial Position(1)
Related amounts not set off in the Consolidated Statements of Financial
Position Financial
Financial instruments instruments presented in the subject to Financial Consolidated
master netting collateral Statements of or similar (received) Financial
agreements pledged(2) Net amount Position(1)
Related amounts not set off in the Consolidated Statements of Financial
Position
Financial instruments
subject to Financial master netting collateral
or similar (received) agreements pledged(2) Net amount
Financial assets Derivative assets (Note 6.A.v) $ 1,478 $ (694) $ (662) $ 122 $ 1,608 $ (806) $ (720) $ 82
Total financial assets $ 1,478 $ (694) $ (662) $ 122 $ 1,608 $ (806) $ (720) $ 82
Financial liabilities Derivative liabilities $ (1,756) $ 694 $ 754 $ (308) $ (2,512) $ 806 $ 1,318 $ (388) Repurchase agreements
(Note 5.G.ii) $ (1,976) $ – $ 1,976 $ – $ (1,789) $ – $ 1,789 $ –
Total financial liabilities $ (3,732) $ 694 $ 2,730 $ (308) $ (4,301) $ 806 $ 3,107 $ (388)
(1) Net amounts of the financial instruments presented in our Consolidated Statements of Financial Position are the same as our gross recognized financial instruments, as we do not offset financial instruments in our Consolidated Statements of Financial Position.
(2) Financial collateral excludes overcollateralization and for exchange-traded derivatives, initial margin. Total financial collateral, including initial margin and overcollateralization, received on derivative assets was $853 ($779 as at December 31, 2016), pledged on derivative liabilities was $1,127 ($1,898 as at December 31, 2016), and pledged on repurchase agreements was $1,976 ($1,789 as at December 31, 2016).
118 Sun Life Financial Inc. Annual Report 2017 Notes to Consolidated Financial Statements

6.A.iii Concentration Risk Concentrations of credit risk arise from exposures to a single debtor, a group of related debtors, or groups of debtors that have similar credit risk characteristics, such as groups of debtors in the same economic or geographic regions or in similar industries. Related issuers may have similar economic characteristics so that their ability to meet contractual obligations may be impacted similarly by changes in the economic or political conditions. We manage this risk by appropriately diversifying our investment portfolio through the use of concentration limits. In particular, we maintain policies which set counterparty exposure limits to manage the credit exposure for investments in any single issuer or to the same underlying credit. Exceptions exist for investments in securities which are issued or guaranteed by the Government of Canada, U.S. or U.K. and issuers for which the Risk & Conduct Review Committee have granted specific approval. Mortgages are collateralized by the related property, and generally do not exceed 75% of the value of the property at the time the original loan is made. Our mortgages and loans are diversified by type and location and, for mortgages, by borrower. Loans provide diversification benefits (name, industry and geography) and often provide stronger covenants and collateral than public debt securities, thereby providing both better credit protection and potentially higher recoveries in the event of default. The following tables provide details of the debt securities, mortgages, and loans held by issuer country, geographic location and industry sector, where applicable.
The carrying value of debt securities by geographic location is shown in the following table. The geographic location is based on the country of the creditor’s parent.
As at December 31, 2017 2016
Fair value through Available- Total debt Fair value through Available- Total debt profit or loss for-sale securities profit or loss for-sale securities
Canada $ 24,132 $ 4,114 $ 28,246 $ 22,507 $ 3,589 $ 26,096
United States 20,758 5,719 26,477 21,469 5,910 27,379
United Kingdom 5,319 590 5,909 5,621 659 6,280
Other 9,758 2,229 11,987 9,869 2,263 12,132
Balance $ 59,967 $ 12,652 $ 72,619 $ 59,466 $ 12,421 $ 71,887
The carrying value of debt securities by issuer and industry sector is shown in the following table:
As at December 31, 2017 2016
Fair value Fair value through Available- Total debt through Available- Total debt
profit or loss for-sale securities profit or loss for-sale securities
Debt securities issued or guaranteed by:
Canadian federal government $ 3,366 $ 1,832 $ 5,198 $ 3,117 $ 1,654 $ 4,771
Canadian provincial and municipal government 12,158 1,138 13,296 11,452 1,148 12,600
U.S. government and agency 1,231 818 2,049 1,198 692 1,890
Other foreign government 5,361 752 6,113 5,578 766 6,344
Total government issued or guaranteed debt securities 22,116 4,540 26,656 21,345 4,260 25,605
Corporate debt securities by industry sector:
Financials 7,856 1,705 9,561 7,757 1,546 9,303
Utilities and energy 10,413 1,005 11,418 10,541 1,076 11,617
Telecommunication services 1,763 298 2,061 1,786 288 2,074
Consumer staples and discretionary 4,272 960 5,232 4,718 1,135 5,853
Industrials 4,090 707 4,797 4,103 708 4,811
Real estate 2,213 366 2,579 1,977 324 2,301
Other 3,563 853 4,416 3,571 806 4,377
Total corporate debt securities 34,170 5,894 40,064 34,453 5,883 40,336
Asset-backed securities 3,681 2,218 5,899 3,668 2,278 5,946
Total debt securities $ 59,967 $ 12,652 $ 72,619 $ 59,466 $ 12,421 $ 71,887
Notes to Consolidated Financial Statements Sun Life Financial Inc. Annual Report 2017 119

The carrying value of mortgages and loans by geographic location and type is shown in the following tables. The geographic location for mortgages is based on location of property, while for corporate loans it is based on the country of the creditor’s parent.
As at December 31, 2017 Canada United States United Kingdom Other Total
Mortgages
Retail $ 2,027 $ 2,264 $ – $ – $ 4,291 Office 1,898 2,363 – – 4,261 Multi-family residential 3,214 1,368 – – 4,582 Industrial and land 670 990 – – 1,660 Other 581 118 – – 699
Total mortgages(1)
Loans
$ 8,390 $ 13,265
$ 7,103 $ 9,542
$ – $ 1,678
$ $
– 2,827
$ $
15,493 27,312
Total mortgages and loans $ 21,655 $ 16,645 $ 1,678 $ 2,827 $ 42,805
(1) $3,171 of mortgages in Canada are insured by the Canada Mortgage and Housing Corporation.
As at December 31, 2016 Canada United States United Kingdom Other Total
Mortgages
Retail
Office
Multi-family residential
Industrial and land
Other
$ 2,176
1,816
3,067
719
456
$ 2,304
2,592
1,113
1,006
147
$ –
–
–
–
–
$ –
–
–
–
–
$ 4,480
4,408
4,180
1,725
603
Total mortgages(1)
Loans
$ 8,234
$ 13,120
$ 7,162
$ 8,562
$ –
$ 803
$
$
–
2,894
$
$
15,396
25,379
Total mortgages and loans $ 21,354 $ 15,724 $ 803 $ 2,894 $ 40,775
(1) $2,936 of mortgages in Canada are insured by the Canada Mortgage and Housing Corporation.
6.A.iv Contractual Maturities The contractual maturities of debt securities are shown in the following table. Debt securities that are not due at a single maturity date are included in the tables in the year of final maturity. Actual maturities could differ from contractual maturities because of the borrower’s right to call or extend or right to prepay obligations, with or without prepayment penalties.
As at December 31, 2017 2016
Fair value through
profit or loss Available-
for-sale Total debt securities
Fair value through
profit or loss Available-
for-sale Total debt securities
Due in 1 year or less
Due in years 2-5
Due in years 6-10
Due after 10 years
$ 1,432 7,903
10,148 40,484
$ 1,053 3,465 3,177 4,957
$ 2,485 11,368 13,325 45,441
$ 1,741
7,780
10,227
39,718
$ 878
3,406
3,039
5,098
$ 2,619
11,186
13,266
44,816
Total debt securities $ 59,967 $ 12,652 $ 72,619 $ 59,466 $ 12,421 $ 71,887
The carrying value of mortgages by scheduled maturity, before allowances for losses, is as follows:
As at December 31, 2017 2016
Due in 1 year or less
Due in years 2-5
Due in years 6-10
Due after 10 years
$ 931 4,829 6,963 2,792
$ 1,196
4,608
6,659
2,956
Total mortgages $ 15,515 $ 15,419
The carrying value of loans by scheduled maturity, before allowances for losses, is as follows:
As at December 31, 2017 2016
Due in 1 year or less
Due in years 2-5
Due in years 6-10
Due after 10 years
$ 1,806 6,350 4,968
14,216
$ 1,655
6,234
4,783
12,714
Total loans $ 27,340 $ 25,386
120 Sun Life Financial Inc. Annual Report 2017 Notes to Consolidated Financial Statements

Notional amounts of derivative financial instruments are the basis for calculating payments and are generally not the actual amounts exchanged. The following table provides the notional amounts of derivative instruments outstanding by type of derivative and term to maturity:
As at December 31, 2017 2016
Term to maturity Term to maturity
Under 1 to 5 Over 5 Under 1 to 5 Over 5 1 Year Years Years Total 1 Year Years Years Total
Over-the-counter contracts:
Interest rate contracts:
Forward contracts $ 469 $ – $ – $ 469 $ 451 $ – $ – $ 451
Swap contracts 1,348 3,486 16,053 20,887 1,076 3,815 16,500 21,391
Options purchased 1,062 2,266 2,451 5,779 1,668 2,004 3,137 6,809
Options written(1) – 786 459 1,245 537 839 490 1,866
Foreign exchange contracts:
Forward contracts 6,305 42 – 6,347 5,494 – – 5,494
Swap contracts 332 4,198 7,214 11,744 654 4,197 6,180 11,031
Other contracts:
Forward contracts 109 150 – 259 96 132 – 228
Swap contracts 126 1 – 127 114 – – 114
Credit derivatives 48 903 170 1,121 – 690 215 905
Exchange-traded contracts:
Interest rate contracts:
Futures contracts 3,415 – – 3,415 3,138 – – 3,138
Equity contracts:
Futures contracts 2,216 – – 2,216 2,583 – – 2,583
Options purchased 465 47 – 512 277 – – 277
Options written – – – – 63 – – 63
Total notional amount $ 15,895 $ 11,879 $ 26,347 $ 54,121 $ 16,151 $ 11,677 $ 26,522 $ 54,350
(1) These are covered short derivative positions that may include interest rate options, swaptions, or floors.
The following table provides the fair value of derivative instruments outstanding by term to maturity:
As at December 31, 2017 2016
Term to maturity Term to maturity
Under 1 to 5 Over 5 Under 1 to 5 Over 5 1 Year Years Years Total 1 Year Years Years Total
Derivative assets $ 97 $ 226 $ 1,155 $ 1,478 $ 191 $ 186 $ 1,231 $ 1,608
Derivative liabilities $ (90) $ (347) $ (1,319) $ (1,756) $ (219) $ (574) $ (1,719) $ (2,512)
6.A.v Asset Quality The following sections describe our assessment of the credit quality of our financial assets. We monitor credit quality based on internal risk ratings as well as ratings assigned by external rating agencies where available.
Debt Securities by Credit Rating Investment grade debt securities are those rated BBB and above. Our debt security portfolio was 98% investment grade based on carrying value as at December 31, 2017 (98% as at December 31, 2016). The credit risk ratings were established in accordance with the internal rating process described in the Credit Risk Management Governance and Control section.
The following table summarizes our debt securities by credit quality:
As at December 31, 2017 2016
Fair value through
profit or loss Available-
for-sale Total debt securities
Fair value through
profit or loss Available-
for-sale Total debt securities
Debt securities by credit rating:
AAA
AA
A
BBB
BB and lower
$ 8,579 14,006 19,603 16,894
885
$ 4,870 1,809 3,000 2,674 299
$ 13,449 15,815 22,603 19,568 1,184
$ 8,128
11,905
20,798
17,347
1,288
$ 4,567
1,727
2,914
2,778
435
$ 12,695
13,632
23,712
20,125
1,723
Total debt securities $ 59,967 $ 12,652 $ 72,619 $ 59,466 $ 12,421 $ 71,887
Notes to Consolidated Financial Statements Sun Life Financial Inc. Annual Report 2017 121
Mortgages and Loans by Credit Rating The credit quality of mortgages and loans is evaluated internally through regular monitoring of credit-related exposures. We use judgment and experience to determine what factors should be considered when assigning an internal credit rating, which is validated through the use of credit scoring models, to a particular mortgage or corporate loan. The internal credit ratings reflect the credit quality of the borrower as well as the value of any collateral held as security.
The following tables summarize our mortgages and loans by credit quality indicator:
As at December 31, 2017 2016
Mortgages by credit rating:
Insured
AAA
AA
A
BBB
BB and lower
Impaired
Total mortgages
$
$
3,171 4
1,716 4,304 5,060 1,227
11
15,493
$
$
2,936
–
1,602
3,381
5,866
1,595
16
15,396
As at December 31,
Loans by credit rating:
AAA
AA
A
BBB
BB and lower
Impaired
Total loans
$
$
2017
400 3,670
11,626 10,745
810 61
27,312
$
$
2016
455
3,594
11,529
9,039
762
–
25,379
Derivative Financial Instruments by Counterparty Credit Rating Derivative instruments consist of bilateral OTC contracts negotiated directly between counterparties, OTC contracts cleared through central clearing houses or exchange-traded contracts. Since a counterparty failure in an OTC derivative transaction could render it ineffective for hedging purposes, we generally transact our derivative contracts with highly-rated counterparties. In limited circumstances, we enter into transactions with lower-rated counterparties if credit enhancement features are included.
We pledge and hold assets as collateral under CSAs for bilateral OTC derivative contracts. The collateral is realized in the event of early termination as defined in the agreements. The assets held and pledged are primarily cash and debt securities issued by the Canadian federal government and U.S. government and agencies. While we are generally permitted to sell or re-pledge the assets held as collateral, we have not sold or re-pledged any assets. Exchange-traded and cleared OTC derivatives require the posting of initial margin, as well as daily cash settlement of variation margin. The terms and conditions related to the use of the collateral are consistent with industry practice.
Further details on collateral held and pledged as well as the impact of netting arrangements are included in Note 6.A.ii.
The following table shows the OTC derivative financial instruments with a positive fair value split by counterparty credit rating:
As at December 31, 2017 2016
Gross positive
replacement cost(2)
Impact of master netting
agreements(3)
Net replacement
cost(4)
Gross positive
replacement cost(2)
Impact of master netting
agreements(3)
Net replacement
cost(4)
Over-the-counter contracts:
AA
A
BBB
$ 113 872 466
$ (95) (589) (10)
$ 18 283 456
$ 313
768
493
$ (281)
(511)
(14)
$ 32
257
479
Total over-the-counter derivatives(1) $ 1,451 $ (694) $ 757 $ 1,574 $ (806) $ 768
(1) Exchange-traded derivatives with a positive fair value of $27 in 2017 ($34 in 2016) are excluded from the table above, as they are subject to daily margining requirements. Our credit exposure on these derivatives is with the exchanges and clearinghouses.
(2) Used to determine the credit risk exposure if the counterparties were to default. The credit risk exposure is the cost of replacing, at current market rates, all contracts with a positive fair value.
(3) The credit risk associated with derivative assets subject to master netting arrangements is reduced by derivative liabilities due to the same counterparty in the event of default or early termination. Our overall exposure to credit risk reduced through master netting arrangements may change substantially following the reporting date as the exposure is affected by each transaction subject to the arrangement.
(4) Net replacement cost is positive replacement cost less the impact of master netting agreements.
Credit Default Swaps by Underlying Financial Instrument Credit Rating Credit default swaps (“CDS”) are OTC contracts that transfer credit risk related to an underlying referenced financial instrument from one counterparty to another. The purchaser receives protection against the decline in the value of the referenced financial instrument
122 Sun Life Financial Inc. Annual Report 2017 Notes to Consolidated Financial Statements

as a result of specified credit events such as default or bankruptcy. The seller receives a periodic premium in return for payment contingent on a credit event affecting the referenced financial instrument. CDS index contracts are those where the underlying referenced financial instruments are a group of assets. The Company enters into credit derivatives to replicate credit exposure of an underlying reference security and enhance investment returns. The credit risk ratings of the underlying reference securities for single name contracts were established in accordance with the internal rating process described in the Credit Risk Management Governance and Control section.
The following table provides a summary of the credit default swap protection sold by credit rating of the underlying reference security:
As at December 31, 2017 2016
Notional Fair Notional Fair amount value amount value
Single name CDS contracts
AA $ 67 $ 1 $ 88 $ 1
A 584 15 491 5
BBB 446 9 284 2
Total single name CDS contracts $ 1,097 $ 25 $ 863 $ 8
CDS index contracts $ 24 $ – $ 42 $ –
Total credit default swap contracts $ 1,121 $ 25 $ 905 $ 8
Reinsurance Counterparties Exposure by Credit Rating The following is the potential maximum exposure to loss based on ceded reserves and outstanding claims:
As at December 31, 2017 2016
Gross Net Gross Net exposure Collateral exposure exposure Collateral exposure
Reinsurance counterparties by credit rating:
AA $ 1,241 $ 4 $ 1,237 $ 1,048 $ – $ 1,048
A 1,632 99 1,533 2,688 121 2,567
BBB 157 116 41 158 1 157
BB 1,539 1,455 84 1,543 1,467 76
B 257 74 183 336 86 250
Not rated 76 72 4 158 153 5
Total $ 4,902 $ 1,820 $ 3,082 $ 5,931 $ 1,828 $ 4,103
Less: ceded negative reserves $ 874 $ 787
Total Reinsurance assets $ 4,028 $ 5,144
6.A.vi Impairment of Assets Management assesses debt and equity securities, mortgages and loans, and other invested assets for objective evidence of impairment at each reporting date. We employ a portfolio monitoring process to identify assets or groups of assets that have objective evidence of impairment, having experienced a loss event or events that have an impact on the estimated future cash flows of the asset or group of assets. There are inherent risks and uncertainties in our evaluation of assets or groups of assets for objective evidence of impairment, including both internal and external factors such as general economic conditions, issuers’ financial conditions and prospects for economic recovery, market interest rates, unforeseen events which affect one or more issuers or industry sectors, and portfolio management parameters, including asset mix, interest rate risk, portfolio diversification, duration matching, and greater than expected liquidity needs. All of these factors could impact our evaluation of an asset or group of assets for objective evidence of impairment.
Management exercises considerable judgment in assessing for objective evidence of impairment and, based on its assessment, classifies specific assets as either performing or into one of the following credit quality lists:
“Monitor List” – the timely collection of all contractually specified cash flows is reasonably assured, but changes in issuer-specific facts and circumstances require monitoring. No impairment charge is recorded for unrealized losses on assets related to these debtors.
“Watch List” – the timely collection of all contractually specified cash flows is reasonably assured, but changes in issuer-specific facts and circumstances require heightened monitoring. An asset is moved from the Monitor List to the Watch List when changes in issuer-specific facts and circumstances increase the possibility that a security may experience a loss event on an imminent basis. No impairment charge is recorded for unrealized losses on assets related to these debtors.
“Impaired List” – the timely collection of all contractually specified cash flows is no longer reasonably assured. For these investments that are classified as AFS or amortized cost, an impairment charge is recorded or the asset is sold and a realized loss is recorded as a charge to income. Impairment charges and realized losses are recorded on assets related to these debtors.
Our approach to determining whether there is objective evidence of impairment varies by asset type. However, we have a process to ensure that in all instances where a decision has been made to sell an asset at a loss, the asset is impaired.
Notes to Consolidated Financial Statements Sun Life Financial Inc. Annual Report 2017 123

Debt Securities Objective evidence of impairment on debt securities involves an assessment of the issuer’s ability to meet current and future contractual interest and principal payments. In determining whether debt securities have objective evidence of impairment, we employ a screening process. The process identifies securities in an unrealized loss position, with particular attention paid to those securities whose fair value to amortized cost percentages have been less than 80% for an extended period of time. Discrete credit events, such as a ratings downgrade, are also used to identify securities that may have objective evidence of impairment. The securities identified are then evaluated based on issuer-specific facts and circumstances, including an evaluation of the issuer’s financial condition and prospects for economic recovery, evidence of difficulty being experienced by the issuer’s parent or affiliate, and management’s assessment of the outlook for the issuer’s industry sector.
Management also assesses previously impaired debt securities whose fair value has recovered to determine whether the recovery is objectively related to an event occurring subsequent to the impairment loss that has an impact on the estimated future cash flows of the asset.
Asset-backed securities are assessed for objective evidence of impairment. Specifically, we periodically update our best estimate of cash flows over the life of the security. In the event that there is an adverse change in the expected cash flows, the asset is impaired. Estimating future cash flows is a quantitative and qualitative process that incorporates information received from third parties, along with assumptions and judgments about the future performance of the underlying collateral. Losses incurred on the respective mortgage-backed securities portfolios are based on loss models using assumptions about key systematic risks, such as unemployment rates and housing prices, and loan-specific information such as delinquency rates and loan-to-value ratios.
Equity Securities and Other Invested Assets Objective evidence of impairment for equity securities and investments in limited partnerships, segregated funds, and mutual funds involves an assessment of the prospect of recovering the cost of our investment. Instruments in an unrealized loss position are reviewed to determine if objective evidence of impairment exists. Objective evidence of impairment for these instruments includes, but is not limited to, the financial condition and near-term prospects of the issuer, including information about significant changes with adverse effects that have taken place in the technological, market, economic, or legal environment in which the issuer operates, and a significant or prolonged decline in the fair value of the instruments below their cost.
We apply presumptive impairment tests to determine whether there has been a significant or prolonged decline in the fair value of an instrument below its cost, and unless extenuating circumstances exist, the instrument is considered to be impaired.
Mortgages and Loans Objective evidence of impairment on mortgages and loans involves an assessment of the borrower’s ability to meet current and future contractual interest and principal payments. In determining whether objective evidence of impairment exists, we consider a number of factors including, but not limited to, the financial condition of the borrower and, for collateral dependent mortgages and loans, the fair value of the collateral.
Mortgages and loans causing concern are monitored closely and evaluated for objective evidence of impairment. For these mortgages and loans, we review information that is appropriate to the circumstances, including recent operating developments, strategy review, timelines for remediation, financial position of the borrower and, for collateral-dependent mortgages and loans, the value of security as well as occupancy and cash flow considerations.
In addition to specific allowances, circumstances may warrant a collective allowance based on objective evidence of impairment for a group of mortgages and loans. We consider regional economic conditions, developments for various property types, and significant exposure to struggling tenants in determining whether there is objective evidence of impairment for certain collateral dependent mortgages and loans, even though it is not possible to identify specific mortgages and loans that are likely to become impaired on an individual basis.
Management also assesses previously impaired mortgages and loans to determine whether a recovery is objectively related to an event occurring subsequent to the impairment loss that has an impact on the estimated future cash flows of the asset.
Impairment of Fair Value Through Profit or Loss Assets We generally maintain distinct asset portfolios for each line of business. Changes in the fair values of these assets are largely offset by changes in the value of insurance contract liabilities, when there is an effective matching of assets and liabilities. For assets designated as FVTPL, the change in fair value arising from impairment is not separately disclosed. The reduction in fair values of FVTPL debt securities attributable to impairment results in an increase in insurance contract liabilities charged through the Consolidated Statements of Operations.
Impairment of Available-For-Sale Assets We recognized impairment losses on available-for-sale assets of $7 for the year ended December 31, 2017 ($8 during 2016).
We did not reverse any impairment on AFS debt securities during 2017 and 2016.
124 Sun Life Financial Inc. Annual Report 2017 Notes to Consolidated Financial Statements

Past Due and Impaired Mortgages and Loans The distribution of mortgages and loans past due or impaired is shown in the following tables:
Gross carrying value Allowance for losses
As at December 31, 2017 Mortgages Loans Total Mortgages Loans Total
Not past due $ 15,482 $ 27,180 $ 42,662 $ – $ – $ – Past due:
Past due less than 90 days – 71 71 – – – Past due 90 days or more – – – – – –
Impaired 33 89 122 22 28 50
Total $ 15,515 $ 27,340 $ 42,855 $ 22 $ 28 $ 50
Gross carrying value Allowance for losses
As at December 31, 2016 Mortgages Loans Total Mortgages Loans Total
Not past due $ 15,378 $ 25,379 $ 40,757 $ – $ – $ –
Past due:
Past due less than 90 days 2 – 2 – – –
Past due 90 days or more – – – – – –
Impaired 39 7 46 23 7 30
Total $ 15,419 $ 25,386 $ 40,805 $ 23 $ 7 $ 30
Changes in Allowances for Losses The changes in the allowances for losses are as follows:
Mortgages Loans Total
Balance, January 1, 2016 $ 42 $ 7 $ 49
Provision for (reversal of) losses (3) 2 (1)
Write-offs, net of recoveries (14) (2) (16)
Foreign exchange rate movements (2) – (2)
Balance, December 31, 2016 $ 23 $ 7 $ 30
Provision for (reversal of) losses – 22 22 Write-offs, net of recoveries, and other adjustments – – – Foreign exchange rate movements (1) (1) (2)
Balance, December 31, 2017 $ 22 $ 28 $ 50
6.B Market Risk Risk Description We are exposed to financial and capital market risk, which is defined as the risk that the fair value or future cash flows of an insurance contract or financial instrument will fluctuate because of changes or volatility in market prices. Market risk includes equity, interest rate and spread, real estate and foreign currency risks.
Market Risk Management Governance and Control We employ a wide range of market risk management practices and controls, as outlined below:
• Market risk governance practices are in place, including independent monitoring and review and reporting to senior management and the Risk & Conduct Review Committee.
• Risk appetite limits have been established for equity, interest rate, real estate and foreign currency risks. • Income and regulatory capital sensitivities are monitored, managed and reported against pre-established risk limits. • Comprehensive asset-liability management and hedging policies, programs and practices are in place. • Regulatory solvency requirements include risk-based capital requirements and are monitored regularly. • Product Design and Pricing Policy requires a detailed risk assessment and pricing provisions for material risks. • Stress-testing techniques, such as DCAT, are used to measure the effects of large and sustained adverse market movements. • Insurance contract liabilities are established in accordance with Canadian actuarial standards of practice. • Internal capital targets are established at an enterprise level to cover all risks and are above minimum regulatory and supervisory
levels. Actual capital levels are monitored to ensure they exceed internal targets.
Specific market risks and our risk management strategies are discussed below in further detail.
6.B.i Equity Risk Equity risk is the potential for financial loss arising from declines or volatility in equity market prices. We are exposed to equity risk from a number of sources. A portion of our exposure to equity risk arises in connection with benefit guarantees on segregated fund contracts. These benefit guarantees may be triggered upon death, maturity, withdrawal or annuitization. The cost of providing for these guarantees is uncertain, and will depend upon a number of factors including general capital market conditions, underlying fund performance, policyholder behaviour, and mortality experience, which may result in negative impacts on our net income and capital.
Notes to Consolidated Financial Statements Sun Life Financial Inc. Annual Report 2017 125

We generate revenue in our asset management businesses and from certain insurance and annuity contracts where fees are levied on account balances that are affected directly by equity market levels. Accordingly, we have further exposure to equity risk as adverse fluctuations in the market value of such assets will result in corresponding adverse impacts on our revenue and net income. In addition, declining and volatile equity markets may have a negative impact on sales and redemptions (surrenders) in these businesses, and this may result in further adverse impacts on our net income and financial position.
We also have direct exposure to equity markets from the investments supporting other general account liabilities, surplus, and employee benefit plans. These exposures fall within our risk-taking philosophy and appetite, and are therefore generally not hedged.
The carrying value of equities by issuer country is shown in the following table:
As at December 31, 2017 2016
Fair value Fair value through Available- Total through Available- Total
profit or loss for-sale equities profit or loss for-sale equities
Canada $ 3,282 $ 53 $ 3,335 $ 3,404 $ 37 $ 3,441
United States 765 671 1,436 757 538 1,295
United Kingdom 130 5 135 126 5 131
Other 901 213 1,114 729 178 907
Total equities $ 5,078 $ 942 $ 6,020 $ 5,016 $ 758 $ 5,774
6.B.ii Embedded Derivatives Risk An embedded derivative is contained within a host insurance contract if it includes an identifiable condition to modify the cash flows that are otherwise payable. This section is applicable to those embedded derivatives where we are not required to, and have not measured (either separately or together with the host contract) the embedded derivative at fair value.
A significant market risk exposure from embedded derivatives arises in connection with the benefit guarantees on segregated fund contracts. These benefit guarantees are linked to underlying fund performance and may be triggered upon death, maturity, withdrawal, or annuitization. We have implemented hedging programs to mitigate a portion of this market risk exposure.
We are also exposed to significant interest rate risk from embedded derivatives in certain general account products and segregated fund contracts, which contain explicit or implicit investment guarantees in the form of minimum crediting rates, guaranteed premium rates, settlement options, and benefit guarantees. If investment returns fall below guaranteed levels, we may be required to increase liabilities or capital in respect of these contracts. The guarantees attached to these products may be applicable to both past premiums collected and future premiums not yet received. Segregated fund contracts provide benefit guarantees that are linked to underlying fund performance and may be triggered upon death, maturity, withdrawal, or annuitization. These products are included in our asset-liability management program and the residual interest rate exposure is managed within our risk appetite limits.
We are also exposed to interest rate risk through guaranteed annuitization options included primarily in retirement contracts and pension plans. These embedded options give policyholders the right to convert their investment into a pension on a guaranteed basis, thereby exposing us to declining long-term interest rates as the annuity guarantee rates come into effect. Embedded options on unit-linked pension contracts give policyholders the right to convert their fund at retirement into pensions on a guaranteed basis, thereby exposing us to declining interest rates and increasing equity market returns (increasing the size of the fund which is eligible for the guaranteed conversion basis). Guaranteed annuity options are included in our asset-liability management program and most of the interest rate and equity exposure is mitigated through hedging.
Significant changes or volatility in interest rates or spreads could have a negative impact on sales of certain insurance and annuity products, and adversely impact the expected pattern of redemptions (surrenders) on existing policies. Increases in interest rates or widening spreads may increase the risk that policyholders will surrender their contracts, potentially forcing us to liquidate assets at a loss and accelerate recognition of certain acquisition expenses. While we have established hedging programs in place and our insurance and annuity products often contain surrender mitigation features, these may not be sufficient to fully offset the adverse impact of the underlying losses.
Certain annuity and long-term disability contracts contain embedded derivatives as benefits are linked to the Consumer Price Index; however most of this exposure is hedged through the Company’s ongoing asset-liability management program.
6.C Liquidity Risk Risk Description Liquidity risk is the possibility that we will not be able to fund all cash outflow commitments and collateral requirements as they fall due. This includes the risk of being forced to sell assets at depressed prices resulting in realized losses on sale. This risk also includes restrictions on our ability to efficiently allocate capital among our subsidiaries due to various market and regulatory constraints on the movement of funds. Our funding obligations arise in connection with the payment of policyholder benefits, expenses, reinsurance settlements, asset purchases, investment commitments, interest on debt, and dividends on common and preferred shares. Sources of available cash flow include general fund premiums and deposits, investment related inflows (such as maturities, principal repayments, investment income and proceeds of asset sales), proceeds generated from financing activities, and dividends and interest payments from subsidiaries. We have various financing transactions and derivative contracts under which we may be required to pledge collateral or to make payments to our counterparties for the decline in market value of specified assets. The amount of collateral or payments required may increase under certain circumstances (such as changes to interest rates, credit spreads, equity markets or foreign exchange rates), which could adversely affect our liquidity.
126 Sun Life Financial Inc. Annual Report 2017 Notes to Consolidated Financial Statements

Liquidity Risk Management Governance and Control We generally maintain a conservative liquidity position and employ a wide range of liquidity risk management practices and controls, which are described below:
• Liquidity risk governance practices are in place, including independent monitoring and review and reporting to senior management and the Risk & Conduct Review Committee.
• Liquidity is managed in accordance with our Asset Liability Management Policy and operating guidelines. • Liquidity contingency plans are maintained for the management of liquidity in the event of a liquidity crisis. • Stress testing is performed by comparing liquidity coverage ratios under a one-month stress scenario to our policy thresholds.
These liquidity ratios are measured and managed at the enterprise and legal entity levels. • Stress testing of our collateral is performed by comparing collateral coverage ratios to our policy threshold. • Cash Management and asset-liability management programs support our ability to maintain our financial position by ensuring that
sufficient cash flow and liquid assets are available to cover potential funding requirements. We invest in various types of assets with a view of matching them to our liabilities of various durations.
• Internal capital targets are established at an enterprise level to cover all risks and are above minimum regulatory and supervisory levels. Actual capital levels are monitored to ensure they exceed internal targets.
• We actively manage and monitor our capital and asset levels, and the diversification and credit quality of our investments. • Various credit facilities for general corporate purposes are maintained.
We are subject to various regulations in the jurisdictions in which we operate. The ability of SLF Inc.’s subsidiaries to pay dividends and transfer funds is regulated in certain jurisdictions and may require local regulatory approvals and the satisfaction of specific conditions in certain circumstances. Through effective cash management and capital planning, SLF Inc. ensures that its subsidiaries, as a whole and on a stand-alone basis, are properly funded and maintain adequate liquidity to meet obligations, both individually and in aggregate.
Based on our historical cash flows and liquidity management processes, we believe that the cash flows from our operating activities will continue to provide sufficient liquidity for us to satisfy debt service obligations and to pay other expenses as they fall due.
7. Insurance Risk Management
7.A Insurance Risk Risk Description Insurance risk is the uncertainty of product performance due to differences between the actual experience and expected experience in the areas of policyholder behaviour, mortality, morbidity, and longevity. In addition, product design and pricing, expense and reinsurance risks impact multiple risk categories, including insurance risk.
Insurance Risk Management Governance and Control We employ a wide range of insurance risk management practices and controls, as outlined below:
• Insurance risk governance practices are in place, including independent monitoring and review and reporting to senior management and the Risk & Conduct Review Committee.
• Risk appetite limits have been established for policyholder behaviour, mortality and morbidity, and longevity risks. • Income and regulatory capital sensitivities are monitored, managed and reported against pre-established risk limits. • Comprehensive Insurance Risk Policy, guidelines and practices are in place. • The global underwriting manual aligns underwriting practices with our corporate risk management standards and ensures a
consistent approach in insurance underwriting. • Board-approved maximum retention limits (amounts issued in excess of these limits are reinsured) are in place. • Detailed procedures, including criteria for approval of risks and for claims adjudication are established and monitored for each
business segment. • Underwriting and risk selection standards are established and overseen by the corporate underwriting and claims risk management
function. • Diversification and risk pooling is managed by aggregation of exposures across product lines, geography and distribution channels. • The Insurance Risk Policy, and Investment and Credit Risk Management Policy establish acceptance criteria and protocols to
monitor the level of reinsurance ceded to any single reinsurer or group of reinsurers. • Reinsurance counterparty risk is monitored, including through annual reporting to the Risk & Conduct Review Committee. • Concentration risk exposure is monitored on group policies in a single location to avoid a catastrophic event occurrence resulting in
a significant impact. • Various limits, restrictions and fee structures are introduced into plan designs in order to establish a more homogeneous policy risk
profile and limit potential for anti-selection. • Regulatory solvency requirements include risk-based capital requirements and are monitored regularly. • The Product Design and Pricing Policy requires detailed risk assessment and pricing provision for material risks. • Company specific and industry level experience studies and sources of earnings analysis are monitored and factored into valuation,
renewal and new business pricing processes. • Stress-testing techniques, such as DCAT, are used to measure the effects of large and sustained adverse movements in insurance
risk factors. • Insurance contract liabilities are established in accordance with Canadian actuarial standards of practice. • Internal capital targets are established at an enterprise level to cover all risks and are above minimum regulatory and supervisory
levels. Actual capital levels are monitored to ensure they exceed internal targets.
We use reinsurance to limit losses, minimize exposure to significant risks and to provide additional capacity for growth. Our Insurance Risk Policy sets maximum global retention limits and related management standards and practices which are applied to reduce our exposure to large claims. Amounts in excess of the Board-approved maximum retention limits are reinsured. On a single life or joint-first-to-die basis our retention limit is $25 in Canada and is US$25 outside of Canada. For survivorship life insurance, our maximum
Notes to Consolidated Financial Statements Sun Life Financial Inc. Annual Report 2017 127

global retention limit is $30 in Canada and is US$30 outside of Canada. In certain markets and jurisdictions retention levels below the maximum are applied. Reinsurance is utilized for numerous products in most business segments, and placement is done on an automatic basis for defined insurance portfolios and on a facultative basis for individual risks with certain characteristics.
Our reinsurance coverage is well diversified and controls are in place to manage exposure to reinsurance counterparties. Reinsurance exposures are monitored to ensure that no single reinsurer represents an undue level of credit risk. This includes performing periodic due diligence on our reinsurance counterparties as well as internal credit assessments on counterparties with which we have material exposure. While reinsurance arrangements provide for the recovery of claims arising from the liabilities ceded, we retain primary responsibility to the policyholders.
Specific insurance risks and our risk management strategies are discussed below in further detail. The sensitivities provided below reflect the impact of any applicable ceded reinsurance arrangements.
7.A.i Policyholder Behaviour Risk Risk Description We can incur losses due to adverse policyholder behaviour relative to the assumptions used in the pricing and valuation of products with regard to lapse of policies or exercise of other embedded policy options.
Uncertainty in policyholder behaviour can arise from several sources including unexpected events in the policyholder’s life circumstances, the general level of economic activity (whether higher or lower than expected), changes in pricing and availability of current products, the introduction of new products, changes in underwriting technology and standards, as well as changes in our financial strength or reputation. Uncertainty in future cash flows affected by policyholder behaviour can be further exacerbated by irrational behaviour during times of economic turbulence or at key option exercise points in the life of an insurance contract.
For individual life insurance products where fewer terminations would be financially adverse to us, net income and equity would be decreased by about $240 ($235 in 2016) if the termination rate assumption were reduced by 10%. For products where more terminations would be financially adverse to us, net income and equity would be decreased by about $175 ($130 in 2016) if the termination rate assumption were increased by 10%. These sensitivities reflect the impact of any applicable ceded reinsurance arrangements.
Policyholder Behaviour Risk Management Governance and Control Various types of provisions are built into many of our products to reduce the impact of uncertain policyholder behaviour. These provisions include:
• Surrender charges which adjust the payout to the policyholder by taking into account prevailing market conditions. • Limits on the amount that policyholders can surrender or borrow. • Restrictions on the timing of policyholders’ ability to exercise certain options. • Restrictions on both the types of funds clients can select and the frequency with which they can change funds. • Policyholder behaviour risk is also mitigated through reinsurance on some insurance contracts.
7.A.ii Mortality and Morbidity Risk Risk Description Mortality and morbidity risk is the risk that future experience could be worse than the assumptions used in the pricing and valuation of products. Mortality and morbidity risk can arise in the normal course of business through random fluctuation in realized experience, through catastrophes, or in association with other risk factors such as product development and pricing or model risk. Adverse mortality and morbidity experience could also occur through systemic anti-selection, which could arise due to poor plan design, or underwriting process failure or the development of investor-owned and secondary markets for life insurance policies.
The risk of adverse morbidity experience also increases during economic slowdowns, especially with respect to disability coverages, as well as with increases in high medical treatment costs and growth in utilization of specialty drugs. This introduces the potential for adverse financial volatility in our financial results. External factors including medical advances could adversely affect our life insurance, health insurance, critical illness, disability, long-term care insurance and annuity businesses.
For life insurance products for which higher mortality would be financially adverse to the Company, a 2% increase in the best estimate assumption would decrease net income and equity by about $55 ($35 in 2016). This sensitivity reflects the impact of any applicable ceded reinsurance arrangements.
For products where morbidity is a significant assumption, a 5% adverse change in the assumptions would reduce net income and equity by about $175 ($150 in 2016). This sensitivity reflects the impact of any applicable ceded reinsurance arrangements.
Mortality and Morbidity Risk Management Governance and Control Detailed uniform underwriting procedures have been established to determine the insurability of applicants and to manage exposure to large claims. These underwriting requirements are regularly scrutinized against industry guidelines and oversight is provided through a corporate underwriting and claim management function.
We do not have a high degree of concentration risk to single individuals or groups due to our well-diversified geographic and business mix. The largest portion of mortality risk within the Company is in North America. Individual and group insurance policies are underwritten prior to initial issue and renewals, based on risk selection, plan design, and rating techniques.
The Insurance Risk Policy approved by the Risk & Conduct Review Committee includes limits on the maximum amount of insurance that may be issued under one policy and the maximum amount that may be retained. These limits vary by geographic region and amounts in excess of limits are reinsured to ensure there is no exposure to unreasonable concentration of risk.
7.A.iii Longevity Risk Risk Description Longevity risk is the potential for economic loss, accounting loss or volatility in earnings arising from adverse changes in rates of mortality improvement relative to the assumptions used in the pricing and valuation of products. This risk can manifest itself slowly over
128 Sun Life Financial Inc. Annual Report 2017 Notes to Consolidated Financial Statements

time as socioeconomic conditions improve and medical advances continue. It could also manifest itself more quickly, for example, due to medical breakthroughs that significantly extend life expectancy. Longevity risk affects contracts where benefits or costs are based upon the likelihood of survival (for example, annuities, pensions, pure endowments, reinsurance, segregated funds, and specific types of health contracts). Additionally, our longevity risk exposure is exacerbated for certain annuity products such as guaranteed annuity options by an increase in equity market levels.
For annuities products for which lower mortality would be financially adverse to us, a 2% decrease in the mortality assumption would decrease net income and equity by about $120 ($120 in 2016). These sensitivities reflect the impact of any applicable ceded reinsurance arrangements.
Longevity Risk Management Governance and Control To improve management of longevity risk, we monitor research in the fields which could result in mortality improvement. Stress-testing techniques are used to measure and monitor the impact of extreme mortality improvement on the aggregate portfolio of insurance and annuity products as well as our own pension plans.
7.A.iv Product Design and Pricing Risk Risk Description Product design and pricing risk is the risk a product does not perform as expected, causing adverse financial consequences. This risk may arise from deviations in realized experience versus assumptions used in the pricing of products. Risk factors include uncertainty concerning future investment yields, policyholder behaviour, mortality and morbidity experience, sales levels, mix of business, expenses and taxes. Although some of our products permit us to increase premiums or adjust other charges and credits during the life of the policy or contract, the terms of these policies or contracts may not allow for sufficient adjustments to maintain expected profitability. This could have an adverse effect on our profitability and capital position.
Product Design and Pricing Governance and Control Our Product Design and Pricing Policy, approved by the Risk & Conduct Review Committee, establishes the framework governing our product design and pricing practices and is designed to align our product offerings with our strategic objectives and risk-taking philosophy. Consistent with this policy, product development, design and pricing processes have been implemented throughout the Company. New products follow a stage-gate process with defined management approvals based on the significance of the initiative, and each initiative is subject to a risk assessment process to identify key risks and risk mitigation requirements, and is reviewed by multiple stakeholders. Additional governance and control procedures are listed below:
• Pricing models, methods, and assumptions are subject to periodic internal peer reviews. • Experience studies, sources of earnings analysis, and product dashboards are used to monitor actual experience against those
assumed in pricing and valuation. • On experience rated, participating, and adjustable products, emerging experience is reflected through changes in policyholder
dividend scales as well as other policy adjustment mechanisms such as premium and benefit levels. • Limits and restrictions may be introduced into the design of products to mitigate adverse policyholder behaviour or apply upper
thresholds on certain benefits.
7.A.v Expense Risk Risk Description Expense risk is the risk that future expenses are higher than the assumptions used in the pricing and valuation of products. This risk can arise from general economic conditions, unexpected increases in inflation, slower than anticipated growth, or reduction in productivity leading to increases in unit expenses. Expense risk occurs in products where we cannot or will not pass increased costs onto the client and will manifest itself in the form of a liability increase or a reduction in expected future profits.
The sensitivity of liabilities for insurance contracts to a 5% increase in unit expenses would result in a decrease in net income and equity of about $160 ($170 in 2016). These sensitivities reflect the impact of any applicable ceded reinsurance arrangements.
Expenses Risk Management Governance and Control We closely monitor expenses through an annual budgeting process and ongoing monitoring of any expense gaps between unit expenses assumed in pricing and actual expenses.
7.A.vi Reinsurance Risk Risk Description We purchase reinsurance for certain risks underwritten by our various insurance businesses. Reinsurance risk is the risk of financial loss due to adverse developments in reinsurance markets (for example, discontinuance or diminution of reinsurance capacity, or an increase in the cost of reinsurance), insolvency of a reinsurer or inadequate reinsurance coverage.
Changes in reinsurance market conditions, including actions taken by reinsurers to increase rates on existing and new coverage and our ability to obtain appropriate reinsurance, may adversely impact the availability or cost of maintaining existing or securing new reinsurance capacity, with adverse impacts on our business strategies, profitability and financial position. There is an increased possibility of rate increases or renegotiation of legacy reinsurance contracts by our reinsurers, as the global reinsurance industry continues to review and optimize their business models. In addition, changes to the regulatory treatment of reinsurance arrangements could have an adverse impact on our capital position.
Reinsurance Risk Management Governance and Control We have an Insurance Risk Policy, and Investment and Credit Risk Management Policy approved by the Risk & Conduct Review Committee which set acceptance criteria and processes to monitor the level of reinsurance ceded to any single reinsurer or group of reinsurers. These policies also set out criteria for determining which reinsurance companies qualify as suitable reinsurance
Notes to Consolidated Financial Statements Sun Life Financial Inc. Annual Report 2017 129

counterparties and require that all agreements include provisions to allow action to be taken, such as recapture of ceded risk (at a potential cost to the Company), in the event that the reinsurer loses its legal ability to carry on business through insolvency or regulatory action. Periodic due diligence is performed on the reinsurance counterparties with which we do business and internal credit assessments are performed on reinsurance counterparties with which we have material exposure. Reinsurance counterparty credit exposures are monitored closely and reported annually to the Risk & Conduct Review Committee.
New sales of our products can be discontinued or changed to reflect developments in the reinsurance markets. Rates for in-force reinsurance treaties can be either guaranteed or adjustable for the life of the ceded policy. There is generally more than one reinsurer supporting a reinsurance pool to diversify this risk.
8. Other Assets
Other assets consist of the following:
As at December 31, 2017 2016
Accounts receivable
Investment income due and accrued
Property and equipment
Deferred acquisition costs(1)
Prepaid expenses
Premium receivable
Accrued benefit assets (Note 25)
Other
$ 1,579 1,078 624 160 282 522 82 81
$ 2,296
1,079
659
177
249
506
67
76
Total other assets $ 4,408 $ 5,109
(1) Amortization of deferred acquisition cost charged to income during the year amounted to $53 in 2017 ($59 in 2016).
9. Goodwill and Intangible Assets
9.A Goodwill Changes in the carrying amount of goodwill acquired through business combinations by reportable segment are as follows:
SLF Asset SLF Canada SLF U.S. SLF Asia Management Corporate Total
Balance, January 1, 2016 $ 2,573 $ 464 $ 609 $ 784 $ 216 $ 4,646
Acquisitions (Note 3) – 660 96 – –
Foreign exchange rate movements – (12) (19) (17) (37) (85)
Balance, December 31, 2016 $ 2,573 $ 1,112 $ 686 $ 767 $ 179 $ 5,317
Acquisitions (Note 3) – – 16 – – Foreign exchange rate movements – (69) (47) (38) 4 (150)
Balance, December 31, 2017 $ 2,573 $ 1,043 $ 655 $ 729 $ 183 $ 5,183
Goodwill was not impaired in 2017 or 2016. The carrying amounts of goodwill allocated to our CGUs or groups of CGUs are as follows:
As at December 31, 2017 2016
SLF Canada
Individual $ 1,066 $ 1,066
Group retirement services 453 453
Group benefits 1,054 1,054
SLF U.S. Employee benefits group 1,043 1,112
SLF Asia 655 686
SLF Asset Management
MFS 481 510
Sun Life Investment Management (“SLIM”) 248 257
Corporate
U.K. 183 179
Total $ 5,183 $ 5,317
Goodwill acquired in business combinations is allocated to the CGUs or groups of CGUs that are expected to benefit from the synergies of the particular acquisition.
130 Sun Life Financial Inc. Annual Report 2017 Notes to Consolidated Financial Statements
756
16

Goodwill is assessed for impairment annually or more frequently if events or circumstances occur that may result in the recoverable amount of a CGU falling below its carrying value. The recoverable amount is the higher of fair value less costs of disposal and value in use. We use fair value less costs of disposal as the recoverable amount.
We use the best evidence of fair value less costs of disposal as the price obtainable for the sale of a CGU, or group of CGUs. Fair value less costs of disposal is initially assessed by looking at recently completed market comparable transactions. In the absence of such comparables, we use either an appraisal methodology (with market assumptions commonly used in the valuation of insurance companies or asset management companies) or a valuation multiples methodology. The fair value measurements are categorized in Level 3 of the fair value hierarchy.
Under the appraisal methodology, fair value is assessed based on best estimates of future income, expenses, level and cost of capital over the lifetime of the policies and, where appropriate, adjusted for items such as transaction costs. The value ascribed to new business is based on sales anticipated in our business plans, sales projections for the valuation period based on reasonable growth assumptions, and anticipated levels of profitability of that new business. In calculating the value of new business, future sales are projected for 10 to 15 years. In some instances, market multiples are used to approximate the explicit projection of new business.
The discount rates applied reflect the nature of the environment for that CGU. The discount rates used range from 9.0% to 12.5% (after tax). More established CGUs with a stronger brand and competitive market position use discount rates at the low end of the range and CGUs with a weaker competitive position use discount rates at the high end of the range. The capital levels used are aligned with our business objectives.
Under the valuation multiples methodology, fair value is assessed with reference to multiples or ratios of comparable businesses. For life insurers and asset managers, these valuation multiples and ratios may include price-to-earnings or price-to-assets-undermanagement measures. This assessment takes into consideration a variety of relevant factors and assumptions, including expected growth, risk, and market conditions among others. The price-to-earnings multiples used range from 11.0 to 12.0. The price-to-assetsunder-management ratios used range from 1.3% to 2.2%.
Judgment is used in estimating the recoverable amounts of CGUs and the use of different assumptions and estimates could result in material adjustments to the valuation of CGUs and the size of any impairment. Any material change in the key assumptions including those for capital, discount rates, the value of new business, and expenses, as well as cash flow projections used in the determination of recoverable amounts, may result in impairment charges, which could be material.
In considering the sensitivity of the key assumptions above, management determined that there is no reasonably possible change in any of the above that would result in the recoverable amount of any of the CGUs to be less than its carrying amount.
Notes to Consolidated Financial Statements Sun Life Financial Inc. Annual Report 2017 131

9.B Intangible Assets Changes in intangible assets are as follows:
Gross carrying amount
Balance, January 1, 2016
Additions
Acquisitions (Note 3)
Disposals(1)
Foreign exchange rate movements
Balance, December 31, 2016
Finite life
Internally generated software
$ 451
82
–
(6)
(9)
$ 518
$
$
Other
904
11
343
(80)
(6)
1,172
Indefinite life
$ 677
–
–
–
(16)
$ 661
$
$
Total
2,032
93
343
(86)
(31)
2,351
Additions 81 5 – 86 Acquisitions (Note 3) – 61 – 61 Disposals (3) – – (3) Foreign exchange rate movements (17) (36) (36) (89)
Balance, December 31, 2017 $ 579 $ 1,202 $ 625 $ 2,406
Accumulated amortization and impairment losses
Balance, January 1, 2016
Amortization charge for the year
Disposals(1)
Foreign exchange rate movements
$ (239)
(63)
6
5
$ (310)
(46)
2
1
$ (4)
–
–
–
$ (553)
(109)
8
6
Balance, December 31, 2016 $ (291) $ (353) $ (4) $ (648)
Amortization charge for the year (59) (53) – (112) Disposals 3 – – 3 Foreign exchange rate movements 9 9 – 18
Balance, December 31, 2017 $ (338) $ (397) $ (4) $ (739)
Net carrying amount, end of period:
As at December 31, 2016 $ 227 $ 819 $ 657 $ 1,703
As at December 31, 2017 $ 241 $ 805 $ 621 $ 1,667
(1) During 2016, the Company derecognized intangibles assets (carrying value of $78) related to Bentall Kennedy when a client of Bentall Kennedy exercised its rights to acquire certain wholly-owned subsidiaries involved in the management of its assets, for consideration of $75. Bentall Kennedy is reported within SLIM in the SLF Asset Management segment.
The components of the intangible assets are as follows:
As at December 31, 2017 2016
Finite life intangible assets:
Distribution, sales potential of field force $ 376 $ 417
Client relationships and asset administration contracts 429 402
Internally generated software 241 227
Total finite life intangible assets $ 1,046 $ 1,046
Indefinite life intangible assets:
Fund management contracts(1) $ 621 $ 657
Total indefinite life intangible assets $ 621 $ 657
Total intangible assets $ 1,667 $ 1,703
(1) Fund management contracts are attributable to SLF Asset Management, where its competitive position in, and the stability of, its markets support their classification as indefinite life intangible assets.
132 Sun Life Financial Inc. Annual Report 2017 Notes to Consolidated Financial Statements

10. Insurance Contract Liabilities and Investment Contract Liabilities
10.A Insurance Contract Liabilities 10.A.i Description of Business The majority of the products sold by the Company are insurance contracts. These contracts include all forms of life, health and critical illness insurance sold to individuals and groups, life contingent annuities, accumulation annuities, and segregated fund products with guarantees.
10.A.ii Methods and Assumptions General The liabilities for insurance contracts represent the estimated amounts which, together with estimated future premiums and net investment income, will provide for outstanding claims, estimated future benefits, policyholders’ dividends, taxes (other than income taxes), and expenses on in-force insurance contracts.
In determining our liabilities for insurance contracts, assumptions must be made about mortality and morbidity rates, lapse and other policyholder behaviour, interest rates, equity market performance, asset default, inflation, expenses, and other factors over the life of our products. Most of these assumptions relate to events that are anticipated to occur many years in the future. Assumptions require significant judgment and regular review and, where appropriate, revision.
We use best estimate assumptions for expected future experience and apply margins for adverse deviations to provide for uncertainty in the choice of the best estimate assumptions. The amount of insurance contract liabilities related to the application of margins for adverse deviations to best estimate assumptions is called a provision for adverse deviations.
Best Estimate Assumptions Best estimate assumptions are intended to be current, neutral estimates of the expected outcome as guided by Canadian actuarial standards of practice. The choice of best estimate assumptions takes into account current circumstances, past experience data (Company and/or industry), the relationship of past to expected future experience, anti-selection, the relationship among assumptions, and other relevant factors. For assumptions on economic matters, the assets supporting the liabilities and the expected policy for asset-liability management are relevant factors.
Margins for Adverse Deviations The appropriate level of margin for adverse deviations on an assumption is guided by Canadian actuarial standards of practice. For most assumptions, the standard range of margins for adverse deviations is 5% to 20% of the best estimate assumption, and the actuary chooses from within that range based on a number of considerations related to the uncertainty in the determination of the best estimate assumption. The level of uncertainty, and hence the margin chosen, will vary by assumption and by line of business and other factors. Considerations that would tend to indicate a choice of margin at the high end of the range include:
• The statistical credibility of the Company’s experience is too low to be the primary source of data for choosing the best estimate assumption
• Future experience is difficult to estimate • The cohort of risks lacks homogeneity • Operational risks adversely impact the ability to estimate the best estimate assumption • Past experience may not be representative of future experience and the experience may deteriorate
Provisions for adverse deviations in future interest rates are included by testing a number of scenarios of future interest rates, some of which are prescribed by Canadian actuarial standards of practice, and determining the liability based on the range of possible outcomes. A scenario of future interest rates includes, for each forecast period between the statement of financial position date and the last liability cash flow, interest rates for risk-free assets, premiums for asset default, rates of inflation, and an investment strategy consistent with the Company’s investment policy. The starting point for all future interest rate scenarios is consistent with the current market environment. If few scenarios are tested, the liability would be at least as great as the largest of the outcomes. If many scenarios are tested, the liability would be within a range defined by the average of the outcomes that are above the 60th percentile of the range of outcomes and the corresponding average for the 80th percentile.
Provisions for adverse deviations in future equity returns are included by scenario testing or by applying margins for adverse deviations. In blocks of business where the valuation of liabilities uses scenario testing of future equity returns, the liability would be within a range defined by the average of the outcomes that are above the 60th percentile of the range of outcomes and the corresponding average for the 80th percentile. In blocks of business where the valuation of liabilities does not use scenario testing of future equity returns, the margin for adverse deviations on common share dividends is between 5% and 20%, and the margin for adverse deviations on capital gains would be 20% plus an assumption that those assets reduce in value by 20% to 50% at the time when the reduction is most adverse. A 30% reduction is appropriate for a diversified portfolio of North American common shares and, for other portfolios, the appropriate reduction depends on the volatility of the portfolio relative to a diversified portfolio of North American common shares.
In choosing margins, we ensure that, when taken one at a time, each margin is reasonable with respect to the underlying best estimate assumption and the extent of uncertainty present in making that assumption, and also that, in aggregate, the cumulative impact of the margins for adverse deviations is reasonable with respect to the total amount of our insurance contract liabilities. Our margins are generally stable over time and are generally only revised to reflect changes in the level of uncertainty in the best estimate assumptions. Our margins tend to be at the high end of the range for expenses and in the mid-range or higher for other assumptions. When considering the aggregate impact of margins, the actuary assesses the consistency of margins for each assumption across each block of business to ensure there is no double counting or omission and to avoid choosing margins that might be mutually exclusive. In particular, the actuary chooses similar margins for blocks of business with similar characteristics, and also chooses margins that are consistent with other assumptions, including assumptions about economic factors. The actuary is guided by Canadian actuarial standards of practice in making these professional judgments about the reasonableness of margins for adverse deviations.
Notes to Consolidated Financial Statements Sun Life Financial Inc. Annual Report 2017 133

The best estimate assumptions and margins for adverse deviations are reviewed at least annually and revisions are made when appropriate. The choice of assumptions underlying the valuation of insurance contract liabilities is subject to external actuarial peer review.
Mortality Mortality refers to the rates at which death occurs for defined groups of people. Life insurance mortality assumptions are generally based on the past five to ten years of experience. Our experience is combined with industry experience where our own experience is insufficient to be statistically valid. Assumed mortality rates for life insurance and annuity contracts include assumptions about future mortality improvement based on recent trends in population mortality and our outlook for future trends.
Morbidity Morbidity refers to both the rates of accident or sickness and the rates of recovery therefrom. Most of our disability insurance is marketed on a group basis. We offer critical illness policies on an individual basis in Canada and Asia, long-term care on an individual basis in Canada, and medical stop-loss insurance is offered on a group basis in the U.S. In Canada, group morbidity assumptions are based on our five-year average experience, modified to reflect any emerging trend in recovery rates. For long-term care and critical illness insurance, assumptions are developed in collaboration with our reinsurers and are largely based on their experience. In the United States, our experience is used for both medical stop-loss and disability assumptions, with some consideration of industry experience.
Lapse and Other Policyholder Behaviour
Lapse Policyholders may allow their policies to lapse prior to the end of the contractual coverage period by choosing not to continue to pay premiums or by surrendering their policy for the cash surrender value. Assumptions for lapse experience on life insurance are generally based on our five-year average experience. Lapse rates vary by plan, age at issue, method of premium payment, and policy duration.
Premium Payment Patterns For universal life contracts, it is necessary to set assumptions about premium payment patterns. Studies prepared by industry or the actuarial profession are used for products where our experience is insufficient to be statistically valid. Premium payment patterns usually vary by plan, age at issue, method of premium payment, and policy duration.
Expense Future policy-related expenses include the costs of premium collection, claims adjudication and processing, actuarial calculations, preparation and mailing of policy statements, and related indirect expenses and overhead. Expense assumptions are mainly based on our recent experience using an internal expense allocation methodology. Inflationary increases assumed in future expenses are consistent with the future interest rates used in scenario testing.
Investment Returns
Interest Rates We generally maintain distinct asset portfolios for each major line of business. In the valuation of insurance contract liabilities, the future cash flows from insurance contracts and the assets that support them are projected under a number of interest rate scenarios, some of which are prescribed by Canadian actuarial standards of practice. Reinvestments and disinvestments take place according to the specifications of each scenario, and the liability is set based on the range of possible outcomes.
Non-Fixed Income Rates of Return We are exposed to equity markets through our segregated fund products (including variable annuities) that provide guarantees linked to underlying fund performance and through insurance products where the insurance contract liabilities are supported by non-fixed income assets.
For segregated fund products (including variable annuities), we have implemented hedging programs involving the use of derivative instruments to mitigate a large portion of the equity market risk associated with the guarantees. The cost of these hedging programs is reflected in the liabilities. The equity market risk associated with anticipated future fee income is not hedged.
The majority of non-fixed income assets that are designated as FVTPL support our participating and universal life products where investment returns are passed through to policyholders through routine changes in the amount of dividends declared or in the rate of interest credited. In these cases, changes in non-fixed income asset values are largely offset by changes in insurance contract liabilities.
Asset Default As required by Canadian actuarial standards of practice, insurance contract liabilities include a provision for possible future default of the assets supporting those liabilities. The amount of the provision for asset default included in the insurance contract liabilities is based on possible reductions in future investment yield that vary by factors such as type of asset, asset credit quality (rating), duration, and country of origin. The asset default assumptions are comprised of a best estimate plus a margin for adverse deviations, and are intended to provide for loss of both principal and income. Best estimate asset default assumptions by asset category and geography are derived from long-term studies of industry experience and the Company’s experience. Margins for adverse deviation are chosen from the standard range (of 25% to 100%) as recommended by Canadian actuarial standards of practice based on the amount of uncertainty in the choice of best estimate assumption. The credit quality of an asset is based on external ratings if available (public bonds) and internal ratings if not (mortgages and loans). Any assets without ratings are treated as if they are rated below investment grade.
In contrast to asset impairment provisions and changes in FVTPL assets arising from impairments, both of which arise from known credit events, the asset default provision in the insurance contract liabilities covers losses related to possible future (unknown) credit events. Canadian actuarial standards of practice require the asset default provision to be determined taking into account known impairments that are recognized elsewhere on the statement of financial position. The asset default provision included in the insurance contract liabilities is reassessed each reporting period in light of impairments, changes in asset quality ratings, and other events that occurred during the period.
134 Sun Life Financial Inc. Annual Report 2017 Notes to Consolidated Financial Statements

10.A.iii Insurance Contract Liabilities Insurance contract liabilities consist of the following:
As at December 31, 2017 SLF Canada SLF U.S. SLF Asia Corporate(1) Total
Individual participating life
Individual non-participating life and health
Group life and health
Individual annuities
Group annuities
$ 20,918 11,161 9,131 9,178
11,607
$ 5,582 22,003 5,427 (43) 113
$ 6,705 1,470
33 – –
$ 1,186 394 11
6,215 –
$ 34,391 35,028 14,602 15,350 11,720
Insurance contract liabilities before other policy liabilities
Add: Other policy liabilities(2)
61,995 3,088
33,082 1,363
8,208 2,014
7,806 229
111,091 6,694
Total insurance contract liabilities $ 65,083 $ 34,445 $ 10,222 $ 8,035 $ 117,785
(1) Primarily business from the U.K. and run-off reinsurance operations. Includes U.K. business of $1,089 for Individual participating life, $250 for Individual non-participating life and health, $5,692 for Individual annuities, and $158 for Other policy liabilities.
(2) Consists of amounts on deposit, policy benefits payable, provisions for unreported claims, provisions for policyholder dividends, and provisions for experience rating refunds.
As at December 31, 2016 SLF Canada SLF U.S. SLF Asia Corporate(1) Total
Individual participating life $ 20,045 $ 6,099 $ 6,550 $ 1,396 $ 34,090
Individual non-participating life and health(2) 10,248 21,271 1,279 237 33,035
Group life and health 8,872 5,875 30 8 14,785
Individual annuities(2) 9,149 (81) – 6,362 15,430
Group annuities 10,898 173 – – 11,071
Insurance contract liabilities before other policy liabilities
Add: Other policy liabilities(3)
59,212
2,997
33,337
1,335
7,859
2,013
8,003
301
108,411
6,646
Total insurance contract liabilities $ 62,209 $ 34,672 $ 9,872 $ 8,304 $ 115,057
(1) Primarily business from the U.K. and run-off reinsurance operations. Includes U.K. business of $1,305 for Individual participating life, $80 for Individual non-participating life and health, $5,734 for Individual annuities, and $145 for Other policy liabilities.
(2) Balances have been changed to conform with current year presentation. (3) Consists of amounts on deposit, policy benefits payable, provisions for unreported claims, provisions for policyholder dividends, and provisions for experience rating refunds.
10.A.iv Changes in Insurance Contract Liabilities and Reinsurance Assets Changes in Insurance contract liabilities and Reinsurance assets are as follows:
For the years ended December 31, 2017 2016
Insurance contract liabilities
Reinsurance assets Net
Insurance contract liabilities
Reinsurance assets Net
Balances, before Other policy liabilities and assets as at January 1,
Change in balances on in-force policies
Balances arising from new policies
Method and assumption changes
$ 108,411 2,757 2,941 (371)
$ 4,541 $ 103,870 (779) 3,536 156 2,785 (198) (173)
$ 103,730
2,439
3,574
(622)
$ 4,812
415
109
(657)
$ 98,918
2,024
3,465
35
Increase (decrease) in Insurance contract liabilities and Reinsurance assets 5,327 (821) 6,148 5,391 (133) 5,524
Acquisitions (Note 3)
Foreign exchange rate movements
– (2,647)
– (217)
– (2,430)
2,157
(2,867)
1
(139)
2,156
(2,728)
Balances before Other policy liabilities and assets
Other policy liabilities and assets
111,091 6,694
3,503 525
107,588 6,169
108,411
6,646
4,541
603
103,870
6,043
Total Insurance contract liabilities and Reinsurance assets, December 31 $ 117,785 $ 4,028 $ 113,757 $ 115,057 $ 5,144 $ 109,913
Notes to Consolidated Financial Statements Sun Life Financial Inc. Annual Report 2017 135

10.A.v Impact of Method and Assumption Changes Impacts of method and assumption changes on Insurance contract liabilities net of Reinsurance assets are as follows:
Net increase (decrease) For the year ended December 31, 2017 before income taxes Description
Mortality / Morbidity $ (286) Updates to reflect mortality/morbidity experience in all jurisdictions. The largest items were favourable mortality in SLF U.S. In-force Management and International insurance and favourable mortality improvement in SLF U.K.
Lapse and other policyholder behaviour 149 Updates to reflect lapse and other policyholder behaviour experience in all jurisdictions. The largest items were lower lapse rates on lapse supported business in SLF U.S. and updated lapse assumptions in SLF Canada’s individual insurance business.
Expenses 71 Updates to reflect expense experience in all jurisdictions. The largest items were a refinement to the allocation of expenses in SLF Canada and increased expenses in the closed block of business in SLF U.S. International wealth.
Investment returns (62) Updates to various investment related assumptions across the Company. This included a reduction of the provision for investment risk in SLF Canada and other updated investment related assumptions, offset partially by updates to promulgated ultimate reinvestment rates.
Model enhancements and other
Total impact of method and assumption changes $
(45)
(173)
Various enhancements and methodology changes across all jurisdictions. Includes the favourable impact on insurance contract liabilities from the resolution of tax uncertainties in a U.S. subsidiary and updates to the SLF Canada participating individual life business, partially offset by changes due to U.S. tax reform and updates to reflect reinsurance market conditions.
For the year ended December 31, 2016 Net increase (decrease) before income taxes Description
Mortality / Morbidity $ (16) Updates to reflect mortality/morbidity experience.
Lapse and other policyholder behaviour 98 Updates to reflect lapse and other policyholder behaviour experience, largely in SLF U.S. businesses that are closed to new sales.
Expenses 18 Updates to reflect expense studies.
Investment returns (281) Updates to various investment related assumptions across the Company, which had the most significant impact in SLF U.S. and SLF Canada. The largest items were a reduction of the provision for investment risk in the SLF Canada participating account, and favourable changes to projected credit and swap spreads partially offset by changes to assumed returns on non-fixed income assets.
Model enhancements and other 216 Various enhancements and methodology changes across all jurisdictions, including increases to provisions for reinsurance in SLF U.S.
Total impact of method and assumption changes $ 35
10.B Investment Contract Liabilities 10.B.i Description of Business The following are the types of Investment contracts in-force:
• Term certain payout annuities in Canada and the U.S. • Guaranteed Investment Contracts in Canada • Unit-linked products issued in the U.K. and Hong Kong • Non-unit-linked pensions contracts issued in the U.K. and Hong Kong
136 Sun Life Financial Inc. Annual Report 2017 Notes to Consolidated Financial Statements

10.B.ii Method and Assumption Changes Investment Contracts with Discretionary Participation Features Investment contracts with DPF are measured using the same approach as insurance contracts.
Investment Contracts without Discretionary Participation Features
Investment contracts without DPF are measured at FVTPL if by doing so, a potential accounting mismatch is eliminated or significantly reduced or if the contract is managed on a fair value basis. Other investment contracts without DPF are measured at amortized cost.
The fair value liability is measured through the use of prospective discounted cash-flow techniques. For unit-linked contracts, the fair value liability is equal to the current unit fund value, plus additional non-unit liability amounts on a fair value basis if required. For non-unit-linked contracts, the fair value liability is equal to the present value of cash flows.
Amortized cost is measured at the date of initial recognition as the fair value of consideration received, less the net effect of principal payments such as transaction costs and front-end fees. At each reporting date, the amortized cost liability is measured as the present value of future cash flows discounted at the effective interest rate where the effective interest rate is the rate that equates the discounted cash flows to the liability at the date of initial recognition.
10.B.iii Investment Contract Liabilities Investment contract liabilities consist of the following:
As at December 31, 2017 SLF Canada SLF U.S. SLF Asia Corporate Total
Individual participating life $ – $ – $ – $ 8 $ 8 Individual non-participating life and health – – 260 3 263 Individual annuities 2,517 – – 48 2,565 Group annuities – – 246 – 246
Total investment contract liabilities $ 2,517 $ – $ 506 $ 59 $ 3,082
Included in the Investment contract liabilities of $3,082 are liabilities of $562 for investment contracts with DPF, $2,517 for investment contracts without DPF measured at amortized cost, and $3 for investment contracts without DPF measured at fair value.
As at December 31, 2016 SLF Canada SLF U.S. SLF Asia Corporate Total
Individual participating life $ – $ – $ – $ 9 $ 9
Individual non-participating life and health – – 280 3 283
Individual annuities 2,305 – – 52 2,357
Group annuities – – 264 – 264
Total investment contract liabilities $ 2,305 $ – $ 544 $ 64 $ 2,913
Included in the Investment contract liabilities of $2,913 are liabilities of $605 for investment contracts with DPF, $2,305 for investment contracts without DPF measured at amortized cost, and $3 for investment contracts without DPF measured at fair value.
10.B.iv Changes in Investment Contract Liabilities Changes in investment contract liabilities without DPF are as follows:
For the years ended December 31, 2017 2016
Measured at Measured at Measured at Measured at fair value amortized cost fair value amortized cost
Balance as at January 1 $ 3 $ 2,305 $ 4 $ 2,208
Deposits – 470 – 352
Interest – 47 – 45
Withdrawals – (322) – (311)
Fees – (5) – (5)
Other – 19 – 17
Change in assumptions – 3 – –
Foreign exchange rate movements – – (1) (1)
Balance as at December 31 $ 3 $ 2,517 $ 3 $ 2,305
Notes to Consolidated Financial Statements Sun Life Financial Inc. Annual Report 2017 137

Changes in investment contract liabilities with DPF are as follows:
For the years ended December 31, 2017 2016
Balance as at January 1
Change in liabilities on in-force
Liabilities arising from new policies
$ 605 (10) 1
$ 701
(58)
–
Increase (decrease) in liabilities
Foreign exchange rate movements
(9) (34)
(58)
(38)
Balance as at December 31 $ 562 $ 605
10.C Gross Claims and Benefits Paid Gross claims and benefits paid consist of the following:
For the years ended December 31, 2017 2016
Maturities and surrenders
Annuity payments
Death and disability benefits
Health benefits
Policyholder dividends and interest on claims and deposits
$ 2,389 1,849 3,836 6,079 1,200
$ 2,671
1,867
3,820
5,711
1,141
Total gross claims and benefits paid $ 15,353 $ 15,210
10.D Total Assets Supporting Liabilities and Equity The following tables show the total assets supporting total liabilities for the product lines shown (including insurance contract and investment contract liabilities) and assets supporting equity and other:
Debt Equity Mortgages Investment As at December 31, 2017 securities securities and loans properties Other Total
Individual participating life $ 18,855 $ 3,190 $ 7,458 $ 4,645 $ 4,508 $ 38,656 Individual non-participating life and health 18,560 1,720 12,360 1,348 8,702 42,690 Group life and health 6,003 73 8,799 – 2,667 17,542 Individual annuities 12,001 50 5,506 – 1,303 18,860 Group annuities 6,076 45 5,840 – 538 12,499 Equity and other 11,124 942 2,842 1,074 16,491 32,473
Total assets $ 72,619 $ 6,020 $ 42,805 $ 7,067 $ 34,209 $ 162,720
Debt Equity Mortgages Investment As at December 31, 2016 securities securities and loans properties Other Total
Individual participating life $ 18,692 $ 3,017 $ 7,380 $ 4,429 $ 4,976 $ 38,494
Individual non-participating life and health(1) 18,313 1,830 11,027 1,128 9,147 41,445
Group life and health 6,269 84 8,594 – 2,894 17,841
Individual annuities(1) 12,196 43 5,318 – 1,516 19,073
Group annuities 5,838 42 5,513 – 777 12,170
Equity and other 10,579 758 2,943 1,035 16,733 32,048
Total assets $ 71,887 $ 5,774 $ 40,775 $ 6,592 $ 36,043 $ 161,071
(1) Balances have been changed to conform with current year presentation.
10.E Role of the Appointed Actuary The Appointed Actuary is appointed by the Board and is responsible for ensuring that the assumptions and methods used in the valuation of policy liabilities and reinsurance recoverables are in accordance with accepted actuarial practice in Canada, applicable legislation, and associated regulations or directives.
The Appointed Actuary is required to provide an opinion regarding the appropriateness of the policy liabilities net of reinsurance recoverables at the statement dates to meet all policy obligations of the Company. Examination of supporting data for accuracy and completeness and analysis of our assets for their ability to support the amount of policy liabilities net of reinsurance recoverables are important elements of the work required to form this opinion.
The Appointed Actuary is required each year to investigate the financial condition of the Company and prepare a report for the Board. The 2017 analysis tested our capital adequacy until December 31, 2021, under various adverse economic and business conditions. The Appointed Actuary reviews the calculation of our Minimum Continuing Capital and Surplus Requirements (“MCCSR”).
138 Sun Life Financial Inc. Annual Report 2017 Notes to Consolidated Financial Statements

11. Reinsurance
Reinsurance is used primarily to limit exposure to large losses. We have a retention policy that requires that such arrangements be placed with well-established, highly-rated reinsurers. Coverage is well-diversified and controls are in place to manage exposure to reinsurance counterparties. While reinsurance arrangements provide for the recovery of claims arising from the liabilities ceded, we retain primary responsibility to the policyholders.
11.A Reinsurance Assets Reinsurance assets are measured using the amounts and assumptions associated with the underlying insurance contracts and in accordance with the terms of each reinsurance contract. Reinsurance assets are comprised of the following:
As at December 31, 2017 SLF Canada SLF U.S. SLF Asia Corporate(1) Total
Individual participating life $ 4 $ (33) $ 207 $ – $ 178 Individual non-participating life and health 129 793 89 22 1,033 Group life and health 342 1,626 2 – 1,970 Individual annuities – – – 195 195 Group annuities 127 – – – 127
Reinsurance assets before other policy assets 602 2,386 298 217 3,503 Add: Other policy assets(2) 85 356 29 55 525
Total Reinsurance assets $ 687 $ 2,742 $ 327 $ 272 $ 4,028
(1) Primarily business from the U.K. and run-off reinsurance operations. Includes U.K. business of $22 for Individual non-participating life and health, and $58 for Individual annuities.
(2) Consists of amounts on deposit, policy benefits payable, provisions for unreported claims, provisions for policyholder dividends, and provisions for experience rating refunds.
As at December 31, 2016 SLF Canada SLF U.S. SLF Asia Corporate(1) Total
Individual participating life $ 48 $ (39) $ 176 $ – $ 185
Individual non-participating life and health 489 1,402 78 23 1,992
Group life and health 335 1,647 2 1 1,985
Individual annuities – – – 234 234
Group annuities 145 – – – 145
Reinsurance assets before other policy assets 1,017 3,010 256 258 4,541
Add: Other policy assets(2) 85 361 21 136 603
Total Reinsurance assets $ 1,102 $ 3,371 $ 277 $ 394 $ 5,144
(1) Primarily business from the U.K. and run-off reinsurance operations. Includes U.K. business of $23 for Individual non-participating life and health, and $75 for Individual annuities.
(2) Consists of amounts on deposit, policy benefits payable, provisions for unreported claims, provisions for policyholder dividends, and provisions for experience rating refunds.
There was no impairment of Reinsurance assets in 2017 and 2016. Changes in Reinsurance assets are included in Note 10.A.iv.
11.B Reinsurance (Expenses) Recoveries Reinsurance (expenses) recoveries are comprised of the following:
For the years ended December 31, 2017 2016
Recovered claims and benefits $ 3,704 $ 3,594
Commissions 85 195
Reserve adjustments 224 196
Operating expenses and other 360 328
Reinsurance (expenses) recoveries $ 4,373 $ 4,313
11.C Reinsurance Gains or Losses We did not enter into reinsurance arrangements that resulted in profits on inception in 2017 and 2016.
Notes to Consolidated Financial Statements Sun Life Financial Inc. Annual Report 2017 139

12. Other Liabilities
12.A Composition of Other Liabilities Other liabilities consist of the following:
As at December 31, 2017 2016
Accounts payable
Bank overdrafts and cash pooling
Repurchase agreements (Note 5)
Accrued expenses and taxes
Borrowed funds
Senior financing
Accrued benefit liability (Note 25)
Secured borrowings from mortgage securitization (Note 5)
Other
$ 1,972 140
1,976 2,927 227(1)
1,905(2)
710 1,355 775
$ 2,739
189
1,789
2,884
274
2,034
631
1,141
718
Total other liabilities $ 11,987 $ 12,399
(1) The change in Borrowed funds relates to net cash flow changes of $(45) and foreign exchange rate movements of $(2). (2) The change in Senior financing relates to net cash flow changes of $nil and foreign exchange rate movements of $(129).
12.B Borrowed Funds Borrowed funds include the following:
As at December 31, Currency of
borrowing Maturity 2017 2016
Encumbrances on real estate Cdn. dollars Current – 2033
Encumbrances on real estate U.S. dollars Current – 2020
$ 206 21
$ 251
23
Total borrowed funds $ 227 $ 274
Interest expense for the borrowed funds was $13 and $20 for 2017 and 2016. The aggregate maturities of borrowed funds are included in Note 6.
12.C Senior Financing On November 8, 2007, a structured entity consolidated by us issued a US$1,000 variable principal floating rate certificate (the “Certificate”) to a financial institution (the “Lender”). At the same time, Sun Life Assurance Company of Canada-U.S. Operations Holdings, Inc. (“U.S. Holdings”), a subsidiary of SLF Inc., entered into an agreement with the Lender, pursuant to which U.S. Holdings will bear the ultimate obligation to repay the outstanding principal amount of the Certificate and be obligated to make quarterly interest payments at three-month LIBOR plus a fixed spread. SLF Inc. has fully guaranteed the obligation of U.S. Holdings. The structured entity issued additional certificates after the initial issuance, totaling to US$515, none of which were issued during 2017 and 2016. Total collateral posted per the financing agreement was US$nil as at December 31, 2017 (US$2 as at December 31, 2016).
The maximum capacity of this agreement is US$2,500. The agreement expires on November 8, 2037 and the maturity date may be extended annually for additional one-year periods upon the mutual agreement of the parties, provided such date is not beyond November 8, 2067. The agreement can be cancelled or unwound at the option of U.S. Holdings in whole or in part from time to time, or in whole under certain events.
For the year ended December 31, 2017, we recorded $36 of interest expense relating to this obligation ($28 in 2016). The fair value of the obligation is $1,776 ($1,671 in 2016). The fair value is determined by discounting the expected future cash flows using a current market interest rate adjusted by SLF Inc.’s credit spread and is categorized in Level 3 of the fair value hierarchy.
140 Sun Life Financial Inc. Annual Report 2017 Notes to Consolidated Financial Statements

13. Senior Debentures and Innovative Capital Instruments
13.A Senior Debentures(1) The following obligations are included in Senior debentures as at December 31:
SLF Inc. senior debentures
Series B issued March 13, 2006(2)
Series B issued February 26, 2007(2)
Series D issued June 30, 2009(3)
Series E issued August 23, 2011(3)
Sun Life Assurance senior debentures(4)
Issued to Sun Life Capital Trust (“SLCT I”)
Series B issued June 25, 2002
Issued to Sun Life Capital Trust II (“SLCT II”)
Series C issued November 20, 2009(6)
Total senior debentures
Fair value
Interest rate
4.95%
4.95%
5.70%
4.57%
7.09%
6.06%
Earliest par call or redemption date
June 1, 2016
June 1, 2016
n/a
n/a
June 30, 2032(5)
December 31, 2019(7)
Maturity
2036
2036
2019
2021
2052
2108
$
$
$
2017
– –
300 299
200
500
1,299
1,439
$
$
$
2016
–
–
300
299
200
500
1,299
1,473
(1) All senior debentures are unsecured. (2) Redeemed on June 1, 2016. (3) Redeemable in whole or in part at any time prior to maturity at a price equal to the greater of par and a price based on the yield of a corresponding Government of Canada
bond plus 0.575% for the Series D debentures and 0.53% for the Series E debentures. (4) Redemption is subject to regulatory approval. (5) Redeemable in whole or in part on any interest payment date or in whole upon the occurrence of a Regulatory Event or Tax Event, as described in the debenture. Prior to
June 30, 2032, the redemption price is the greater of par and a price based on the yield of a corresponding Government of Canada bond plus 0.32%; from June 30, 2032, the redemption price is par.
(6) On December 31, 2019, and every fifth anniversary thereafter (“Interest Reset Date”), the interest rate will reset to an annual rate equal to the five-year Government of Canada bond yield plus 3.60%.
(7) Redeemable in whole or in part. If redemption occurs on an Interest Reset Date, the redemption price is par; otherwise, it is the greater of par and a price based on the yield of a corresponding Government of Canada bond plus (i) 0.65% if redemption occurs prior to December 31, 2019, or (ii) 1.30% if redemption occurs after December 31, 2019. Also redeemable in whole at par at any time upon the occurrence of a Regulatory Event or Tax Event, as described in the debenture.
Fair value is determined based on quoted market prices for identical or similar instruments. When quoted market prices are not available, fair value is determined from observable market data by dealers that are typically the market makers. The fair value is categorized in Level 2 of the fair value hierarchy.
Interest expense for senior debentures was $76 and $95 for 2017 and 2016, respectively.
The senior debentures issued by SLF Inc. are direct senior unsecured obligations and rank equally with other unsecured and unsubordinated indebtedness of SLF Inc.
13.B Innovative Capital Instruments Innovative capital instruments consist of Sun Life ExchangEable Capital Securities (“SLEECS”), which were issued by SLCT I and SLCT II (together “SL Capital Trusts”), established as trusts under the laws of Ontario. SLCT I issued Sun Life ExchangEable Capital Securities – Series B (“SLEECS B”), which are units representing an undivided beneficial ownership interest in the assets of that trust. SLEECS B are non-voting except in certain limited circumstances. Holders of the SLEECS B are eligible to receive semi-annual non-cumulative fixed cash distributions. SLCT II issued Sun Life ExchangEable Capital Securities – Series 2009-1 (“SLEECS 2009-1”), which are subordinated unsecured debt obligations. Holders of SLEECS 2009-1 are eligible to receive semi-annual interest payments. The proceeds of the issuances of SLEECS B and SLEECS 2009-1 were used by the SL Capital Trusts to purchase senior debentures of Sun Life Assurance. The SL Capital Trusts are not consolidated by us. As a result, the innovative capital instruments are not reported on our Consolidated Financial Statements. However, the senior debentures issued by Sun Life Assurance to the SL Capital Trusts are reported on our Consolidated Financial Statements.
The SLEECS are structured to achieve Tier 1 regulatory capital treatment for SLF Inc. and Sun Life Assurance and, as such, have features of equity capital. No interest payments or distributions will be paid in cash by the SL Capital Trusts on the SLEECS if Sun Life Assurance fails to declare regular dividends (i) on its Class B Non-Cumulative Preferred Shares Series A, or (ii) on its public preferred shares, if any are outstanding (each, a “Missed Dividend Event”). In the case of the SLEECS 2009-1, if a Missed Dividend Event occurs or if an interest payment is not made in cash on the SLEECS 2009-1 for any reason, including at the election of Sun Life Assurance, holders of the SLEECS 2009-1 will be required to invest interest paid on the SLEECS 2009-1 in non-cumulative perpetual preferred shares of Sun Life Assurance. In the case of the SLEECS B, if a Missed Dividend Event occurs, the net distributable funds of SLCT I will be distributed to Sun Life Assurance as the holder of Special Trust Securities of that trust. If the SL Capital Trusts fail to pay in cash the semi-annual interest payments or distributions on the SLEECS in full for any reason other than a Missed Dividend Event, then, for a specified period of time, Sun Life Assurance will not declare dividends of any kind on any of its public preferred shares, and if no such public preferred shares are outstanding, SLF Inc. will not declare dividends of any kind on any of its preferred shares or common shares.
Each SLEECS B unit and each one thousand dollars principal amount of SLEECS 2009-1 will be automatically exchanged for 40 non-cumulative perpetual preferred shares of Sun Life Assurance if any one of the following events occurs: (i) proceedings are commenced or an order is made for the winding-up of Sun Life Assurance; (ii) OSFI takes control of Sun Life Assurance or its assets; (iii) Sun Life Assurance’s capital ratios fall below applicable thresholds; or (iv) OSFI directs Sun Life Assurance to increase its capital or
Notes to Consolidated Financial Statements Sun Life Financial Inc. Annual Report 2017 141

provide additional liquidity and Sun Life Assurance either fails to comply with such direction or elects to have the SLEECS automatically exchanged (“Automatic Exchange Event”). Upon an Automatic Exchange Event, former holders of the SLEECS will cease to have any claim or entitlement to distributions, interest or principal against the issuing SL Capital Trusts and will rank as preferred shareholders of Sun Life Assurance in a liquidation of Sun Life Assurance.
According to OSFI guidelines, innovative capital instruments can comprise up to 15% of net Tier 1 capital with an additional 5% eligible for Tier 2B capital. As at December 31, 2017, for regulatory capital purposes of Sun Life Assurance, $699 (2016 – $698) represented Tier 1 capital.
The table below presents additional significant terms and conditions of the SLEECS:
Distribution or interest Annual Redemption date at Conversion date at Principal Issuer Issuance date payment dates yield the issuer’s option the holder’s option amount
Sun Life Capital Trust(1)(2)(3)(4)
SLEECS B June 25, 2002 June 30, December 31 7.093% June 30, 2007 Any time $ 200
Sun Life Capital Trust II(1)(2)
SLEECS 2009-1 November 20, 2009 June 30, December 31 5.863%(5) December 31, 2014 No conversion option 500
Total $ 700
(1) Subject to regulatory approval, the SL Capital Trusts may (i) redeem any outstanding SLEECS, in whole or in part, on the redemption date specified above or on any distribution date thereafter, or in the case of SLCT II, on any date thereafter, and (ii) may redeem all, but not part of any class of SLEECS upon occurrence of a Regulatory Event or a Tax Event, prior to the redemption date specified above.
(2) The SLEECS B may be redeemed for cash equivalent to (i) the greater of the Early Redemption Price or the Redemption Price if the redemption occurs prior to June 30, 2032 or (ii) the Redemption Price if the redemption occurs on or after June 30, 2032. Redemption Price is equal to one thousand dollars plus the unpaid distributions, other than unpaid distributions resulting from a Missed Dividend Event, to the redemption date. Early Redemption Price for the SLEECS B is the price calculated to provide an annual yield, equal to the yield of a Government of Canada bond issued on the redemption date that has a maturity date of June 30, 2032, plus 32 basis points, plus the unpaid distributions, other than unpaid distributions resulting from a Missed Dividend Event, to the redemption date. The SLEECS 2009-1 may be redeemed for cash equivalent to, on any day that is not an Interest Reset Date, accrued and unpaid interest on the SLEECS 2009-1 plus the greater of par and a price calculated to provide an annual yield equal to the yield of a Government of Canada bond maturing on the next Interest Reset Date plus (i) 0.60% if the redemption date is prior to December 31, 2019 or (ii) 1.20% if the redemption date is any time after December 31, 2019. On an Interest Reset Date, the redemption price is equal to par plus accrued and unpaid interest on the SLEECS 2009-1.
(3) The non-cumulative perpetual preferred shares of Sun Life Assurance issued upon an Automatic Exchange Event in respect of the SLEECS B will become convertible, at the option of the holder, into a variable number of common shares of SLF Inc. on distribution dates on or after December 31, 2032.
(4) Holders of SLEECS B may exchange, at any time, all or part of their SLEECS B units for non-cumulative perpetual preferred shares of Sun Life Assurance at an exchange rate for each SLEECS of 40 non-cumulative perpetual preferred shares of Sun Life Assurance. SLCT I will have the right, at any time before the exchange is completed, to arrange for a substituted purchaser to purchase SLEECS tendered for surrender to SLCT I so long as the holder of the SLEECS so tendered has not withheld consent to the purchase of its SLEECS. Any non-cumulative perpetual preferred shares issued in respect of an exchange by the holders of SLEECS B will become convertible, at the option of the holder, into a variable number of common shares of SLF Inc. on distribution dates on or after December 31, 2032.
(5) Holders of SLEECS 2009-1 are eligible to receive semi-annual interest payments at a fixed rate until December 31, 2019. The interest rate on the SLEECS 2009-1 will reset on December 31, 2019 and every fifth anniversary thereafter to equal the five-year Government of Canada bond yield plus 3.40%.
14. Subordinated Debt
The following obligations are included in Subordinated debt as at December 31, and qualify as capital for Canadian regulatory purposes:
Interest Earliest par call or rate redemption date(1) Maturity 2017 2016
Sun Life Assurance:
Issued May 15, 1998(2) 6.30% n/a 2028 $ 150 $ 150
Sun Life Financial Inc.:
Issued May 29, 2007(3) 5.40% May 29, 2037(4) 2042 398 398
Issued January 30, 2008(5) 5.59% January 30, 2018(5) 2023 400 400
Issued March 2, 2012(6) 4.38% March 2, 2017(6) 2022 – 799
Issued May 13, 2014(7) 2.77% May 13, 2019 2024 249 249
Issued September 25, 2015(8) 2.60% September 25, 2020 2025 498 497
Issued February 19, 2016(9) 3.10% February 19, 2021 2026 349 348
Issued September 19, 2016(10) 3.05% September 19, 2023(4) 2028 995 995
Issued November 23, 2017(11) 2.75% November 23, 2022 2027 398 –
Total subordinated debt $ 3,437 $ 3,836
Fair value $ 3,583 $ 3,986
(1) The debentures issued by SLF Inc. in 2007 are redeemable at any time and the debentures issued by SLF Inc. in 2014, 2015, 2016, and 2017 are redeemable on or after the date specified. From the date noted, the redemption price is par and redemption may only occur on a scheduled interest payment date. Redemption of all subordinated debentures is subject to regulatory approval.
(2) 6.30% Debentures, Series 2, due 2028, issued by The Mutual Life Assurance Company of Canada, which subsequently changed its name to Clarica Life Insurance Company (“Clarica”) and was amalgamated with Sun Life Assurance. These debentures are redeemable at any time. Prior to May 15, 2028, the redemption price is the greater of par and a price based on the yield of a corresponding Government of Canada bond plus 0.16%.
(3) Series 2007-1 Subordinated Unsecured 5.40% Fixed/Floating Debentures due 2042. From May 29, 2037, interest is payable at 1.00% over Canadian dollar offered rate for three-month bankers’ acceptances (“CDOR”).
(4) For redemption of the 2007 debentures prior to the date noted, and for redemptions of the September 19, 2016 debentures between September 19, 2021 and September 19, 2023, the redemption price is the greater of par and a price based on the yield of a corresponding Government of Canada bond plus 0.25% for the 2007 debentures and 0.52% for the September 19, 2016 debentures.
(5) Series 2008-1 Subordinated Unsecured 5.59% Fixed/Floating Debentures due 2023. On January 30, 2018, SLF Inc. redeemed all of the outstanding principal amount of these debentures as described in Note 28.
(6) Series 2012-1 Subordinated Unsecured 4.38% Fixed/Floating Debentures due 2022. On March 2, 2017, SLF Inc. redeemed all of the outstanding $800 principal amount of these debentures at a redemption price equal to the principal amount together with accrued and unpaid interest.
(7) Series 2014-1 Subordinated Unsecured 2.77% Fixed/Floating Debentures due 2024. From May 13, 2019, interest is payable at 0.75% over CDOR. (8) Series 2015-1 Subordinated Unsecured 2.60% Fixed/Floating Debentures due 2025. From September 25, 2020, interest is payable at 1.43% over CDOR. (9) Series 2016-1 Subordinated Unsecured 3.10% Fixed/Floating Debentures due 2026. From February 19, 2021, interest is payable at 2.20% over CDOR. (10) Series 2016-2 Subordinated Unsecured 3.05% Fixed/Floating Debentures due 2028. From September 19, 2023, interest is payable at 1.85% over CDOR. (11) Series 2017-1 Subordinated Unsecured 2.75% Fixed/Floating Debentures due 2027. From November 23, 2022, interest is payable at 0.74% over CDOR.
142 Sun Life Financial Inc. Annual Report 2017 Notes to Consolidated Financial Statements

Fair value is determined based on quoted market prices for identical or similar instruments. When quoted market prices are not available, fair value is determined from observable market data by dealers that are typically the market makers. The fair value is categorized in Level 2 of the fair value hierarchy.
Interest expense on subordinated debt was $122 and $126 for 2017 and 2016, respectively.
15. Share Capital
The authorized share capital of SLF Inc. consists of the following:
• An unlimited number of common shares without nominal or par value. Each common share is entitled to one vote at meetings of the shareholders of SLF Inc. There are no pre-emptive, redemption, purchase, or conversion rights attached to the common shares.
• An unlimited number of Class A and Class B non-voting shares, issuable in series. The Board is authorized before issuing the shares, to fix the number, the consideration per share, the designation of, and the rights and restrictions of the Class A and Class B shares of each series, subject to the special rights and restrictions attached to all the Class A and Class B shares. The Board has authorized 13 series of Class A non-voting preferred shares, 10 of which are outstanding.
The common and preferred shares of SLF Inc. qualify as capital for Canadian regulatory purposes. See Note 21.
Dividends and Restrictions on the Payment of Dividends Under the Insurance Companies Act (Canada), SLF Inc. and Sun Life Assurance are each prohibited from declaring or paying a dividend on any of its shares if there are reasonable grounds for believing that it is, or by paying the dividend would be, in contravention of: (i) the requirement that it maintains adequate capital and adequate and appropriate forms of liquidity, (ii) any regulations under the Insurance Companies Act (Canada) in relation to capital and liquidity, and (iii) any order by which OSFI directs it to increase its capital or provide additional liquidity.
SLF Inc. and Sun Life Assurance have each covenanted that, if a distribution is not paid when due on any outstanding SLEECS issued by the SL Capital Trusts, then (i) Sun Life Assurance will not pay dividends on its public preferred shares, if any are outstanding, and (ii) if Sun Life Assurance does not have any public preferred shares outstanding, then SLF Inc. will not pay dividends on its preferred shares or common shares, in each case, until the 12th month (in the case of the SLEECS issued by SLCT I) or 6th month (in the case of SLEECS issued by SLCT II) following the failure to pay the required distribution in full, unless the required distribution is paid to the holders of SLEECS. Public preferred shares means preferred shares issued by Sun Life Assurance which: (a) have been issued to the public (excluding any preferred shares held beneficially by affiliates of Sun Life Assurance); (b) are listed on a recognized stock exchange; and (c) have an aggregate liquidation entitlement of at least $200. As at December 31, 2017, Sun Life Assurance did not have outstanding any shares that qualify as public preferred shares.
The terms of SLF Inc.’s outstanding preferred shares provide that for so long as Sun Life Assurance is a subsidiary of SLF Inc., no dividends on such preferred shares are to be declared or paid if Sun Life Assurance’s minimum regulatory capital ratio falls below the applicable threshold.
In addition, under the terms of SLF Inc.’s outstanding preferred shares, SLF Inc. cannot pay dividends on its common shares without the approval of the holders of those preferred shares unless all dividends on the preferred shares for the last completed period for which dividends are payable have been declared and paid or set apart for payment.
Currently, the above limitations do not restrict the payment of dividends on SLF Inc.’s preferred or common shares.
The declaration and payment of dividends on SLF Inc.’s shares are at the sole discretion of the Board of Directors and will be dependent upon our earnings, financial condition and capital requirements. Dividends may be adjusted or eliminated at the discretion of the Board on the basis of these or other considerations.
15.A Common Shares The changes in common shares issued and outstanding for the years ended December 31 were as follows:
2017 2016
Number of Number of Common shares (in millions of shares) shares Amount shares Amount
Balance, January 1 613.6 $ 8,614 612.3 $ 8,567
Stock options exercised (Note 19) 0.4 18 1.3 47
Common shares purchased for cancellation(1) (3.5) (50) – –
Balance, December 31 610.5 $ 8,582 613.6 $ 8,614
(1) On August 14, 2017, SLF Inc. launched a normal course issuer bid to purchase and cancel up to 11.5 million common shares between August 14, 2017 and August 13, 2018, through the facilities of the Toronto Stock Exchange, other Canadian stock exchanges, and/or alternative Canadian trading platforms, at prevailing market rates. Purchases may also be made by way of private agreements or share repurchase programs under issuer bid exemption orders issued by securities regulatory authorities. Any purchases made under an exemption order issued by a securities regulatory authority will generally be at a discount to the prevailing market price. In 2017, the common shares purchased and cancelled under this program were purchased at an average price per share of $49.40 for a total amount of $175. The total amount paid to purchase the shares is allocated to Common shares and Retained earnings in our Consolidated Statements of Changes in Equity. The amount allocated to Common shares is based on the average cost per common share and amounts paid above the average cost are allocated to Retained earnings.
Notes to Consolidated Financial Statements Sun Life Financial Inc. Annual Report 2017 143

Under SLF Inc.’s Canadian DRIP, Canadian-resident common and preferred shareholders may choose to have their dividends automatically reinvested in common shares and may also purchase common shares for cash. For dividend reinvestments, SLF Inc. may, at its option, issue common shares from treasury at a discount of up to 5% to the volume weighted average trading price or direct that common shares be purchased by the plan agent for participants through the Exchanges at the market price. Common shares acquired by participants through optional cash purchases may be issued from treasury or purchased through the Exchanges at SLF Inc.’s option, in either case at no discount. Commencing with the dividends paid on March 31, 2016, common shares acquired under the DRIP are purchased by the plan agent on behalf of participants on the open market through the Exchanges.
15.B Preferred Shares The changes in preferred shares issued and outstanding for the years ended December 31 are as follows:
2017 2016
Number of Number of Preferred shares (in millions of shares) shares Amount shares Amount
Balance, January 1 92.2 $2,257 92.2 $2,257
Converted, Class A, Series 10R(1) – – (1.1) (26)
Issued, Class A, Series 11QR(1) – – 1.1 26
Balance, December 31 92.2 $2,257 92.2 $2,257
(1) Holders of the Class A Non-Cumulative 5-Year Rate Reset Preferred Shares Series 10R (“Series 10R Shares”) had a right to convert all or part of those shares on a one-for-one basis, into Class A Non-Cumulative Floating Rate Preferred Shares Series 11QR (“Series 11QR Shares”) on September 30, 2016 and certain holders exercised this right on that date.
Further information on the preferred shares outstanding as at December 31, 2017, is as follows:
Annual Annual dividend dividend Earliest par call or Number Face Net
(in millions of shares) Issue date rate per share redemption date(1) of shares amount amount(2) Class A Preferred shares
Series 1 February 25, 2005 4.75 % $ 1.19 Any time 16.0 $ 400 $ 394 Series 2 July 15, 2005 4.80 % $ 1.20 Any time 13.0 325 318 Series 3 January 13, 2006 4.45 % $ 1.11 Any time 10.0 250 245 Series 4 October 10, 2006 4.45 % $ 1.11 Any time 12.0 300 293 Series 5 February 2, 2007 4.50 % $ 1.13 Any time 10.0 250 245 Series 8R(3) May 25, 2010 2.275%(3) $ 0.57 June 30, 2020(4) 5.2 130 127 Series 9QR(6) June 30, 2015 Floating(5) Floating June 30, 2020(7) 6.0 150 147 Series 10R(3) August 12, 2011 2.842%(3)(8) $ 0.71(11) September 30, 2021(4) 6.9 173 169 Series 11QR(6) September 30, 2016 Floating(5) Floating September 30, 2021(7) 1.1 27 26 Series 12R(3)(10) November 10, 2011 3.806%(3)(9) $ 0.95(11) December 31, 2021(4) 12.0 300 293
Total preferred shares 92.2 $ 2,305 $ 2,257
(1) Redemption of all preferred shares is subject to regulatory approval. (2) Net of after-tax issuance costs. (3) On the earliest redemption date and every five years thereafter, the dividend rate will reset to an annual rate equal to the 5-year Government of Canada bond yield plus a
spread specified for each series. The specified spread for Class A shares is: Series 8R – 1.41%, Series 10R – 2.17% and Class A Non-Cumulative 5-Year Rate Reset Preferred Shares Series 12R (“Series 12R Shares”) – 2.73%. On the earliest redemption date and every five years thereafter, holders will have the right, at their option, to convert their shares into the series that is one number higher than their existing series.
(4) Redeemable on the redemption date and every five years thereafter, in whole or in part, at $25.00 per share. (5) Holders are entitled to receive quarterly floating rate non-cumulative dividends at an annual rate equal to the then 3-month Government of Canada treasury bill yield plus a
spread specified for each series. The specified spread for Class A shares is: Series 9QR – 1.41% and Series 11QR – 2.17%. (6) On the earliest redemption date and every five years thereafter, holders will have the right, at their option, to convert those shares into the series that is one number lower
than their existing series. (7) Redeemable on the redemption date and every five years thereafter, in whole or in part, at $25.00 per share, and on any other date at $25.50 per share. (8) Prior to September 30, 2016, the annual dividend rate was 3.90%. The dividend rate was reset on September 30, 2016 to a fixed annual dividend rate of 2.842% until
September 30, 2021. (9) Prior to December 31, 2016, the annual dividend rate was 4.25%. The dividend rate was reset on December 31, 2016 to a fixed annual dividend rate of 3.806% until
December 31, 2021. (10) On December 19, 2016, we announced that the number of Series 12R Shares that were elected to be converted into Class A Non-Cumulative Floating Rate Preferred
Shares Series 13QR was less than the one million shares required to give effect to that share conversion. (11) The annual dividend per share in the table above is the amount paid per share in 2017.
16. Interests in Other Entities
16.A Subsidiaries Our principal subsidiaries are Sun Life Assurance and Sun Life Global Investments Inc. Sun Life Assurance is our principal operating insurance company and holds our insurance operations in Canada, the U.S., the U.K., the Philippines, Hong Kong, Indonesia and Vietnam. These insurance operations are operated directly by Sun Life Assurance or through other subsidiaries. Sun Life Global Investments Inc. is a non-operating holding company that holds our asset management businesses, including Massachusetts Financial Services Company and the group of companies under SLIM.
We are required to comply with various regulatory capital and solvency requirements in the jurisdictions in which we operate that may restrict our ability to access or use the assets of the group and to pay dividends. Further details on these restrictions are included in Notes 15 and 21.
144 Sun Life Financial Inc. Annual Report 2017 Notes to Consolidated Financial Statements

16.B Joint Ventures and Associates We have interests in various joint ventures and associates that principally operate in India, Malaysia, China, and the Philippines. We also have interests in joint ventures related to certain real estate investments in Canada. Our interests in these joint ventures and associates range from 24.99% to 50%. The following table summarizes, in aggregate, the financial information of these joint ventures and associates:
As at or for the years ended December 31, 2017 2016
Carrying amount of interests in joint ventures and associates Our share of:
$ 1,369 $ 1,250
Net income (loss)
Other comprehensive income (loss)
67 (31)
69
(76)
Total comprehensive income (loss) $ 36 $ (7)
In 2017, we increased our investment in our joint ventures and associates by $121, primarily in Canada. During 2016, we increased our investment in certain joint ventures and associates. On April 11, 2016, we completed a transaction to increase our ownership in Birla Sun Life Insurance Company Limited, subsequently renamed to Aditya Sun Life Insurance Company Limited (“BSLI”), from 26% to 49% by purchasing additional shares of BSLI from Aditya Birla Nuvo Limited for consideration of $333, which includes transaction costs. In 2016, we also increased our investment in real estate joint ventures in Canada by $33.
During 2017, we received dividends from our joint ventures and associates of $36 ($20 in 2016). We also incurred rental expenses of $9 related to leases with our joint ventures and associates, with the remaining future rental payments payable to our joint ventures and associates totaling $243 over 15 years.
During 2016, we obtained control of certain investees that were previously classified as joint ventures and associates. As a result, these investees are no longer classified as joint ventures and associates on the dates that control was obtained. On January 7, 2016, we obtained control of PVI Sun Life and on July 1, 2016, we obtained control of PT CIMB Sun Life in Indonesia. Our share of net income (loss) and other comprehensive income (loss) from joint ventures and associates includes these investees up to the dates that we obtained control. Further details on these acquisitions are included in Note 3.
16.C Joint Operations We invest jointly in investment properties and owner-occupied properties which are co-managed under contractual relationships with the other investors. We share in the revenues and expenses generated by these properties in proportion to our investment. The carrying amount of these jointly controlled assets, which is included in Investment properties and in Other Assets for owner-occupied properties, is $1,205 as at December 31, 2017 ($1,211 as at December 31, 2016). The fair value of these jointly controlled assets is $1,293 as at December 31, 2017 ($1,300 as at December 31, 2016).
16.D Unconsolidated Structured Entities SLF Inc. and its subsidiaries have interests in various structured entities that are not consolidated by us. A structured entity is an entity that has been designed so that voting or similar rights are not the dominant factor in deciding who controls the entity, such as when any voting rights relate to administrative tasks only and the relevant activities are directed by means of contractual arrangements. We have an interest in a structured entity when we have a contractual or non-contractual involvement that exposes us to variable returns from the performance of the entity. Our interest includes investments held in securities or units issued by these entities and fees earned from management of the assets within these entities.
Information on our interests in unconsolidated structured entities is as follows:
As at December 31, 2017 2016
Consolidated Statements of Maximum Maximum
Type of investment Financial Position Carrying exposure Carrying exposure Type of structured entity held line item amount to loss(1) amount to loss(1)
Securitization entities – third- Debt securities Debt securities $ 5,899 $ 5,899 $ 5,946 $ 5,946 party managed
Securitization entities – third Short-term securities Cash, cash equivalents $ 725 $ 725 $ 785 $ 785 party managed and short-term
securities
Investment funds – third-party Investment fund units Equity securities $ 4,877 $ 4,877 $ 4,441 $ 4,441 managed
Investment funds – company Investment fund units Equity securities and $ 1,455 $ 1,455 $ 1,709 $ 1,709 managed(2) and Limited partnership Other invested assets
units
Limited partnerships – third- Limited partnership units Other invested assets $ 1,258 $ 1,258 $ 1,237 $ 1,237 party managed
(1) The maximum exposure to loss is the maximum loss that we could record through comprehensive income as a result of our involvement with these entities. (2) Includes investments in funds managed by our joint ventures with a carrying amount of $245 ($200 in 2016).
16.D.i Securitization Entities Securitization entities are structured entities that are generally financed primarily through the issuance of debt securities that are backed by a pool of assets, such as mortgages or loans.
Notes to Consolidated Financial Statements Sun Life Financial Inc. Annual Report 2017 145

Third-Party Managed Our investments in third-party managed securitization entities consist of asset-backed securities, such as commercial mortgage-backed securities, residential mortgage-backed securities, collateralized debt obligations (“CDOs”), and commercial paper. These securities are generally large-issue debt securities designed to transform the cash flows from a specific pool of underlying assets into tranches providing various risk exposures for investment purposes. We do not provide financial or other support to these entities other than our original investment and therefore our maximum exposure to loss on these investments is limited to the carrying amount of our investment. We do not have control over these investments since we do not have power to direct the relevant activities of these entities, regardless of the level of our investment.
Company Managed We provide collateral management services to various securitization entities, primarily CDOs, from which we earn a fee for our services. The financial support provided to these entities is limited to the carrying amount of our investment in these entities. We provide no guarantees or other contingent support to these entities. We have not consolidated these entities since we do not have significant variability from our interests in these entities and we do not have any investment in these entities.
16.D.ii Investment Funds and Limited Partnerships Investment funds and limited partnerships are investment vehicles that consist of a pool of funds collected from a group of investors for the purpose of investing in assets such as money market instruments, debt securities, equity securities, real estate, and other similar assets. The preceding table includes our investments in all investment funds, including mutual funds, exchange-traded funds, and segregated funds, and our investments in certain limited partnerships. Some of these investment funds and limited partnerships are structured entities. For all investment funds and limited partnerships, our maximum exposure to loss is equivalent to the carrying amount of our investment in the fund or partnership. Investment funds and limited partnerships are generally financed through the issuance of investment fund units or limited partnership units.
Third-Party Managed We hold units in investment funds and limited partnerships managed by third-party asset managers. Our investments in fund units and limited partnership units generally give us an undivided interest in the investment performance of a portfolio of underlying assets managed or tracked to a specific investment mandate for investment purposes. We do not have control over investment funds or limited partnerships that are structured entities since we do not have power to direct their relevant activities.
Company Managed We hold units in Company managed investment funds and limited partnerships. We generally have power over Company managed investment funds and limited partnerships that are structured entities since we have power to direct the relevant activities of the funds and limited partnerships. However, we have not consolidated these funds and limited partnerships since we do not have significant variability from our interests in these funds and limited partnerships. We earn management fees from the management of these investment funds and limited partnerships that are commensurate with the services provided and are reported in Fee income. Management fees are generally based on the value of the assets under management. Therefore, the fees earned are impacted by the composition of the assets under management and fluctuations in financial markets. The fee income earned is included in Fund management and other asset based fees in Note 17. We also hold units in investment funds and limited partnerships managed by our joint ventures. Our share of the management fees earned is included as part of the Net income (loss) reported in Note 16.B.
16.E Consolidated Structured Entities A significant structured entity consolidated by us is the entity that issued the senior financing that is described in more detail in Note 12.C. We also consolidate certain investment funds managed by Sun Life Institutional Investments (Canada) Inc. that invest primarily in mortgages and investment properties.
17. Fee Income
Fee income for the years ended December 31 consists of the following:
Contract administration and guarantee fees
Fund management and other asset based fees
Commissions
Service contract fees
Other fees
Total fee income
$
$
2017
576 3,901 907 278 180
5,842
$
$
2016
555
3,642
943
276
164
5,580
146 Sun Life Financial Inc. Annual Report 2017 Notes to Consolidated Financial Statements

18. Operating Expenses Operating expenses for the years ended December 31 consist of the following:
2017 2016
Employee expenses(1)
Premises and equipment
Capital asset depreciation
Service fees
Amortization of intangible assets (Note 9)
Other expenses(2)
$ 3,672 263 97
799 112
1,467
$ 3,394
250
94
805
109
1,348
Total operating expenses $ 6,410 $ 6,000
(1) See table below for further details. (2) Includes restructuring costs of $60 recorded in 2017 for the Company’s plan to enhance business processes and organizational structures and capabilities.
Employee expenses for the years ended December 31 consist of the following:
2017 2016
Salaries, bonus, employee benefits
Share-based payments (Note 19)
Other personnel costs
$ 3,155 476 41
$ 2,992
362
40
Total employee expenses $ 3,672 $ 3,394
19. Share-Based Payments 19.A Stock Option Plans SLF Inc. has granted stock options to eligible employees under the Executive Stock Option Plan. These options are granted at the closing price of the common shares on the Toronto Stock Exchange (“TSX”) on the grant date for stock options granted after January 1, 2007, and the closing price of the trading day preceding the grant date for stock options granted before January 1, 2007. The options granted under the stock option plans vest over a four-year period. All options have a maximum exercise period of 10 years. The maximum numbers of common shares that may be issued under the Executive Stock Option Plan are 29,525,000 shares.
The activities in the stock option plans for the years ended December 31 are as follows:
2017 2016
Number of stock
options (thousands)
Weighted average exercise
price
Number of stock
options (thousands)
Weighted average exercise
price
Balance, January 1, 3,397 $ 34.19 4,809 $ 34.79
Granted 369 $ 48.20 396 $ 40.16
Exercised (437) $ 34.70 (1,245) $ 31.45
Forfeited (4) $ 47.96 (128) $ 50.43
Expired (317) $ 52.54 (435) $ 49.30
Balance, December 31, 3,008 $ 33.88 3,397 $ 34.19
Exercisable, December 31, 2,071 $ 29.76 2,440 $ 32.60
The average share price at the date of exercise of stock options for the year ended December 31, 2017 was $49.98 ($47.52 for 2016).
Compensation expense for stock options was $3 for the year ended December 31, 2017 ($4 for 2016).
The stock options outstanding as at December 31, 2017 by exercise price, are as follows:
Weighted Number of average Weighted
stock remaining average options contractual exercise
Range of exercise prices (thousands) life (years) price
$18.00 to $24.00 732 3.44 $ 21.18 $24.01 to $30.00 364 4.75 $ 27.80 $30.01 to $35.00 388 2.70 $ 31.01 $35.01 to $45.00 1,050 7.24 $ 39.47 $45.01 to $49.00 474 7.16 $ 48.15
Total stock options 3,008 5.41 $ 33.88
Notes to Consolidated Financial Statements Sun Life Financial Inc. Annual Report 2017 147

The weighted average fair values of the stock options, calculated using the Black-Scholes option pricing model, granted during the year ended December 31, 2017, was $9.41 ($7.80 for 2016). The Black-Scholes option pricing model used the following assumptions to determine the fair value of options granted during the years ending December 31:
Weighted average assumptions 2017 2016
Risk-free interest rate 1.3% 0.9%
Expected volatility 31.7% 32.3%
Expected dividend yield 4% 4%
Expected life of the option (in years) 6.3 6.3
Exercise price $ 48.20 $ 40.16
Expected volatility is based on historical volatility of the common shares, implied volatilities from traded options on the common shares, and other factors. The expected term of options granted is derived based on historical employee exercise behaviour and employee termination experience. The risk-free rate for periods within the expected term of the option is based on the Canadian government bond yield curve in effect at the time of grant.
19.B Employee Share Ownership Plan In Canada, we match eligible employees’ contributions to the Sun Life Financial Employee Stock Plan. Employees may elect to contribute from 1% to 20% of their target annual compensation to the Sun Life Financial Employee Stock Plan. Under this plan the match is provided for employees who have met one year of employment eligibility and is equal to 50% of the employee’s contributions up to 5% of an employee’s annual compensation. The match is further capped by a one thousand five hundred dollar annual maximum. Our contributions vest immediately and are expensed. We recorded an expense of $7 for the year ended December 31, 2017 ($6 for 2016).
19.C Other Share-Based Payment Plans All other share-based payment plans use notional units that are valued based on the common share price on the TSX. Any fluctuation in the common share price changes the value of the units, which affects our share-based payment compensation expense. Upon redemption of these units, payments are made to the employees with a corresponding reduction in the accrued liability. We use equity swaps and forwards to hedge our exposure to variations in cash flows due to changes in the common share price for all of these plans.
Details of these plans are as follows:
Senior Executives’ Deferred Share Unit (“DSU”) Plan: Under the DSU plan, designated executives may elect to receive all or a portion of their annual incentive award in the form of DSUs. Each DSU is equivalent in value to one common share and earns dividend equivalents in the form of additional DSUs at the same rate as the dividends on common shares. The designated executives must elect to participate in the plan prior to the beginning of the plan year and this election is irrevocable. Awards generally vest immediately; however, participants are not permitted to redeem the DSUs until after termination, death, or retirement. The value at the time of redemption will be based on the fair value of the common shares immediately before their redemption.
Sun Share Unit (“Sun Share”) Plan: Under the Sun Share plan, participants are granted units that are equivalent in value to one common share and have a grant price equal to the average of the closing price of a common share on the TSX on the five trading days immediately prior to the date of grant. Participants generally hold units for up to 36 months from the date of grant. The units earn dividend equivalents in the form of additional units at the same rate as the dividends on common shares. Units may vest or become payable if we meet specified threshold performance targets. The plan provides for performance factors to motivate participants to achieve a higher return for shareholders (performance factors are determined through a multiplier that can be as low as zero or as high as two times the number of units that vest). Payments to participants are based on the number of units vested multiplied by the average closing price of a common share on the TSX on the five trading days immediately prior to the vesting date.
Additional information for other share-based payment plans: The units outstanding under these plans and the liabilities recognized for these units in our Consolidated Statements of Financial Position are summarized in the following table:
Number of units (in thousands) Sun Shares DSUs Total
Units outstanding December 31, 2016 6,612 991 7,603
Units outstanding December 31, 2017 6,507 1,040 7,547
Liability accrued as at December 31, 2016 $ 250 $ 45 $ 295
Liability accrued as at December 31, 2017 $ 250 $ 50 $ 300
Compensation expense and the income tax expense (benefit) for other share-based payment plans for the years ended December 31 are shown in the following table. Since expenses for the DSUs are accrued as part of incentive compensation in the year awarded, the expenses below do not include these accruals. The expenses presented in the following table include increases in the liabilities for Sun Shares and DSUs due to changes in the fair value of the common shares and the accruals of the Sun Shares liabilities over the vesting period, and exclude any adjustment in expenses due to the impact of hedging.
For the years ended December 31, 2017 2016
Compensation expense $ 125 $ 171
Income tax expense (benefit) $ (32) $ (47)
148 Sun Life Financial Inc. Annual Report 2017 Notes to Consolidated Financial Statements

19.D Share-Based Payment Plans of MFS Share-based payment awards within MFS are based on their own shares. Restricted share awards and stock option awards are settled in MFS shares and restricted stock unit awards are settled in cash. Restricted share awards, restricted stock unit awards, and stock option awards generally vest over a four-year period and continued employment is generally the only service requirement for these awards. Holders of restricted share awards and restricted stock unit awards are entitled to receive non-forfeitable dividend equivalent payments during the vesting period at the same rate as the dividends on MFS’s shares.
Although restricted share awards and stock option awards are settled in shares, all of the MFS share-based awards, including outstanding MFS shares, are accounted for as cash-settled share-based payment awards due to the fact that MFS has a practice of repurchasing its outstanding shares after a specified holding period. The fair value of stock option awards is determined using the Black-Scholes option pricing model, while the fair value of restricted share awards, restricted stock unit awards, and outstanding MFS shares are estimated using a market consistent share valuation model. The amount of periodic compensation expense recognized is impacted by grants of new awards, vesting, exercise, and forfeiture of unvested awards, share repurchases, changes in fair value of awards, and outstanding MFS shares. The total liability accrued attributable to all MFS share-based payment plans as at December 31, 2017 was $844 ($834 as at December 31, 2016) which includes a liability of $707 (US$562) for the stock options, restricted shares, and outstanding MFS shares.
Compensation expense and the income tax expense (benefit) for these awards for the years ended December 31 are shown in the following table:
For the years ended December 31, 2017 2016
Compensation expense $ 341 $ 181
Income tax expense (benefit) $ (85) $ (56)
20. Income Taxes
20.A Deferred Income Taxes The following represents the deferred tax assets and liabilities in the Consolidated Statements of Financial Position by source of temporary differences:
As at December 31, 2017 2016
Assets(1) Liabilities(1) Assets(1) Liabilities(1)
Investments $ (841) $ 116 $ (951) $ 113
Policy liabilities(2) 1,218 322 1,368 851
Deferred acquisition costs 84 7 157 (14)
Losses available for carry forward 543 (6) 513 –
Pension and other employee benefits 201 (150) 182 (228)
Other(3) 90 114 179 (35)
Total $ 1,295 $ 403 $ 1,448 $ 687
Total net deferred tax asset $ 892 $ 761
(1) Our deferred tax assets and deferred tax liabilities are offset when there is a legally enforceable right to offset current tax assets against current tax liabilities and when the deferred taxes relate to the same taxable entity and the same taxation authority. Negative amounts reported under Assets are deferred tax liabilities included in a net deferred tax asset position; negative amounts under Liabilities are deferred tax assets included in a net deferred tax liability position.
(2) Consists of Insurance contract liabilities and Investment contract liabilities net of Reinsurance assets. (3) Includes unused tax credits.
The movement in net deferred tax assets for the years ended December 31, are as follows:
Losses Pension Deferred available and other
Policy acquisition for carry employee Investments liabilities(1) costs forward benefits Other(2) Total
As at December 31, 2016 $ (1,064) $ 517 $ 171 $ 513 $ 410 $ 214 $ 761 Acquisitions (disposals) through
business combinations – – – – – (10) (10) Charged to statement of operations 132 388 (74) 43 (66) (209) 214 Charged to other comprehensive
income (73) – – (9) 22 (4) (64) Foreign exchange rate movements 48 (9) (20) 2 (15) (15) (9)
As at December 31, 2017 $ (957) $ 896 $ 77 $ 549 $ 351 $ (24) $ 892
(1) (2)
Consists of Insurance contract liabilities and Investment contract liabilities net of Reinsurance assets. Includes unused tax credits.
Notes to Consolidated Financial Statements Sun Life Financial Inc. Annual Report 2017 149

Losses Pension Deferred available and other
Policy acquisition for carry employee Investments liabilities(1) costs forward benefits Other(2) Total
As at December 31, 2015 $ (937) $ 169 $ 223 $ 822 $ 376 $ 314 $ 967
Acquisitions (disposals) through business combinations – 71 (15) – – 113 169
Charged to statement of operations (99) 268 (30) (295) 2 (231) (385)
Charged to other comprehensive income (17) – – 15 32 (8) 22
Foreign exchange rate movements (11) 9 (7) (29) – 26 (12)
As at December 31, 2016 $ (1,064) $ 517 $ 171 $ 513 $ 410 $ 214 $ 761
(1) Consists of Insurance contract liabilities and Investment contract liabilities net of Reinsurance assets. (2) Includes unused tax credits.
We have accumulated non-capital tax losses, primarily in Canada, the Philippines, and the U.K., totaling $2,662 ($2,415 in 2016). The benefit of these tax losses has been recognized to the extent that it is probable that the benefit will be realized. In addition, in the U.S., we have unused tax credits in the amount of $42 ($166 in 2016) for which a deferred tax asset has been recognized, and net capital losses of $26 ($nil in 2016) for which a deferred tax asset of $6 ($nil in 2016) has been recognized. Unused tax losses for which a deferred tax asset has not been recognized amount to $511 as of December 31, 2017 ($429 in 2016) primarily in the Philippines and Indonesia. We also have capital losses of $449 in the U.K. ($438 in 2016) and $176 in Canada ($193 in 2016) for which a deferred tax asset of $100 ($100 in 2016) has not been recognized.
We will realize the benefit of tax losses carried forward in future years through a reduction in current income taxes as and when the losses are utilized. These tax losses are subject to examination by various tax authorities and could be reduced as a result of the adjustments to tax returns. Furthermore, legislative, business or other changes may limit our ability to utilize these losses.
Included in the deferred tax asset related to losses available for carry forward are tax benefits that have been recognized on losses incurred in either the current or the preceding year. In determining if it is appropriate to recognize these tax benefits, we relied on projections of future taxable profits, and we also considered tax planning opportunities that will create taxable income in the period in which the unused tax losses can be utilized.
The non-capital losses carried forward in Canada expire beginning in 2028 and the capital losses can be carried forward indefinitely. The operating and capital losses in the U.K. can be carried forward indefinitely. The unused tax credits carried forward in the U.S. expire beginning in 2020 and the net capital losses expire in 2021.
We recognize a deferred tax liability on all temporary differences associated with investments in subsidiaries, branches, joint ventures and associates unless we are able to control the timing of the reversal of these differences and it is probable that these differences will not reverse in the foreseeable future. As at December 31, 2017, temporary differences associated with investments in subsidiaries, branches, joint ventures and associates for which a deferred tax liability has not been recognized amount to $5,611 ($6,114 in 2016).
20.B Income Tax Expense (Benefit) 20.B.i In our Consolidated Statements of Operations, Income tax expense (benefit) for the years ended December 31 has the following components:
2017 2016
Current income tax expense (benefit):
Current year $ 445 $ 271
Adjustments in respect of prior years, including resolution of tax disputes 25 (37)
Tax rate and other legislative changes 46 –
Total current income tax expense (benefit) $ 516 $ 234
Deferred income tax expense (benefit):
Origination and reversal of temporary differences $ (151) $ 372
Tax expense (benefit) arising from unrecognized tax losses – (1)
Adjustments in respect of prior years, including resolution of tax disputes (10) 14
Tax rate and other legislative changes (53) –
Total deferred income tax expense (benefit) $ (214) $ 385
Total income tax expense (benefit) $ 302 $ 619
150 Sun Life Financial Inc. Annual Report 2017 Notes to Consolidated Financial Statements
20.B.ii Income tax benefit (expense) recognized directly in equity for the years ended December 31:
2017 2016
Recognized in other comprehensive income:
Current income tax benefit (expense) $ 2 $ –
Deferred income tax benefit (expense) (64) 22
Total recognized in other comprehensive income $ (62) $ 22
Total income tax benefit (expense) recorded in equity, including tax benefit (expense) recorded in other comprehensive income $ (62) $ 22
20.B.iii Our effective income tax rate differs from the combined Canadian federal and provincial statutory income tax rate as follows:
For the years ended December 31, 2017 2016
% %
Total net income (loss) $ 2,487 $ 2,826
Add: Income tax expense (benefit) 302 619
Total net income (loss) before income taxes $ 2,789 $ 3,445
Taxes at the combined Canadian federal and provincial statutory income tax rate $ 746 26.8 $ 922 26.8
Increase (decrease) in rate resulting from:
Higher (lower) effective rates on income subject to taxation in foreign jurisdictions (257) (9.2) (93) (2.7)
Tax (benefit) cost of unrecognized tax losses and tax credits – – (1) (0.1)
Tax exempt investment income (213) (7.6) (166) (4.8)
Tax rate and other legislative changes (7) (0.3) 2 0.1
Adjustments in respect of prior years, including resolution of tax disputes 15 0.5 (23) (0.7)
Other 18 0.6 (22) (0.6)
Total tax expense (benefit) and effective income tax rate $ 302 10.8 $ 619 18.0
Statutory income tax rates in other jurisdictions in which we conduct business range from 0% to 35%, which creates a tax rate differential and corresponding tax provision difference compared to the Canadian federal and provincial statutory rate when applied to foreign income not subject to tax in Canada. Generally, higher earnings in jurisdictions with higher statutory tax rates result in an increase of our tax expense, while earnings arising in tax jurisdictions with statutory rates lower than 26.75% (rounded to 26.8% in the table above) reduce our tax expense. These differences are reported in higher (lower) effective rates on income subject to taxation in foreign jurisdictions. The benefit reported in 2017 included higher income in jurisdictions with low statutory income tax rates compared to 2016, as well as losses in jurisdictions with high statutory income tax rates.
Tax exempt investment income includes tax rate differences related to various types of investment income that is taxed at rates lower than our statutory income tax rate, such as dividend income, capital gains arising in Canada, and various others. Fluctuations in foreign exchange rates, changes in market values of real estate properties and other investments have an impact on the amount of these tax rate differences.
U.S. tax reform legislation was signed into law on December 22, 2017 and took effect on January 1, 2018. The legislation includes a reduction to the corporate tax rate from 35% to 21% for tax years beginning after 2017, and a one-time tax on the deemed repatriation of foreign earnings. Tax rate and other legislative changes in 2017 includes a benefit relating to the revaluation of our deferred tax balances of $53 and a one-time deemed repatriation charge of $46. In 2016, Tax rate and other legislative changes includes a re-measurement of our deferred tax balances in the U.K. due to a decrease in the corporate income tax rate.
Adjustments in respect of prior periods, including the resolution of tax disputes relates primarily to tax audit adjustments and the finalization of tax filings in Canada and the U.S. in both 2017 and 2016.
Other in 2017 includes a charge of $26 relating to withholding taxes on distributions from our foreign subsidiaries. The charge has been primarily offset by a benefit of $16 relating to investments in joint ventures in Asia ($20 in 2016), which are accounted for using the equity method.
21. Capital Management
Our capital base is structured to exceed minimum regulatory and internal capital targets and maintain strong credit and financial strength ratings while maintaining a capital efficient structure. We strive to achieve an optimal capital structure by balancing the use of debt and equity financing. Capital is managed both on a consolidated basis under principles that consider all the risks associated with the business as well as at the business group level under the principles appropriate to the jurisdiction in which each operates. We manage the capital for all of our international subsidiaries on a local statutory basis in a manner commensurate with their individual risk profiles.
The Board of Directors of SLF Inc. is responsible for the annual review and approval of the Company’s capital plan and capital risk policy. Management oversight of our capital programs and position is provided by the Company’s Executive Risk Committee, the membership of which includes senior management from the finance, actuarial, and risk management functions.
Notes to Consolidated Financial Statements Sun Life Financial Inc. Annual Report 2017 151

We engage in a capital planning process annually in which capital deployment options, fundraising, and dividend recommendations are presented to the Risk & Conduct Review Committee of the Board of Directors. Capital reviews are regularly conducted which consider the potential impacts under various business, interest rate, and equity market scenarios. Relevant components of these capital reviews, including dividend recommendations, are presented to the Risk & Conduct Review Committee on a quarterly basis. The Board of Directors is responsible for the approval of the dividend recommendations.
The capital risk policy is designed to ensure that adequate capital is maintained to provide the flexibility necessary to take advantage of growth opportunities, to support the risks associated with our businesses and to optimize return to our shareholders. This policy is also intended to provide an appropriate level of risk management over capital adequacy risk, which is defined as the risk that capital is not or will not be sufficient to withstand adverse economic conditions, to maintain financial strength or to allow us and our subsidiaries to support ongoing operations and to take advantage of opportunities for expansion. SLF Inc. manages its capital in a manner commensurate with its risk profile and control environment.
Regulated insurance holding companies and non-operating life companies were subject to the MCCSR capital rules which had been established by OSFI and which were in force at December 31, 2017. SLF Inc.’s consolidated capital position was above its internal target and exceeded levels that would require regulatory or corrective action as at December 31, 2017 and December 31, 2016.
Effective January 1, 2018, OSFI has implemented a revised regulatory capital framework referred to as the Life Insurance Capital Adequacy Test (“LICAT”) in Canada. OSFI’s objective is to develop a new capital framework that results in improved overall quality of available capital, greater risk sensitivity, better measurement of certain risks and closer alignment of risk measures with the economics of the life insurance business. LICAT is not expected to significantly change the level of excess capital in the industry, however capital requirements by company may change. Results as measured under LICAT are fundamentally different than under MCCSR and will not be directly comparable to MCCSR. The LICAT Guideline sets a Supervisory Target Total Ratio of 100% and a minimum Total Ratio of 90%. The Company will establish capital targets in excess of the Supervisory Target Total Ratio.
The Company’s regulated subsidiaries must comply with the capital adequacy requirements imposed in the jurisdictions in which they operate. In certain jurisdictions, the payment of dividends from our subsidiaries is subject to maintaining capital levels exceeding regulatory targets and/or receiving regulatory approval. We maintained capital levels above minimum local requirements as at December 31, 2017 and December 31, 2016.
At December 31, 2017, our principal operating life insurance subsidiary in Canada, Sun Life Assurance, is also subject to the MCCSR capital rules. With an MCCSR ratio of 221% as at December 31, 2017, Sun Life Assurance’s capital ratio is well above OSFI’s supervisory target ratio of 150% and regulatory minimum ratio of 120%, and our internal target of 200%. SLA will also be subject to the implementation of LICAT on the same timeframe. In the U.S., Sun Life Assurance operates through a branch which is subject to U.S. regulatory supervision and it exceeded the levels under which regulatory action would be required as at December 31, 2017 and December 31, 2016. In the U.S., we use captive reinsurance arrangements to provide efficient financing of U.S. statutory reserve requirements in excess of those required under IFRS. Under one such arrangement, the funding of these reserve requirements is supported by a guarantee from SLF Inc.
Our capital base consists mainly of common shareholders’ equity, participating policyholders’ equity, preferred shareholders’ equity and certain other capital securities that qualify as regulatory capital. For regulatory reporting purposes under the MCCSR framework, there were further adjustments, including goodwill, non-life investments, and others as was prescribed by OSFI, to the total capital figure presented in the table below:
As at December 31, 2017 2016
Subordinated debt $ 3,437 $ 3,836
Innovative capital instruments(1) 699 698
Equity:
Participating policyholders’ equity 650 412
Preferred shareholders’ equity 2,257 2,257
Common shareholders’ equity 20,064 19,699
Total capital(2) $ 27,107 $ 26,902
(1) Innovative capital instruments are SLEECS issued by the SL Capital Trusts (Note 13). The SL Capital Trusts are not consolidated by us. (2) Unrealized gains (losses) on available-for-sale debt securities and cash flow hedges of $132 as at December 31, 2017 ($76 as at December 31, 2016) have been included in
the calculation of Total capital.
The significant changes in capital are included in Notes 13, 14, and 15.
22. Segregated Funds
We have segregated fund products, including variable annuities, unit-linked products and universal life insurance policies, in Canada, the U.S., the U.K., and Asia. Under these contracts, the benefit amount is contractually linked to the fair value of the investments in the particular segregated fund. Policyholders can select from a variety of categories of segregated fund investments. Although the underlying assets are registered in our name and the segregated fund contract holder has no direct access to the specific assets, the contractual arrangements are such that the segregated fund policyholder bears the risk and rewards of the funds’ investment performance. Therefore, net realized gains and losses, other net investment income earned, and expenses incurred on the segregated funds are attributable to policyholders and not to us. However, certain contracts include guarantees from us. We are exposed to equity market risk and interest rate risk as a result of these guarantees. Further details on these guarantees and our risk management activities related to these guarantees are included in the Risk Management section of the MD&A.
We derive fee income from segregated funds. Market value movements in the investments held for segregated fund holders impact the management fees earned on these funds.
152 Sun Life Financial Inc. Annual Report 2017 Notes to Consolidated Financial Statements

The segregated fund types offered, by percentage of total investments for account of segregated fund holders, were within the following ranges as at December 31, 2017 and 2016:
Type of fund %
Money market 1 to 5
Fixed income 10 to 15
Balanced 40 to 45
Equity 40 to 45
Money market funds include investments that have a term to maturity of less than one year. Fixed income funds are funds that invest primarily in investment grade fixed income securities and where less than 25% can be invested in diversified equities or high-yield bonds. Balanced funds are a combination of fixed income securities with a larger equity component. The fixed income component is greater than 25% of the portfolio. Equity consists primarily of broad-based diversified funds that invest in a well-diversified mix of Canadian, U.S. or global equities. Other funds in this category include low volatility funds, intermediate volatility funds, and high volatility funds.
22.A Investments for Account of Segregated Fund Holders The carrying value of investments held for segregated fund holders are as follows:
As at December 31, 2017 2016
Segregated and mutual fund units $ 91,637 $ 83,625
Equity securities 10,799 9,739
Debt securities 3,517 3,247
Cash, cash equivalents and short-term securities 457 460
Investment properties 374 373
Mortgages 20 28
Other assets 147 120
Total assets $ 106,951 $ 97,592
Less: Liabilities arising from investing activities $ 559 $ 425
Total investments for account of segregated fund holders $ 106,392 $ 97,167
22.B Changes in Insurance Contracts and Investment Contracts for Account of Segregated Fund Holders Changes in insurance contracts and investment contracts for account of segregated fund holders are as follows:
Insurance contracts Investment contracts
For the years ended December 31, 2017 2016 2017 2016
Balance as at January 1 $ 90,388 $ 83,670 $ 6,779 $ 7,770
Additions to segregated funds:
Deposits
Net transfer (to) from general funds
Net realized and unrealized gains (losses)
Other investment income
10,772 (119) 4,141 4,853
11,454
(307)
2,799
3,753
86 –
883 152
96
–
741
162
Total additions $ 19,647 $ 17,699 $ 1,121 $ 999
Deductions from segregated funds:
Payments to policyholders and their beneficiaries
Management fees
Taxes and other expenses
Foreign exchange rate movements
9,439 963 267 245
8,689
810
257
1,403
643 57 12 (83)
582
60
15
1,333
Total deductions $ 10,914 $ 11,159 $ 629 $ 1,990
Net additions (deductions)
Acquisitions
$ $
8,733 –
$
$
6,540
178
$ $
492 –
$
$
(991)
–
Balance as at December 31 $ 99,121 $ 90,388 $ 7,271 $ 6,779
Notes to Consolidated Financial Statements Sun Life Financial Inc. Annual Report 2017 153

23. Commitments, Guarantees and Contingencies
23.A Lease Commitments We lease offices and certain equipment. These are operating leases with rents charged to operations in the year to which they relate. Total future rental payments for the remainder of these leases total $923. The future rental payments by year of payment are included in the MD&A as described in Note 6.
23.B Contractual Commitments In the normal course of business, various contractual commitments are outstanding, which are not reflected in our Consolidated Financial Statements. In addition to loan commitments for debt securities and mortgages included in Note 6.A.i, we have equity, investment property, and property and equipment commitments. As at December 31, 2017, we had a total of $2,933 of contractual commitments outstanding. The expected maturities of these commitments are included in the MD&A as described in Note 6.
23.C Letters of Credit We issue commercial letters of credit in the normal course of business. As at December 31, 2017, we had credit facilities of $835 available for the issuance of letters of credit ($860 as at December 31, 2016), from which a total of $203 in letters of credit were outstanding ($221 as at December 31, 2016).
23.D Indemnities and Guarantees In the normal course of our business, we have entered into agreements that include indemnities in favour of third parties, such as confidentiality agreements, engagement letters with advisors and consultants, outsourcing agreements, leasing contracts, trade-mark licensing agreements, underwriting and agency agreements, information technology agreements, distribution agreements, financing agreements, the sale of equity interests, and service agreements. These agreements may require us to compensate the counterparties for damages, losses or costs incurred by the counterparties as a result of breaches in representation, changes in regulations (including tax matters), or as a result of litigation claims or statutory sanctions that may be suffered by the counterparty as a consequence of the transaction. We have also agreed to indemnify our directors and certain of our officers and employees in accordance with our by-laws. These indemnification provisions will vary based upon the nature and terms of the agreements. In many cases, these indemnification provisions do not contain limits on our liability, and the occurrence of contingent events that will trigger payment under these indemnities is difficult to predict. As a result, we cannot estimate our potential liability under these indemnities. We believe that the likelihood of conditions arising that would trigger these indemnities is remote and, historically, we have not made any significant payment under such indemnification provisions. In certain cases, we have recourse against third parties with respect to the aforesaid indemnities, and we also maintain insurance policies that may provide coverage against certain of these claims.
In the normal course of our business, we have entered into purchase and sale agreements that include indemnities in favour of third parties. These agreements may require us to compensate the counterparties for damages, losses, or costs incurred by the counterparties as a result of breaches in representation. As at December 31, 2017, we are not aware of any breaches in representations that would result in any payment required under these indemnities that would have a material impact on our Consolidated Financial Statements.
Guarantees made by us that can be quantified are included in Note 6.A.i.
23.E Guarantees of Sun Life Assurance Preferred Shares and Subordinated Debentures SLF Inc. has provided a guarantee on the $150 of 6.30% subordinated debentures due 2028 issued by Sun Life Assurance. Claims under this guarantee will rank equally with all other subordinated indebtedness of SLF Inc. SLF Inc. has also provided a subordinated guarantee of the preferred shares issued by Sun Life Assurance from time to time, other than such preferred shares which are held by SLF Inc. and its affiliates. Sun Life Assurance has no outstanding preferred shares subject to the guarantee. As a result of these guarantees, Sun Life Assurance is entitled to rely on exemptive relief from most continuous disclosure and the certification requirements of Canadian securities laws.
The following tables set forth certain consolidating summary financial information for SLF Inc. and Sun Life Assurance (consolidated):
Other Sun Life subsidiaries
SLF Inc. Assurance of SLF Inc. Consolidation SLF Inc. Results for the years ended (unconsolidated) (consolidated) (combined) adjustment (consolidated)
December 31, 2017 Revenue $ 441 $ 23,421 $ 7,022 $ (1,550) $ 29,334 Shareholders’ net income (loss) $ 2,242 $ 1,577 $ 427 $ (2,004) $ 2,242
December 31, 2016
Revenue $ 749 $ 22,895 $ 6,736 $ (1,807) $ 28,573
Shareholders’ net income (loss) $ 2,581 $ 1,702 $ 342 $ (2,044) $ 2,581
154 Sun Life Financial Inc. Annual Report 2017 Notes to Consolidated Financial Statements

Other Sun Life subsidiaries
SLF Inc. Assurance of SLF Inc. Consolidation SLF Inc. Assets and liabilities as at (unconsolidated) (consolidated) (combined) adjustment (consolidated)
December 31, 2017 Invested assets $ 23,382 $ 138,145 $ 6,531 $ (21,919) $ 146,139 Total other general fund assets $ 7,530 $ 21,437 $ 17,152 $ (29,538) $ 16,581 Investments for account of segregated
fund holders $ – $ 106,341 $ 51 $ – $ 106,392 Insurance contract liabilities $ – $ 118,003 $ 8,234 $ (8,452) $ 117,785 Investment contract liabilities $ – $ 3,082 $ – $ – $ 3,082 Total other general fund liabilities $ 8,591 $ 21,558 $ 12,822 $ (24,089) $ 18,882
December 31, 2016
Invested assets $ 23,351 $ 134,624 $ 6,308 $ (21,933) $ 142,350
Total other general fund assets $ 10,097 $ 24,154 $ 19,157 $ (34,687) $ 18,721
Investments for account of segregated fund holders $ – $ 97,118 $ 49 $ – $ 97,167
Insurance contract liabilities $ – $ 115,370 $ 7,523 $ (7,836) $ 115,057
Investment contract liabilities $ – $ 2,913 $ – $ – $ 2,913
Total other general fund liabilities $ 11,492 $ 23,805 $ 15,111 $ (29,675) $ 20,733
23.F Legal and Regulatory Proceedings We are regularly involved in legal actions, both as a defendant and as a plaintiff. Legal actions naming us as a defendant ordinarily involve our activities as a provider of insurance protection and wealth management products, as an investor and investment advisor, and as an employer. In addition, government and regulatory bodies in Canada, the U.S., the U.K., and Asia, including federal, provincial, and state securities and insurance regulators and government authorities, from time to time, make inquiries and require the production of information or conduct examinations or investigations concerning our compliance with insurance, securities, and other laws.
Provisions for legal proceedings related to insurance contracts, such as for disability and life insurance claims and the cost of litigation, are included in Insurance contract liabilities in our Consolidated Statements of Financial Position. Other provisions are established outside of the Insurance contract liabilities if, in the opinion of management, it is both probable that a payment will be required and a reliable estimate can be made of the amount of the obligation. Management reviews the status of all proceedings on an ongoing basis and exercises judgment in resolving them in such manner as management believes to be in our best interest.
Two putative class action lawsuits have been filed against Sun Life Assurance in connection with sales practices relating to, and the administration of, individual policies issued by the Metropolitan Life Insurance Company (“MLIC”). These policies were assumed by Clarica when Clarica acquired the bulk of MLIC’s Canadian operations in 1998 and subsequently assumed by Sun Life Assurance as a result of its amalgamation with Clarica. One of the lawsuits (Fehr et al v Sun Life Assurance Company of Canada) is issued in Ontario and the other (Alamwala v Sun Life Assurance Company of Canada) is in British Columbia. Neither action has been certified at this time. In the Fehr action, the court dismissed the plaintiff’s motion for certification in its entirety by way of a two-part decision released on November 12, 2015 and December 7, 2016. The plaintiffs have appealed the decision against certification and a decision from the Ontario Court of Appeal is expected in 2018. The Alamwala action has remained largely dormant since it was commenced in 2011. We will continue to vigorously defend against the claims in these actions. In connection with the acquisition of the Canadian operations of MLIC, MLIC agreed to indemnify Clarica for certain losses, including those incurred relating to the sales of its policies. Should either of the Fehr or the Alamwala lawsuits result in a loss, Sun Life Assurance will seek recourse against MLIC under that indemnity through arbitration.
Management does not believe that the probable conclusion of any current legal or regulatory matter, either individually or in the aggregate, will have a material adverse effect on the Consolidated Statements of Financial Position or results of operations of the Company.
24. Related Party Transactions
SLF Inc. and its subsidiaries, joint ventures and associates transact business worldwide. All transactions between SLF Inc. and its subsidiaries have been eliminated on consolidation. Transactions with joint ventures and associates, which are also related parties, are disclosed in Note 16. Transactions between the Company and related parties are executed and priced on an arm’s-length basis in a manner similar to transactions with third parties.
Notes to Consolidated Financial Statements Sun Life Financial Inc. Annual Report 2017 155

24.A Transactions with Key Management Personnel, Remuneration and Other Compensation Key management personnel refers to the executive team and Board of Directors of SLF Inc. These individuals have the authority and responsibility for planning, directing, and controlling the activities of the Company. The aggregate compensation to the executive team and directors are as follows:
For the years ended December 31, 2017 2016
Executive Executive team Directors team Directors
Number of individuals
Base salary and annual incentive compensation
Additional short-term benefits and other
Share-based long-term incentive compensation
Value of pension and post-retirement benefits
$
$ $
$
11 18 1
18 3
$ $ $ $
10 – 1 2 –
$
$
$
$
10
17
–
16
2
$
$
$
$
11
–
1
2
–
24.B Other Related Party Transactions We provide investment management services for our pension plans. The services are provided on substantially the same terms as for comparable transactions with third parties. We also hold units of investment funds managed by certain of our joint ventures. The carrying amount of our investment in these funds is included in Note 16.D.
25. Pension Plans and Other Post-Retirement Benefits
We sponsor defined benefit pension plans and defined contribution plans for eligible employees. All of our material defined benefit plans worldwide are closed to new entrants with new hires participating in defined contribution plans. Material defined benefit plans are located in Canada, the U.S., and the U.K. The defined benefit pension plans offer benefits based on length of service and final average earnings and certain plans offer some indexation of benefits. The specific features of these plans vary in accordance with the employee group and countries in which employees are located. In addition, we maintain supplementary non-contributory defined benefit pension arrangements for eligible employees, which are primarily for benefits which are in excess of local tax limits. As at December 31, 2014, there are no active members in the U.K. and the U.S. defined benefit plans continuing to accrue future service benefits. On January 1, 2009, the Canadian defined benefit plans were closed to new employees. Canadian employees hired before January 1, 2009 continue to earn future service benefits in the previous plans, which includes both defined benefit and defined contribution components, while new hires since then are eligible to join a defined contribution plan. In addition, one small defined benefit plan in the Philippines remains open to new hires.
Our funding policy for defined benefit pension plans is to make at least the minimum annual contributions required by regulations in the countries in which the plans are offered. Our U.K. defined benefit pension scheme is governed by pension trustees. In other countries in which we operate, the defined benefit pension arrangements are governed by local pension committees. Significant plan changes require the approval of the Board of Directors of the sponsoring subsidiary of SLF Inc.
We also established defined contribution plans for eligible employees. Our contributions to these defined contribution pension plans may be subject to certain vesting requirements. Generally, our contributions are a set percentage of employees’ annual income and may be a set percentage of employee contributions, up to specified levels.
In addition to our pension plans, in Canada and the U.S., we provide certain post-retirement health care and life insurance benefits to eligible employees and to their dependants upon meeting certain requirements. Eligible retirees may be required to pay a portion of the premiums for these benefits and, in general, deductible amounts and co-insurance percentages apply to benefit payments. These post-retirement benefits are not pre-funded. In Canada, certain post-retirement health care and life insurance benefits are provided for eligible employees who retired before December 31, 2015. Eligible employees in Canada who retire after December 31, 2015 will have access to voluntary retiree-paid health care coverage. In the U.S., certain post-retirement health care and life insurance benefits are provided to eligible retirees. In 2015, changes in the U.S. retiree benefits program were announced; employees who are not age 50 with 10 years of service as of December 31, 2015 will only have access to subsidized retiree health care coverage until eligible for Medicare, and starting in April 2016, eligible existing and future retirees and covered dependents eligible for Medicare will receive an annual contribution to a health reimbursement account to be applied against individual coverage and other eligible expenses.
25.A Risks Associated with Employee Defined Benefit Plans With the closure of the material defined benefit pension and retiree benefit plans to new entrants, the volatility associated with future service accruals for active members has been limited and will decline over time.
The major risks remaining in relation to past service obligations are increases in liabilities due to a decline in discount rates, greater life expectancy than assumed and adverse asset returns. We have systematically shifted the defined benefit pension asset mix towards liability matching investments. The target for our material funded defined benefit plans is to minimize volatility in funded status arising from changes in discount rates and exposure to equity markets.
156 Sun Life Financial Inc. Annual Report 2017 Notes to Consolidated Financial Statements

25.B Defined Benefit Pension and Other Post-Retirement Benefit Plans The following tables set forth the status of the defined benefit pension and other post-retirement benefit plans:
2017 2016
Other post- Other post-Pension retirement Total Pension retirement Total
Change in defined benefit obligations:
Defined benefit obligation, January 1 $ 3,545 $ 262 $ 3,807 $ 3,440 $ 276 $ 3,716
Current service cost 47 3 50 43 3 46
Interest cost 122 10 132 130 11 141
Actuarial losses (gains) 209 9 218 288 (14) 274
Benefits paid (159) (11) (170) (164) (12) (176)
Settlement losses (gains)(1) (86) – (86) – – –
Plan amendments (2) – (2) – – –
Foreign exchange rate movement (15) (5) (20) (192) (2) (194)
Defined benefit obligation, December 31 $ 3,661 $ 268 $ 3,929 $ 3,545 $ 262 $ 3,807
Change in plan assets:
Fair value of plan assets, January 1 $ 3,243 $ – $ 3,243 $ 3,193 $ – $ 3,193
Administrative expense – – – (1) – (1)
Interest income on plan assets 110 – 110 119 – 119
Return on plan assets (excluding amounts included in net interest expense) 116 – 116 168 – 168
Employer contributions 80 11 91 129 12 141
Benefits paid (159) (11) (170) (164) (12) (176)
Settlement losses (gains)(1) (80) – (80) – – –
Foreign exchange rate movement (9) – (9) (201) – (201)
Fair value of plan assets, December 31 $ 3,301 $ – $ 3,301 $ 3,243 $ – $ 3,243
Amounts recognized on Statement of Financial Position:
Fair value of plan assets $ 3,301 $ – $ 3,301 $ 3,243 $ – $ 3,243
Defined benefit (obligation) (3,661) (268) (3,929) (3,545) (262) (3,807)
Net recognized (liability) asset, December 31 $ (360) $ (268) $ (628) $ (302) $ (262) $ (564)
Components of net benefit expense recognized:
Current service cost $ 47 $ 3 $ 50 $ 43 $ 3 $ 46
Administrative expense – – – 1 – 1
Net interest expense (income) 12 10 22 11 11 22
Settlement losses (gains)(1) (6) – (6) – – –
Plan amendments (2) – (2) – – –
Other long-term employee benefit losses (gains) – 4 4 – (3) (3)
Net benefit expense $ 51 $ 17 $ 68 $ 55 $ 11 $ 66
Remeasurement of net recognized (liability) asset:
Return on plan assets (excluding amounts included in net interest expense) $ 116 $ – $ 116 $ 168 $ – $ 168
Actuarial gains (losses) arising from changes in demographic assumptions 2 1 3 – – –
Actuarial gains (losses) arising from changes in financial assumptions (161) (11) (172) (251) (9) (260)
Actuarial gains (losses) arising from experience adjustments (50) 5 (45) (37) 20 (17)
Foreign exchange rate movement 6 1 7 2 2 4
Components of defined benefit costs recognized in Other comprehensive income (loss) $ (87) $ (4) $ (91) $ (118) $ 13 $ (105)
(1) In 2017, the Company terminated and completely settled the defined benefit pension plan of a U.S. subsidiary within the SLF Asset Management segment.
Notes to Consolidated Financial Statements Sun Life Financial Inc. Annual Report 2017 157
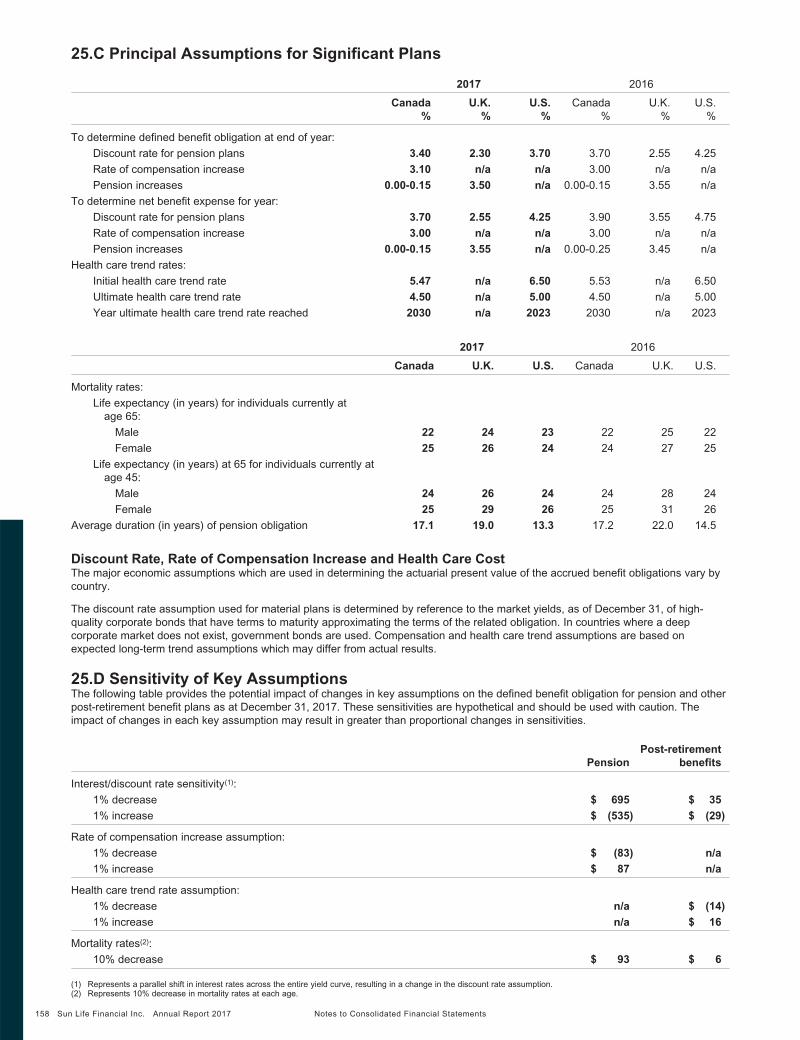
25.C Principal Assumptions for Significant Plans
2017 2016
Canada U.K. U.S. Canada U.K. U.S. % % % % % %
To determine defined benefit obligation at end of year:
Discount rate for pension plans 3.40 2.30 3.70 3.70 2.55 4.25
Rate of compensation increase 3.10 n/a n/a 3.00 n/a n/a
Pension increases 0.00-0.15 3.50 n/a 0.00-0.15 3.55 n/a
To determine net benefit expense for year:
Discount rate for pension plans 3.70 2.55 4.25 3.90 3.55 4.75
Rate of compensation increase 3.00 n/a n/a 3.00 n/a n/a
Pension increases 0.00-0.15 3.55 n/a 0.00-0.25 3.45 n/a
Health care trend rates:
Initial health care trend rate 5.47 n/a 6.50 5.53 n/a 6.50
Ultimate health care trend rate 4.50 n/a 5.00 4.50 n/a 5.00
Year ultimate health care trend rate reached 2030 n/a 2023 2030 n/a 2023
2017 2016
Canada U.K. U.S. Canada U.K. U.S.
Mortality rates:
Life expectancy (in years) for individuals currently at age 65:
Male 22 24 23 22 25 22
Female 25 26 24 24 27 25
Life expectancy (in years) at 65 for individuals currently at age 45:
Male 24 26 24 24 28 24
Female 25 29 26 25 31 26
Average duration (in years) of pension obligation 17.1 19.0 13.3 17.2 22.0 14.5
Discount Rate, Rate of Compensation Increase and Health Care Cost The major economic assumptions which are used in determining the actuarial present value of the accrued benefit obligations vary by country.
The discount rate assumption used for material plans is determined by reference to the market yields, as of December 31, of high-quality corporate bonds that have terms to maturity approximating the terms of the related obligation. In countries where a deep corporate market does not exist, government bonds are used. Compensation and health care trend assumptions are based on expected long-term trend assumptions which may differ from actual results.
25.D Sensitivity of Key Assumptions The following table provides the potential impact of changes in key assumptions on the defined benefit obligation for pension and other post-retirement benefit plans as at December 31, 2017. These sensitivities are hypothetical and should be used with caution. The impact of changes in each key assumption may result in greater than proportional changes in sensitivities.
Post-retirement Pension benefits
Interest/discount rate sensitivity(1):
1% decrease
1% increase
Rate of compensation increase assumption:
1% decrease
1% increase
Health care trend rate assumption:
1% decrease
1% increase
Mortality rates(2):
10% decrease
$ $
$ $
$
695 (535)
(83) 87
n/a n/a
93
$ $
$ $
$
35 (29)
n/a n/a
(14) 16
6
158
(1) Represents a parallel shift in interest rates across the entire yield curve, resulting in a change in the discount rate assumption. (2) Represents 10% decrease in mortality rates at each age.
Sun Life Financial Inc. Annual Report 2017 Notes to Consolidated Financial Statements

25.E Fair Value of Plan Assets Composition of fair value of plan assets, December 31:
2017 2016
Equity investments 3% 3%
Fixed income investments 86% 86%
Real estate investments 7% 6%
Other 4% 5%
Total composition of fair value of plan assets 100% 100%
The fair value of our equity investments in 2017 and 2016 are consistent with Level 1 or Level 2 fair value hierarchy. In 2017, 2% of our fixed income investments (3% in 2016) are determined based on valuation techniques consistent with Level 1 of the fair value hierarchy.
The assets of the defined benefit pension plans are primarily held in trust for plan members, and are managed within the provisions of each plan’s investment policies and procedures. Diversification of the investments is used to limit credit, market, and foreign currency risks. We have taken steps to significantly de-risk our material defined benefit pension plans by shifting the pension asset mix towards liability matching investments, taking into account the long-term nature of the pension obligations and related cash flows. The long-term investment objectives of the defined benefit pension plans are to equal or exceed the rate of growth of the liabilities. Over shorter periods, the objective of the defined benefit pension plan investment strategy is to minimize volatility in the funded status. Liquidity is managed with consideration to the cash flow requirements of the liabilities.
25.F Future Cash Flows The following tables set forth the expected contributions and expected future benefit payments of the defined benefit pension and other post-retirement benefit plans:
Pension Post-retirement Total
Expected contributions for the next 12 months $ 119 $ 15 $ 134
Expected Future Benefit Payments
Pension
Post-retirement
Total
2018
$ 149
15
$ 164
2019
$ 153
15
$ 168
2020
$ 161
16
$ 177
2021
$ 165
16
$ 181
2022
$ 177
17
$ 194
2023 to 2027
$ 967
91
$ 1,058
25.G Defined Contribution Plans We expensed $109 in 2017 ($106 for 2016) with respect to defined contribution plans.
26. Earnings (Loss) Per Share
Details of the calculation of the net income (loss) and the weighted average number of shares used in the earnings per share computations are as follows:
For the years ended December 31, 2017 2016
Common shareholders’ net income (loss) for basic earnings per share $ 2,149 $ 2,485
Add: increase in income due to convertible instruments(1) 10 10
Common shareholders’ net income (loss) on a diluted basis $ 2,159 $ 2,495
Weighted average number of common shares outstanding for basic earnings per share (in millions) 613 613 Add: dilutive impact of stock options(2) (in millions) 1 1
Add: dilutive impact of convertible instruments(1) (in millions) 4 5
Weighted average number of common shares outstanding on a diluted basis (in millions) 618 619
Basic earnings (loss) per share $ 3.51 $ 4.05 Diluted earnings (loss) per share $ 3.49 $ 4.03
(1) The convertible instruments are the SLEECS B issued by Sun Life Capital Trust. (2) Excludes the impact of 1 million stock options for the year ended December 31, 2016 because these stock options were antidilutive for the period.
Notes to Consolidated Financial Statements Sun Life Financial Inc. Annual Report 2017 159

27. Accumulated Other Comprehensive Income (Loss) and Non-Controlling Interests
27.A Accumulated Other Comprehensive Income (Loss) Changes in accumulated other comprehensive income (loss), net of taxes, are as follows:
2017 2016
For the years ended December 31,
Balance, beginning of
period
Other comprehensive income (loss) Other
Balance, end of period
Balance, beginning of
period
Other comprehensive
income (loss)
Balance, end of period
Items that may be reclassified subsequently to income:
Unrealized foreign currency translation gains (losses), net of hedging activities $ 1,749 $ (737) $ – $ 1,012 $ 2,385 $ (636) $ 1,749
Unrealized gains (losses) on available-for-sale assets 211 135 – 346 225 (14) 211
Unrealized gains (losses) on cash flow hedges (6) (5) – (11) 3 (9) (6)
Share of other comprehensive income (loss) in joint ventures and associates – (31) – (31) 76 (76) –
Items that will not be reclassified subsequently to income:
Remeasurement of defined benefit plans (291) (69) 13(1) (347) (218) (73) (291)
Revaluation surplus on transfers to investment properties 6 139 – 145 6 – 6
Total $ 1,669 $ (568) $ 13 $ 1,114 $ 2,477 $ (808) $ 1,669
Total attributable to:
Participating policyholders
Shareholders
$ 16 1,653
$ (7) (561)
$ – 13
$ 9 1,105
$ 18
2,459
$ (2)
(806)
$ 16
1,653
Total $ 1,669 $ (568) $ 13 $ 1,114 $ 2,477 $ (808) $ 1,669
(1) During 2017, the Company transferred cumulative remeasurement losses of $13 from accumulated other comprehensive income (loss) to retained earnings as a result of the termination and complete settlement of the defined benefit pension plan of a U.S. subsidiary within the SLF Asset Management segment.
27.B Non-Controlling Interests In 2016, non-controlling interests reported in our Consolidated Statements of Operations and Consolidated Statements of Comprehensive Income (Loss) pertained to the 25% third-party interest in PVI Sun Life that was recognized when we obtained control of that entity in the first quarter of 2016. The non-controlling interests were subsequently acquired by us in the fourth quarter of 2016. As a result, we no longer have any non-controlling interests. Further details on transactions with non-controlling interests in 2016 are included in Note 3.
The following table summarizes changes to non-controlling interests during 2016:
For the year ended December 31, 2016
Balance, beginning of year
Acquisition of control in subsidiary and capital transaction
Net income (loss)
Acquisition of interest in subsidiary from non-controlling interests
$ –
19
(1)
(18)
Total non-controlling interests, end of year $ –
28. Subsequent Event
On January 30, 2018, SLF Inc. redeemed all of the outstanding $400 principal amount of Series 2008-1 Subordinated Unsecured 5.59% Fixed/Floating Debentures at a redemption price equal to the principal amount together with accrued and unpaid interest to that date.
160 Sun Life Financial Inc. Annual Report 2017 Notes to Consolidated Financial Statements

Appointed Actuary’s Report
THE SHAREHOLDERS AND DIRECTORS OF SUN LIFE FINANCIAL INC. I have valued the policy liabilities and reinsurance recoverables of Sun Life Financial Inc. and its subsidiaries for its Consolidated Statements of Financial Position at December 31, 2017 and December 31, 2016 and their change in the Consolidated Statements of Operations for the year ended December 31, 2017 in accordance with accepted actuarial practice in Canada, including selection of appropriate assumptions and methods.
In my opinion, the amount of policy liabilities net of reinsurance recoverables makes appropriate provision for all policy obligations and the Consolidated Financial Statements fairly present the results of the valuation.
Kevin Morrissey Fellow, Canadian Institute of Actuaries
Toronto, Ontario, Canada February 14, 2018
Appointed Actuary’s Report Sun Life Financial Inc. Annual Report 2017 161

Report of Independent Registered Public Accounting Firm To the Shareholders and the Board of Directors of Sun Life Financial Inc.
Opinion on the Consolidated Financial Statements We have audited the accompanying consolidated financial statements of Sun Life Financial Inc. and subsidiaries (the “Company”), which comprise the consolidated statements of financial position as at December 31, 2017 and December 31, 2016, the consolidated statements of operations, consolidated statements of comprehensive income (loss), consolidated statements of changes in equity, and consolidated statements of cash flows for each of the years in the two-year period ended December 31, 2017, and the related notes, including a summary of significant accounting policies and other explanatory information (collectively referred to as the “financial statements”).
In our opinion, the financial statements present fairly, in all material respects, the financial position of the Company as at December 31, 2017 and December 31, 2016 and its financial performance and its cash flows for each of the years in the two-year period ended December 31, 2017 in accordance with International Financial Reporting Standards as issued by the International Accounting Standards Board.
Report on Internal Control over Financial Reporting We have also audited, in accordance with the standards of the Public Company Accounting Oversight Board (United States) (PCAOB), the Company’s internal control over financial reporting as of December 31, 2017, based on criteria established in Internal Control – Integrated Framework (2013) issued by the Committee of Sponsoring Organizations of the Treadway Commission and our report dated February 14, 2018 expressed an unqualified opinion on the Company’s internal control over financial reporting.
Basis for Opinion Management’s Responsibility for the Financial Statements Management is responsible for the preparation and fair presentation of these financial statements in accordance with International Financial Reporting Standards as issued by the International Accounting Standards Board, and for such internal control as management determines is necessary to enable the preparation of financial statements that are free from material misstatement, whether due to fraud or error.
Auditor’s Responsibility Our responsibility is to express an opinion on these financial statements based on our audits. We conducted our audits in accordance with Canadian generally accepted auditing standards and the standards of the PCAOB. Those standards require that we plan and perform the audit to obtain reasonable assurance about whether the financial statements are free from material misstatement, whether due to fraud or error. Those standards also require that we comply with ethical requirements. We are a public accounting firm registered with the PCAOB and are required to be independent with respect to the Company in accordance with the U.S. federal securities laws and the applicable rules and regulations of the Securities and Exchange Commission and the PCAOB. Further, we are required to be independent of the Company in accordance with the ethical requirements that are relevant to our audit of the financial statements in Canada and to fulfill our other ethical responsibilities in accordance with these requirements.
An audit includes performing procedures to assess the risks of material misstatement of the financial statements, whether due to fraud or error, and performing procedures that respond to those risks. Such procedures include examining, on a test basis, evidence regarding the amounts and disclosures in the financial statements. The procedures selected depend on our judgment, including the assessment of the risks of material misstatement of the financial statements, whether due to fraud or error. In making those risk assessments, we consider internal control relevant to the Company’s preparation and fair presentation of the financial statements in order to design audit procedures that are appropriate in the circumstances. An audit also includes evaluating the appropriateness of accounting policies and principles used and the reasonableness of accounting estimates made by management, as well as evaluating the overall presentation of the financial statements.
We believe that the audit evidence we have obtained in our audits is sufficient and appropriate to provide a reasonable basis for our audit opinion.
Chartered Professional Accountants Licensed Public Accountants Toronto, Ontario, Canada February 14, 2018
We have served as the Company’s auditor since 1875.
162 Sun Life Financial Inc. Annual Report 2017 Report of Independent Registered Public Accounting Firm

Report of Independent Registered Public Accounting Firm To the Shareholders and the Board of Directors of Sun Life Financial Inc.
Opinion on Internal Control over Financial Reporting We have audited the internal control over financial reporting of Sun Life Financial Inc. and subsidiaries (the “Company”) as of December 31, 2017, based on criteria established in Internal Control – Integrated Framework (2013) issued by the Committee of Sponsoring Organizations of the Treadway Commission (COSO). In our opinion, the Company maintained, in all material respects, effective internal control over financial reporting as of December 31, 2017, based on criteria established in Internal Control – Integrated Framework (2013) issued by COSO.
We have also audited, in accordance with the standards of the Public Company Accounting Oversight Board (United States) (PCAOB) and Canadian generally accepted auditing standards the consolidated financial statements as of and for the year ended December 31, 2017 of the Company and our report dated February 14, 2018 expressed an unmodified / unqualified opinion on those financial statements.
Basis for Opinion The Company’s management is responsible for maintaining effective internal control over financial reporting and for its assessment of the effectiveness of internal control over financial reporting, included in the accompanying management’s Financial Reporting Responsibilities report. Our responsibility is to express an opinion on the Company’s internal control over financial reporting based on our audit. We are a public accounting firm registered with the PCAOB and are required to be independent with respect to the Company in accordance with the U.S. federal securities laws and the applicable rules and regulations of the Securities and Exchange Commission and the PCAOB.
We conducted our audit in accordance with the standards of the PCAOB. Those standards require that we plan and perform the audit to obtain reasonable assurance about whether effective internal control over financial reporting was maintained in all material respects. Our audit included obtaining an understanding of internal control over financial reporting, assessing the risk that a material weakness exists, testing and evaluating the design and operating effectiveness of internal control based on the assessed risk, and performing such other procedures as we considered necessary in the circumstances. We believe that our audit provides a reasonable basis for our opinion.
Definition and Limitations of Internal Control over Financial Reporting A company’s internal control over financial reporting is a process designed to provide reasonable assurance regarding the reliability of financial reporting and the preparation of financial statements for external purposes in accordance with International Financial Reporting Standards as issued by the International Accounting Standards Board. A company’s internal control over financial reporting includes those policies and procedures that (1) pertain to the maintenance of records that, in reasonable detail, accurately and fairly reflect the transactions and dispositions of the assets of the company; (2) provide reasonable assurance that transactions are recorded as necessary to permit preparation of financial statements in accordance with International Financial Reporting Standards as issued by the International Accounting Standards Board, and that receipts and expenditures of the company are being made only in accordance with authorizations of management and directors of the company; and (3) provide reasonable assurance regarding prevention or timely detection of unauthorized acquisition, use, or disposition of the company’s assets that could have a material effect on the financial statements.
Because of its inherent limitations, internal control over financial reporting may not prevent or detect misstatements. Also, projections of any evaluation of effectiveness to future periods are subject to the risk that controls may become inadequate because of changes in conditions, or that the degree of compliance with the policies or procedures may deteriorate.
Chartered Professional Accountants Licensed Public Accountants Toronto, Ontario, Canada February 14, 2018
Report of Independent Registered Public Accounting Firm Sun Life Financial Inc. Annual Report 2017 163

Sources of earnings
The following is provided in accordance with the OSFI guideline requiring Sources of Earnings (SOE) disclosure. SOE is a non-IFRS (International Financial Reporting Standard) financial measure. There is no standard SOE methodology. The calculation of SOE is dependent on, and sensitive to, the methodology, estimates and assumptions used.
SOE identifies various sources of IFRS net income. It provides an analysis of the difference between actual net income and expected net income based on business in-force and assumptions made at the beginning of the reporting period. The terminology used in the discussion of sources of earnings is described below:
Expected profit on inforce business The portion of the consolidated pre-tax net income on business inforce at the start of the reporting period that was expected to be realized based on the achievement of the best-estimate assumptions made at the beginning of the reporting period. Expected profit for asset management companies is set equal to their pre-tax net income.
Impact of new business The point-of-sale impact on pre-tax net income of writing new business during the reporting period. Issuing new business may produce a gain or loss at the point-of sale, primarily because valuation assumptions are different than pricing assumptions and actual acquisition expenses may differ from those assumed in pricing. For example, new business losses in individual life insurance would emerge where valuation margins and acquisition expenses are relatively high.
Experience gains and losses Pre-tax gains and losses that are due to differences between the actual experience during the reporting period and the best-estimate assumptions at the start of the reporting period.
Management actions and changes in assumptions Impact on pre-tax net income resulting from changes in actuarial methods and assumptions or other management actions.
Other Impact on pre-tax net income not addressed under the previous categories.
164 Sun Life Financial Inc. Annual Report 2017 Sources of Earnings

For the Year Ended December 31, 2017 SLF SLF Asset (in millions of Canadian dollars) Canada SLF U.S. Mgmt SLF Asia Corporate Total
Expected Profit on Inforce Business 840 547 1,256 355 (132) 2,866 Impact of New Business 133 (61) – (91) – (19) Experience Gains and Losses 97 5 – (14) 30 118 Management Actions and Changes in Assumptions 164 (566) – 15 62 (325) Other (16) (105) (150) – (76) (347)
Earnings on Operations (pre-tax) 1,218 (180) 1,106 265 (116) 2,293 Earnings on Surplus 155 111 – 140 90 496
Earnings before Income Taxes 1,373 (69) 1,106 405 (26) 2,789 Income Taxes (197) 381 (453) (51) 18 (302)
Earnings before Non-controlling Interests, Participating Policyholders’ Net Income and Preferred Share Dividends 1,176 312 653 354 (8) 2,487
Less: Non-controlling Interests – – – – – – Participating Policyholders’ Net Income 213 4 – 28 – 245 Preferred Share Dividends – – – – 93 93
Common Shareholders’ Net Income (Loss) 963 308 653 326 (101) 2,149
For the Year Ended December 31, 2016 SLF SLF Asset (in millions of Canadian dollars) Canada SLF U.S. Mgmt SLF Asia Corporate Total
Expected Profit on Inforce Business 776 514 1,133 339 (76) 2,686 Impact of New Business 61 (53) – (72) – (64) Experience Gains and Losses 274 5 – (37) 18 260 Management Actions and Changes in Assumptions 99 84 – (6) 14 191 Other (5) (84) (11) 33 (19) (86)
Earnings on Operations (pre-tax) 1,205 466 1,122 257 (63) 2,987 Earnings on Surplus 164 108 – 118 68 458
Earnings before Income Taxes 1,369 574 1,122 375 5 3,445 Income Taxes (208) (61) (393) (51) 94 (619)
Earnings before Non-controlling Interests, Participating Policyholders’ Net Income and Preferred Share Dividends 1,161 513 729 324 99 2,826
Less: Non-controlling Interests – – – (1) – (1) Participating Policyholders’ Net Income 225 5 – 16 – 246 Preferred Share Dividends – – – – 96 96
Common Shareholders’ Net Income (Loss) 936 508 729 309 3 2,485
Sources of Earnings Sun Life Financial Inc. Annual Report 2017 165

Analysis of results For the year ended December 31, 2017, the pre-tax expected profit on inforce business of $2,866 million was $180 million higher than 2016. The increase in expected profit was largely driven from growth in all businesses except Corporate, partially offset by currency impacts from the change in the Canadian dollar relative to foreign currencies.
The new business loss in 2017 was $19 million compared to a loss of $64 million a year ago. The change was mainly due to sales level, and individual insurance product design changes in SLF Canada.
The 2017 experience gain of $118 million pre-tax was primarily due to favourable mortality and morbidity experience in the SLF U.S. Group Benefits business, improved mortality experience in SLF Canada and SLF U.K., improved expense experience, offset partially by lower level of gains from investing activity on insurance contract liabilities. The unfavourable impact from changes in interest rates during the year was largely offset by favourable equity markets and fair value changes on real estate.
For the year 2017, management actions and changes in assumptions resulted in a pre-tax loss of $325 million. In Canada, the pre-tax gain of $164 million reflected a reduction to the provision for investment risk in the SLF Canada participating account, favourable changes to investment, mortality and morbidity assumptions, offset partially by a refinement to the allocation of expenses, updated lapse assumptions and updates to promulgated ultimate reinvestment rates. In the U.S., the pre-tax loss of $566 million reflected changes as a result of the U.S. Tax Reform, recapture of certain reinsurance treaties, updates to the expected cost of reinsurance in certain other treaties and lower lapse rates on lapse supported business, offset partially by the resolution of tax uncertainties in a U.S. subsidiary and favourable mortality. In Corporate, the pre-tax gain of $62 million reflected favourable mortality improvement in SLF U.K.
Other in 2017 resulted in a pre-tax loss of $347 million. In the U.S., the loss of $105 million was due to the impact of integration costs related to the U.S. employee benefits business acquired in 2016. In SLF Asset Management, the loss of $150 million was related to fair value adjustments on MFS’s share-based payment awards. In Corporate, the loss of $76 million was primarily due to the restructuring charge related to actions to enhance business processes and organizational structures and capabilities.
Net pre-tax earnings on surplus of $496 million in 2017 was $38 million higher than a year ago. The increase was largely due to higher real estate appraisal gains.
The 2016 Sources of earnings has been changed to conform with the current year presentation which reflects the removal of operating income from the 2017 presentation. In addition, expected profit on inforce business and impact of new business reflect a change in presentation for SLF U.S. employee benefits business. Amounts in expected profit on inforce business and impact of new business in 2016 was previously $615 million and $(154) million for SLF U.S., and $2,787 million and $(165) million for the Total Company, respectively, with a net change of $101 million between the two categories.
166 Sun Life Financial Inc. Annual Report 2017 Sources of Earnings

Board of Directors and Executive Team
Board of Directors
All directors of Sun Life Financial Inc. are also directors of Sun Life Assurance Company of Canada. The Board has determined that all directors other than Dean A. Connor are independent directors.
William D. Anderson, FCPA, FCA M. Marianne Harris(3)(4) Réal Raymond, FICB(1)(2)
Chairman, Sun Life Financial Inc. Corporate Director Chairman, Metro Inc.
Dean A. Connor Sara Grootwassink Lewis, CPA, CFA(1)(2) Hugh D. Segal, OC, OONT(1)(2)
President & Chief Executive Officer, Corporate Director Principal of Massey College, Sun Life Financial Inc. Chief Executive Officer, University of Toronto
Lewis Corporate Advisors
Stephanie L. Coyles(1)(4) Barbara G. Stymiest, FCPA, FCA(1)(4)
Corporate Director Christopher J. McCormick(2)(3) Corporate Director Corporate Director
Martin J. G. Glynn(3)(4)
Corporate Director Scott F. Powers(2)(3) Corporate Director
(1) Member of Audit Committee (2) Member of Governance, Nomination & Investment Committee (3) Member of Management Resources Committee (4) Member of Risk & Conduct Review Committee
Additional information on the directors and a report on the Board’s corporate governance processes and practices are available in the 2018 Management Information Circular, on sunlife.com and on www.sedar.com.
Executive Team
Dean A. Connor Linda M. Dougherty Melissa J. Kennedy President & Chief Executive Officer Executive Vice-President, Executive Vice-President,
Corporate Strategy & Chief Legal Officer & Public Affairs
Claude A. Accum Global Marketing
President, SLF Asia Stephen C. Peacher Daniel R. Fishbein President, Sun Life
Carolyn D. Blair President, SLF U.S. Investment Management
Executive Vice-President, Chief Human Resources & Colm J. Freyne Mark S. Saunders Communications Officer Executive Vice-President & Executive Vice-President &
Chief Risk Officer Chief Information Officer
Kevin P. Dougherty Executive Vice-President, Jacques Goulet Kevin D. Strain Innovation & Partnerships President, SLF Canada Executive Vice-President &
Chief Financial Officer
As of March 1, 2018
Board of Directors and Executive Team Sun Life Financial Inc. Annual Report 2017 167

Sun Life Financial Inc. – Subsidiaries and Associates
The following table lists the direct and indirect subsidiaries of Sun Life Financial Inc. (“SLF Inc.”) as at December 31, 2017 and provides the book values (in millions of Canadian dollars, based on the equity method) of the shares of those subsidiaries that are principal operating subsidiaries. The table also lists significant joint venture entities in which SLF Inc. directly or indirectly holds 50% or less of the issued and outstanding voting securities. Subsidiaries which are inactive or which have been set up for the sole purpose of holding investments are not listed in the table.
Per cent of Voting Shares
Jurisdiction Book Value Owned by Company of Formation of Shares Owned SLF Inc.
Sun Life Assurance Company of Canada Canada 19,360 100%
Annemasse Boisbriand Holdings L.P. Manitoba, Canada 100%
BestServe Financial Limited Hong Kong 139 100%
Country Lane Enterprises Ltd. British Columbia, Canada 100%
Dental Health Alliance, LLC Delaware, USA 100%
Denticare of Alabama, Inc. Alabama, USA 100%
PT. Sun Life Financial Indonesia Indonesia 167 100%
PT. Sun Life Indonesia Services Indonesia 100%
SL Investment US-RE Holdings 2009-1, Inc. Delaware, USA 100%
SLF of Canada UK Limited England and Wales 100%
Sun Life Assurance Company of Canada (U.K.) Limited England and Wales 919 100%
Barnwood Properties Limited England and Wales 100%
Sun Life of Canada UK Holdings Limited England and Wales 100%
Laurtrust Limited England and Wales 100%
SLFC Services Company (UK) Limited England and Wales 100%
Sun 521 Morehead, LLC Delaware, USA 100%
Sun Life (India) AMC Investments Inc. Canada 100%
Aditya Birla Sun Life AMC Limited India 49%
Sun Life (India) Distribution Investments Inc. Canada 100%
Sun Life (Luxembourg) Finance No. 2 Sàrl Luxembourg 100%
Sun Life and Health Insurance Company (U.S.) Michigan, USA 499 100%
Sun Life Capital Trust Ontario, Canada 100%
Sun Life Capital Trust II Ontario, Canada 100%
Sun Life Everbright Life Insurance Company Limited Tianjin, People’s Republic of China 24.99%
Sun Life Financial (India) Insurance Investments Inc. Canada 100%
Aditya Birla Sun Life Insurance Company Limited India 49%
Sun Life Financial Advisory Inc. Canada 100%
Sun Life Financial Asia Services Limited Hong Kong 100%
Sun Life Financial Distributors (Bermuda) Ltd. Bermuda 100%
Sun Life Financial Distributors (Canada) Inc. Canada 10 100%
Sun Life Financial International Holdings (MC), LLC Delaware, USA 100%
Sun Life Financial Investment Services (Canada) Inc. Canada 15 100%
Sun Life Financial Investments (Bermuda) Ltd. Bermuda 100%
Sun Life Financial of Canada (U.K.) Overseas Investments Limited England and Wales 100%
Sun Life of Canada (Netherlands) B.V. Netherlands 100%
Sun Life Financial Philippine Holding Company, Inc. Philippines 100%
Sun Life Grepa Financial, Inc. Philippines 49%
Sun Life of Canada (Philippines), Inc. Philippines 985 100%
Sun Life Asset Management Company, Inc. Philippines 100%
Sun Life Financial Plans, Inc. Philippines 100%
Sun Life Financial Trust Inc. Canada 131 100%
Sun Life Hong Kong Limited Bermuda 1,748 100%
Sun Life Asset Management (HK) Limited Hong Kong 100%
Sun Life Financial Holdings (HK) Limited Hong Kong 100%
Sun Life Hong Kong Services Limited Hong Kong 100%
Sun Life Investment Holdings (HK) Limited Hong Kong 100%
Sun Life Management Holdings (HK) Limited Hong Kong 100%
Sun Life Pension Trust Limited Hong Kong 100%
Sun Life Trustee Company Limited Hong Kong 100%
Sun Life India Service Centre Private Limited India 100%
Sun Life Information Services Canada, Inc. Canada 100%
Sun Life Information Services Ireland Limited Republic of Ireland 100%
168 Sun Life Financial Inc. Annual Report 2017 Subsidiaries and Associates

Per cent of Voting Shares
Jurisdiction Book Value Owned by Company of Formation of Shares Owned SLF Inc.
Sun Life Insurance (Canada) Limited Canada 1,879 100%
SLI General Partner Limited Canada 100%
SLI Investments LP Manitoba, Canada 100%
6425411 Canada Inc. Canada 100%
Sun Life Investments LLC Delaware, USA 100%
Sun Life Malaysia Assurance Berhad Malaysia 49%
Sun Life Malaysia Takaful Berhad Malaysia 49%
Sun Life Vietnam Insurance Company Limited Vietnam 106 100%
Sun MetroNorth, LLC Delaware, USA 100%
Solidify Software, LLC Kansas, USA 100%
UDC Dental California, Inc. California, USA 100%
UDC Ohio, Inc. Ohio, USA 100%
Union Security DentalCare of Georgia, Inc. Georgia, USA 100%
Union Security DentalCare of New Jersey, Inc. New Jersey, USA 100%
United Dental Care of Arizona, Inc. Arizona, USA 100%
United Dental Care of Colorado, Inc. Colorado, USA 100%
United Dental Care of Michigan, Inc. Michigan, USA 100%
United Dental Care of Missouri, Inc. Missouri, USA 100%
United Dental Care of New Mexico, Inc. New Mexico, USA 100%
United Dental Care of Texas, Inc. Texas, USA 100%
United Dental Care of Utah, Inc. Utah, USA 100%
6965083 Canada Inc. Canada 100%
7037457 Canada Inc. Canada 100%
7647913 Canada Inc. Canada 100%
7647930 Canada Inc. Canada 100%
Sun Life Global Investments Inc. Canada 100%
BK Canada Holdings Inc. Canada 100%
Bentall Kennedy (Canada) G.P. Ltd. Canada 100%
Bentall Kennedy (Canada) Limited Partnership British Columbia, Canada 229 100%
0936543 BC Ltd. British Columbia, Canada 100%
Bentall Kennedy Luxembourg Holdings Ltd. Canada 100%
Bentall Property Services (Ontario) Ltd. Ontario, Canada 100%
BK Prime GP Holdco Inc. Canada 100%
BKC Capital Inc. Canada 100%
BKCB Services Ltd. Canada 100%
BKCG Services Ltd. Canada 100%
BKCP Residential G.P. LTD. Canada 100%
BKCP Residential Limited Partnership Manitoba, Canada 100%
BKCP Retail G.P. LTD. Canada 100%
BKCP Retail Limited Partnership Manitoba, Canada 100%
BKCP SS G.P. LTD. Canada 100%
BKCP SS Limited Partnership Manitoba, Canada 100%
SynchroSERV Inc. Canada 100%
SynchroSERV Limited Partnership British Columbia, Canada 100%
Sun Life 2007-1 Financing Corp. Canada 100%
Sun Life (Luxembourg) Finance No. 1 Sàrl Luxembourg 100%
Sun Life Assurance Company of Canada - U.S. Operations Holdings, Inc. Delaware, USA 100%
SL Investment 2007-1 ULC Nova Scotia, Canada 100%
Sun Life Financial (Japan), Inc. Delaware, USA 100%
Sun Life Financial (U.S.) Holdings, Inc. Delaware, USA 100%
Sun Life Financial (U.S.) Finance, Inc. Delaware, USA 100%
Sun Life Financial (U.S.) Investments LLC Delaware, USA 100%
Prime Advisors, Inc. Washington, USA 71 100%
Ryan Labs Asset Management Inc. Delaware, USA 45 100%
Ryan Labs Fund Management, LLC Delaware, USA 100%
Ryan Labs TIPS Partners, L.P. Delaware, USA 100%
Sun Life Institutional Distributors (U.S.) LLC Delaware, USA 1 100%
Subsidiaries and Associates Sun Life Financial Inc. Annual Report 2017 169

Per cent of Voting Shares
Jurisdiction Book Value Owned by Company of Formation of Shares Owned SLF Inc.
Sun Life Investment Management U.S., Inc. Delaware, USA 100%
Bentall Kennedy (U.S.) G.P. LLC Washington, USA 100%
Bentall Kennedy (U.S.) Limited Partnership Washington, USA 310 100%
Bentall Kennedy Holdings LLC Delaware, USA 100%
Rushmore Partners LLC Delaware, USA 100%
NewTower Trust Company Maryland, USA 100%
NewTower Management GP LLC Delaware, USA 100%
NewTower Management LLC Delaware, USA 100%
BKUS Institutional Logistics Coinvestment LLC California, USA 100%
Kennedy Management Investors LLC Delaware, USA 100%
Sun Life of Canada (U.S.) Financial Services Holdings, Inc. Delaware, USA 99.91%
Massachusetts Financial Services Company Delaware, USA 467 94.65%
MFS Bermuda Holdings Ltd. Bermuda 94.65%
MFS Development Funds, LLC Delaware, USA 94.65%
MFS Exchange LLC Delaware, USA 94.65%
MFS Fund Distributors, Inc. Delaware, USA 94.65%
MFS Heritage Trust Company New Hampshire, USA 94.65%
MFS Institutional Advisors, Inc. Delaware, USA 94.65%
3060097 Nova Scotia Company Nova Scotia, Canada 94.65%
MFS Investment Management Canada Limited Canada 94.65%
MFS International Ltd. Bermuda 94.65%
MFS do Brasil Desenvolvimento de Mercado Ltda. Brazil 94.65%
MFS International (Chile) SpA Chile 94.65%
MFS International (Hong Kong) Limited Hong Kong 94.65%
MFS International Holdings Pty Ltd Sydney, Australia 94.65%
MFS Financial Management Consulting (Shanghai) Shanghai, People’s Co., Ltd. Republic of China 94.65%
MFS International (U.K.) Limited England and Wales 94.65%
MFS International Switzerland GmbH Switzerland 94.65%
MFS International Australia Pty Ltd Victoria, Australia 94.65%
MFS International Singapore Pte. Ltd. Singapore 94.65%
MFS Investment Management Company (LUX) S.à.r.l. Luxembourg 94.65%
MFS Investment Management K.K. Japan 94.65%
MFS Service Center, Inc. Delaware, USA 94.65%
Sun Life of Canada (U.S.) Holdings, Inc. Delaware, USA 100%
Disability Reinsurance Management Services, Inc. Delaware, USA 100%
Independence Life and Annuity Company Delaware, USA 390 100%
Sun Life Financial (U.S.) Reinsurance Company II Delaware, USA 100%
Professional Insurance Company Texas, USA 86 100%
Sun Canada Financial Co. Delaware, USA 100%
Sun Life Administrators (U.S.), Inc. Delaware, USA 100%
Sun Life Financial (U.S.) Delaware Finance, LLC Delaware, USA 100%
Sun Life Financial (U.S.) Reinsurance Company Vermont, USA 100%
Sun Life Financial (U.S.) Services Company, Inc. Delaware, USA 100%
The Premier Dental Group, Inc. Minnesota, USA 100%
Landmark Dental Alliance, Inc. Minnesota, USA 100%
Vuzion, Inc. Minnesota, USA 100%
Sun Life Financial Distributors, Inc. Delaware, USA 100%
Sun Life Institutional Investments (U.S.) LLC Delaware, USA 100%
Sun Life Global Investments (Canada) Inc. Canada 111 100%
Sun Life Institutional Investments (Canada) Inc. Canada 10 100%
SL Finance 2007-1, Inc. Delaware, USA 100%
Sun Life Assurance Company of Canada (Barbados) Limited Barbados 100%
Sun Life Financial (Bermuda) Reinsurance Ltd. Bermuda 100%
Sun Life of Canada International Assurance Limited Barbados 100%
10458465 Canada Inc. Canada 100%
10458481 Canada Inc. Canada 100%
6324983 Canada Inc. Canada 100%
170 Sun Life Financial Inc. Annual Report 2017 Subsidiaries and Associates

Major Offices
The following is contact information for Sun Life Financial’s major offices and affiliates around the world. For inquiries and customer service, please contact the appropriate office in your area.
Sun Life Financial Inc. Corporate Office 1 York Street Toronto, Ontario Canada M5J 0B6 Website: sunlife.com
Sun Life Financial Canada Canadian Headquarters 227 King Street South Waterloo, Ontario Canada N2J 4C5 Tel: 519-888-2290 Clients: 1-877-SUN-LIFE / 1-877-786-5433 Website: sunlife.ca
Montreal Office 1155 Metcalfe Street Montreal, Quebec Canada H3B 2V9 Tel: 514-866-6411 Website: sunlife.ca
Sun Life Financial U.S. One Sun Life Executive Park Wellesley Hills, Massachusetts USA 02481 Clients: 1-800-SUN-LIFE / 1-800-786-5433 Website: sunlife.com/us
Sun Life Financial International Washington House, 3rd Floor 16 Church Street Hamilton HM 11 Bermuda Tel: 441-294-6050 / 1-800-368-9428 Website: sunlife.com/international
Sun Life Financial U.K. Matrix House Basing View, Basingstoke Hampshire United Kingdom RG21 4DZ Clients: 0345-072-0223 Website: sloc.co.uk
Sun Life Financial Asia Sun Life Financial Asia Regional Office Level 14, Citiplaza 3 14 Taikoo Wan Road Taikoo Shing, Hong Kong Tel: (852) 2918-3888
China Sun Life Everbright Life Insurance Company Limited Tianjin International Building, 37th Floor 75 Nanjing Road Tianjin, China 300050 Tel: (8622) 2339-1188 Website: sunlife-everbright.com
Sun Life Assurance Company of Canada Beijing Representative Office Tel: (8610) 8590-6500
Hong Kong Sun Life Hong Kong Limited 10/F, Sun Life Tower The Gateway 15 Canton Road Kowloon, Hong Kong Tel: (852) 2103-8888 Clients: (852) 2103-8928 Website: sunlife.com.hk
India Birla Sun Life Insurance Company Limited One India Bulls Centre, Tower 1 16th Floor Jupiter Mill Compound 841, Senapati Bapat Marg Elphinstone Road Mumbai, India 400 013 Tel: 1-800-270-7000 in India 91-22-6691-7777 outside India Website: birlasunlife.com
Birla Sun Life Asset Management Company Limited One India Bulls Centre, Tower 1 17th Floor Jupiter Mill Compound 841, Senapati Bapat Marg Elphinstone Road Mumbai, India 400 013 Tel: 91-22-4356-8000 Website: birlasunlife.com
Sun Life Assurance Company of Canada India Representative Office Mumbai Tel: 91-22-4356-9121
Indonesia PT Sun Life Financial Indonesia Menara Sun Life Lantai 11 JI Dr Ide Anak Agung Gde Agung Blok 6.3 Kawasan Mega Kuningan Jakarta, Selatan 12950 Indonesia Tel: (6221) 5289-0000 Clients: (6221) 1500-786 Website: sunlife.co.id
Malaysia Sun Life Malaysia Assurance Berhad Sun Life Malaysia Takaful Berhad Level 11, 338 Jalan Tuanku Abdul Rahman 50100 Kuala Lumpur Malaysia Tel: (603) 2612-3600 Website: sunlifemalaysia.com
Philippines Sun Life Financial Philippines Sun Life Centre 5th Avenue cor. Rizal Drive Bonifacio Global City Taguig, Metro Manila Philippines Clients: (632) 555-8888 Website: sunlife.com.ph
Sun Life Grepa Financial, Inc. 6/F Grepalife Building 221 Sen. Gil J. Puyat Avenue Makati City 1203 Philippines Tel: (632) 866-6800, 849-9633 Website: sunlifegrepa.com
Vietnam Sun Life Vietnam Insurance Company Limited Vietcombank Tower, 29th Floor 5 Me Linh Square, District 1 Ho Chi Minh City, Vietnam Tel: (848) 6298-5888 Website: sunlife.com.vn
MFS Investment Management 111 Huntington Avenue Boston, Massachusetts USA 02199 Tel: 617-954-5000 Toll-free in Canada and U.S.: 1-800-343-2829 Website: mfs.com
Sun Life Global Investments (Canada) Inc. 225 King Street West Toronto, Ontario Canada M5V 3C5 Tel: 1-877-344-1434 Website: sunlifeglobalinvestments.com
Sun Life Investment Management Sun Life Institutional Investments (Canada) Inc. 1 York Street, Suite 1100 Toronto, Ontario Canada M5J 0B6 Email: [email protected] Website: sunlifeinvestmentmanagement.com
Bentall Kennedy 1 York Street, Suite 1100 Toronto, Ontario Canada M5J 0B6 Tel: 416-681-3400 Website: bentallkennedy.com
Prime Advisors, Inc. Redmond Ridge Corporate Center 22635 NE Marketplace Drive, Suite 160 Redmond, Washington USA 98053 Tel: 425-202-2000 Website: primeadvisors.com
Ryan Labs Asset Management Inc. 500 Fifth Avenue, Suite 2520 New York, New York USA 10110 Tel: 212-635-2300 Website: ryanlabs.com
Major Offices Sun Life Financial Inc. Annual Report 2017 171

CORPORATE AND SHAREHOLDER INFORMATION
CORPORATE OFFICE Sun Life Financial Inc. 1 York Street Toronto, Ontario Canada M5J 0B6 Tel: 416-979-9966 Website: www.sunlife.com
INVESTOR RELATIONS For financial analysts, portfolio managers and institutional investors requiring information, please contact: Investor Relations Fax: 416-979-4080 E-mail: [email protected] Please note that financial information can also be obtained from www.sunlife.com.
TRANSFER AGENT For information about your shareholdings, dividends, change in share registration or address, estate transfers, lost certificates, or to advise of duplicate mailings, please contact the Transfer Agent in the country where you reside. If you do not live in any of the countries listed, please contact the Canadian Transfer Agent.
CANADA AST Trust Company (Canada) P.O. Box 700 Station B Montreal, Quebec Canada H3B 3K3 Within North America: Tel: 1-877-224-1760 Outside of North America: Tel: 416-682-3865 Fax: 1-888-249-6189 E-mail: [email protected] Website: www.astfinancial.com/ca-en Shareholders can view their account details using AST Trust Company (Canada)’s Internet service, Investor Central. Register at https://ca.astfinancial.com/ InvestorCentral
UNITED STATES American Stock Transfer & Trust Company, LLC 6201 15th Ave. Brooklyn, NY 11219 Tel: 1-877-224-1760 E-mail: [email protected]
UNITED KINGDOM Link Asset Services 34 Beckenham Road Beckenham, Kent United Kingdom BR3 4TU Tel: +44 (0) 345-602-1587 E-mail: [email protected]
PHILIPPINES Rizal Commercial Banking Corporation (RCBC) RCBC Stock Transfer Processing Section Ground Floor, West Wing, GPL (Grepalife) Building, 221 Senator Gil Puyat Avenue Makati City, Philippines From Metro Manila: 632-318-8567 From the Provinces: 1-800-1-888-2422 E-mail: [email protected]
HONG KONG Computershare Hong Kong Investor Services Limited 17M Floor, Hopewell Centre 183 Queen’s Road East Wanchai, Hong Kong Tel: 852-2862-8555 E-mail: [email protected]
SHAREHOLDER SERVICES For shareholder account inquiries, please contact the Transfer Agent in the country where you reside, or Shareholder Services: Fax: 416-598-3121 English E-mail: [email protected] French E-mail: [email protected]
2018 DIVIDEND DATES Common Shares RECORD DATES PAYMENT DATES March 1, 2018 March 29, 2018 May 30, 2018* June 29, 2018*
August 29, 2018* September 28, 2018*
November 28, 2018* December 31, 2018*
*Subject to approval by the Board of Directors
DIRECT DEPOSIT OF DIVIDENDS Common shareholders residing in Canada or the U.S. may have their dividend payments deposited directly into their bank account.
The Request for Electronic Payment of Dividends Form is available for downloading from the AST Trust Company (Canada) website, www.astfinancial.com/ca-en, or you can contact AST Trust Company (Canada) to have a form sent to you.
CANADIAN DIVIDEND REINVESTMENT AND SHARE PURCHASE PLAN Canadian-resident common shareholders can enroll in the Dividend Reinvestment and Share Purchase Plan. For details visit our website at sunlife.com or contact the Plan Agent, AST Trust Company (Canada) at [email protected].
STOCK EXCHANGE LISTINGS Sun Life Financial Inc. common shares are listed on the Toronto (TSX), New York (NYSE) and Philippine (PSE) stock exchanges. Ticker Symbol: SLF
Sun Life Financial Inc. Class A Preferred Shares are listed on the Toronto Stock Exchange (TSX).
Ticker Symbols:
Series 1 – SLF.PR.A Series 8R – SLF.PR.G Series 2 – SLF.PR.B Series 9QR – SLF.PR.J
Series 5 – SLF.PR.E Series 12R – SLF.PR.I
2018 ANNUAL MEETING The Annual Meeting will be held on: Date: Wednesday, May 9, 2018 Time: 9:00 a.m. Place: Sun Life Financial Inc. 1 York Street 35th Floor Toronto, Ontario Canada M5J 0B6
FOR INFORMATION ABOUT THE SUN LIFE FINANCIAL GROUP OF COMPANIES, CORPORATE NEWS AND FINANCIAL RESULTS, PLEASE VISIT SUNLIFE.COM.
H.PR.Series 10R – SLF C.PR .Series 3 – SLF K.PR.es 11QR – SLF D Ser i .PR.es 4 – SLF Ser i
This report is printed on FSC® certified paper. The fibre used in the manufacture of the paper stock comes from well managed forests, controlled sources and recycled wood fibre.
The greenhouse gas emissions associated with the production, distribution and paper lifecycle of this report have been calculated and offset by Carbonzero.
2017 Sun Life Financial Inc. | Annual Report 173

Life's brighter under the sun
1 YORK STREET TORONTO, ON CANADA M5J 0B6
sunlife.com
MOST SUSTAINABLE CORPORATIONS IN THE WORLD
Being a sustainable company is essential to our overall business success. Learn more at sunlife.com/sustainability