Embed Size (px)
Citation preview
SEMI-ANNUAL REPORT 2019
S U N A M E R I C A
Income Funds
Beginning on January 1, 2021, as permitted by regulations adopted by the Securities and ExchangeCommission, paper copies of each Fund’s shareholder reports will no longer be sent by mail, unless youspecifically request paper copies of the reports from the Fund or your financial intermediary. Instead, thereports will be made available on a website, and you will be notified by mail each time a report is posted andprovided with a website link to access the report.
If you already elected to receive shareholder reports electronically, you will not be affected by this changeand you need not take any action. At any time, you may elect to receive reports and other communicationsfrom a Fund electronically by calling 800-858-8850 or contacting your financial intermediary directly.
You may elect to receive all future reports in paper free of charge. If your account is held directly at theFund, you can inform the Fund that you wish to receive paper copies of reports by calling 800-858-8850. Ifyour account is held through a financial intermediary, please contact the financial intermediary to make thiselection. Your election to receive paper will apply to all AIG Funds in which you are invested and may applyto all funds held with your financial intermediary.
aig.com/funds
Table of Contents
SHAREHOLDER LETTER . . . . . . . . . . . . . . . . . . . . . . . . . . . . . . . . . . . . . . . . . . . . . . . . 2
EXPENSE EXAMPLE . . . . . . . . . . . . . . . . . . . . . . . . . . . . . . . . . . . . . . . . . . . . . . . . . . 4
STATEMENTS OF ASSETS AND LIABILITIES . . . . . . . . . . . . . . . . . . . . . . . . . . . . . . 6
STATEMENTS OF OPERATIONS . . . . . . . . . . . . . . . . . . . . . . . . . . . . . . . . . . . . . . . . 8
STATEMENTS OF CHANGES IN NET ASSETS . . . . . . . . . . . . . . . . . . . . . . . . . . . . . 9
FINANCIAL HIGHLIGHTS . . . . . . . . . . . . . . . . . . . . . . . . . . . . . . . . . . . . . . . . . . . . .10
PORTFOLIO OF INVESTMENTS . . . . . . . . . . . . . . . . . . . . . . . . . . . . . . . . . . . . . . . .13
NOTES TO FINANCIAL STATEMENTS . . . . . . . . . . . . . . . . . . . . . . . . . . . . . . . . . . .71
APPROVAL OF ADVISORY AGREEMENTS . . . . . . . . . . . . . . . . . . . . . . . . . . . . . .87
SUPPLEMENT TO THE PROSPECTUS . . . . . . . . . . . . . . . . . . . . . . . . . . . . . . . . . . . .91
Shareholder Letter— (unaudited)
Dear Shareholders,
We are pleased to present this semi-annual update for the SunAmerica Income Funds (the “Income Funds”) for the six-month period
ended September 30, 2019. From a broad perspective, it was a period wherein fixed income market performance was primarily
influenced by a global economic slowdown, dovish† pivots by most central banks, persistent trade tensions and geopolitics. For the
semi-annual period overall, the Bloomberg Barclays U.S. Aggregate Bond Index,†† a broad measure of the U.S. fixed income market,
returned 5.42%.
In the second quarter of 2019, when the semi-annual period began, global fixed income sectors generated strong returns. Global
government bond yields in most developed and emerging markets countries declined and bond prices rose following a turn to more
dovish monetary policies by most central banks in response to below-target inflation and slowing economic growth. The U.S. Federal
Reserve (the “Fed”) left interest rates unchanged but set the stage for potential rate cuts later in 2019, indicating it saw additional risks
to its outlook from trade policy and manufacturing, among other factors. The European Central Bank (ECB) signaled the potential for
a new round of quantitative easing alongside rate cuts later in 2019. The Bank of Japan committed to low rates at least through the
spring of 2020. The People’s Bank of China added liquidity into its banking system through its lending facility and intervened in
foreign exchange markets to support its currency amid the trade war with the U.S. Most non-government bond sectors also posted
positive returns during the second calendar quarter but lagged the especially strong performance of U.S. Treasury securities and other
sovereign bonds. The exceptions were investment grade corporate bonds and emerging markets debt, which performed particularly
well as a combination of low global interest rates along with still strong credit measures led investors to reach for yield.
Global government bond yields declined further across most markets following the injection of monetary stimulus by the Fed, ECB
and several other central banks during the third quarter of 2019. The Fed cut interest rates in July and September 2019 for the first
time since 2008, in an effort to extend the U.S. economic expansion amid a slowdown in economic growth and trade uncertainty. The
ECB unveiled a sweeping, long-term economic stimulus package to bolster the Eurozone economy against slowing growth and trade
frictions. At its October meeting, the Bank of Japan opted to not change its interest rates but suggested possible interest rate cuts in the
future, reflecting its fears that global risks could weigh on Japan’s economic growth. The announcement came just hours after the U.S.
Fed cut its targeted federal funds rate for the third time in less than four months. Key policymakers of the Bank of England indicated
more accommodative monetary policy may be necessary to counter Brexit††† uncertainty. The People’s Bank of China cut its reserve
requirement ratio* in line with its strategy of targeted and modest easing. Overall, political uncertainty remained heightened, although
the fixed income markets appeared to shrug off Brexit turmoil in the U.K. and a formal impeachment inquiry into the U.S. President.
Corporate bonds also continued to perform strongly on optimism that monetary accommodation could offset the drag on global
economic growth from restrictive trade policies. Among other non-government bond sectors, performance was mixed, as escalating
U.S.-China trade tensions and political developments in Argentina resulted in increased investor risk aversion.
For the semi-annual period overall, the U.S. Treasury yield curve flattened,** as yields on intermediate- and longer-term maturities fell
more than those on shorter-term maturities. The yield on the bellwether 10-year U.S. Treasury fell approximately 73 basis points*** to
end the semi-annual period at 1.68%. Notably, for much of the semi-annual period, the U.S. Treasury yield curve experienced a partial
inversion. More specifically, the differential between the yields on three-month and 10-year U.S. Treasury securities had inverted
toward the end of March 2019 for the first time since mid-2007, meaning three-month yields were higher than those of 10-year U.S.
Treasury securities, and remained that way through the end of the semi-annual period. An inverted yield curve has historically
preceded most economic recessions. Still, many believed at the end of the semi-annual period that a recession was unlikely,
anticipating the Fed and other central banks would ease monetary policy to reduce recessionary risks. Non-U.S. Treasury sector
performance was mixed for the semi-annual period overall. Investment grade corporate bonds outperformed U.S. Treasuries most,
followed by sovereign emerging markets debt. Other non-government bond sectors posted solid positive returns but lagged U.S.
Treasury securities.
2
On the following pages, you will find financial statements and portfolio information for each of the Income Funds during the semi-
annual period ended September 30, 2019.
Thank you for being a part of AIG Funds. We value your ongoing confidence in us and look forward to serving your investment needs
in the future. As always, if you have any questions regarding your investments, please contact your financial advisor or get in touch us
directly at 800-858-8850 or via our website, www.aig.com/funds.
Sincerely,
The SunAmerica Income Funds Investment Professionals
Tim Pettee Robert Vanden Assem David AlbrychtTimothy Campion Dana Burns Frank OssinoElizabeth Mauro Anders Faergemann Eric Hess
John Yovanovic William Eastwood
Past performance is no guarantee of future results.
† Dovish policy tends to suggest lower interest rates; opposite of hawkish.†† The Bloomberg Barclays U.S. Aggregate Bond Index represents securities that are SEC-registered, taxable and dollar denominated. The index
covers the U.S. investment-grade fixed-rate bond market, with index components for government and corporate securities, mortgage pass-through securities and asset-backed securities. Indices are not managed and an investor cannot invest directly in an index.
††† Brexit refers to the U.K.’s path out of the European Union.* Reserve requirement ratio is the portion of reservable liabilities commercial banks must hold onto rather than lend out or invest.** A flattening yield curve is one wherein the differential in yields between longer-term and shorter-term maturities narrows.*** A basis point is 1/100th of a percentage point.
3
SunAmerica Income FundsEXPENSE EXAMPLE — September 30, 2019 — (unaudited)
Disclosure of Portfolio Expenses in Shareholder Reports
As a shareholder of a fund (each, a “Fund” and collectively the “Funds”) in the SunAmerica Income Funds (the “Trust”), you mayincur two types of costs: (1) transaction costs, including sales charges (loads) on purchase payments, contingent deferred sales chargesand (2) ongoing costs, including management fees, distribution and service fees and other Fund expenses. The example set forthbelow is intended to help you understand your ongoing costs (in dollars) of investing in the Funds and to compare these costs with theongoing costs of investing in other mutual funds. The Example is based on an investment of $1,000 invested at April 1, 2019 and helduntil September 30, 2019.
Actual Expenses
The “Actual” section of the table provides information about actual account values and actual expenses. You may use the informationin these columns, together with the amount you invested, to estimate the expenses that you paid over the period. Simply divide youraccount value by $1,000 (for example, an $8,600 account value divided by $1,000 = 8.6), then multiply the result by the number in thecolumn under the heading entitled “Expenses Paid During the Six Months Ended September 30, 2019” to estimate the expenses youpaid on your account during this period. The “Expenses Paid During the Six Months Ended September 30, 2019” column and the“Annualized Expense Ratio” column do not include small account fees that may be charged if your account balance is below $500($250 for retirement plan accounts). In addition, the “Expenses Paid During the Six Months Ended September 30, 2019” column andthe “Annualized Expense Ratio” column do not include administrative fees that may apply to qualified retirement plan accounts. Seethe Funds’ prospectuses, your retirement plan document and/or materials from your financial adviser for a full description of thesefees. Had these fees been included, the “Expenses Paid During the Six Months Ended September 30, 2019” column would have beenhigher and the “Ending Account Value” column would have been lower.
Hypothetical Example for Comparison Purposes
The “Hypothetical” section of the table provides information about hypothetical account values and hypothetical expenses based oneach Fund’s actual expense ratio and an annual rate of return of 5% before expenses, which is not the Fund’s actual return. Thehypothetical account values and expenses may not be used to estimate the actual ending account balance or expenses you paid for theperiod. You may use this information to compare the ongoing costs of investing in the Funds and other funds. To do so, compare this5% hypothetical example with the 5% hypothetical examples that appear in the shareholder reports of other funds. The “ExpensesPaid During the Six Months Ended September 30, 2019” column and the “Annualized Expense Ratio” column do not include smallaccount fees that may be charged if your account balance is below $500 ($250 for retirement plan accounts). In addition, the“Expenses Paid During the Six Months Ended September 30, 2019” column and the “Annualized Expense Ratio” column do notinclude administrative fees that may apply to qualified retirement plan accounts and accounts held through financial institutions. Seethe Funds’ prospectuses, your retirement plan document and/or materials from your financial adviser for a full description of thesefees. Had these fees been included, the “Expenses Paid During the Six Months Ended September 30, 2019” column would have beenhigher and the “Ending Account Value” column would have been lower.
Please note that the expenses shown in the table are meant to highlight your ongoing costs only and do not reflect any transactioncosts, including sales charges on purchase payments, contingent deferred sales charges, small account fees and administrative fees, ifapplicable to your account. Please refer to the Funds’ prospectus, your retirement plan document and/or material from your financialadviser, for more information. Therefore, the “Hypothetical” example is useful in comparing ongoing costs only, and will not helpyou determine the relative total costs of owning different funds. In addition, if these transaction costs and other fees were included,your costs would have been higher.
4
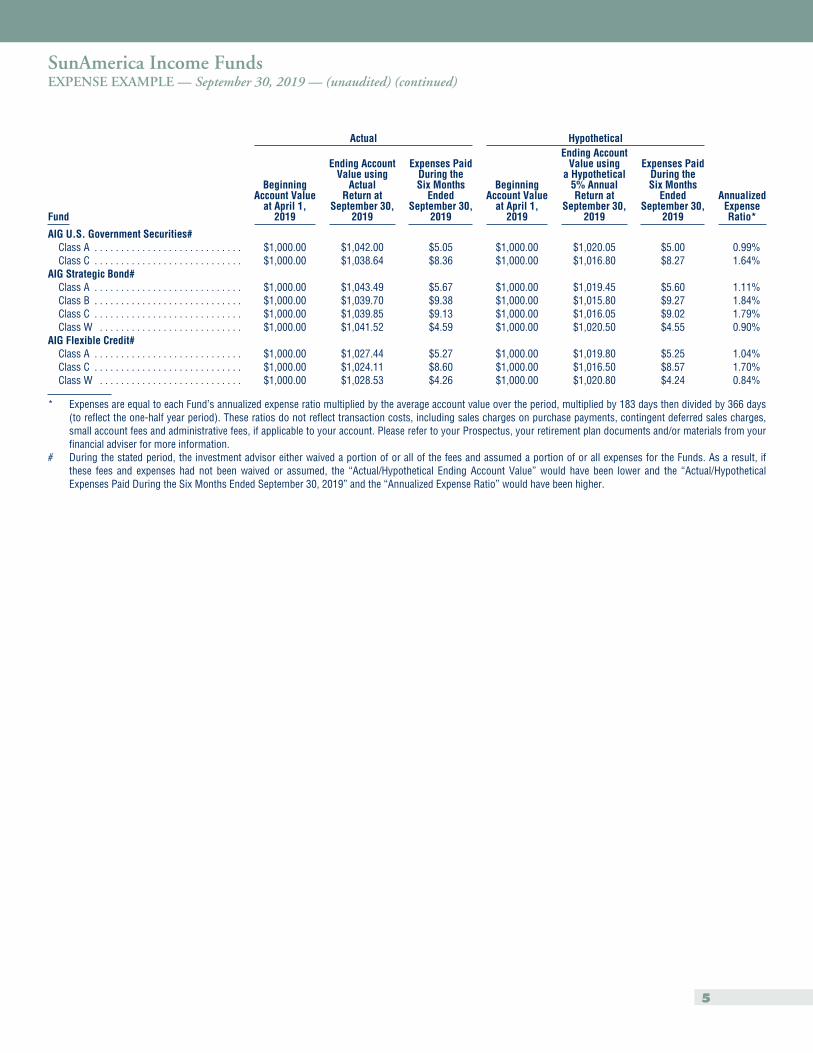
SunAmerica Income FundsEXPENSE EXAMPLE — September 30, 2019 — (unaudited) (continued)
Actual Hypothetical
Fund
BeginningAccount Value
at April 1,2019
Ending AccountValue using
ActualReturn at
September 30,2019
Expenses PaidDuring theSix Months
EndedSeptember 30,
2019
BeginningAccount Value
at April 1,2019
Ending AccountValue using
a Hypothetical5% AnnualReturn at
September 30,2019
Expenses PaidDuring theSix Months
EndedSeptember 30,
2019
AnnualizedExpenseRatio*
AIG U.S. Government Securities#Class A . . . . . . . . . . . . . . . . . . . . . . . . . . . . $1,000.00 $1,042.00 $5.05 $1,000.00 $1,020.05 $5.00 0.99%Class C . . . . . . . . . . . . . . . . . . . . . . . . . . . . $1,000.00 $1,038.64 $8.36 $1,000.00 $1,016.80 $8.27 1.64%
AIG Strategic Bond#Class A . . . . . . . . . . . . . . . . . . . . . . . . . . . . $1,000.00 $1,043.49 $5.67 $1,000.00 $1,019.45 $5.60 1.11%Class B . . . . . . . . . . . . . . . . . . . . . . . . . . . . $1,000.00 $1,039.70 $9.38 $1,000.00 $1,015.80 $9.27 1.84%Class C . . . . . . . . . . . . . . . . . . . . . . . . . . . . $1,000.00 $1,039.85 $9.13 $1,000.00 $1,016.05 $9.02 1.79%Class W . . . . . . . . . . . . . . . . . . . . . . . . . . . $1,000.00 $1,041.52 $4.59 $1,000.00 $1,020.50 $4.55 0.90%
AIG Flexible Credit#Class A . . . . . . . . . . . . . . . . . . . . . . . . . . . . $1,000.00 $1,027.44 $5.27 $1,000.00 $1,019.80 $5.25 1.04%Class C . . . . . . . . . . . . . . . . . . . . . . . . . . . . $1,000.00 $1,024.11 $8.60 $1,000.00 $1,016.50 $8.57 1.70%Class W . . . . . . . . . . . . . . . . . . . . . . . . . . . $1,000.00 $1,028.53 $4.26 $1,000.00 $1,020.80 $4.24 0.84%
* Expenses are equal to each Fund’s annualized expense ratio multiplied by the average account value over the period, multiplied by 183 days then divided by 366 days(to reflect the one-half year period). These ratios do not reflect transaction costs, including sales charges on purchase payments, contingent deferred sales charges,small account fees and administrative fees, if applicable to your account. Please refer to your Prospectus, your retirement plan documents and/or materials from yourfinancial adviser for more information.
# During the stated period, the investment advisor either waived a portion of or all of the fees and assumed a portion of or all expenses for the Funds. As a result, ifthese fees and expenses had not been waived or assumed, the “Actual/Hypothetical Ending Account Value” would have been lower and the “Actual/HypotheticalExpenses Paid During the Six Months Ended September 30, 2019” and the “Annualized Expense Ratio” would have been higher.
5
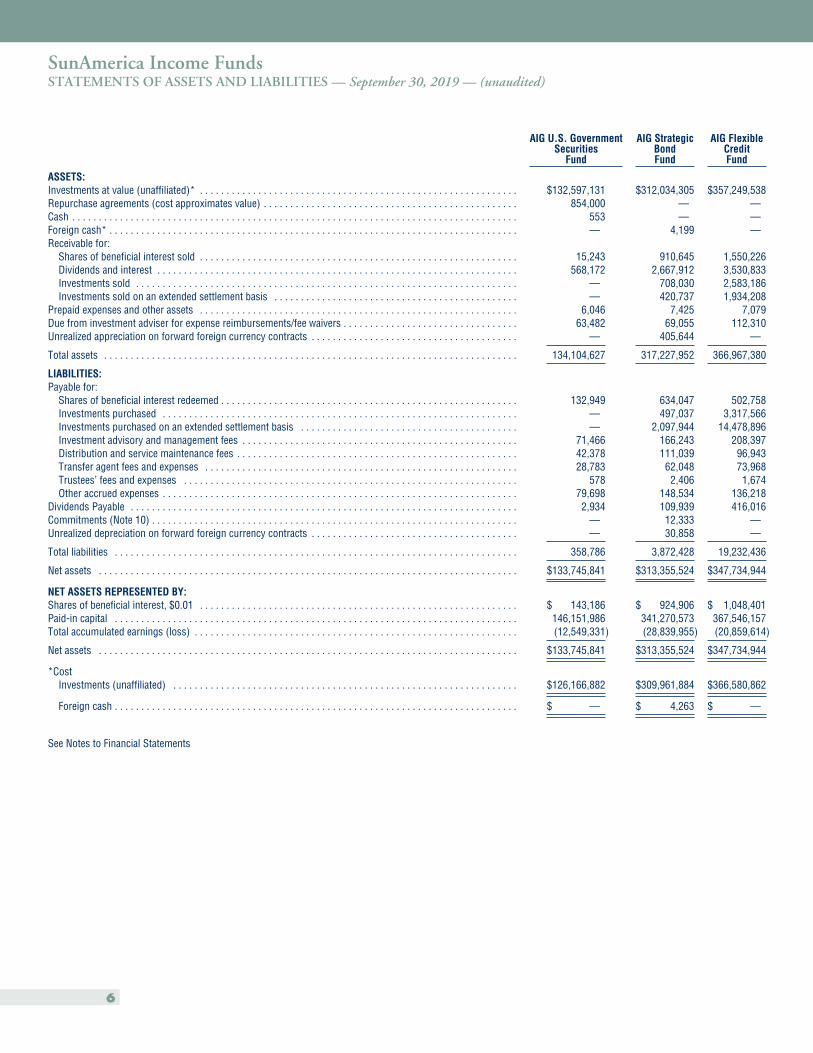
SunAmerica Income FundsSTATEMENTS OF ASSETS AND LIABILITIES — September 30, 2019 — (unaudited)
AIG U.S. GovernmentSecurities
Fund
AIG StrategicBondFund
AIG FlexibleCreditFund
ASSETS:Investments at value (unaffiliated)* . . . . . . . . . . . . . . . . . . . . . . . . . . . . . . . . . . . . . . . . . . . . . . . . . . . . . . . . . . . . $132,597,131 $312,034,305 $357,249,538Repurchase agreements (cost approximates value) . . . . . . . . . . . . . . . . . . . . . . . . . . . . . . . . . . . . . . . . . . . . . . . . 854,000 — —Cash . . . . . . . . . . . . . . . . . . . . . . . . . . . . . . . . . . . . . . . . . . . . . . . . . . . . . . . . . . . . . . . . . . . . . . . . . . . . . . . . . . . . 553 — —Foreign cash* . . . . . . . . . . . . . . . . . . . . . . . . . . . . . . . . . . . . . . . . . . . . . . . . . . . . . . . . . . . . . . . . . . . . . . . . . . . . . — 4,199 —Receivable for:
Shares of beneficial interest sold . . . . . . . . . . . . . . . . . . . . . . . . . . . . . . . . . . . . . . . . . . . . . . . . . . . . . . . . . . . . 15,243 910,645 1,550,226Dividends and interest . . . . . . . . . . . . . . . . . . . . . . . . . . . . . . . . . . . . . . . . . . . . . . . . . . . . . . . . . . . . . . . . . . . . 568,172 2,667,912 3,530,833Investments sold . . . . . . . . . . . . . . . . . . . . . . . . . . . . . . . . . . . . . . . . . . . . . . . . . . . . . . . . . . . . . . . . . . . . . . . . — 708,030 2,583,186Investments sold on an extended settlement basis . . . . . . . . . . . . . . . . . . . . . . . . . . . . . . . . . . . . . . . . . . . . . . — 420,737 1,934,208
Prepaid expenses and other assets . . . . . . . . . . . . . . . . . . . . . . . . . . . . . . . . . . . . . . . . . . . . . . . . . . . . . . . . . . . . 6,046 7,425 7,079Due from investment adviser for expense reimbursements/fee waivers . . . . . . . . . . . . . . . . . . . . . . . . . . . . . . . . . 63,482 69,055 112,310Unrealized appreciation on forward foreign currency contracts . . . . . . . . . . . . . . . . . . . . . . . . . . . . . . . . . . . . . . . — 405,644 —
Total assets . . . . . . . . . . . . . . . . . . . . . . . . . . . . . . . . . . . . . . . . . . . . . . . . . . . . . . . . . . . . . . . . . . . . . . . . . . . . . . 134,104,627 317,227,952 366,967,380
LIABILITIES:Payable for:
Shares of beneficial interest redeemed . . . . . . . . . . . . . . . . . . . . . . . . . . . . . . . . . . . . . . . . . . . . . . . . . . . . . . . . 132,949 634,047 502,758Investments purchased . . . . . . . . . . . . . . . . . . . . . . . . . . . . . . . . . . . . . . . . . . . . . . . . . . . . . . . . . . . . . . . . . . . — 497,037 3,317,566Investments purchased on an extended settlement basis . . . . . . . . . . . . . . . . . . . . . . . . . . . . . . . . . . . . . . . . . — 2,097,944 14,478,896Investment advisory and management fees . . . . . . . . . . . . . . . . . . . . . . . . . . . . . . . . . . . . . . . . . . . . . . . . . . . . 71,466 166,243 208,397Distribution and service maintenance fees . . . . . . . . . . . . . . . . . . . . . . . . . . . . . . . . . . . . . . . . . . . . . . . . . . . . . 42,378 111,039 96,943Transfer agent fees and expenses . . . . . . . . . . . . . . . . . . . . . . . . . . . . . . . . . . . . . . . . . . . . . . . . . . . . . . . . . . . 28,783 62,048 73,968Trustees’ fees and expenses . . . . . . . . . . . . . . . . . . . . . . . . . . . . . . . . . . . . . . . . . . . . . . . . . . . . . . . . . . . . . . . 578 2,406 1,674Other accrued expenses . . . . . . . . . . . . . . . . . . . . . . . . . . . . . . . . . . . . . . . . . . . . . . . . . . . . . . . . . . . . . . . . . . . 79,698 148,534 136,218
Dividends Payable . . . . . . . . . . . . . . . . . . . . . . . . . . . . . . . . . . . . . . . . . . . . . . . . . . . . . . . . . . . . . . . . . . . . . . . . . 2,934 109,939 416,016Commitments (Note 10) . . . . . . . . . . . . . . . . . . . . . . . . . . . . . . . . . . . . . . . . . . . . . . . . . . . . . . . . . . . . . . . . . . . . . — 12,333 —Unrealized depreciation on forward foreign currency contracts . . . . . . . . . . . . . . . . . . . . . . . . . . . . . . . . . . . . . . . — 30,858 —
Total liabilities . . . . . . . . . . . . . . . . . . . . . . . . . . . . . . . . . . . . . . . . . . . . . . . . . . . . . . . . . . . . . . . . . . . . . . . . . . . . 358,786 3,872,428 19,232,436
Net assets . . . . . . . . . . . . . . . . . . . . . . . . . . . . . . . . . . . . . . . . . . . . . . . . . . . . . . . . . . . . . . . . . . . . . . . . . . . . . . . $133,745,841 $313,355,524 $347,734,944
NET ASSETS REPRESENTED BY:Shares of beneficial interest, $0.01 . . . . . . . . . . . . . . . . . . . . . . . . . . . . . . . . . . . . . . . . . . . . . . . . . . . . . . . . . . . . $ 143,186 $ 924,906 $ 1,048,401Paid-in capital . . . . . . . . . . . . . . . . . . . . . . . . . . . . . . . . . . . . . . . . . . . . . . . . . . . . . . . . . . . . . . . . . . . . . . . . . . . . 146,151,986 341,270,573 367,546,157Total accumulated earnings (loss) . . . . . . . . . . . . . . . . . . . . . . . . . . . . . . . . . . . . . . . . . . . . . . . . . . . . . . . . . . . . . (12,549,331) (28,839,955) (20,859,614)
Net assets . . . . . . . . . . . . . . . . . . . . . . . . . . . . . . . . . . . . . . . . . . . . . . . . . . . . . . . . . . . . . . . . . . . . . . . . . . . . . . . $133,745,841 $313,355,524 $347,734,944
*CostInvestments (unaffiliated) . . . . . . . . . . . . . . . . . . . . . . . . . . . . . . . . . . . . . . . . . . . . . . . . . . . . . . . . . . . . . . . . . $126,166,882 $309,961,884 $366,580,862
Foreign cash . . . . . . . . . . . . . . . . . . . . . . . . . . . . . . . . . . . . . . . . . . . . . . . . . . . . . . . . . . . . . . . . . . . . . . . . . . . . $ — $ 4,263 $ —
See Notes to Financial Statements
6
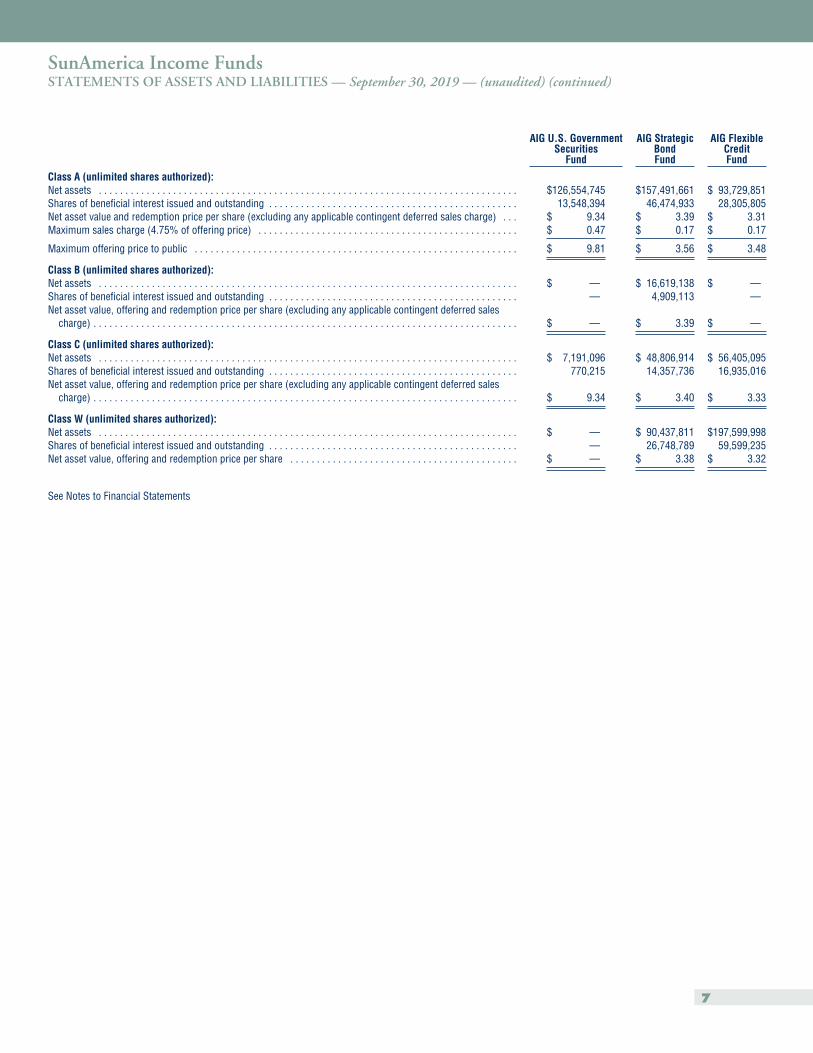
SunAmerica Income FundsSTATEMENTS OF ASSETS AND LIABILITIES — September 30, 2019 — (unaudited) (continued)
AIG U.S. GovernmentSecurities
Fund
AIG StrategicBondFund
AIG FlexibleCreditFund
Class A (unlimited shares authorized):Net assets . . . . . . . . . . . . . . . . . . . . . . . . . . . . . . . . . . . . . . . . . . . . . . . . . . . . . . . . . . . . . . . . . . . . . . . . . . . . . . . $126,554,745 $157,491,661 $ 93,729,851Shares of beneficial interest issued and outstanding . . . . . . . . . . . . . . . . . . . . . . . . . . . . . . . . . . . . . . . . . . . . . . . 13,548,394 46,474,933 28,305,805Net asset value and redemption price per share (excluding any applicable contingent deferred sales charge) . . . $ 9.34 $ 3.39 $ 3.31Maximum sales charge (4.75% of offering price) . . . . . . . . . . . . . . . . . . . . . . . . . . . . . . . . . . . . . . . . . . . . . . . . . $ 0.47 $ 0.17 $ 0.17
Maximum offering price to public . . . . . . . . . . . . . . . . . . . . . . . . . . . . . . . . . . . . . . . . . . . . . . . . . . . . . . . . . . . . . $ 9.81 $ 3.56 $ 3.48
Class B (unlimited shares authorized):Net assets . . . . . . . . . . . . . . . . . . . . . . . . . . . . . . . . . . . . . . . . . . . . . . . . . . . . . . . . . . . . . . . . . . . . . . . . . . . . . . . $ — $ 16,619,138 $ —Shares of beneficial interest issued and outstanding . . . . . . . . . . . . . . . . . . . . . . . . . . . . . . . . . . . . . . . . . . . . . . . — 4,909,113 —Net asset value, offering and redemption price per share (excluding any applicable contingent deferred sales
charge) . . . . . . . . . . . . . . . . . . . . . . . . . . . . . . . . . . . . . . . . . . . . . . . . . . . . . . . . . . . . . . . . . . . . . . . . . . . . . . . . $ — $ 3.39 $ —
Class C (unlimited shares authorized):Net assets . . . . . . . . . . . . . . . . . . . . . . . . . . . . . . . . . . . . . . . . . . . . . . . . . . . . . . . . . . . . . . . . . . . . . . . . . . . . . . . $ 7,191,096 $ 48,806,914 $ 56,405,095Shares of beneficial interest issued and outstanding . . . . . . . . . . . . . . . . . . . . . . . . . . . . . . . . . . . . . . . . . . . . . . . 770,215 14,357,736 16,935,016Net asset value, offering and redemption price per share (excluding any applicable contingent deferred sales
charge) . . . . . . . . . . . . . . . . . . . . . . . . . . . . . . . . . . . . . . . . . . . . . . . . . . . . . . . . . . . . . . . . . . . . . . . . . . . . . . . . $ 9.34 $ 3.40 $ 3.33
Class W (unlimited shares authorized):Net assets . . . . . . . . . . . . . . . . . . . . . . . . . . . . . . . . . . . . . . . . . . . . . . . . . . . . . . . . . . . . . . . . . . . . . . . . . . . . . . . $ — $ 90,437,811 $197,599,998Shares of beneficial interest issued and outstanding . . . . . . . . . . . . . . . . . . . . . . . . . . . . . . . . . . . . . . . . . . . . . . . — 26,748,789 59,599,235Net asset value, offering and redemption price per share . . . . . . . . . . . . . . . . . . . . . . . . . . . . . . . . . . . . . . . . . . . $ — $ 3.38 $ 3.32
See Notes to Financial Statements
7
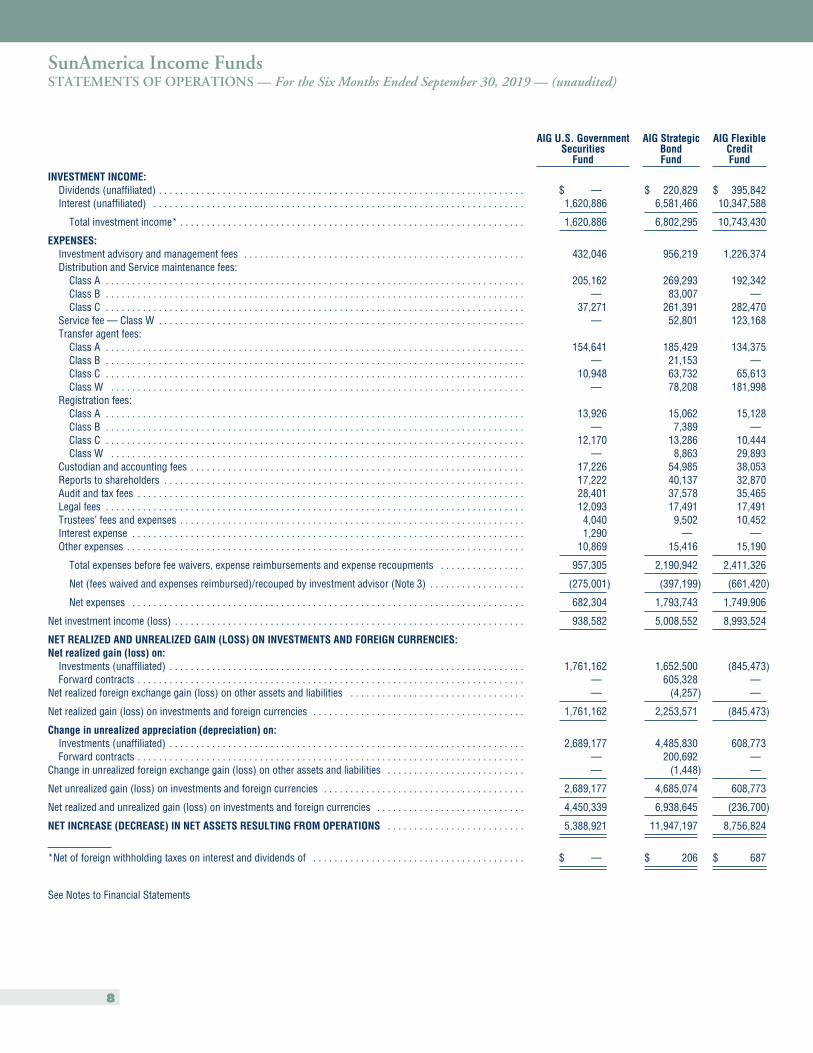
SunAmerica Income FundsSTATEMENTS OF OPERATIONS — For the Six Months Ended September 30, 2019 — (unaudited)
AIG U.S. GovernmentSecurities
Fund
AIG StrategicBondFund
AIG FlexibleCreditFund
INVESTMENT INCOME:Dividends (unaffiliated) . . . . . . . . . . . . . . . . . . . . . . . . . . . . . . . . . . . . . . . . . . . . . . . . . . . . . . . . . . . . . . . . . . . . . $ — $ 220,829 $ 395,842Interest (unaffiliated) . . . . . . . . . . . . . . . . . . . . . . . . . . . . . . . . . . . . . . . . . . . . . . . . . . . . . . . . . . . . . . . . . . . . . . 1,620,886 6,581,466 10,347,588
Total investment income* . . . . . . . . . . . . . . . . . . . . . . . . . . . . . . . . . . . . . . . . . . . . . . . . . . . . . . . . . . . . . . . . . 1,620,886 6,802,295 10,743,430
EXPENSES:Investment advisory and management fees . . . . . . . . . . . . . . . . . . . . . . . . . . . . . . . . . . . . . . . . . . . . . . . . . . . . . 432,046 956,219 1,226,374Distribution and Service maintenance fees:
Class A . . . . . . . . . . . . . . . . . . . . . . . . . . . . . . . . . . . . . . . . . . . . . . . . . . . . . . . . . . . . . . . . . . . . . . . . . . . . . . . 205,162 269,293 192,342Class B . . . . . . . . . . . . . . . . . . . . . . . . . . . . . . . . . . . . . . . . . . . . . . . . . . . . . . . . . . . . . . . . . . . . . . . . . . . . . . . — 83,007 —Class C . . . . . . . . . . . . . . . . . . . . . . . . . . . . . . . . . . . . . . . . . . . . . . . . . . . . . . . . . . . . . . . . . . . . . . . . . . . . . . . 37,271 261,391 282,470
Service fee — Class W . . . . . . . . . . . . . . . . . . . . . . . . . . . . . . . . . . . . . . . . . . . . . . . . . . . . . . . . . . . . . . . . . . . . . — 52,801 123,168Transfer agent fees:
Class A . . . . . . . . . . . . . . . . . . . . . . . . . . . . . . . . . . . . . . . . . . . . . . . . . . . . . . . . . . . . . . . . . . . . . . . . . . . . . . . 154,641 185,429 134,375Class B . . . . . . . . . . . . . . . . . . . . . . . . . . . . . . . . . . . . . . . . . . . . . . . . . . . . . . . . . . . . . . . . . . . . . . . . . . . . . . . — 21,153 —Class C . . . . . . . . . . . . . . . . . . . . . . . . . . . . . . . . . . . . . . . . . . . . . . . . . . . . . . . . . . . . . . . . . . . . . . . . . . . . . . . 10,948 63,732 65,613Class W . . . . . . . . . . . . . . . . . . . . . . . . . . . . . . . . . . . . . . . . . . . . . . . . . . . . . . . . . . . . . . . . . . . . . . . . . . . . . . — 78,208 181,998
Registration fees:Class A . . . . . . . . . . . . . . . . . . . . . . . . . . . . . . . . . . . . . . . . . . . . . . . . . . . . . . . . . . . . . . . . . . . . . . . . . . . . . . . 13,926 15,062 15,128Class B . . . . . . . . . . . . . . . . . . . . . . . . . . . . . . . . . . . . . . . . . . . . . . . . . . . . . . . . . . . . . . . . . . . . . . . . . . . . . . . — 7,389 —Class C . . . . . . . . . . . . . . . . . . . . . . . . . . . . . . . . . . . . . . . . . . . . . . . . . . . . . . . . . . . . . . . . . . . . . . . . . . . . . . . 12,170 13,286 10,444Class W . . . . . . . . . . . . . . . . . . . . . . . . . . . . . . . . . . . . . . . . . . . . . . . . . . . . . . . . . . . . . . . . . . . . . . . . . . . . . . — 8,863 29,893
Custodian and accounting fees . . . . . . . . . . . . . . . . . . . . . . . . . . . . . . . . . . . . . . . . . . . . . . . . . . . . . . . . . . . . . . . 17,226 54,985 38,053Reports to shareholders . . . . . . . . . . . . . . . . . . . . . . . . . . . . . . . . . . . . . . . . . . . . . . . . . . . . . . . . . . . . . . . . . . . . 17,222 40,137 32,870Audit and tax fees . . . . . . . . . . . . . . . . . . . . . . . . . . . . . . . . . . . . . . . . . . . . . . . . . . . . . . . . . . . . . . . . . . . . . . . . . 28,401 37,578 35,465Legal fees . . . . . . . . . . . . . . . . . . . . . . . . . . . . . . . . . . . . . . . . . . . . . . . . . . . . . . . . . . . . . . . . . . . . . . . . . . . . . . . 12,093 17,491 17,491Trustees’ fees and expenses . . . . . . . . . . . . . . . . . . . . . . . . . . . . . . . . . . . . . . . . . . . . . . . . . . . . . . . . . . . . . . . . . 4,040 9,502 10,452Interest expense . . . . . . . . . . . . . . . . . . . . . . . . . . . . . . . . . . . . . . . . . . . . . . . . . . . . . . . . . . . . . . . . . . . . . . . . . . 1,290 — —Other expenses . . . . . . . . . . . . . . . . . . . . . . . . . . . . . . . . . . . . . . . . . . . . . . . . . . . . . . . . . . . . . . . . . . . . . . . . . . . 10,869 15,416 15,190
Total expenses before fee waivers, expense reimbursements and expense recoupments . . . . . . . . . . . . . . . . 957,305 2,190,942 2,411,326
Net (fees waived and expenses reimbursed)/recouped by investment advisor (Note 3) . . . . . . . . . . . . . . . . . . (275,001) (397,199) (661,420)
Net expenses . . . . . . . . . . . . . . . . . . . . . . . . . . . . . . . . . . . . . . . . . . . . . . . . . . . . . . . . . . . . . . . . . . . . . . . . . . 682,304 1,793,743 1,749,906
Net investment income (loss) . . . . . . . . . . . . . . . . . . . . . . . . . . . . . . . . . . . . . . . . . . . . . . . . . . . . . . . . . . . . . . . . . . 938,582 5,008,552 8,993,524
NET REALIZED AND UNREALIZED GAIN (LOSS) ON INVESTMENTS AND FOREIGN CURRENCIES:Net realized gain (loss) on:
Investments (unaffiliated) . . . . . . . . . . . . . . . . . . . . . . . . . . . . . . . . . . . . . . . . . . . . . . . . . . . . . . . . . . . . . . . . . . . 1,761,162 1,652,500 (845,473)Forward contracts . . . . . . . . . . . . . . . . . . . . . . . . . . . . . . . . . . . . . . . . . . . . . . . . . . . . . . . . . . . . . . . . . . . . . . . . . — 605,328 —
Net realized foreign exchange gain (loss) on other assets and liabilities . . . . . . . . . . . . . . . . . . . . . . . . . . . . . . . . . — (4,257) —
Net realized gain (loss) on investments and foreign currencies . . . . . . . . . . . . . . . . . . . . . . . . . . . . . . . . . . . . . . . . 1,761,162 2,253,571 (845,473)
Change in unrealized appreciation (depreciation) on:Investments (unaffiliated) . . . . . . . . . . . . . . . . . . . . . . . . . . . . . . . . . . . . . . . . . . . . . . . . . . . . . . . . . . . . . . . . . . . 2,689,177 4,485,830 608,773Forward contracts . . . . . . . . . . . . . . . . . . . . . . . . . . . . . . . . . . . . . . . . . . . . . . . . . . . . . . . . . . . . . . . . . . . . . . . . . — 200,692 —
Change in unrealized foreign exchange gain (loss) on other assets and liabilities . . . . . . . . . . . . . . . . . . . . . . . . . . — (1,448) —
Net unrealized gain (loss) on investments and foreign currencies . . . . . . . . . . . . . . . . . . . . . . . . . . . . . . . . . . . . . . 2,689,177 4,685,074 608,773
Net realized and unrealized gain (loss) on investments and foreign currencies . . . . . . . . . . . . . . . . . . . . . . . . . . . . 4,450,339 6,938,645 (236,700)
NET INCREASE (DECREASE) IN NET ASSETS RESULTING FROM OPERATIONS . . . . . . . . . . . . . . . . . . . . . . . . . . 5,388,921 11,947,197 8,756,824
*Net of foreign withholding taxes on interest and dividends of . . . . . . . . . . . . . . . . . . . . . . . . . . . . . . . . . . . . . . . . $ — $ 206 $ 687
See Notes to Financial Statements
8
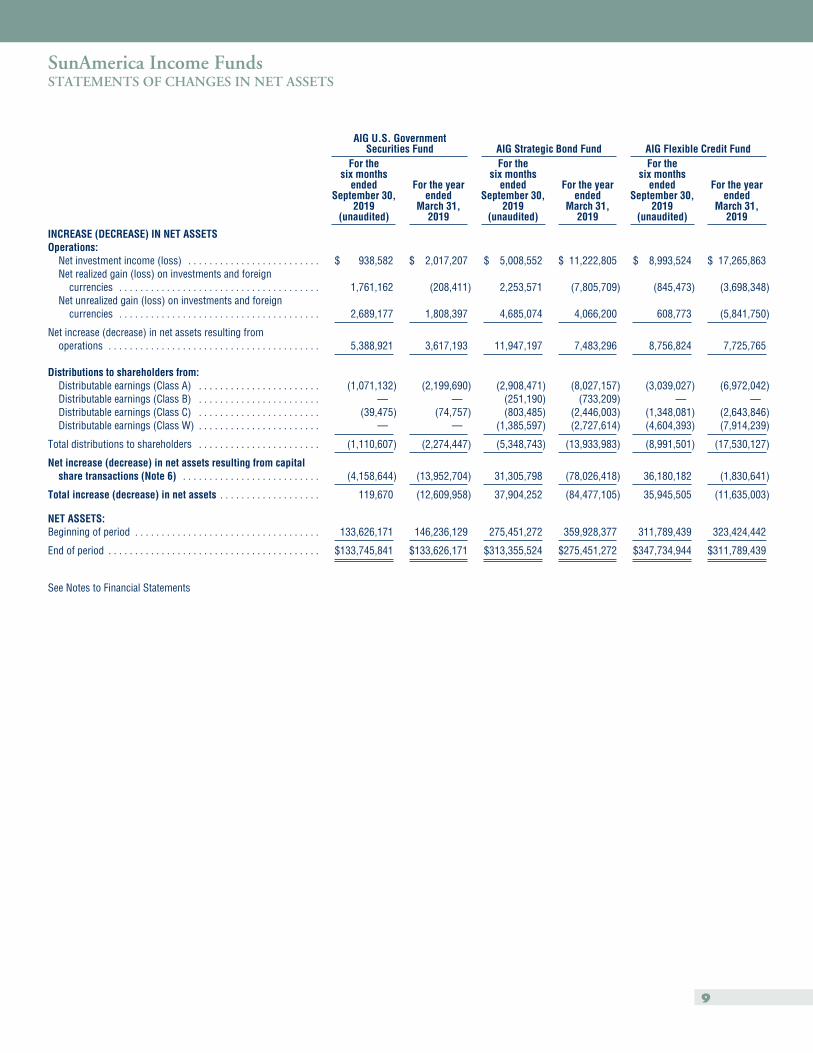
SunAmerica Income FundsSTATEMENTS OF CHANGES IN NET ASSETS
AIG U.S. GovernmentSecurities Fund AIG Strategic Bond Fund AIG Flexible Credit Fund
For thesix months
endedSeptember 30,
2019(unaudited)
For the yearended
March 31,2019
For thesix months
endedSeptember 30,
2019(unaudited)
For the yearended
March 31,2019
For thesix months
endedSeptember 30,
2019(unaudited)
For the yearended
March 31,2019
INCREASE (DECREASE) IN NET ASSETSOperations:
Net investment income (loss) . . . . . . . . . . . . . . . . . . . . . . . . . $ 938,582 $ 2,017,207 $ 5,008,552 $ 11,222,805 $ 8,993,524 $ 17,265,863Net realized gain (loss) on investments and foreign
currencies . . . . . . . . . . . . . . . . . . . . . . . . . . . . . . . . . . . . . . 1,761,162 (208,411) 2,253,571 (7,805,709) (845,473) (3,698,348)Net unrealized gain (loss) on investments and foreign
currencies . . . . . . . . . . . . . . . . . . . . . . . . . . . . . . . . . . . . . . 2,689,177 1,808,397 4,685,074 4,066,200 608,773 (5,841,750)
Net increase (decrease) in net assets resulting fromoperations . . . . . . . . . . . . . . . . . . . . . . . . . . . . . . . . . . . . . . . . 5,388,921 3,617,193 11,947,197 7,483,296 8,756,824 7,725,765
Distributions to shareholders from:Distributable earnings (Class A) . . . . . . . . . . . . . . . . . . . . . . . (1,071,132) (2,199,690) (2,908,471) (8,027,157) (3,039,027) (6,972,042)Distributable earnings (Class B) . . . . . . . . . . . . . . . . . . . . . . . — — (251,190) (733,209) — —Distributable earnings (Class C) . . . . . . . . . . . . . . . . . . . . . . . (39,475) (74,757) (803,485) (2,446,003) (1,348,081) (2,643,846)Distributable earnings (Class W) . . . . . . . . . . . . . . . . . . . . . . . — — (1,385,597) (2,727,614) (4,604,393) (7,914,239)
Total distributions to shareholders . . . . . . . . . . . . . . . . . . . . . . . (1,110,607) (2,274,447) (5,348,743) (13,933,983) (8,991,501) (17,530,127)
Net increase (decrease) in net assets resulting from capitalshare transactions (Note 6) . . . . . . . . . . . . . . . . . . . . . . . . . . (4,158,644) (13,952,704) 31,305,798 (78,026,418) 36,180,182 (1,830,641)
Total increase (decrease) in net assets . . . . . . . . . . . . . . . . . . . 119,670 (12,609,958) 37,904,252 (84,477,105) 35,945,505 (11,635,003)
NET ASSETS:Beginning of period . . . . . . . . . . . . . . . . . . . . . . . . . . . . . . . . . . . 133,626,171 146,236,129 275,451,272 359,928,377 311,789,439 323,424,442
End of period . . . . . . . . . . . . . . . . . . . . . . . . . . . . . . . . . . . . . . . . $133,745,841 $133,626,171 $313,355,524 $275,451,272 $347,734,944 $311,789,439
See Notes to Financial Statements
9
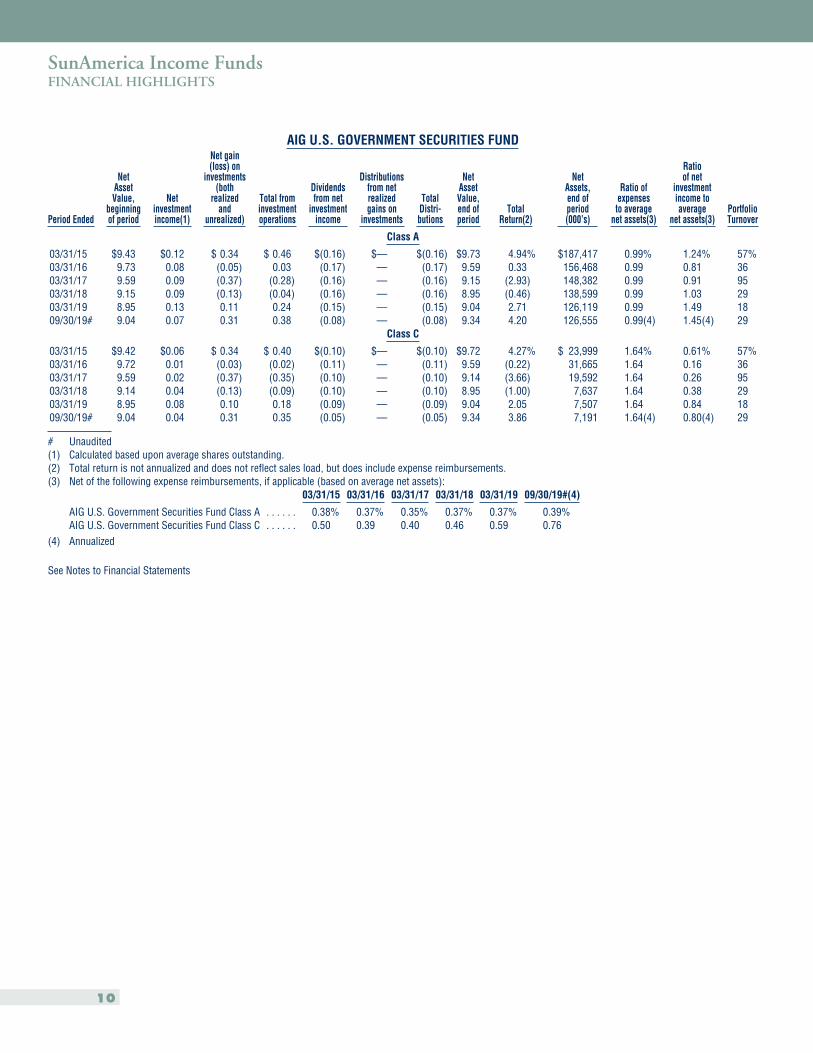
SunAmerica Income FundsFINANCIAL HIGHLIGHTS
AIG U.S. GOVERNMENT SECURITIES FUND
Period Ended
NetAssetValue,
beginningof period
Netinvestmentincome(1)
Net gain(loss) on
investments(both
realizedand
unrealized)
Total frominvestmentoperations
Dividendsfrom net
investmentincome
Distributionsfrom netrealizedgains on
investments
TotalDistri-butions
NetAssetValue,end ofperiod
TotalReturn(2)
NetAssets,end ofperiod(000’s)
Ratio ofexpensesto average
net assets(3)
Ratioof net
investmentincome toaverage
net assets(3)PortfolioTurnover
Class A
03/31/15 $9.43 $0.12 $ 0.34 $ 0.46 $(0.16) $— $(0.16) $9.73 4.94% $187,417 0.99% 1.24% 57%03/31/16 9.73 0.08 (0.05) 0.03 (0.17) — (0.17) 9.59 0.33 156,468 0.99 0.81 3603/31/17 9.59 0.09 (0.37) (0.28) (0.16) — (0.16) 9.15 (2.93) 148,382 0.99 0.91 9503/31/18 9.15 0.09 (0.13) (0.04) (0.16) — (0.16) 8.95 (0.46) 138,599 0.99 1.03 2903/31/19 8.95 0.13 0.11 0.24 (0.15) — (0.15) 9.04 2.71 126,119 0.99 1.49 1809/30/19# 9.04 0.07 0.31 0.38 (0.08) — (0.08) 9.34 4.20 126,555 0.99(4) 1.45(4) 29
Class C
03/31/15 $9.42 $0.06 $ 0.34 $ 0.40 $(0.10) $— $(0.10) $9.72 4.27% $ 23,999 1.64% 0.61% 57%03/31/16 9.72 0.01 (0.03) (0.02) (0.11) — (0.11) 9.59 (0.22) 31,665 1.64 0.16 3603/31/17 9.59 0.02 (0.37) (0.35) (0.10) — (0.10) 9.14 (3.66) 19,592 1.64 0.26 9503/31/18 9.14 0.04 (0.13) (0.09) (0.10) — (0.10) 8.95 (1.00) 7,637 1.64 0.38 2903/31/19 8.95 0.08 0.10 0.18 (0.09) — (0.09) 9.04 2.05 7,507 1.64 0.84 1809/30/19# 9.04 0.04 0.31 0.35 (0.05) — (0.05) 9.34 3.86 7,191 1.64(4) 0.80(4) 29
# Unaudited(1) Calculated based upon average shares outstanding.(2) Total return is not annualized and does not reflect sales load, but does include expense reimbursements.(3) Net of the following expense reimbursements, if applicable (based on average net assets):
03/31/15 03/31/16 03/31/17 03/31/18 03/31/19 09/30/19#(4)
AIG U.S. Government Securities Fund Class A . . . . . . 0.38% 0.37% 0.35% 0.37% 0.37% 0.39%AIG U.S. Government Securities Fund Class C . . . . . . 0.50 0.39 0.40 0.46 0.59 0.76
(4) Annualized
See Notes to Financial Statements
10
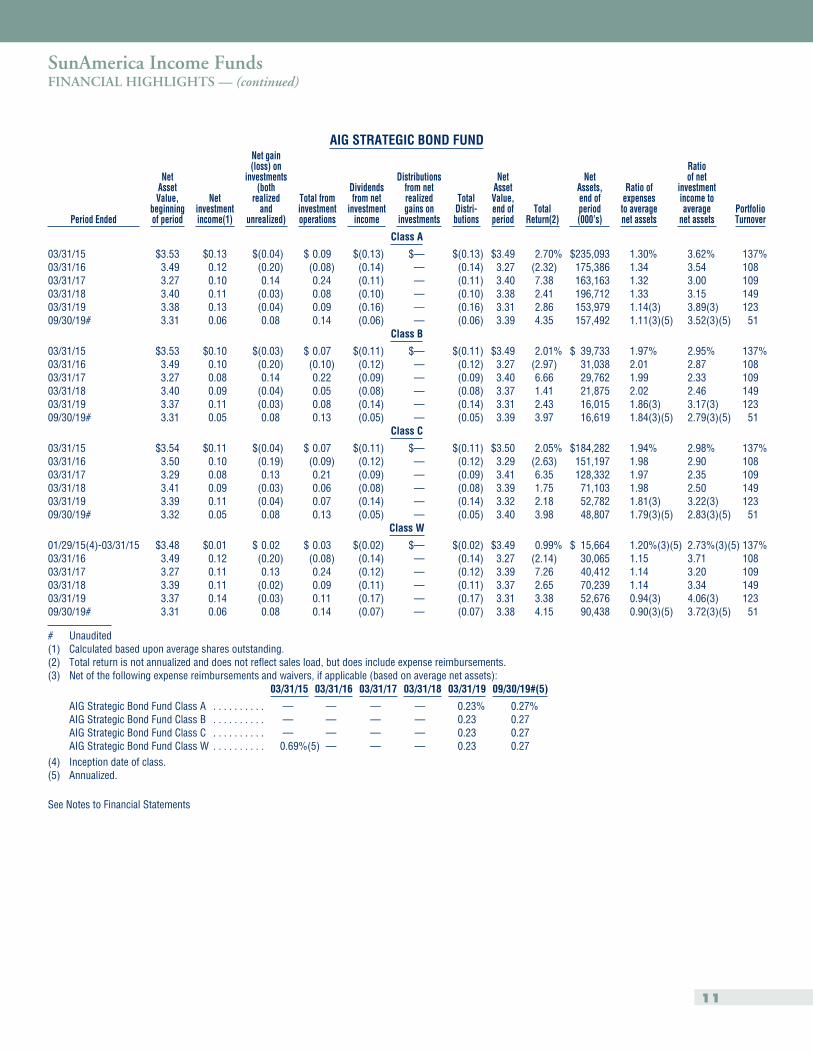
SunAmerica Income FundsFINANCIAL HIGHLIGHTS — (continued)
AIG STRATEGIC BOND FUND
Period Ended
NetAssetValue,
beginningof period
Netinvestmentincome(1)
Net gain(loss) on
investments(both
realizedand
unrealized)
Total frominvestmentoperations
Dividendsfrom net
investmentincome
Distributionsfrom netrealizedgains on
investments
TotalDistri-butions
NetAssetValue,end ofperiod
TotalReturn(2)
NetAssets,end ofperiod(000’s)
Ratio ofexpensesto averagenet assets
Ratioof net
investmentincome toaverage
net assetsPortfolioTurnover
Class A
03/31/15 $3.53 $0.13 $(0.04) $ 0.09 $(0.13) $— $(0.13) $3.49 2.70% $235,093 1.30% 3.62% 137%03/31/16 3.49 0.12 (0.20) (0.08) (0.14) — (0.14) 3.27 (2.32) 175,386 1.34 3.54 10803/31/17 3.27 0.10 0.14 0.24 (0.11) — (0.11) 3.40 7.38 163,163 1.32 3.00 10903/31/18 3.40 0.11 (0.03) 0.08 (0.10) — (0.10) 3.38 2.41 196,712 1.33 3.15 14903/31/19 3.38 0.13 (0.04) 0.09 (0.16) — (0.16) 3.31 2.86 153,979 1.14(3) 3.89(3) 12309/30/19# 3.31 0.06 0.08 0.14 (0.06) — (0.06) 3.39 4.35 157,492 1.11(3)(5) 3.52(3)(5) 51
Class B
03/31/15 $3.53 $0.10 $(0.03) $ 0.07 $(0.11) $— $(0.11) $3.49 2.01% $ 39,733 1.97% 2.95% 137%03/31/16 3.49 0.10 (0.20) (0.10) (0.12) — (0.12) 3.27 (2.97) 31,038 2.01 2.87 10803/31/17 3.27 0.08 0.14 0.22 (0.09) — (0.09) 3.40 6.66 29,762 1.99 2.33 10903/31/18 3.40 0.09 (0.04) 0.05 (0.08) — (0.08) 3.37 1.41 21,875 2.02 2.46 14903/31/19 3.37 0.11 (0.03) 0.08 (0.14) — (0.14) 3.31 2.43 16,015 1.86(3) 3.17(3) 12309/30/19# 3.31 0.05 0.08 0.13 (0.05) — (0.05) 3.39 3.97 16,619 1.84(3)(5) 2.79(3)(5) 51
Class C
03/31/15 $3.54 $0.11 $(0.04) $ 0.07 $(0.11) $— $(0.11) $3.50 2.05% $184,282 1.94% 2.98% 137%03/31/16 3.50 0.10 (0.19) (0.09) (0.12) — (0.12) 3.29 (2.63) 151,197 1.98 2.90 10803/31/17 3.29 0.08 0.13 0.21 (0.09) — (0.09) 3.41 6.35 128,332 1.97 2.35 10903/31/18 3.41 0.09 (0.03) 0.06 (0.08) — (0.08) 3.39 1.75 71,103 1.98 2.50 14903/31/19 3.39 0.11 (0.04) 0.07 (0.14) — (0.14) 3.32 2.18 52,782 1.81(3) 3.22(3) 12309/30/19# 3.32 0.05 0.08 0.13 (0.05) — (0.05) 3.40 3.98 48,807 1.79(3)(5) 2.83(3)(5) 51
Class W
01/29/15(4)-03/31/15 $3.48 $0.01 $ 0.02 $ 0.03 $(0.02) $— $(0.02) $3.49 0.99% $ 15,664 1.20%(3)(5) 2.73%(3)(5) 137%03/31/16 3.49 0.12 (0.20) (0.08) (0.14) — (0.14) 3.27 (2.14) 30,065 1.15 3.71 10803/31/17 3.27 0.11 0.13 0.24 (0.12) — (0.12) 3.39 7.26 40,412 1.14 3.20 10903/31/18 3.39 0.11 (0.02) 0.09 (0.11) — (0.11) 3.37 2.65 70,239 1.14 3.34 14903/31/19 3.37 0.14 (0.03) 0.11 (0.17) — (0.17) 3.31 3.38 52,676 0.94(3) 4.06(3) 12309/30/19# 3.31 0.06 0.08 0.14 (0.07) — (0.07) 3.38 4.15 90,438 0.90(3)(5) 3.72(3)(5) 51
# Unaudited(1) Calculated based upon average shares outstanding.(2) Total return is not annualized and does not reflect sales load, but does include expense reimbursements.(3) Net of the following expense reimbursements and waivers, if applicable (based on average net assets):
03/31/15 03/31/16 03/31/17 03/31/18 03/31/19 09/30/19#(5)
AIG Strategic Bond Fund Class A . . . . . . . . . . — — — — 0.23% 0.27%AIG Strategic Bond Fund Class B . . . . . . . . . . — — — — 0.23 0.27AIG Strategic Bond Fund Class C . . . . . . . . . . — — — — 0.23 0.27AIG Strategic Bond Fund Class W . . . . . . . . . . 0.69%(5) — — — 0.23 0.27
(4) Inception date of class.(5) Annualized.
See Notes to Financial Statements
11
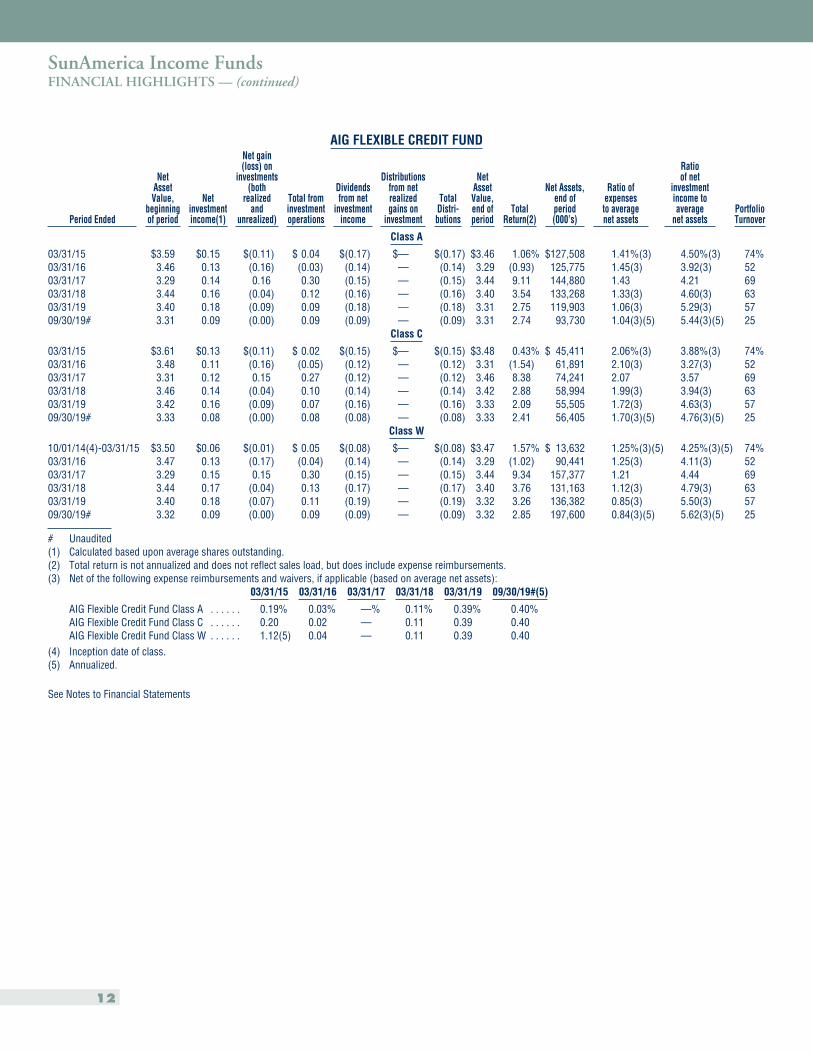
SunAmerica Income FundsFINANCIAL HIGHLIGHTS — (continued)
AIG FLEXIBLE CREDIT FUND
Period Ended
NetAssetValue,
beginningof period
Netinvestmentincome(1)
Net gain(loss) on
investments(both
realizedand
unrealized)
Total frominvestmentoperations
Dividendsfrom net
investmentincome
Distributionsfrom netrealizedgains on
investment
TotalDistri-butions
NetAssetValue,end ofperiod
TotalReturn(2)
Net Assets,end ofperiod(000’s)
Ratio ofexpensesto averagenet assets
Ratioof net
investmentincome toaverage
net assetsPortfolioTurnover
Class A
03/31/15 $3.59 $0.15 $(0.11) $ 0.04 $(0.17) $— $(0.17) $3.46 1.06% $127,508 1.41%(3) 4.50%(3) 74%03/31/16 3.46 0.13 (0.16) (0.03) (0.14) — (0.14) 3.29 (0.93) 125,775 1.45(3) 3.92(3) 5203/31/17 3.29 0.14 0.16 0.30 (0.15) — (0.15) 3.44 9.11 144,880 1.43 4.21 6903/31/18 3.44 0.16 (0.04) 0.12 (0.16) — (0.16) 3.40 3.54 133,268 1.33(3) 4.60(3) 6303/31/19 3.40 0.18 (0.09) 0.09 (0.18) — (0.18) 3.31 2.75 119,903 1.06(3) 5.29(3) 5709/30/19# 3.31 0.09 (0.00) 0.09 (0.09) — (0.09) 3.31 2.74 93,730 1.04(3)(5) 5.44(3)(5) 25
Class C
03/31/15 $3.61 $0.13 $(0.11) $ 0.02 $(0.15) $— $(0.15) $3.48 0.43% $ 45,411 2.06%(3) 3.88%(3) 74%03/31/16 3.48 0.11 (0.16) (0.05) (0.12) — (0.12) 3.31 (1.54) 61,891 2.10(3) 3.27(3) 5203/31/17 3.31 0.12 0.15 0.27 (0.12) — (0.12) 3.46 8.38 74,241 2.07 3.57 6903/31/18 3.46 0.14 (0.04) 0.10 (0.14) — (0.14) 3.42 2.88 58,994 1.99(3) 3.94(3) 6303/31/19 3.42 0.16 (0.09) 0.07 (0.16) — (0.16) 3.33 2.09 55,505 1.72(3) 4.63(3) 5709/30/19# 3.33 0.08 (0.00) 0.08 (0.08) — (0.08) 3.33 2.41 56,405 1.70(3)(5) 4.76(3)(5) 25
Class W
10/01/14(4)-03/31/15 $3.50 $0.06 $(0.01) $ 0.05 $(0.08) $— $(0.08) $3.47 1.57% $ 13,632 1.25%(3)(5) 4.25%(3)(5) 74%03/31/16 3.47 0.13 (0.17) (0.04) (0.14) — (0.14) 3.29 (1.02) 90,441 1.25(3) 4.11(3) 5203/31/17 3.29 0.15 0.15 0.30 (0.15) — (0.15) 3.44 9.34 157,377 1.21 4.44 6903/31/18 3.44 0.17 (0.04) 0.13 (0.17) — (0.17) 3.40 3.76 131,163 1.12(3) 4.79(3) 6303/31/19 3.40 0.18 (0.07) 0.11 (0.19) — (0.19) 3.32 3.26 136,382 0.85(3) 5.50(3) 5709/30/19# 3.32 0.09 (0.00) 0.09 (0.09) — (0.09) 3.32 2.85 197,600 0.84(3)(5) 5.62(3)(5) 25
# Unaudited(1) Calculated based upon average shares outstanding.(2) Total return is not annualized and does not reflect sales load, but does include expense reimbursements.(3) Net of the following expense reimbursements and waivers, if applicable (based on average net assets):
03/31/15 03/31/16 03/31/17 03/31/18 03/31/19 09/30/19#(5)
AIG Flexible Credit Fund Class A . . . . . . 0.19% 0.03% —% 0.11% 0.39% 0.40%AIG Flexible Credit Fund Class C . . . . . . 0.20 0.02 — 0.11 0.39 0.40AIG Flexible Credit Fund Class W . . . . . . 1.12(5) 0.04 — 0.11 0.39 0.40
(4) Inception date of class.(5) Annualized.
See Notes to Financial Statements
12
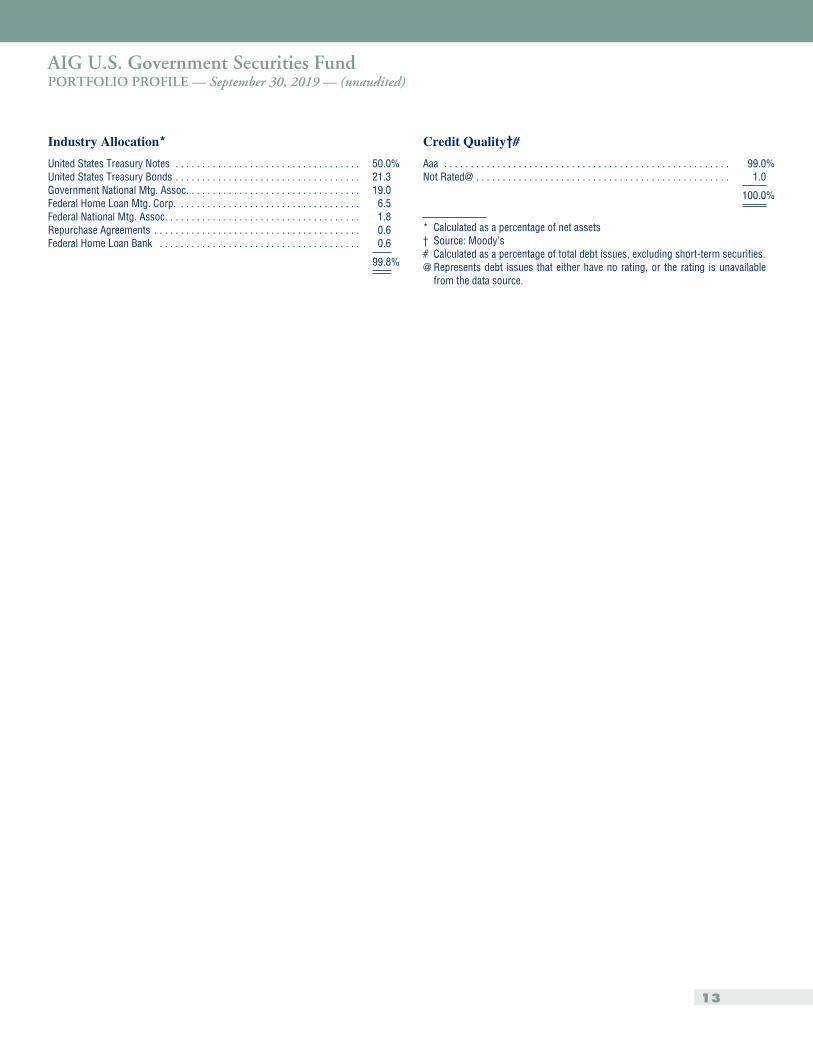
AIG U.S. Government Securities FundPORTFOLIO PROFILE — September 30, 2019 — (unaudited)
Industry Allocation*
United States Treasury Notes . . . . . . . . . . . . . . . . . . . . . . . . . . . . . . . . . . . 50.0%United States Treasury Bonds . . . . . . . . . . . . . . . . . . . . . . . . . . . . . . . . . . . 21.3Government National Mtg. Assoc. . . . . . . . . . . . . . . . . . . . . . . . . . . . . . . . . 19.0Federal Home Loan Mtg. Corp. . . . . . . . . . . . . . . . . . . . . . . . . . . . . . . . . . . 6.5Federal National Mtg. Assoc. . . . . . . . . . . . . . . . . . . . . . . . . . . . . . . . . . . . . 1.8Repurchase Agreements . . . . . . . . . . . . . . . . . . . . . . . . . . . . . . . . . . . . . . . 0.6Federal Home Loan Bank . . . . . . . . . . . . . . . . . . . . . . . . . . . . . . . . . . . . . . 0.6
99.8%
Credit Quality†#
Aaa . . . . . . . . . . . . . . . . . . . . . . . . . . . . . . . . . . . . . . . . . . . . . . . . . . . . . . 99.0%Not Rated@ . . . . . . . . . . . . . . . . . . . . . . . . . . . . . . . . . . . . . . . . . . . . . . . . 1.0
100.0%
* Calculated as a percentage of net assets† Source: Moody’s# Calculated as a percentage of total debt issues, excluding short-term securities.@ Represents debt issues that either have no rating, or the rating is unavailable
from the data source.
13
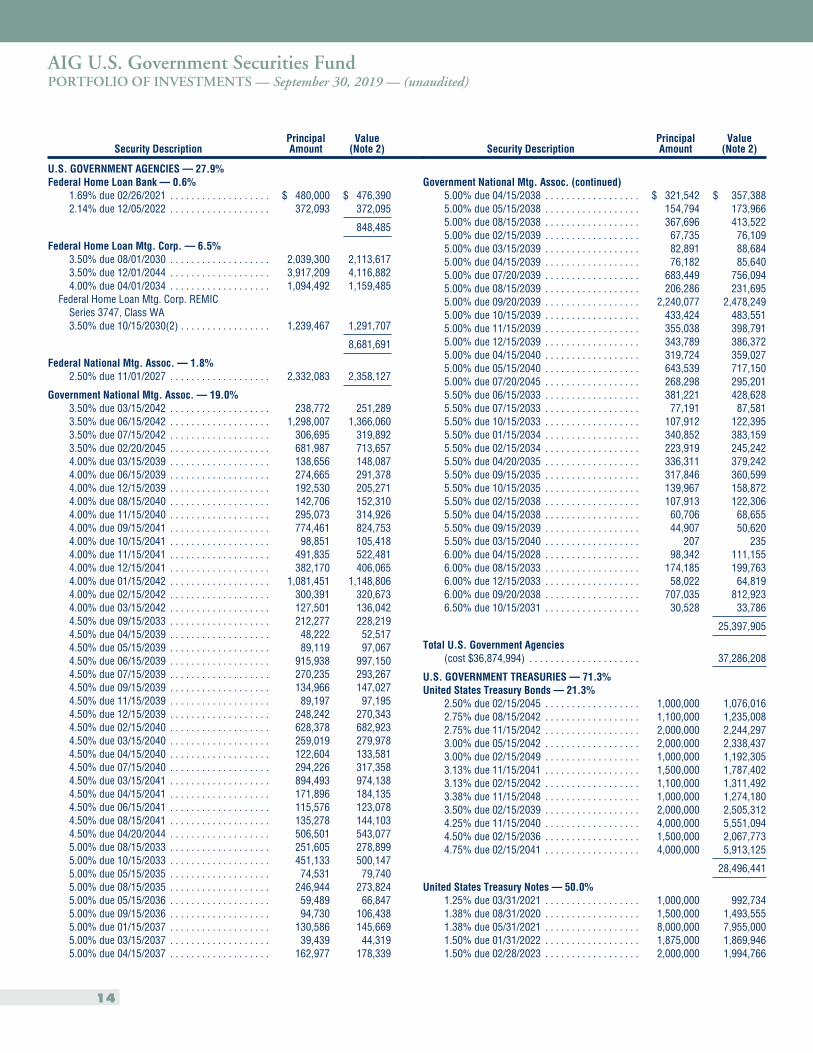
AIG U.S. Government Securities FundPORTFOLIO OF INVESTMENTS — September 30, 2019 — (unaudited)
Security DescriptionPrincipalAmount
Value(Note 2)
U.S. GOVERNMENT AGENCIES — 27.9%Federal Home Loan Bank — 0.6%
1.69% due 02/26/2021 . . . . . . . . . . . . . . . . . . . $ 480,000 $ 476,3902.14% due 12/05/2022 . . . . . . . . . . . . . . . . . . . 372,093 372,095
848,485
Federal Home Loan Mtg. Corp. — 6.5%3.50% due 08/01/2030 . . . . . . . . . . . . . . . . . . . 2,039,300 2,113,6173.50% due 12/01/2044 . . . . . . . . . . . . . . . . . . . 3,917,209 4,116,8824.00% due 04/01/2034 . . . . . . . . . . . . . . . . . . . 1,094,492 1,159,485
Federal Home Loan Mtg. Corp. REMICSeries 3747, Class WA3.50% due 10/15/2030(2) . . . . . . . . . . . . . . . . . 1,239,467 1,291,707
8,681,691
Federal National Mtg. Assoc. — 1.8%2.50% due 11/01/2027 . . . . . . . . . . . . . . . . . . . 2,332,083 2,358,127
Government National Mtg. Assoc. — 19.0%3.50% due 03/15/2042 . . . . . . . . . . . . . . . . . . . 238,772 251,2893.50% due 06/15/2042 . . . . . . . . . . . . . . . . . . . 1,298,007 1,366,0603.50% due 07/15/2042 . . . . . . . . . . . . . . . . . . . 306,695 319,8923.50% due 02/20/2045 . . . . . . . . . . . . . . . . . . . 681,987 713,6574.00% due 03/15/2039 . . . . . . . . . . . . . . . . . . . 138,656 148,0874.00% due 06/15/2039 . . . . . . . . . . . . . . . . . . . 274,665 291,3784.00% due 12/15/2039 . . . . . . . . . . . . . . . . . . . 192,530 205,2714.00% due 08/15/2040 . . . . . . . . . . . . . . . . . . . 142,706 152,3104.00% due 11/15/2040 . . . . . . . . . . . . . . . . . . . 295,073 314,9264.00% due 09/15/2041 . . . . . . . . . . . . . . . . . . . 774,461 824,7534.00% due 10/15/2041 . . . . . . . . . . . . . . . . . . . 98,851 105,4184.00% due 11/15/2041 . . . . . . . . . . . . . . . . . . . 491,835 522,4814.00% due 12/15/2041 . . . . . . . . . . . . . . . . . . . 382,170 406,0654.00% due 01/15/2042 . . . . . . . . . . . . . . . . . . . 1,081,451 1,148,8064.00% due 02/15/2042 . . . . . . . . . . . . . . . . . . . 300,391 320,6734.00% due 03/15/2042 . . . . . . . . . . . . . . . . . . . 127,501 136,0424.50% due 09/15/2033 . . . . . . . . . . . . . . . . . . . 212,277 228,2194.50% due 04/15/2039 . . . . . . . . . . . . . . . . . . . 48,222 52,5174.50% due 05/15/2039 . . . . . . . . . . . . . . . . . . . 89,119 97,0674.50% due 06/15/2039 . . . . . . . . . . . . . . . . . . . 915,938 997,1504.50% due 07/15/2039 . . . . . . . . . . . . . . . . . . . 270,235 293,2674.50% due 09/15/2039 . . . . . . . . . . . . . . . . . . . 134,966 147,0274.50% due 11/15/2039 . . . . . . . . . . . . . . . . . . . 89,197 97,1954.50% due 12/15/2039 . . . . . . . . . . . . . . . . . . . 248,242 270,3434.50% due 02/15/2040 . . . . . . . . . . . . . . . . . . . 628,378 682,9234.50% due 03/15/2040 . . . . . . . . . . . . . . . . . . . 259,019 279,9784.50% due 04/15/2040 . . . . . . . . . . . . . . . . . . . 122,604 133,5814.50% due 07/15/2040 . . . . . . . . . . . . . . . . . . . 294,226 317,3584.50% due 03/15/2041 . . . . . . . . . . . . . . . . . . . 894,493 974,1384.50% due 04/15/2041 . . . . . . . . . . . . . . . . . . . 171,896 184,1354.50% due 06/15/2041 . . . . . . . . . . . . . . . . . . . 115,576 123,0784.50% due 08/15/2041 . . . . . . . . . . . . . . . . . . . 135,278 144,1034.50% due 04/20/2044 . . . . . . . . . . . . . . . . . . . 506,501 543,0775.00% due 08/15/2033 . . . . . . . . . . . . . . . . . . . 251,605 278,8995.00% due 10/15/2033 . . . . . . . . . . . . . . . . . . . 451,133 500,1475.00% due 05/15/2035 . . . . . . . . . . . . . . . . . . . 74,531 79,7405.00% due 08/15/2035 . . . . . . . . . . . . . . . . . . . 246,944 273,8245.00% due 05/15/2036 . . . . . . . . . . . . . . . . . . . 59,489 66,8475.00% due 09/15/2036 . . . . . . . . . . . . . . . . . . . 94,730 106,4385.00% due 01/15/2037 . . . . . . . . . . . . . . . . . . . 130,586 145,6695.00% due 03/15/2037 . . . . . . . . . . . . . . . . . . . 39,439 44,3195.00% due 04/15/2037 . . . . . . . . . . . . . . . . . . . 162,977 178,339
Security DescriptionPrincipalAmount
Value(Note 2)
Government National Mtg. Assoc. (continued)5.00% due 04/15/2038 . . . . . . . . . . . . . . . . . . $ 321,542 $ 357,3885.00% due 05/15/2038 . . . . . . . . . . . . . . . . . . 154,794 173,9665.00% due 08/15/2038 . . . . . . . . . . . . . . . . . . 367,696 413,5225.00% due 02/15/2039 . . . . . . . . . . . . . . . . . . 67,735 76,1095.00% due 03/15/2039 . . . . . . . . . . . . . . . . . . 82,891 88,6845.00% due 04/15/2039 . . . . . . . . . . . . . . . . . . 76,182 85,6405.00% due 07/20/2039 . . . . . . . . . . . . . . . . . . 683,449 756,0945.00% due 08/15/2039 . . . . . . . . . . . . . . . . . . 206,286 231,6955.00% due 09/20/2039 . . . . . . . . . . . . . . . . . . 2,240,077 2,478,2495.00% due 10/15/2039 . . . . . . . . . . . . . . . . . . 433,424 483,5515.00% due 11/15/2039 . . . . . . . . . . . . . . . . . . 355,038 398,7915.00% due 12/15/2039 . . . . . . . . . . . . . . . . . . 343,789 386,3725.00% due 04/15/2040 . . . . . . . . . . . . . . . . . . 319,724 359,0275.00% due 05/15/2040 . . . . . . . . . . . . . . . . . . 643,539 717,1505.00% due 07/20/2045 . . . . . . . . . . . . . . . . . . 268,298 295,2015.50% due 06/15/2033 . . . . . . . . . . . . . . . . . . 381,221 428,6285.50% due 07/15/2033 . . . . . . . . . . . . . . . . . . 77,191 87,5815.50% due 10/15/2033 . . . . . . . . . . . . . . . . . . 107,912 122,3955.50% due 01/15/2034 . . . . . . . . . . . . . . . . . . 340,852 383,1595.50% due 02/15/2034 . . . . . . . . . . . . . . . . . . 223,919 245,2425.50% due 04/20/2035 . . . . . . . . . . . . . . . . . . 336,311 379,2425.50% due 09/15/2035 . . . . . . . . . . . . . . . . . . 317,846 360,5995.50% due 10/15/2035 . . . . . . . . . . . . . . . . . . 139,967 158,8725.50% due 02/15/2038 . . . . . . . . . . . . . . . . . . 107,913 122,3065.50% due 04/15/2038 . . . . . . . . . . . . . . . . . . 60,706 68,6555.50% due 09/15/2039 . . . . . . . . . . . . . . . . . . 44,907 50,6205.50% due 03/15/2040 . . . . . . . . . . . . . . . . . . 207 2356.00% due 04/15/2028 . . . . . . . . . . . . . . . . . . 98,342 111,1556.00% due 08/15/2033 . . . . . . . . . . . . . . . . . . 174,185 199,7636.00% due 12/15/2033 . . . . . . . . . . . . . . . . . . 58,022 64,8196.00% due 09/20/2038 . . . . . . . . . . . . . . . . . . 707,035 812,9236.50% due 10/15/2031 . . . . . . . . . . . . . . . . . . 30,528 33,786
25,397,905
Total U.S. Government Agencies(cost $36,874,994) . . . . . . . . . . . . . . . . . . . . . 37,286,208
U.S. GOVERNMENT TREASURIES — 71.3%United States Treasury Bonds — 21.3%
2.50% due 02/15/2045 . . . . . . . . . . . . . . . . . . 1,000,000 1,076,0162.75% due 08/15/2042 . . . . . . . . . . . . . . . . . . 1,100,000 1,235,0082.75% due 11/15/2042 . . . . . . . . . . . . . . . . . . 2,000,000 2,244,2973.00% due 05/15/2042 . . . . . . . . . . . . . . . . . . 2,000,000 2,338,4373.00% due 02/15/2049 . . . . . . . . . . . . . . . . . . 1,000,000 1,192,3053.13% due 11/15/2041 . . . . . . . . . . . . . . . . . . 1,500,000 1,787,4023.13% due 02/15/2042 . . . . . . . . . . . . . . . . . . 1,100,000 1,311,4923.38% due 11/15/2048 . . . . . . . . . . . . . . . . . . 1,000,000 1,274,1803.50% due 02/15/2039 . . . . . . . . . . . . . . . . . . 2,000,000 2,505,3124.25% due 11/15/2040 . . . . . . . . . . . . . . . . . . 4,000,000 5,551,0944.50% due 02/15/2036 . . . . . . . . . . . . . . . . . . 1,500,000 2,067,7734.75% due 02/15/2041 . . . . . . . . . . . . . . . . . . 4,000,000 5,913,125
28,496,441
United States Treasury Notes — 50.0%1.25% due 03/31/2021 . . . . . . . . . . . . . . . . . . 1,000,000 992,7341.38% due 08/31/2020 . . . . . . . . . . . . . . . . . . 1,500,000 1,493,5551.38% due 05/31/2021 . . . . . . . . . . . . . . . . . . 8,000,000 7,955,0001.50% due 01/31/2022 . . . . . . . . . . . . . . . . . . 1,875,000 1,869,9461.50% due 02/28/2023 . . . . . . . . . . . . . . . . . . 2,000,000 1,994,766
14
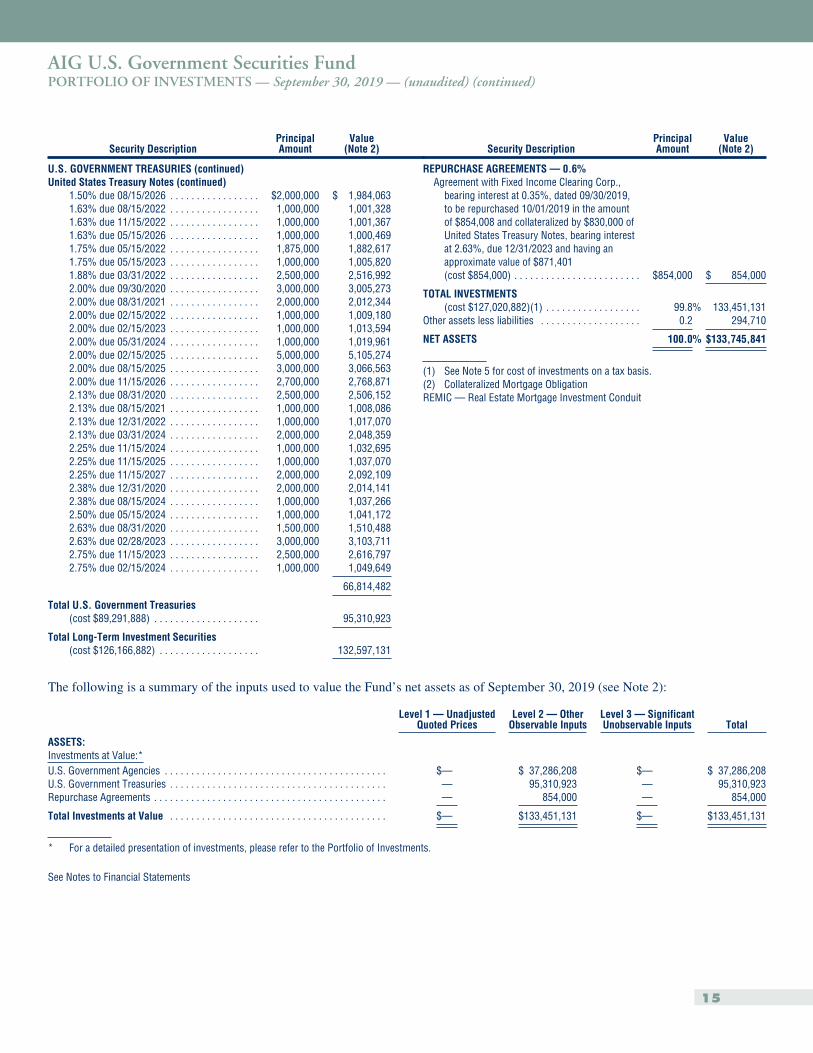
AIG U.S. Government Securities FundPORTFOLIO OF INVESTMENTS — September 30, 2019 — (unaudited) (continued)
Security DescriptionPrincipalAmount
Value(Note 2)
U.S. GOVERNMENT TREASURIES (continued)United States Treasury Notes (continued)
1.50% due 08/15/2026 . . . . . . . . . . . . . . . . . $2,000,000 $ 1,984,0631.63% due 08/15/2022 . . . . . . . . . . . . . . . . . 1,000,000 1,001,3281.63% due 11/15/2022 . . . . . . . . . . . . . . . . . 1,000,000 1,001,3671.63% due 05/15/2026 . . . . . . . . . . . . . . . . . 1,000,000 1,000,4691.75% due 05/15/2022 . . . . . . . . . . . . . . . . . 1,875,000 1,882,6171.75% due 05/15/2023 . . . . . . . . . . . . . . . . . 1,000,000 1,005,8201.88% due 03/31/2022 . . . . . . . . . . . . . . . . . 2,500,000 2,516,9922.00% due 09/30/2020 . . . . . . . . . . . . . . . . . 3,000,000 3,005,2732.00% due 08/31/2021 . . . . . . . . . . . . . . . . . 2,000,000 2,012,3442.00% due 02/15/2022 . . . . . . . . . . . . . . . . . 1,000,000 1,009,1802.00% due 02/15/2023 . . . . . . . . . . . . . . . . . 1,000,000 1,013,5942.00% due 05/31/2024 . . . . . . . . . . . . . . . . . 1,000,000 1,019,9612.00% due 02/15/2025 . . . . . . . . . . . . . . . . . 5,000,000 5,105,2742.00% due 08/15/2025 . . . . . . . . . . . . . . . . . 3,000,000 3,066,5632.00% due 11/15/2026 . . . . . . . . . . . . . . . . . 2,700,000 2,768,8712.13% due 08/31/2020 . . . . . . . . . . . . . . . . . 2,500,000 2,506,1522.13% due 08/15/2021 . . . . . . . . . . . . . . . . . 1,000,000 1,008,0862.13% due 12/31/2022 . . . . . . . . . . . . . . . . . 1,000,000 1,017,0702.13% due 03/31/2024 . . . . . . . . . . . . . . . . . 2,000,000 2,048,3592.25% due 11/15/2024 . . . . . . . . . . . . . . . . . 1,000,000 1,032,6952.25% due 11/15/2025 . . . . . . . . . . . . . . . . . 1,000,000 1,037,0702.25% due 11/15/2027 . . . . . . . . . . . . . . . . . 2,000,000 2,092,1092.38% due 12/31/2020 . . . . . . . . . . . . . . . . . 2,000,000 2,014,1412.38% due 08/15/2024 . . . . . . . . . . . . . . . . . 1,000,000 1,037,2662.50% due 05/15/2024 . . . . . . . . . . . . . . . . . 1,000,000 1,041,1722.63% due 08/31/2020 . . . . . . . . . . . . . . . . . 1,500,000 1,510,4882.63% due 02/28/2023 . . . . . . . . . . . . . . . . . 3,000,000 3,103,7112.75% due 11/15/2023 . . . . . . . . . . . . . . . . . 2,500,000 2,616,7972.75% due 02/15/2024 . . . . . . . . . . . . . . . . . 1,000,000 1,049,649
66,814,482
Total U.S. Government Treasuries(cost $89,291,888) . . . . . . . . . . . . . . . . . . . . 95,310,923
Total Long-Term Investment Securities(cost $126,166,882) . . . . . . . . . . . . . . . . . . . 132,597,131
Security DescriptionPrincipalAmount
Value(Note 2)
REPURCHASE AGREEMENTS — 0.6%Agreement with Fixed Income Clearing Corp.,
bearing interest at 0.35%, dated 09/30/2019,to be repurchased 10/01/2019 in the amountof $854,008 and collateralized by $830,000 ofUnited States Treasury Notes, bearing interestat 2.63%, due 12/31/2023 and having anapproximate value of $871,401(cost $854,000) . . . . . . . . . . . . . . . . . . . . . . . . $854,000 $ 854,000
TOTAL INVESTMENTS(cost $127,020,882)(1) . . . . . . . . . . . . . . . . . . 99.8% 133,451,131
Other assets less liabilities . . . . . . . . . . . . . . . . . . . 0.2 294,710
NET ASSETS 100.0% $133,745,841
(1) See Note 5 for cost of investments on a tax basis.(2) Collateralized Mortgage ObligationREMIC — Real Estate Mortgage Investment Conduit
The following is a summary of the inputs used to value the Fund’s net assets as of September 30, 2019 (see Note 2):
Level 1 — UnadjustedQuoted Prices
Level 2 — OtherObservable Inputs
Level 3 — SignificantUnobservable Inputs Total
ASSETS:Investments at Value:*U.S. Government Agencies . . . . . . . . . . . . . . . . . . . . . . . . . . . . . . . . . . . . . . . . . . $— $ 37,286,208 $— $ 37,286,208U.S. Government Treasuries . . . . . . . . . . . . . . . . . . . . . . . . . . . . . . . . . . . . . . . . . — 95,310,923 — 95,310,923Repurchase Agreements . . . . . . . . . . . . . . . . . . . . . . . . . . . . . . . . . . . . . . . . . . . . — 854,000 — 854,000
Total Investments at Value . . . . . . . . . . . . . . . . . . . . . . . . . . . . . . . . . . . . . . . . . $— $133,451,131 $— $133,451,131
* For a detailed presentation of investments, please refer to the Portfolio of Investments.
See Notes to Financial Statements
15
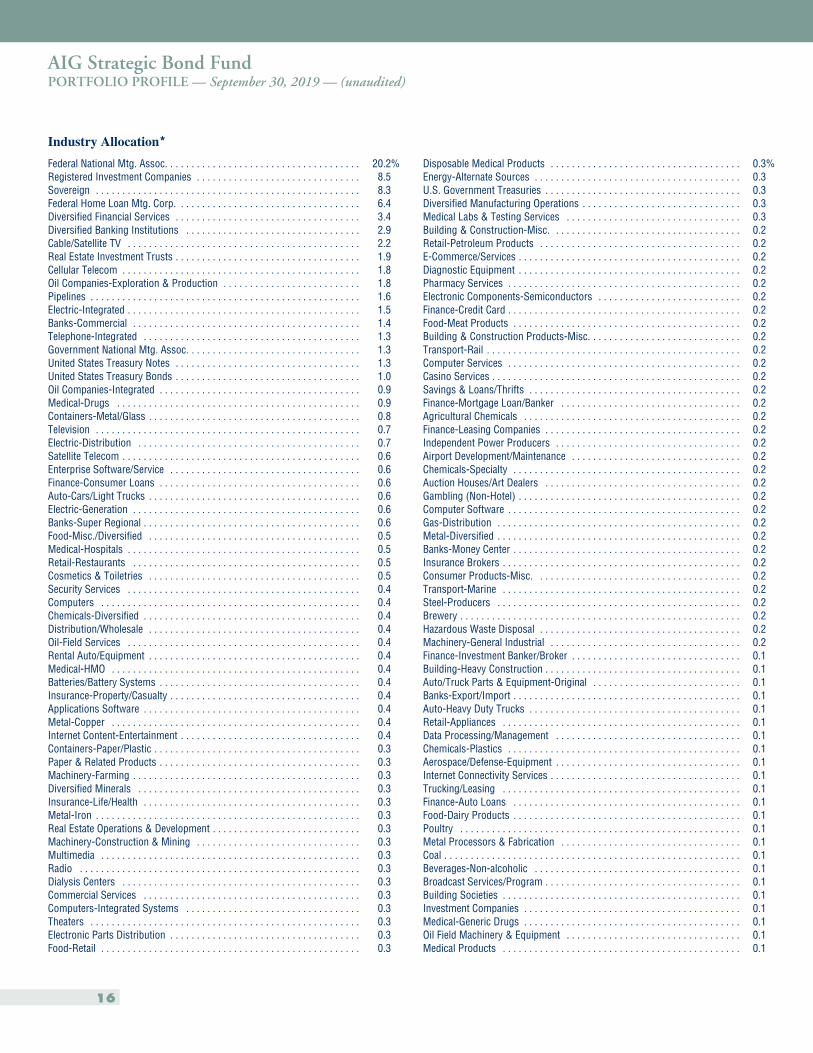
AIG Strategic Bond FundPORTFOLIO PROFILE — September 30, 2019 — (unaudited)
Industry Allocation*
Federal National Mtg. Assoc. . . . . . . . . . . . . . . . . . . . . . . . . . . . . . . . . . . . . 20.2%Registered Investment Companies . . . . . . . . . . . . . . . . . . . . . . . . . . . . . . . 8.5Sovereign . . . . . . . . . . . . . . . . . . . . . . . . . . . . . . . . . . . . . . . . . . . . . . . . . . 8.3Federal Home Loan Mtg. Corp. . . . . . . . . . . . . . . . . . . . . . . . . . . . . . . . . . . 6.4Diversified Financial Services . . . . . . . . . . . . . . . . . . . . . . . . . . . . . . . . . . . 3.4Diversified Banking Institutions . . . . . . . . . . . . . . . . . . . . . . . . . . . . . . . . . 2.9Cable/Satellite TV . . . . . . . . . . . . . . . . . . . . . . . . . . . . . . . . . . . . . . . . . . . . 2.2Real Estate Investment Trusts . . . . . . . . . . . . . . . . . . . . . . . . . . . . . . . . . . . 1.9Cellular Telecom . . . . . . . . . . . . . . . . . . . . . . . . . . . . . . . . . . . . . . . . . . . . . 1.8Oil Companies-Exploration & Production . . . . . . . . . . . . . . . . . . . . . . . . . . 1.8Pipelines . . . . . . . . . . . . . . . . . . . . . . . . . . . . . . . . . . . . . . . . . . . . . . . . . . . 1.6Electric-Integrated . . . . . . . . . . . . . . . . . . . . . . . . . . . . . . . . . . . . . . . . . . . . 1.5Banks-Commercial . . . . . . . . . . . . . . . . . . . . . . . . . . . . . . . . . . . . . . . . . . . 1.4Telephone-Integrated . . . . . . . . . . . . . . . . . . . . . . . . . . . . . . . . . . . . . . . . . 1.3Government National Mtg. Assoc. . . . . . . . . . . . . . . . . . . . . . . . . . . . . . . . . 1.3United States Treasury Notes . . . . . . . . . . . . . . . . . . . . . . . . . . . . . . . . . . . 1.3United States Treasury Bonds . . . . . . . . . . . . . . . . . . . . . . . . . . . . . . . . . . . 1.0Oil Companies-Integrated . . . . . . . . . . . . . . . . . . . . . . . . . . . . . . . . . . . . . . 0.9Medical-Drugs . . . . . . . . . . . . . . . . . . . . . . . . . . . . . . . . . . . . . . . . . . . . . . 0.9Containers-Metal/Glass . . . . . . . . . . . . . . . . . . . . . . . . . . . . . . . . . . . . . . . . 0.8Television . . . . . . . . . . . . . . . . . . . . . . . . . . . . . . . . . . . . . . . . . . . . . . . . . . 0.7Electric-Distribution . . . . . . . . . . . . . . . . . . . . . . . . . . . . . . . . . . . . . . . . . . 0.7Satellite Telecom . . . . . . . . . . . . . . . . . . . . . . . . . . . . . . . . . . . . . . . . . . . . . 0.6Enterprise Software/Service . . . . . . . . . . . . . . . . . . . . . . . . . . . . . . . . . . . . 0.6Finance-Consumer Loans . . . . . . . . . . . . . . . . . . . . . . . . . . . . . . . . . . . . . . 0.6Auto-Cars/Light Trucks . . . . . . . . . . . . . . . . . . . . . . . . . . . . . . . . . . . . . . . . 0.6Electric-Generation . . . . . . . . . . . . . . . . . . . . . . . . . . . . . . . . . . . . . . . . . . . 0.6Banks-Super Regional . . . . . . . . . . . . . . . . . . . . . . . . . . . . . . . . . . . . . . . . . 0.6Food-Misc./Diversified . . . . . . . . . . . . . . . . . . . . . . . . . . . . . . . . . . . . . . . . 0.5Medical-Hospitals . . . . . . . . . . . . . . . . . . . . . . . . . . . . . . . . . . . . . . . . . . . . 0.5Retail-Restaurants . . . . . . . . . . . . . . . . . . . . . . . . . . . . . . . . . . . . . . . . . . . 0.5Cosmetics & Toiletries . . . . . . . . . . . . . . . . . . . . . . . . . . . . . . . . . . . . . . . . 0.5Security Services . . . . . . . . . . . . . . . . . . . . . . . . . . . . . . . . . . . . . . . . . . . . 0.4Computers . . . . . . . . . . . . . . . . . . . . . . . . . . . . . . . . . . . . . . . . . . . . . . . . . 0.4Chemicals-Diversified . . . . . . . . . . . . . . . . . . . . . . . . . . . . . . . . . . . . . . . . . 0.4Distribution/Wholesale . . . . . . . . . . . . . . . . . . . . . . . . . . . . . . . . . . . . . . . . 0.4Oil-Field Services . . . . . . . . . . . . . . . . . . . . . . . . . . . . . . . . . . . . . . . . . . . . 0.4Rental Auto/Equipment . . . . . . . . . . . . . . . . . . . . . . . . . . . . . . . . . . . . . . . . 0.4Medical-HMO . . . . . . . . . . . . . . . . . . . . . . . . . . . . . . . . . . . . . . . . . . . . . . . 0.4Batteries/Battery Systems . . . . . . . . . . . . . . . . . . . . . . . . . . . . . . . . . . . . . . 0.4Insurance-Property/Casualty . . . . . . . . . . . . . . . . . . . . . . . . . . . . . . . . . . . . 0.4Applications Software . . . . . . . . . . . . . . . . . . . . . . . . . . . . . . . . . . . . . . . . . 0.4Metal-Copper . . . . . . . . . . . . . . . . . . . . . . . . . . . . . . . . . . . . . . . . . . . . . . . 0.4Internet Content-Entertainment . . . . . . . . . . . . . . . . . . . . . . . . . . . . . . . . . . 0.4Containers-Paper/Plastic . . . . . . . . . . . . . . . . . . . . . . . . . . . . . . . . . . . . . . . 0.3Paper & Related Products . . . . . . . . . . . . . . . . . . . . . . . . . . . . . . . . . . . . . . 0.3Machinery-Farming . . . . . . . . . . . . . . . . . . . . . . . . . . . . . . . . . . . . . . . . . . . 0.3Diversified Minerals . . . . . . . . . . . . . . . . . . . . . . . . . . . . . . . . . . . . . . . . . . 0.3Insurance-Life/Health . . . . . . . . . . . . . . . . . . . . . . . . . . . . . . . . . . . . . . . . . 0.3Metal-Iron . . . . . . . . . . . . . . . . . . . . . . . . . . . . . . . . . . . . . . . . . . . . . . . . . . 0.3Real Estate Operations & Development . . . . . . . . . . . . . . . . . . . . . . . . . . . . 0.3Machinery-Construction & Mining . . . . . . . . . . . . . . . . . . . . . . . . . . . . . . . 0.3Multimedia . . . . . . . . . . . . . . . . . . . . . . . . . . . . . . . . . . . . . . . . . . . . . . . . . 0.3Radio . . . . . . . . . . . . . . . . . . . . . . . . . . . . . . . . . . . . . . . . . . . . . . . . . . . . . 0.3Dialysis Centers . . . . . . . . . . . . . . . . . . . . . . . . . . . . . . . . . . . . . . . . . . . . . 0.3Commercial Services . . . . . . . . . . . . . . . . . . . . . . . . . . . . . . . . . . . . . . . . . 0.3Computers-Integrated Systems . . . . . . . . . . . . . . . . . . . . . . . . . . . . . . . . . 0.3Theaters . . . . . . . . . . . . . . . . . . . . . . . . . . . . . . . . . . . . . . . . . . . . . . . . . . . 0.3Electronic Parts Distribution . . . . . . . . . . . . . . . . . . . . . . . . . . . . . . . . . . . . 0.3Food-Retail . . . . . . . . . . . . . . . . . . . . . . . . . . . . . . . . . . . . . . . . . . . . . . . . . 0.3
Disposable Medical Products . . . . . . . . . . . . . . . . . . . . . . . . . . . . . . . . . . . . 0.3%Energy-Alternate Sources . . . . . . . . . . . . . . . . . . . . . . . . . . . . . . . . . . . . . . . 0.3U.S. Government Treasuries . . . . . . . . . . . . . . . . . . . . . . . . . . . . . . . . . . . . . 0.3Diversified Manufacturing Operations . . . . . . . . . . . . . . . . . . . . . . . . . . . . . . 0.3Medical Labs & Testing Services . . . . . . . . . . . . . . . . . . . . . . . . . . . . . . . . . 0.3Building & Construction-Misc. . . . . . . . . . . . . . . . . . . . . . . . . . . . . . . . . . . . 0.2Retail-Petroleum Products . . . . . . . . . . . . . . . . . . . . . . . . . . . . . . . . . . . . . . 0.2E-Commerce/Services . . . . . . . . . . . . . . . . . . . . . . . . . . . . . . . . . . . . . . . . . . 0.2Diagnostic Equipment . . . . . . . . . . . . . . . . . . . . . . . . . . . . . . . . . . . . . . . . . . 0.2Pharmacy Services . . . . . . . . . . . . . . . . . . . . . . . . . . . . . . . . . . . . . . . . . . . . 0.2Electronic Components-Semiconductors . . . . . . . . . . . . . . . . . . . . . . . . . . . 0.2Finance-Credit Card . . . . . . . . . . . . . . . . . . . . . . . . . . . . . . . . . . . . . . . . . . . . 0.2Food-Meat Products . . . . . . . . . . . . . . . . . . . . . . . . . . . . . . . . . . . . . . . . . . . 0.2Building & Construction Products-Misc. . . . . . . . . . . . . . . . . . . . . . . . . . . . . 0.2Transport-Rail . . . . . . . . . . . . . . . . . . . . . . . . . . . . . . . . . . . . . . . . . . . . . . . . 0.2Computer Services . . . . . . . . . . . . . . . . . . . . . . . . . . . . . . . . . . . . . . . . . . . . 0.2Casino Services . . . . . . . . . . . . . . . . . . . . . . . . . . . . . . . . . . . . . . . . . . . . . . . 0.2Savings & Loans/Thrifts . . . . . . . . . . . . . . . . . . . . . . . . . . . . . . . . . . . . . . . . 0.2Finance-Mortgage Loan/Banker . . . . . . . . . . . . . . . . . . . . . . . . . . . . . . . . . . 0.2Agricultural Chemicals . . . . . . . . . . . . . . . . . . . . . . . . . . . . . . . . . . . . . . . . . 0.2Finance-Leasing Companies . . . . . . . . . . . . . . . . . . . . . . . . . . . . . . . . . . . . . 0.2Independent Power Producers . . . . . . . . . . . . . . . . . . . . . . . . . . . . . . . . . . . 0.2Airport Development/Maintenance . . . . . . . . . . . . . . . . . . . . . . . . . . . . . . . . 0.2Chemicals-Specialty . . . . . . . . . . . . . . . . . . . . . . . . . . . . . . . . . . . . . . . . . . . 0.2Auction Houses/Art Dealers . . . . . . . . . . . . . . . . . . . . . . . . . . . . . . . . . . . . . 0.2Gambling (Non-Hotel) . . . . . . . . . . . . . . . . . . . . . . . . . . . . . . . . . . . . . . . . . . 0.2Computer Software . . . . . . . . . . . . . . . . . . . . . . . . . . . . . . . . . . . . . . . . . . . . 0.2Gas-Distribution . . . . . . . . . . . . . . . . . . . . . . . . . . . . . . . . . . . . . . . . . . . . . . 0.2Metal-Diversified . . . . . . . . . . . . . . . . . . . . . . . . . . . . . . . . . . . . . . . . . . . . . . 0.2Banks-Money Center . . . . . . . . . . . . . . . . . . . . . . . . . . . . . . . . . . . . . . . . . . . 0.2Insurance Brokers . . . . . . . . . . . . . . . . . . . . . . . . . . . . . . . . . . . . . . . . . . . . . 0.2Consumer Products-Misc. . . . . . . . . . . . . . . . . . . . . . . . . . . . . . . . . . . . . . . 0.2Transport-Marine . . . . . . . . . . . . . . . . . . . . . . . . . . . . . . . . . . . . . . . . . . . . . 0.2Steel-Producers . . . . . . . . . . . . . . . . . . . . . . . . . . . . . . . . . . . . . . . . . . . . . . 0.2Brewery . . . . . . . . . . . . . . . . . . . . . . . . . . . . . . . . . . . . . . . . . . . . . . . . . . . . . 0.2Hazardous Waste Disposal . . . . . . . . . . . . . . . . . . . . . . . . . . . . . . . . . . . . . . 0.2Machinery-General Industrial . . . . . . . . . . . . . . . . . . . . . . . . . . . . . . . . . . . . 0.2Finance-Investment Banker/Broker . . . . . . . . . . . . . . . . . . . . . . . . . . . . . . . . 0.1Building-Heavy Construction . . . . . . . . . . . . . . . . . . . . . . . . . . . . . . . . . . . . . 0.1Auto/Truck Parts & Equipment-Original . . . . . . . . . . . . . . . . . . . . . . . . . . . . 0.1Banks-Export/Import . . . . . . . . . . . . . . . . . . . . . . . . . . . . . . . . . . . . . . . . . . . 0.1Auto-Heavy Duty Trucks . . . . . . . . . . . . . . . . . . . . . . . . . . . . . . . . . . . . . . . . 0.1Retail-Appliances . . . . . . . . . . . . . . . . . . . . . . . . . . . . . . . . . . . . . . . . . . . . . 0.1Data Processing/Management . . . . . . . . . . . . . . . . . . . . . . . . . . . . . . . . . . . 0.1Chemicals-Plastics . . . . . . . . . . . . . . . . . . . . . . . . . . . . . . . . . . . . . . . . . . . . 0.1Aerospace/Defense-Equipment . . . . . . . . . . . . . . . . . . . . . . . . . . . . . . . . . . . 0.1Internet Connectivity Services . . . . . . . . . . . . . . . . . . . . . . . . . . . . . . . . . . . . 0.1Trucking/Leasing . . . . . . . . . . . . . . . . . . . . . . . . . . . . . . . . . . . . . . . . . . . . . 0.1Finance-Auto Loans . . . . . . . . . . . . . . . . . . . . . . . . . . . . . . . . . . . . . . . . . . . 0.1Food-Dairy Products . . . . . . . . . . . . . . . . . . . . . . . . . . . . . . . . . . . . . . . . . . . 0.1Poultry . . . . . . . . . . . . . . . . . . . . . . . . . . . . . . . . . . . . . . . . . . . . . . . . . . . . . 0.1Metal Processors & Fabrication . . . . . . . . . . . . . . . . . . . . . . . . . . . . . . . . . . 0.1Coal . . . . . . . . . . . . . . . . . . . . . . . . . . . . . . . . . . . . . . . . . . . . . . . . . . . . . . . . 0.1Beverages-Non-alcoholic . . . . . . . . . . . . . . . . . . . . . . . . . . . . . . . . . . . . . . . 0.1Broadcast Services/Program . . . . . . . . . . . . . . . . . . . . . . . . . . . . . . . . . . . . . 0.1Building Societies . . . . . . . . . . . . . . . . . . . . . . . . . . . . . . . . . . . . . . . . . . . . . 0.1Investment Companies . . . . . . . . . . . . . . . . . . . . . . . . . . . . . . . . . . . . . . . . . 0.1Medical-Generic Drugs . . . . . . . . . . . . . . . . . . . . . . . . . . . . . . . . . . . . . . . . . 0.1Oil Field Machinery & Equipment . . . . . . . . . . . . . . . . . . . . . . . . . . . . . . . . . 0.1Medical Products . . . . . . . . . . . . . . . . . . . . . . . . . . . . . . . . . . . . . . . . . . . . . 0.1
16
AIG Strategic Bond FundPORTFOLIO PROFILE — September 30, 2019 — (unaudited) (continued)
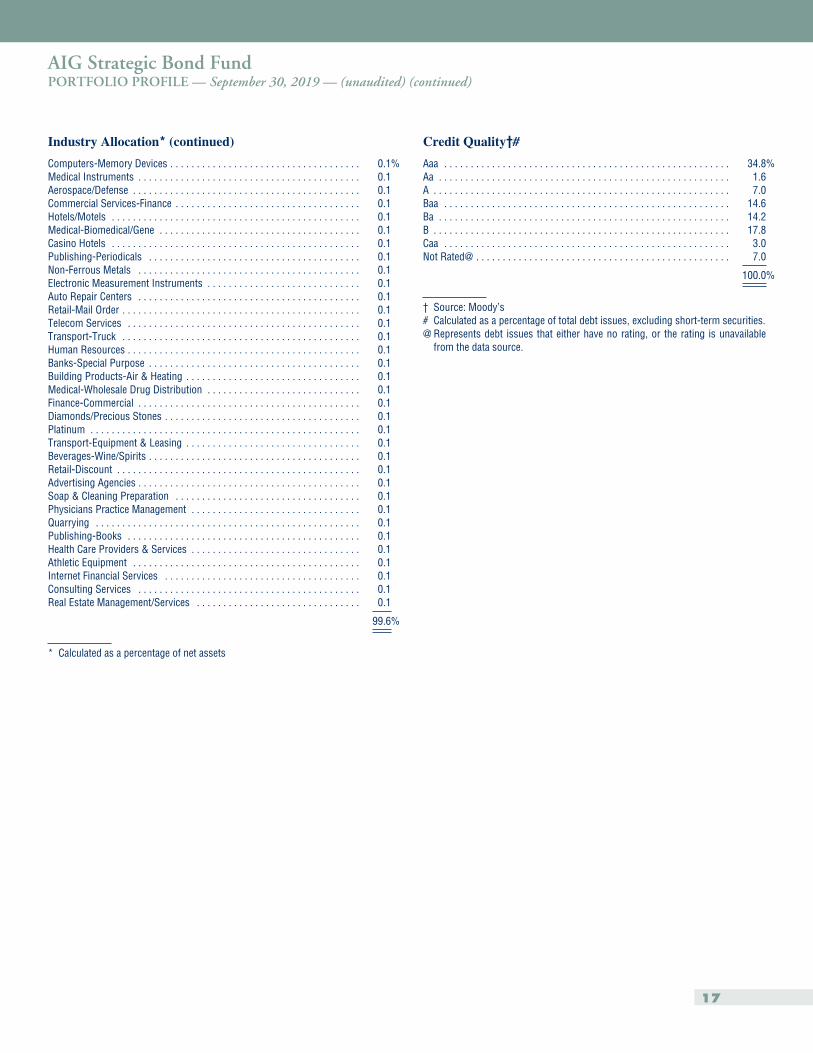
Industry Allocation* (continued)
Computers-Memory Devices . . . . . . . . . . . . . . . . . . . . . . . . . . . . . . . . . . . . 0.1%Medical Instruments . . . . . . . . . . . . . . . . . . . . . . . . . . . . . . . . . . . . . . . . . . 0.1Aerospace/Defense . . . . . . . . . . . . . . . . . . . . . . . . . . . . . . . . . . . . . . . . . . . 0.1Commercial Services-Finance . . . . . . . . . . . . . . . . . . . . . . . . . . . . . . . . . . . 0.1Hotels/Motels . . . . . . . . . . . . . . . . . . . . . . . . . . . . . . . . . . . . . . . . . . . . . . . 0.1Medical-Biomedical/Gene . . . . . . . . . . . . . . . . . . . . . . . . . . . . . . . . . . . . . . 0.1Casino Hotels . . . . . . . . . . . . . . . . . . . . . . . . . . . . . . . . . . . . . . . . . . . . . . . 0.1Publishing-Periodicals . . . . . . . . . . . . . . . . . . . . . . . . . . . . . . . . . . . . . . . . 0.1Non-Ferrous Metals . . . . . . . . . . . . . . . . . . . . . . . . . . . . . . . . . . . . . . . . . . 0.1Electronic Measurement Instruments . . . . . . . . . . . . . . . . . . . . . . . . . . . . . 0.1Auto Repair Centers . . . . . . . . . . . . . . . . . . . . . . . . . . . . . . . . . . . . . . . . . . 0.1Retail-Mail Order . . . . . . . . . . . . . . . . . . . . . . . . . . . . . . . . . . . . . . . . . . . . . 0.1Telecom Services . . . . . . . . . . . . . . . . . . . . . . . . . . . . . . . . . . . . . . . . . . . . 0.1Transport-Truck . . . . . . . . . . . . . . . . . . . . . . . . . . . . . . . . . . . . . . . . . . . . . 0.1Human Resources . . . . . . . . . . . . . . . . . . . . . . . . . . . . . . . . . . . . . . . . . . . . 0.1Banks-Special Purpose . . . . . . . . . . . . . . . . . . . . . . . . . . . . . . . . . . . . . . . . 0.1Building Products-Air & Heating . . . . . . . . . . . . . . . . . . . . . . . . . . . . . . . . . 0.1Medical-Wholesale Drug Distribution . . . . . . . . . . . . . . . . . . . . . . . . . . . . . 0.1Finance-Commercial . . . . . . . . . . . . . . . . . . . . . . . . . . . . . . . . . . . . . . . . . . 0.1Diamonds/Precious Stones . . . . . . . . . . . . . . . . . . . . . . . . . . . . . . . . . . . . . 0.1Platinum . . . . . . . . . . . . . . . . . . . . . . . . . . . . . . . . . . . . . . . . . . . . . . . . . . . 0.1Transport-Equipment & Leasing . . . . . . . . . . . . . . . . . . . . . . . . . . . . . . . . . 0.1Beverages-Wine/Spirits . . . . . . . . . . . . . . . . . . . . . . . . . . . . . . . . . . . . . . . . 0.1Retail-Discount . . . . . . . . . . . . . . . . . . . . . . . . . . . . . . . . . . . . . . . . . . . . . . 0.1Advertising Agencies . . . . . . . . . . . . . . . . . . . . . . . . . . . . . . . . . . . . . . . . . . 0.1Soap & Cleaning Preparation . . . . . . . . . . . . . . . . . . . . . . . . . . . . . . . . . . . 0.1Physicians Practice Management . . . . . . . . . . . . . . . . . . . . . . . . . . . . . . . . 0.1Quarrying . . . . . . . . . . . . . . . . . . . . . . . . . . . . . . . . . . . . . . . . . . . . . . . . . . 0.1Publishing-Books . . . . . . . . . . . . . . . . . . . . . . . . . . . . . . . . . . . . . . . . . . . . 0.1Health Care Providers & Services . . . . . . . . . . . . . . . . . . . . . . . . . . . . . . . . 0.1Athletic Equipment . . . . . . . . . . . . . . . . . . . . . . . . . . . . . . . . . . . . . . . . . . . 0.1Internet Financial Services . . . . . . . . . . . . . . . . . . . . . . . . . . . . . . . . . . . . . 0.1Consulting Services . . . . . . . . . . . . . . . . . . . . . . . . . . . . . . . . . . . . . . . . . . 0.1Real Estate Management/Services . . . . . . . . . . . . . . . . . . . . . . . . . . . . . . . 0.1
99.6%
* Calculated as a percentage of net assets
Credit Quality†#
Aaa . . . . . . . . . . . . . . . . . . . . . . . . . . . . . . . . . . . . . . . . . . . . . . . . . . . . . . 34.8%Aa . . . . . . . . . . . . . . . . . . . . . . . . . . . . . . . . . . . . . . . . . . . . . . . . . . . . . . . 1.6A . . . . . . . . . . . . . . . . . . . . . . . . . . . . . . . . . . . . . . . . . . . . . . . . . . . . . . . . 7.0Baa . . . . . . . . . . . . . . . . . . . . . . . . . . . . . . . . . . . . . . . . . . . . . . . . . . . . . . 14.6Ba . . . . . . . . . . . . . . . . . . . . . . . . . . . . . . . . . . . . . . . . . . . . . . . . . . . . . . . 14.2B . . . . . . . . . . . . . . . . . . . . . . . . . . . . . . . . . . . . . . . . . . . . . . . . . . . . . . . . 17.8Caa . . . . . . . . . . . . . . . . . . . . . . . . . . . . . . . . . . . . . . . . . . . . . . . . . . . . . . 3.0Not Rated@ . . . . . . . . . . . . . . . . . . . . . . . . . . . . . . . . . . . . . . . . . . . . . . . . 7.0
100.0%
† Source: Moody’s# Calculated as a percentage of total debt issues, excluding short-term securities.@ Represents debt issues that either have no rating, or the rating is unavailable
from the data source.
17
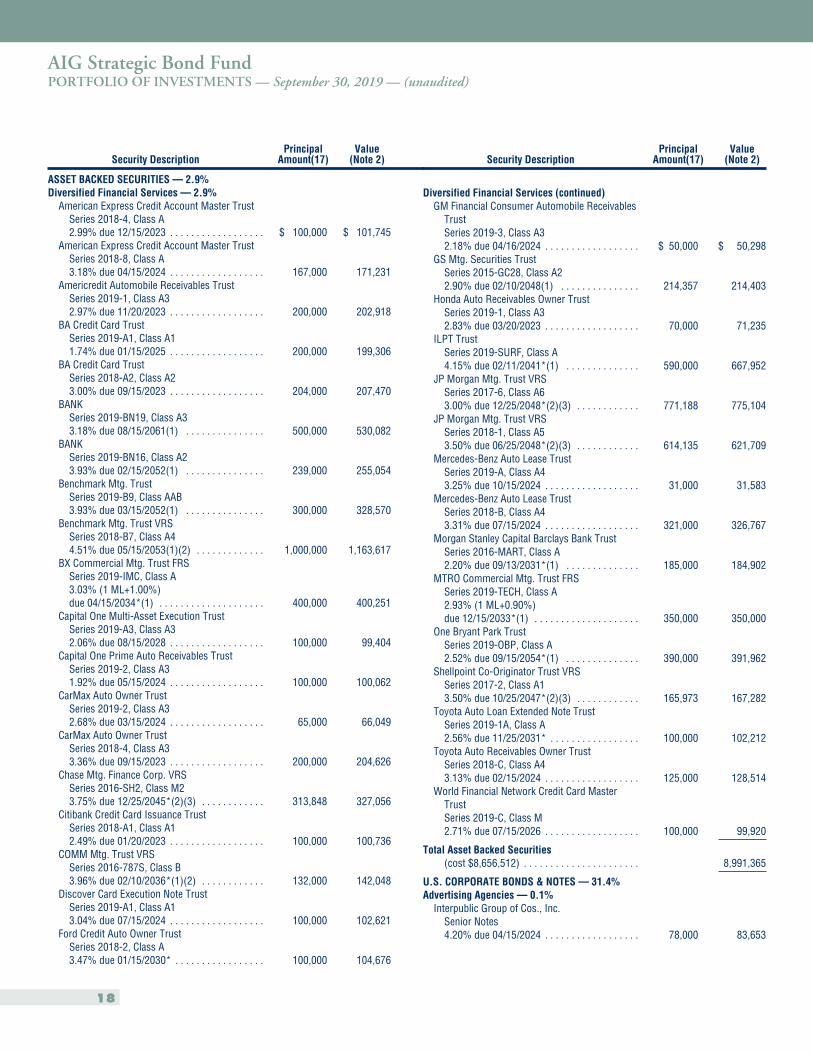
AIG Strategic Bond FundPORTFOLIO OF INVESTMENTS — September 30, 2019 — (unaudited)
Security DescriptionPrincipal
Amount(17)Value
(Note 2)
ASSET BACKED SECURITIES — 2.9%Diversified Financial Services — 2.9%
American Express Credit Account Master TrustSeries 2018-4, Class A2.99% due 12/15/2023 . . . . . . . . . . . . . . . . . . $ 100,000 $ 101,745
American Express Credit Account Master TrustSeries 2018-8, Class A3.18% due 04/15/2024 . . . . . . . . . . . . . . . . . . 167,000 171,231
Americredit Automobile Receivables TrustSeries 2019-1, Class A32.97% due 11/20/2023 . . . . . . . . . . . . . . . . . . 200,000 202,918
BA Credit Card TrustSeries 2019-A1, Class A11.74% due 01/15/2025 . . . . . . . . . . . . . . . . . . 200,000 199,306
BA Credit Card TrustSeries 2018-A2, Class A23.00% due 09/15/2023 . . . . . . . . . . . . . . . . . . 204,000 207,470
BANKSeries 2019-BN19, Class A33.18% due 08/15/2061(1) . . . . . . . . . . . . . . . 500,000 530,082
BANKSeries 2019-BN16, Class A23.93% due 02/15/2052(1) . . . . . . . . . . . . . . . 239,000 255,054
Benchmark Mtg. TrustSeries 2019-B9, Class AAB3.93% due 03/15/2052(1) . . . . . . . . . . . . . . . 300,000 328,570
Benchmark Mtg. Trust VRSSeries 2018-B7, Class A44.51% due 05/15/2053(1)(2) . . . . . . . . . . . . . 1,000,000 1,163,617
BX Commercial Mtg. Trust FRSSeries 2019-IMC, Class A3.03% (1 ML+1.00%)due 04/15/2034*(1) . . . . . . . . . . . . . . . . . . . . 400,000 400,251
Capital One Multi-Asset Execution TrustSeries 2019-A3, Class A32.06% due 08/15/2028 . . . . . . . . . . . . . . . . . . 100,000 99,404
Capital One Prime Auto Receivables TrustSeries 2019-2, Class A31.92% due 05/15/2024 . . . . . . . . . . . . . . . . . . 100,000 100,062
CarMax Auto Owner TrustSeries 2019-2, Class A32.68% due 03/15/2024 . . . . . . . . . . . . . . . . . . 65,000 66,049
CarMax Auto Owner TrustSeries 2018-4, Class A33.36% due 09/15/2023 . . . . . . . . . . . . . . . . . . 200,000 204,626
Chase Mtg. Finance Corp. VRSSeries 2016-SH2, Class M23.75% due 12/25/2045*(2)(3) . . . . . . . . . . . . 313,848 327,056
Citibank Credit Card Issuance TrustSeries 2018-A1, Class A12.49% due 01/20/2023 . . . . . . . . . . . . . . . . . . 100,000 100,736
COMM Mtg. Trust VRSSeries 2016-787S, Class B3.96% due 02/10/2036*(1)(2) . . . . . . . . . . . . 132,000 142,048
Discover Card Execution Note TrustSeries 2019-A1, Class A13.04% due 07/15/2024 . . . . . . . . . . . . . . . . . . 100,000 102,621
Ford Credit Auto Owner TrustSeries 2018-2, Class A3.47% due 01/15/2030* . . . . . . . . . . . . . . . . . 100,000 104,676
Security DescriptionPrincipal
Amount(17)Value
(Note 2)
Diversified Financial Services (continued)GM Financial Consumer Automobile Receivables
TrustSeries 2019-3, Class A32.18% due 04/16/2024 . . . . . . . . . . . . . . . . . . $ 50,000 $ 50,298
GS Mtg. Securities TrustSeries 2015-GC28, Class A22.90% due 02/10/2048(1) . . . . . . . . . . . . . . . 214,357 214,403
Honda Auto Receivables Owner TrustSeries 2019-1, Class A32.83% due 03/20/2023 . . . . . . . . . . . . . . . . . . 70,000 71,235
ILPT TrustSeries 2019-SURF, Class A4.15% due 02/11/2041*(1) . . . . . . . . . . . . . . 590,000 667,952
JP Morgan Mtg. Trust VRSSeries 2017-6, Class A63.00% due 12/25/2048*(2)(3) . . . . . . . . . . . . 771,188 775,104
JP Morgan Mtg. Trust VRSSeries 2018-1, Class A53.50% due 06/25/2048*(2)(3) . . . . . . . . . . . . 614,135 621,709
Mercedes-Benz Auto Lease TrustSeries 2019-A, Class A43.25% due 10/15/2024 . . . . . . . . . . . . . . . . . . 31,000 31,583
Mercedes-Benz Auto Lease TrustSeries 2018-B, Class A43.31% due 07/15/2024 . . . . . . . . . . . . . . . . . . 321,000 326,767
Morgan Stanley Capital Barclays Bank TrustSeries 2016-MART, Class A2.20% due 09/13/2031*(1) . . . . . . . . . . . . . . 185,000 184,902
MTRO Commercial Mtg. Trust FRSSeries 2019-TECH, Class A2.93% (1 ML+0.90%)due 12/15/2033*(1) . . . . . . . . . . . . . . . . . . . . 350,000 350,000
One Bryant Park TrustSeries 2019-OBP, Class A2.52% due 09/15/2054*(1) . . . . . . . . . . . . . . 390,000 391,962
Shellpoint Co-Originator Trust VRSSeries 2017-2, Class A13.50% due 10/25/2047*(2)(3) . . . . . . . . . . . . 165,973 167,282
Toyota Auto Loan Extended Note TrustSeries 2019-1A, Class A2.56% due 11/25/2031* . . . . . . . . . . . . . . . . . 100,000 102,212
Toyota Auto Receivables Owner TrustSeries 2018-C, Class A43.13% due 02/15/2024 . . . . . . . . . . . . . . . . . . 125,000 128,514
World Financial Network Credit Card MasterTrustSeries 2019-C, Class M2.71% due 07/15/2026 . . . . . . . . . . . . . . . . . . 100,000 99,920
Total Asset Backed Securities(cost $8,656,512) . . . . . . . . . . . . . . . . . . . . . . 8,991,365
U.S. CORPORATE BONDS & NOTES — 31.4%Advertising Agencies — 0.1%
Interpublic Group of Cos., Inc.Senior Notes4.20% due 04/15/2024 . . . . . . . . . . . . . . . . . . 78,000 83,653
18
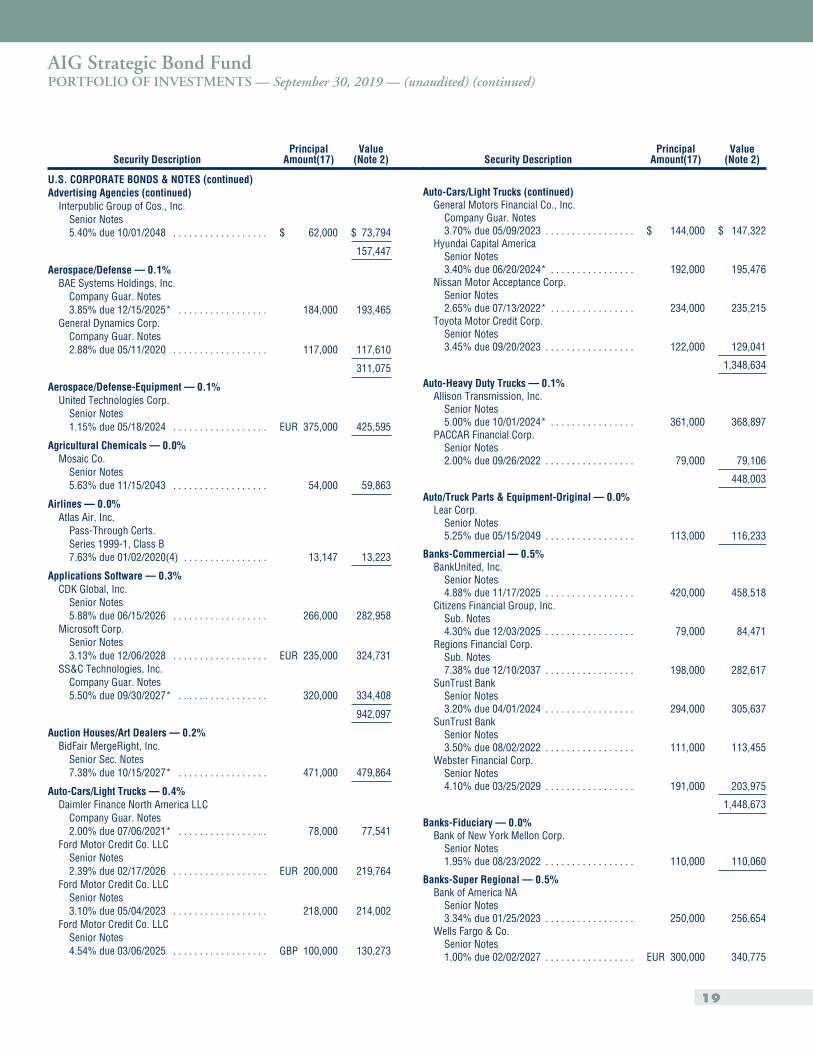
AIG Strategic Bond FundPORTFOLIO OF INVESTMENTS — September 30, 2019 — (unaudited) (continued)
Security DescriptionPrincipal
Amount(17)Value
(Note 2)
U.S. CORPORATE BONDS & NOTES (continued)Advertising Agencies (continued)
Interpublic Group of Cos., Inc.Senior Notes5.40% due 10/01/2048 . . . . . . . . . . . . . . . . . . $ 62,000 $ 73,794
157,447
Aerospace/Defense — 0.1%BAE Systems Holdings, Inc.
Company Guar. Notes3.85% due 12/15/2025* . . . . . . . . . . . . . . . . . 184,000 193,465
General Dynamics Corp.Company Guar. Notes2.88% due 05/11/2020 . . . . . . . . . . . . . . . . . . 117,000 117,610
311,075
Aerospace/Defense-Equipment — 0.1%United Technologies Corp.
Senior Notes1.15% due 05/18/2024 . . . . . . . . . . . . . . . . . . EUR 375,000 425,595
Agricultural Chemicals — 0.0%Mosaic Co.
Senior Notes5.63% due 11/15/2043 . . . . . . . . . . . . . . . . . . 54,000 59,863
Airlines — 0.0%Atlas Air, Inc.
Pass-Through Certs.Series 1999-1, Class B7.63% due 01/02/2020(4) . . . . . . . . . . . . . . . . 13,147 13,223
Applications Software — 0.3%CDK Global, Inc.
Senior Notes5.88% due 06/15/2026 . . . . . . . . . . . . . . . . . . 266,000 282,958
Microsoft Corp.Senior Notes3.13% due 12/06/2028 . . . . . . . . . . . . . . . . . . EUR 235,000 324,731
SS&C Technologies, Inc.Company Guar. Notes5.50% due 09/30/2027* . . . . . . . . . . . . . . . . . 320,000 334,408
942,097
Auction Houses/Art Dealers — 0.2%BidFair MergeRight, Inc.
Senior Sec. Notes7.38% due 10/15/2027* . . . . . . . . . . . . . . . . . 471,000 479,864
Auto-Cars/Light Trucks — 0.4%Daimler Finance North America LLC
Company Guar. Notes2.00% due 07/06/2021* . . . . . . . . . . . . . . . . . 78,000 77,541
Ford Motor Credit Co. LLCSenior Notes2.39% due 02/17/2026 . . . . . . . . . . . . . . . . . . EUR 200,000 219,764
Ford Motor Credit Co. LLCSenior Notes3.10% due 05/04/2023 . . . . . . . . . . . . . . . . . . 218,000 214,002
Ford Motor Credit Co. LLCSenior Notes4.54% due 03/06/2025 . . . . . . . . . . . . . . . . . . GBP 100,000 130,273
Security DescriptionPrincipal
Amount(17)Value
(Note 2)
Auto-Cars/Light Trucks (continued)General Motors Financial Co., Inc.
Company Guar. Notes3.70% due 05/09/2023 . . . . . . . . . . . . . . . . . $ 144,000 $ 147,322
Hyundai Capital AmericaSenior Notes3.40% due 06/20/2024* . . . . . . . . . . . . . . . . 192,000 195,476
Nissan Motor Acceptance Corp.Senior Notes2.65% due 07/13/2022* . . . . . . . . . . . . . . . . 234,000 235,215
Toyota Motor Credit Corp.Senior Notes3.45% due 09/20/2023 . . . . . . . . . . . . . . . . . 122,000 129,041
1,348,634
Auto-Heavy Duty Trucks — 0.1%Allison Transmission, Inc.
Senior Notes5.00% due 10/01/2024* . . . . . . . . . . . . . . . . 361,000 368,897
PACCAR Financial Corp.Senior Notes2.00% due 09/26/2022 . . . . . . . . . . . . . . . . . 79,000 79,106
448,003
Auto/Truck Parts & Equipment-Original — 0.0%Lear Corp.
Senior Notes5.25% due 05/15/2049 . . . . . . . . . . . . . . . . . 113,000 116,233
Banks-Commercial — 0.5%BankUnited, Inc.
Senior Notes4.88% due 11/17/2025 . . . . . . . . . . . . . . . . . 420,000 458,518
Citizens Financial Group, Inc.Sub. Notes4.30% due 12/03/2025 . . . . . . . . . . . . . . . . . 79,000 84,471
Regions Financial Corp.Sub. Notes7.38% due 12/10/2037 . . . . . . . . . . . . . . . . . 198,000 282,617
SunTrust BankSenior Notes3.20% due 04/01/2024 . . . . . . . . . . . . . . . . . 294,000 305,637
SunTrust BankSenior Notes3.50% due 08/02/2022 . . . . . . . . . . . . . . . . . 111,000 113,455
Webster Financial Corp.Senior Notes4.10% due 03/25/2029 . . . . . . . . . . . . . . . . . 191,000 203,975
1,448,673
Banks-Fiduciary — 0.0%Bank of New York Mellon Corp.
Senior Notes1.95% due 08/23/2022 . . . . . . . . . . . . . . . . . 110,000 110,060
Banks-Super Regional — 0.5%Bank of America NA
Senior Notes3.34% due 01/25/2023 . . . . . . . . . . . . . . . . . 250,000 256,654
Wells Fargo & Co.Senior Notes1.00% due 02/02/2027 . . . . . . . . . . . . . . . . . EUR 300,000 340,775
19
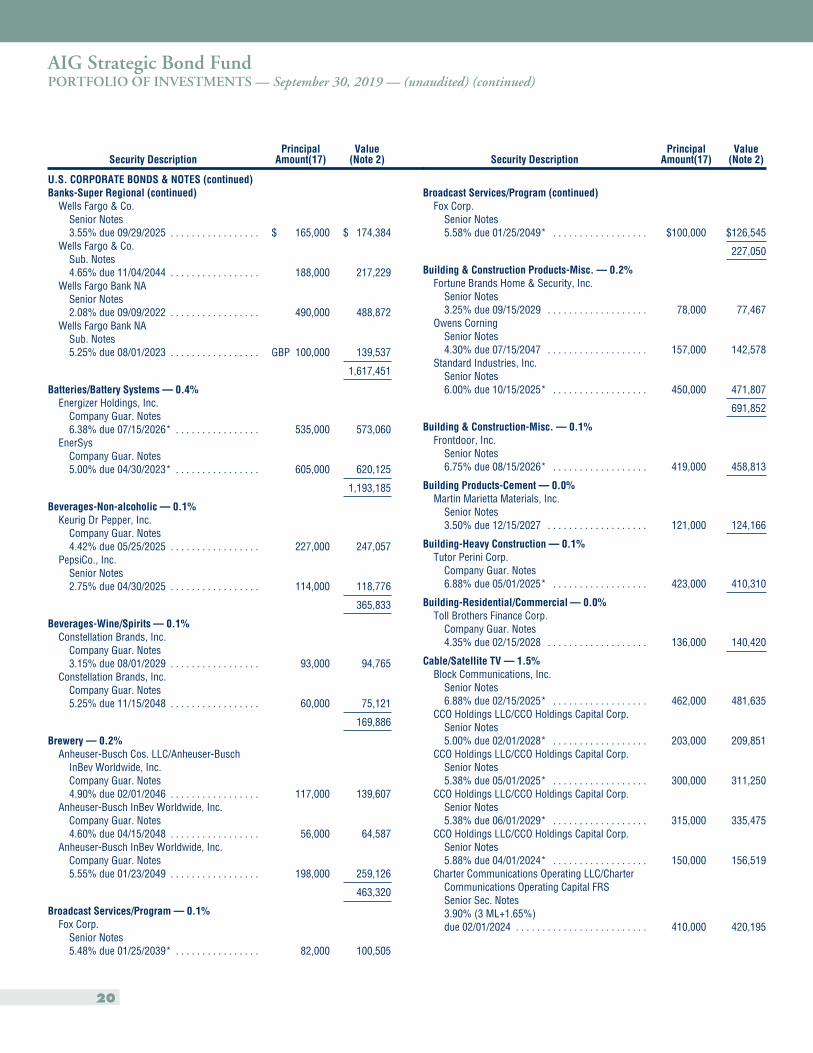
AIG Strategic Bond FundPORTFOLIO OF INVESTMENTS — September 30, 2019 — (unaudited) (continued)
Security DescriptionPrincipal
Amount(17)Value
(Note 2)
U.S. CORPORATE BONDS & NOTES (continued)Banks-Super Regional (continued)
Wells Fargo & Co.Senior Notes3.55% due 09/29/2025 . . . . . . . . . . . . . . . . . $ 165,000 $ 174,384
Wells Fargo & Co.Sub. Notes4.65% due 11/04/2044 . . . . . . . . . . . . . . . . . 188,000 217,229
Wells Fargo Bank NASenior Notes2.08% due 09/09/2022 . . . . . . . . . . . . . . . . . 490,000 488,872
Wells Fargo Bank NASub. Notes5.25% due 08/01/2023 . . . . . . . . . . . . . . . . . GBP 100,000 139,537
1,617,451
Batteries/Battery Systems — 0.4%Energizer Holdings, Inc.
Company Guar. Notes6.38% due 07/15/2026* . . . . . . . . . . . . . . . . 535,000 573,060
EnerSysCompany Guar. Notes5.00% due 04/30/2023* . . . . . . . . . . . . . . . . 605,000 620,125
1,193,185
Beverages-Non-alcoholic — 0.1%Keurig Dr Pepper, Inc.
Company Guar. Notes4.42% due 05/25/2025 . . . . . . . . . . . . . . . . . 227,000 247,057
PepsiCo., Inc.Senior Notes2.75% due 04/30/2025 . . . . . . . . . . . . . . . . . 114,000 118,776
365,833
Beverages-Wine/Spirits — 0.1%Constellation Brands, Inc.
Company Guar. Notes3.15% due 08/01/2029 . . . . . . . . . . . . . . . . . 93,000 94,765
Constellation Brands, Inc.Company Guar. Notes5.25% due 11/15/2048 . . . . . . . . . . . . . . . . . 60,000 75,121
169,886
Brewery — 0.2%Anheuser-Busch Cos. LLC/Anheuser-Busch
InBev Worldwide, Inc.Company Guar. Notes4.90% due 02/01/2046 . . . . . . . . . . . . . . . . . 117,000 139,607
Anheuser-Busch InBev Worldwide, Inc.Company Guar. Notes4.60% due 04/15/2048 . . . . . . . . . . . . . . . . . 56,000 64,587
Anheuser-Busch InBev Worldwide, Inc.Company Guar. Notes5.55% due 01/23/2049 . . . . . . . . . . . . . . . . . 198,000 259,126
463,320
Broadcast Services/Program — 0.1%Fox Corp.
Senior Notes5.48% due 01/25/2039* . . . . . . . . . . . . . . . . 82,000 100,505
Security DescriptionPrincipal
Amount(17)Value
(Note 2)
Broadcast Services/Program (continued)Fox Corp.
Senior Notes5.58% due 01/25/2049* . . . . . . . . . . . . . . . . . . $100,000 $126,545
227,050
Building & Construction Products-Misc. — 0.2%Fortune Brands Home & Security, Inc.
Senior Notes3.25% due 09/15/2029 . . . . . . . . . . . . . . . . . . . 78,000 77,467
Owens CorningSenior Notes4.30% due 07/15/2047 . . . . . . . . . . . . . . . . . . . 157,000 142,578
Standard Industries, Inc.Senior Notes6.00% due 10/15/2025* . . . . . . . . . . . . . . . . . . 450,000 471,807
691,852
Building & Construction-Misc. — 0.1%Frontdoor, Inc.
Senior Notes6.75% due 08/15/2026* . . . . . . . . . . . . . . . . . . 419,000 458,813
Building Products-Cement — 0.0%Martin Marietta Materials, Inc.
Senior Notes3.50% due 12/15/2027 . . . . . . . . . . . . . . . . . . . 121,000 124,166
Building-Heavy Construction — 0.1%Tutor Perini Corp.
Company Guar. Notes6.88% due 05/01/2025* . . . . . . . . . . . . . . . . . . 423,000 410,310
Building-Residential/Commercial — 0.0%Toll Brothers Finance Corp.
Company Guar. Notes4.35% due 02/15/2028 . . . . . . . . . . . . . . . . . . . 136,000 140,420
Cable/Satellite TV — 1.5%Block Communications, Inc.
Senior Notes6.88% due 02/15/2025* . . . . . . . . . . . . . . . . . . 462,000 481,635
CCO Holdings LLC/CCO Holdings Capital Corp.Senior Notes5.00% due 02/01/2028* . . . . . . . . . . . . . . . . . . 203,000 209,851
CCO Holdings LLC/CCO Holdings Capital Corp.Senior Notes5.38% due 05/01/2025* . . . . . . . . . . . . . . . . . . 300,000 311,250
CCO Holdings LLC/CCO Holdings Capital Corp.Senior Notes5.38% due 06/01/2029* . . . . . . . . . . . . . . . . . . 315,000 335,475
CCO Holdings LLC/CCO Holdings Capital Corp.Senior Notes5.88% due 04/01/2024* . . . . . . . . . . . . . . . . . . 150,000 156,519
Charter Communications Operating LLC/CharterCommunications Operating Capital FRSSenior Sec. Notes3.90% (3 ML+1.65%)due 02/01/2024 . . . . . . . . . . . . . . . . . . . . . . . . . 410,000 420,195
20
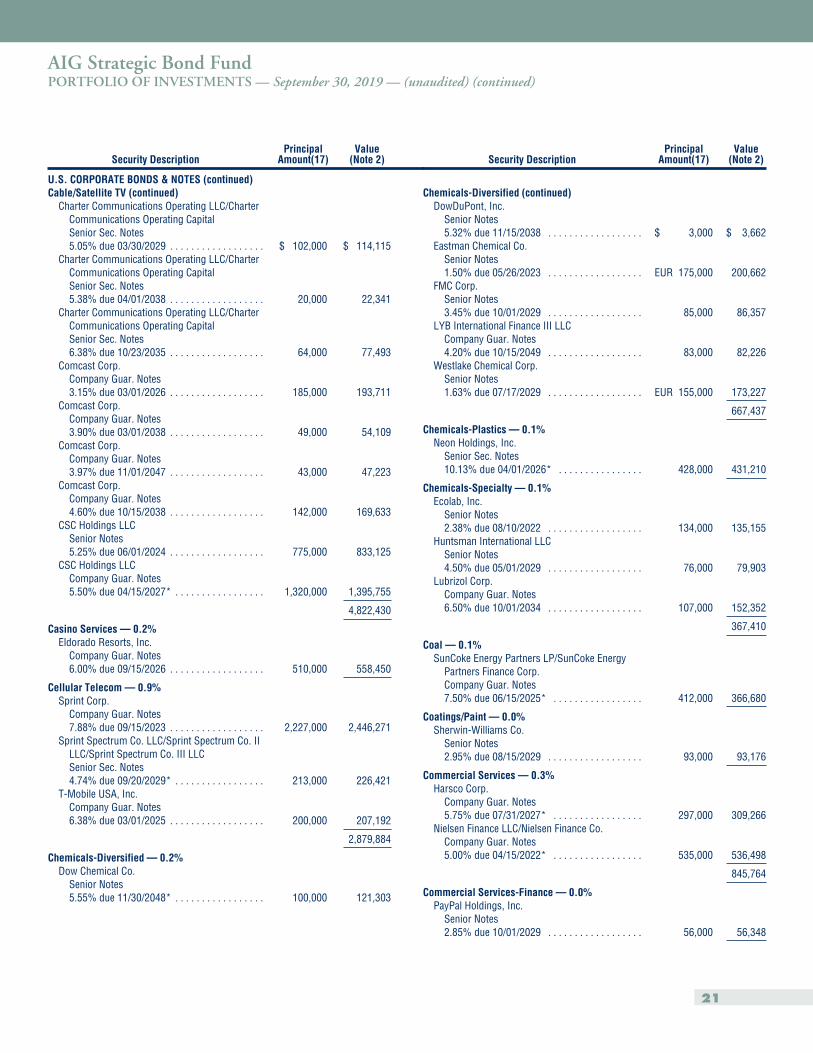
AIG Strategic Bond FundPORTFOLIO OF INVESTMENTS — September 30, 2019 — (unaudited) (continued)
Security DescriptionPrincipal
Amount(17)Value
(Note 2)
U.S. CORPORATE BONDS & NOTES (continued)Cable/Satellite TV (continued)
Charter Communications Operating LLC/CharterCommunications Operating CapitalSenior Sec. Notes5.05% due 03/30/2029 . . . . . . . . . . . . . . . . . . $ 102,000 $ 114,115
Charter Communications Operating LLC/CharterCommunications Operating CapitalSenior Sec. Notes5.38% due 04/01/2038 . . . . . . . . . . . . . . . . . . 20,000 22,341
Charter Communications Operating LLC/CharterCommunications Operating CapitalSenior Sec. Notes6.38% due 10/23/2035 . . . . . . . . . . . . . . . . . . 64,000 77,493
Comcast Corp.Company Guar. Notes3.15% due 03/01/2026 . . . . . . . . . . . . . . . . . . 185,000 193,711
Comcast Corp.Company Guar. Notes3.90% due 03/01/2038 . . . . . . . . . . . . . . . . . . 49,000 54,109
Comcast Corp.Company Guar. Notes3.97% due 11/01/2047 . . . . . . . . . . . . . . . . . . 43,000 47,223
Comcast Corp.Company Guar. Notes4.60% due 10/15/2038 . . . . . . . . . . . . . . . . . . 142,000 169,633
CSC Holdings LLCSenior Notes5.25% due 06/01/2024 . . . . . . . . . . . . . . . . . . 775,000 833,125
CSC Holdings LLCCompany Guar. Notes5.50% due 04/15/2027* . . . . . . . . . . . . . . . . . 1,320,000 1,395,755
4,822,430
Casino Services — 0.2%Eldorado Resorts, Inc.
Company Guar. Notes6.00% due 09/15/2026 . . . . . . . . . . . . . . . . . . 510,000 558,450
Cellular Telecom — 0.9%Sprint Corp.
Company Guar. Notes7.88% due 09/15/2023 . . . . . . . . . . . . . . . . . . 2,227,000 2,446,271
Sprint Spectrum Co. LLC/Sprint Spectrum Co. IILLC/Sprint Spectrum Co. III LLCSenior Sec. Notes4.74% due 09/20/2029* . . . . . . . . . . . . . . . . . 213,000 226,421
T-Mobile USA, Inc.Company Guar. Notes6.38% due 03/01/2025 . . . . . . . . . . . . . . . . . . 200,000 207,192
2,879,884
Chemicals-Diversified — 0.2%Dow Chemical Co.
Senior Notes5.55% due 11/30/2048* . . . . . . . . . . . . . . . . . 100,000 121,303
Security DescriptionPrincipal
Amount(17)Value
(Note 2)
Chemicals-Diversified (continued)DowDuPont, Inc.
Senior Notes5.32% due 11/15/2038 . . . . . . . . . . . . . . . . . . $ 3,000 $ 3,662
Eastman Chemical Co.Senior Notes1.50% due 05/26/2023 . . . . . . . . . . . . . . . . . . EUR 175,000 200,662
FMC Corp.Senior Notes3.45% due 10/01/2029 . . . . . . . . . . . . . . . . . . 85,000 86,357
LYB International Finance III LLCCompany Guar. Notes4.20% due 10/15/2049 . . . . . . . . . . . . . . . . . . 83,000 82,226
Westlake Chemical Corp.Senior Notes1.63% due 07/17/2029 . . . . . . . . . . . . . . . . . . EUR 155,000 173,227
667,437
Chemicals-Plastics — 0.1%Neon Holdings, Inc.
Senior Sec. Notes10.13% due 04/01/2026* . . . . . . . . . . . . . . . . 428,000 431,210
Chemicals-Specialty — 0.1%Ecolab, Inc.
Senior Notes2.38% due 08/10/2022 . . . . . . . . . . . . . . . . . . 134,000 135,155
Huntsman International LLCSenior Notes4.50% due 05/01/2029 . . . . . . . . . . . . . . . . . . 76,000 79,903
Lubrizol Corp.Company Guar. Notes6.50% due 10/01/2034 . . . . . . . . . . . . . . . . . . 107,000 152,352
367,410
Coal — 0.1%SunCoke Energy Partners LP/SunCoke Energy
Partners Finance Corp.Company Guar. Notes7.50% due 06/15/2025* . . . . . . . . . . . . . . . . . 412,000 366,680
Coatings/Paint — 0.0%Sherwin-Williams Co.
Senior Notes2.95% due 08/15/2029 . . . . . . . . . . . . . . . . . . 93,000 93,176
Commercial Services — 0.3%Harsco Corp.
Company Guar. Notes5.75% due 07/31/2027* . . . . . . . . . . . . . . . . . 297,000 309,266
Nielsen Finance LLC/Nielsen Finance Co.Company Guar. Notes5.00% due 04/15/2022* . . . . . . . . . . . . . . . . . 535,000 536,498
845,764
Commercial Services-Finance — 0.0%PayPal Holdings, Inc.
Senior Notes2.85% due 10/01/2029 . . . . . . . . . . . . . . . . . . 56,000 56,348
21
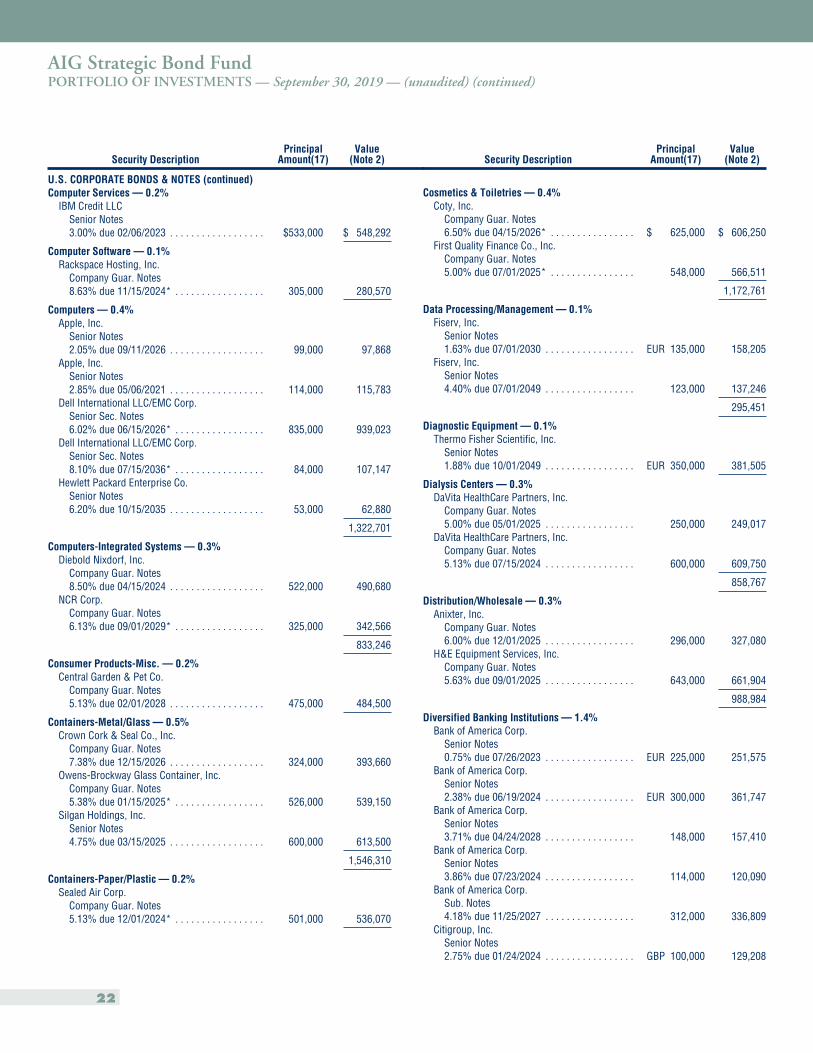
AIG Strategic Bond FundPORTFOLIO OF INVESTMENTS — September 30, 2019 — (unaudited) (continued)
Security DescriptionPrincipal
Amount(17)Value
(Note 2)
U.S. CORPORATE BONDS & NOTES (continued)Computer Services — 0.2%
IBM Credit LLCSenior Notes3.00% due 02/06/2023 . . . . . . . . . . . . . . . . . . $533,000 $ 548,292
Computer Software — 0.1%Rackspace Hosting, Inc.
Company Guar. Notes8.63% due 11/15/2024* . . . . . . . . . . . . . . . . . 305,000 280,570
Computers — 0.4%Apple, Inc.
Senior Notes2.05% due 09/11/2026 . . . . . . . . . . . . . . . . . . 99,000 97,868
Apple, Inc.Senior Notes2.85% due 05/06/2021 . . . . . . . . . . . . . . . . . . 114,000 115,783
Dell International LLC/EMC Corp.Senior Sec. Notes6.02% due 06/15/2026* . . . . . . . . . . . . . . . . . 835,000 939,023
Dell International LLC/EMC Corp.Senior Sec. Notes8.10% due 07/15/2036* . . . . . . . . . . . . . . . . . 84,000 107,147
Hewlett Packard Enterprise Co.Senior Notes6.20% due 10/15/2035 . . . . . . . . . . . . . . . . . . 53,000 62,880
1,322,701
Computers-Integrated Systems — 0.3%Diebold Nixdorf, Inc.
Company Guar. Notes8.50% due 04/15/2024 . . . . . . . . . . . . . . . . . . 522,000 490,680
NCR Corp.Company Guar. Notes6.13% due 09/01/2029* . . . . . . . . . . . . . . . . . 325,000 342,566
833,246
Consumer Products-Misc. — 0.2%Central Garden & Pet Co.
Company Guar. Notes5.13% due 02/01/2028 . . . . . . . . . . . . . . . . . . 475,000 484,500
Containers-Metal/Glass — 0.5%Crown Cork & Seal Co., Inc.
Company Guar. Notes7.38% due 12/15/2026 . . . . . . . . . . . . . . . . . . 324,000 393,660
Owens-Brockway Glass Container, Inc.Company Guar. Notes5.38% due 01/15/2025* . . . . . . . . . . . . . . . . . 526,000 539,150
Silgan Holdings, Inc.Senior Notes4.75% due 03/15/2025 . . . . . . . . . . . . . . . . . . 600,000 613,500
1,546,310
Containers-Paper/Plastic — 0.2%Sealed Air Corp.
Company Guar. Notes5.13% due 12/01/2024* . . . . . . . . . . . . . . . . . 501,000 536,070
Security DescriptionPrincipal
Amount(17)Value
(Note 2)
Cosmetics & Toiletries — 0.4%Coty, Inc.
Company Guar. Notes6.50% due 04/15/2026* . . . . . . . . . . . . . . . . $ 625,000 $ 606,250
First Quality Finance Co., Inc.Company Guar. Notes5.00% due 07/01/2025* . . . . . . . . . . . . . . . . 548,000 566,511
1,172,761
Data Processing/Management — 0.1%Fiserv, Inc.
Senior Notes1.63% due 07/01/2030 . . . . . . . . . . . . . . . . . EUR 135,000 158,205
Fiserv, Inc.Senior Notes4.40% due 07/01/2049 . . . . . . . . . . . . . . . . . 123,000 137,246
295,451
Diagnostic Equipment — 0.1%Thermo Fisher Scientific, Inc.
Senior Notes1.88% due 10/01/2049 . . . . . . . . . . . . . . . . . EUR 350,000 381,505
Dialysis Centers — 0.3%DaVita HealthCare Partners, Inc.
Company Guar. Notes5.00% due 05/01/2025 . . . . . . . . . . . . . . . . . 250,000 249,017
DaVita HealthCare Partners, Inc.Company Guar. Notes5.13% due 07/15/2024 . . . . . . . . . . . . . . . . . 600,000 609,750
858,767
Distribution/Wholesale — 0.3%Anixter, Inc.
Company Guar. Notes6.00% due 12/01/2025 . . . . . . . . . . . . . . . . . 296,000 327,080
H&E Equipment Services, Inc.Company Guar. Notes5.63% due 09/01/2025 . . . . . . . . . . . . . . . . . 643,000 661,904
988,984
Diversified Banking Institutions — 1.4%Bank of America Corp.
Senior Notes0.75% due 07/26/2023 . . . . . . . . . . . . . . . . . EUR 225,000 251,575
Bank of America Corp.Senior Notes2.38% due 06/19/2024 . . . . . . . . . . . . . . . . . EUR 300,000 361,747
Bank of America Corp.Senior Notes3.71% due 04/24/2028 . . . . . . . . . . . . . . . . . 148,000 157,410
Bank of America Corp.Senior Notes3.86% due 07/23/2024 . . . . . . . . . . . . . . . . . 114,000 120,090
Bank of America Corp.Sub. Notes4.18% due 11/25/2027 . . . . . . . . . . . . . . . . . 312,000 336,809
Citigroup, Inc.Senior Notes2.75% due 01/24/2024 . . . . . . . . . . . . . . . . . GBP 100,000 129,208
22
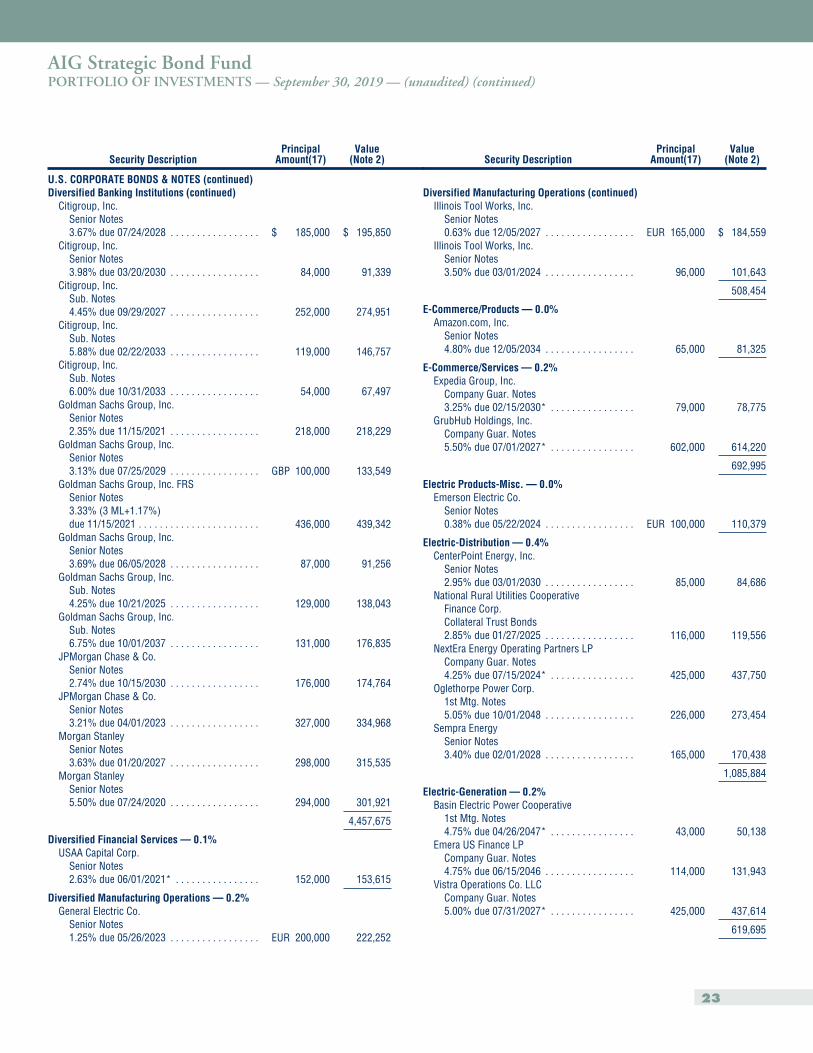
AIG Strategic Bond FundPORTFOLIO OF INVESTMENTS — September 30, 2019 — (unaudited) (continued)
Security DescriptionPrincipal
Amount(17)Value
(Note 2)
U.S. CORPORATE BONDS & NOTES (continued)Diversified Banking Institutions (continued)
Citigroup, Inc.Senior Notes3.67% due 07/24/2028 . . . . . . . . . . . . . . . . . $ 185,000 $ 195,850
Citigroup, Inc.Senior Notes3.98% due 03/20/2030 . . . . . . . . . . . . . . . . . 84,000 91,339
Citigroup, Inc.Sub. Notes4.45% due 09/29/2027 . . . . . . . . . . . . . . . . . 252,000 274,951
Citigroup, Inc.Sub. Notes5.88% due 02/22/2033 . . . . . . . . . . . . . . . . . 119,000 146,757
Citigroup, Inc.Sub. Notes6.00% due 10/31/2033 . . . . . . . . . . . . . . . . . 54,000 67,497
Goldman Sachs Group, Inc.Senior Notes2.35% due 11/15/2021 . . . . . . . . . . . . . . . . . 218,000 218,229
Goldman Sachs Group, Inc.Senior Notes3.13% due 07/25/2029 . . . . . . . . . . . . . . . . . GBP 100,000 133,549
Goldman Sachs Group, Inc. FRSSenior Notes3.33% (3 ML+1.17%)due 11/15/2021 . . . . . . . . . . . . . . . . . . . . . . . 436,000 439,342
Goldman Sachs Group, Inc.Senior Notes3.69% due 06/05/2028 . . . . . . . . . . . . . . . . . 87,000 91,256
Goldman Sachs Group, Inc.Sub. Notes4.25% due 10/21/2025 . . . . . . . . . . . . . . . . . 129,000 138,043
Goldman Sachs Group, Inc.Sub. Notes6.75% due 10/01/2037 . . . . . . . . . . . . . . . . . 131,000 176,835
JPMorgan Chase & Co.Senior Notes2.74% due 10/15/2030 . . . . . . . . . . . . . . . . . 176,000 174,764
JPMorgan Chase & Co.Senior Notes3.21% due 04/01/2023 . . . . . . . . . . . . . . . . . 327,000 334,968
Morgan StanleySenior Notes3.63% due 01/20/2027 . . . . . . . . . . . . . . . . . 298,000 315,535
Morgan StanleySenior Notes5.50% due 07/24/2020 . . . . . . . . . . . . . . . . . 294,000 301,921
4,457,675
Diversified Financial Services — 0.1%USAA Capital Corp.
Senior Notes2.63% due 06/01/2021* . . . . . . . . . . . . . . . . 152,000 153,615
Diversified Manufacturing Operations — 0.2%General Electric Co.
Senior Notes1.25% due 05/26/2023 . . . . . . . . . . . . . . . . . EUR 200,000 222,252
Security DescriptionPrincipal
Amount(17)Value
(Note 2)
Diversified Manufacturing Operations (continued)Illinois Tool Works, Inc.
Senior Notes0.63% due 12/05/2027 . . . . . . . . . . . . . . . . . EUR 165,000 $ 184,559
Illinois Tool Works, Inc.Senior Notes3.50% due 03/01/2024 . . . . . . . . . . . . . . . . . 96,000 101,643
508,454
E-Commerce/Products — 0.0%Amazon.com, Inc.
Senior Notes4.80% due 12/05/2034 . . . . . . . . . . . . . . . . . 65,000 81,325
E-Commerce/Services — 0.2%Expedia Group, Inc.
Company Guar. Notes3.25% due 02/15/2030* . . . . . . . . . . . . . . . . 79,000 78,775
GrubHub Holdings, Inc.Company Guar. Notes5.50% due 07/01/2027* . . . . . . . . . . . . . . . . 602,000 614,220
692,995
Electric Products-Misc. — 0.0%Emerson Electric Co.
Senior Notes0.38% due 05/22/2024 . . . . . . . . . . . . . . . . . EUR 100,000 110,379
Electric-Distribution — 0.4%CenterPoint Energy, Inc.
Senior Notes2.95% due 03/01/2030 . . . . . . . . . . . . . . . . . 85,000 84,686
National Rural Utilities CooperativeFinance Corp.Collateral Trust Bonds2.85% due 01/27/2025 . . . . . . . . . . . . . . . . . 116,000 119,556
NextEra Energy Operating Partners LPCompany Guar. Notes4.25% due 07/15/2024* . . . . . . . . . . . . . . . . 425,000 437,750
Oglethorpe Power Corp.1st Mtg. Notes5.05% due 10/01/2048 . . . . . . . . . . . . . . . . . 226,000 273,454
Sempra EnergySenior Notes3.40% due 02/01/2028 . . . . . . . . . . . . . . . . . 165,000 170,438
1,085,884
Electric-Generation — 0.2%Basin Electric Power Cooperative
1st Mtg. Notes4.75% due 04/26/2047* . . . . . . . . . . . . . . . . 43,000 50,138
Emera US Finance LPCompany Guar. Notes4.75% due 06/15/2046 . . . . . . . . . . . . . . . . . 114,000 131,943
Vistra Operations Co. LLCCompany Guar. Notes5.00% due 07/31/2027* . . . . . . . . . . . . . . . . 425,000 437,614
619,695
23
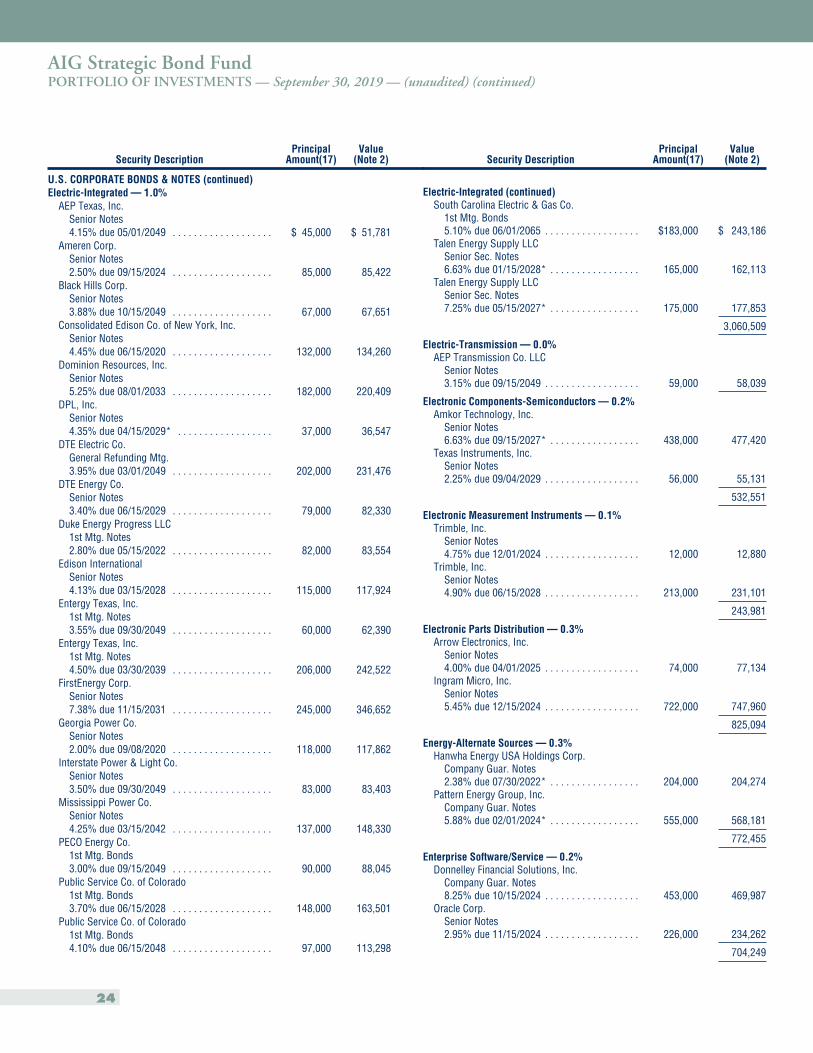
AIG Strategic Bond FundPORTFOLIO OF INVESTMENTS — September 30, 2019 — (unaudited) (continued)
Security DescriptionPrincipal
Amount(17)Value
(Note 2)
U.S. CORPORATE BONDS & NOTES (continued)Electric-Integrated — 1.0%
AEP Texas, Inc.Senior Notes4.15% due 05/01/2049 . . . . . . . . . . . . . . . . . . . $ 45,000 $ 51,781
Ameren Corp.Senior Notes2.50% due 09/15/2024 . . . . . . . . . . . . . . . . . . . 85,000 85,422
Black Hills Corp.Senior Notes3.88% due 10/15/2049 . . . . . . . . . . . . . . . . . . . 67,000 67,651
Consolidated Edison Co. of New York, Inc.Senior Notes4.45% due 06/15/2020 . . . . . . . . . . . . . . . . . . . 132,000 134,260
Dominion Resources, Inc.Senior Notes5.25% due 08/01/2033 . . . . . . . . . . . . . . . . . . . 182,000 220,409
DPL, Inc.Senior Notes4.35% due 04/15/2029* . . . . . . . . . . . . . . . . . . 37,000 36,547
DTE Electric Co.General Refunding Mtg.3.95% due 03/01/2049 . . . . . . . . . . . . . . . . . . . 202,000 231,476
DTE Energy Co.Senior Notes3.40% due 06/15/2029 . . . . . . . . . . . . . . . . . . . 79,000 82,330
Duke Energy Progress LLC1st Mtg. Notes2.80% due 05/15/2022 . . . . . . . . . . . . . . . . . . . 82,000 83,554
Edison InternationalSenior Notes4.13% due 03/15/2028 . . . . . . . . . . . . . . . . . . . 115,000 117,924
Entergy Texas, Inc.1st Mtg. Notes3.55% due 09/30/2049 . . . . . . . . . . . . . . . . . . . 60,000 62,390
Entergy Texas, Inc.1st Mtg. Notes4.50% due 03/30/2039 . . . . . . . . . . . . . . . . . . . 206,000 242,522
FirstEnergy Corp.Senior Notes7.38% due 11/15/2031 . . . . . . . . . . . . . . . . . . . 245,000 346,652
Georgia Power Co.Senior Notes2.00% due 09/08/2020 . . . . . . . . . . . . . . . . . . . 118,000 117,862
Interstate Power & Light Co.Senior Notes3.50% due 09/30/2049 . . . . . . . . . . . . . . . . . . . 83,000 83,403
Mississippi Power Co.Senior Notes4.25% due 03/15/2042 . . . . . . . . . . . . . . . . . . . 137,000 148,330
PECO Energy Co.1st Mtg. Bonds3.00% due 09/15/2049 . . . . . . . . . . . . . . . . . . . 90,000 88,045
Public Service Co. of Colorado1st Mtg. Bonds3.70% due 06/15/2028 . . . . . . . . . . . . . . . . . . . 148,000 163,501
Public Service Co. of Colorado1st Mtg. Bonds4.10% due 06/15/2048 . . . . . . . . . . . . . . . . . . . 97,000 113,298
Security DescriptionPrincipal
Amount(17)Value
(Note 2)
Electric-Integrated (continued)South Carolina Electric & Gas Co.
1st Mtg. Bonds5.10% due 06/01/2065 . . . . . . . . . . . . . . . . . . $183,000 $ 243,186
Talen Energy Supply LLCSenior Sec. Notes6.63% due 01/15/2028* . . . . . . . . . . . . . . . . . 165,000 162,113
Talen Energy Supply LLCSenior Sec. Notes7.25% due 05/15/2027* . . . . . . . . . . . . . . . . . 175,000 177,853
3,060,509
Electric-Transmission — 0.0%AEP Transmission Co. LLC
Senior Notes3.15% due 09/15/2049 . . . . . . . . . . . . . . . . . . 59,000 58,039
Electronic Components-Semiconductors — 0.2%Amkor Technology, Inc.
Senior Notes6.63% due 09/15/2027* . . . . . . . . . . . . . . . . . 438,000 477,420
Texas Instruments, Inc.Senior Notes2.25% due 09/04/2029 . . . . . . . . . . . . . . . . . . 56,000 55,131
532,551
Electronic Measurement Instruments — 0.1%Trimble, Inc.
Senior Notes4.75% due 12/01/2024 . . . . . . . . . . . . . . . . . . 12,000 12,880
Trimble, Inc.Senior Notes4.90% due 06/15/2028 . . . . . . . . . . . . . . . . . . 213,000 231,101
243,981
Electronic Parts Distribution — 0.3%Arrow Electronics, Inc.
Senior Notes4.00% due 04/01/2025 . . . . . . . . . . . . . . . . . . 74,000 77,134
Ingram Micro, Inc.Senior Notes5.45% due 12/15/2024 . . . . . . . . . . . . . . . . . . 722,000 747,960
825,094
Energy-Alternate Sources — 0.3%Hanwha Energy USA Holdings Corp.
Company Guar. Notes2.38% due 07/30/2022* . . . . . . . . . . . . . . . . . 204,000 204,274
Pattern Energy Group, Inc.Company Guar. Notes5.88% due 02/01/2024* . . . . . . . . . . . . . . . . . 555,000 568,181
772,455
Enterprise Software/Service — 0.2%Donnelley Financial Solutions, Inc.
Company Guar. Notes8.25% due 10/15/2024 . . . . . . . . . . . . . . . . . . 453,000 469,987
Oracle Corp.Senior Notes2.95% due 11/15/2024 . . . . . . . . . . . . . . . . . . 226,000 234,262
704,249
24
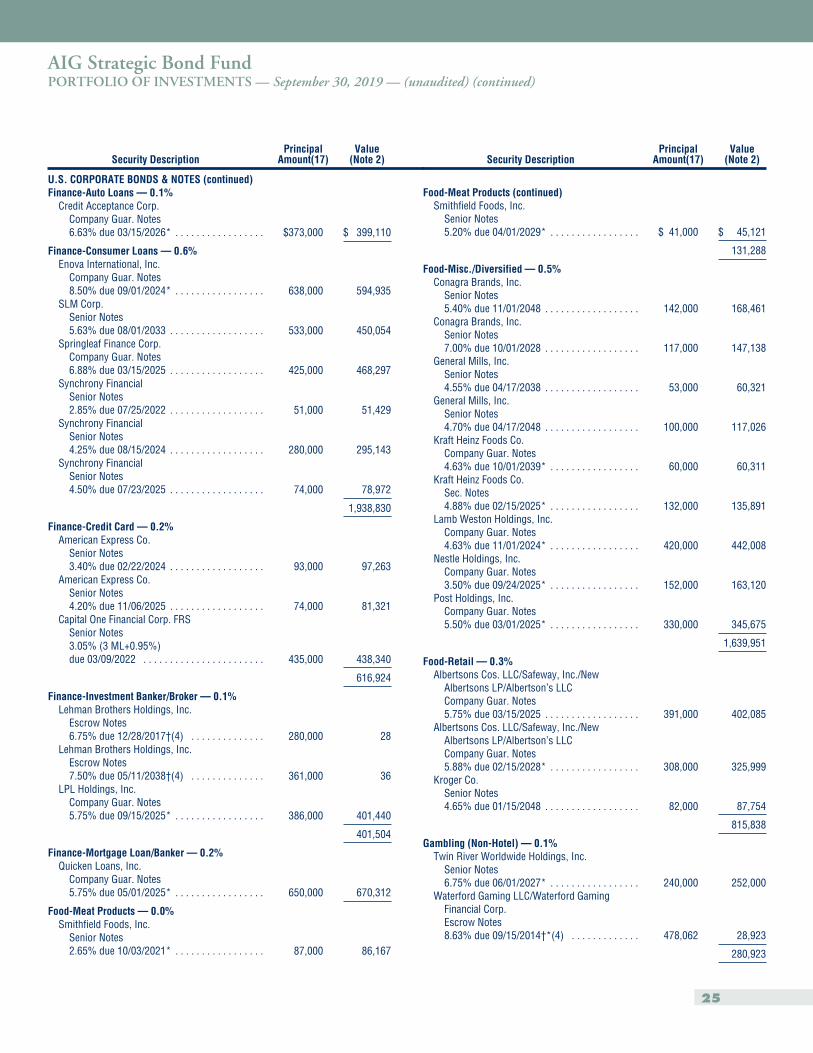
AIG Strategic Bond FundPORTFOLIO OF INVESTMENTS — September 30, 2019 — (unaudited) (continued)
Security DescriptionPrincipal
Amount(17)Value
(Note 2)
U.S. CORPORATE BONDS & NOTES (continued)Finance-Auto Loans — 0.1%
Credit Acceptance Corp.Company Guar. Notes6.63% due 03/15/2026* . . . . . . . . . . . . . . . . . $373,000 $ 399,110
Finance-Consumer Loans — 0.6%Enova International, Inc.
Company Guar. Notes8.50% due 09/01/2024* . . . . . . . . . . . . . . . . . 638,000 594,935
SLM Corp.Senior Notes5.63% due 08/01/2033 . . . . . . . . . . . . . . . . . . 533,000 450,054
Springleaf Finance Corp.Company Guar. Notes6.88% due 03/15/2025 . . . . . . . . . . . . . . . . . . 425,000 468,297
Synchrony FinancialSenior Notes2.85% due 07/25/2022 . . . . . . . . . . . . . . . . . . 51,000 51,429
Synchrony FinancialSenior Notes4.25% due 08/15/2024 . . . . . . . . . . . . . . . . . . 280,000 295,143
Synchrony FinancialSenior Notes4.50% due 07/23/2025 . . . . . . . . . . . . . . . . . . 74,000 78,972
1,938,830
Finance-Credit Card — 0.2%American Express Co.
Senior Notes3.40% due 02/22/2024 . . . . . . . . . . . . . . . . . . 93,000 97,263
American Express Co.Senior Notes4.20% due 11/06/2025 . . . . . . . . . . . . . . . . . . 74,000 81,321
Capital One Financial Corp. FRSSenior Notes3.05% (3 ML+0.95%)due 03/09/2022 . . . . . . . . . . . . . . . . . . . . . . . 435,000 438,340
616,924
Finance-Investment Banker/Broker — 0.1%Lehman Brothers Holdings, Inc.
Escrow Notes6.75% due 12/28/2017†(4) . . . . . . . . . . . . . . 280,000 28
Lehman Brothers Holdings, Inc.Escrow Notes7.50% due 05/11/2038†(4) . . . . . . . . . . . . . . 361,000 36
LPL Holdings, Inc.Company Guar. Notes5.75% due 09/15/2025* . . . . . . . . . . . . . . . . . 386,000 401,440
401,504
Finance-Mortgage Loan/Banker — 0.2%Quicken Loans, Inc.
Company Guar. Notes5.75% due 05/01/2025* . . . . . . . . . . . . . . . . . 650,000 670,312
Food-Meat Products — 0.0%Smithfield Foods, Inc.
Senior Notes2.65% due 10/03/2021* . . . . . . . . . . . . . . . . . 87,000 86,167
Security DescriptionPrincipal
Amount(17)Value
(Note 2)
Food-Meat Products (continued)Smithfield Foods, Inc.
Senior Notes5.20% due 04/01/2029* . . . . . . . . . . . . . . . . . $ 41,000 $ 45,121
131,288
Food-Misc./Diversified — 0.5%Conagra Brands, Inc.
Senior Notes5.40% due 11/01/2048 . . . . . . . . . . . . . . . . . . 142,000 168,461
Conagra Brands, Inc.Senior Notes7.00% due 10/01/2028 . . . . . . . . . . . . . . . . . . 117,000 147,138
General Mills, Inc.Senior Notes4.55% due 04/17/2038 . . . . . . . . . . . . . . . . . . 53,000 60,321
General Mills, Inc.Senior Notes4.70% due 04/17/2048 . . . . . . . . . . . . . . . . . . 100,000 117,026
Kraft Heinz Foods Co.Company Guar. Notes4.63% due 10/01/2039* . . . . . . . . . . . . . . . . . 60,000 60,311
Kraft Heinz Foods Co.Sec. Notes4.88% due 02/15/2025* . . . . . . . . . . . . . . . . . 132,000 135,891
Lamb Weston Holdings, Inc.Company Guar. Notes4.63% due 11/01/2024* . . . . . . . . . . . . . . . . . 420,000 442,008
Nestle Holdings, Inc.Company Guar. Notes3.50% due 09/24/2025* . . . . . . . . . . . . . . . . . 152,000 163,120
Post Holdings, Inc.Company Guar. Notes5.50% due 03/01/2025* . . . . . . . . . . . . . . . . . 330,000 345,675
1,639,951
Food-Retail — 0.3%Albertsons Cos. LLC/Safeway, Inc./New
Albertsons LP/Albertson’s LLCCompany Guar. Notes5.75% due 03/15/2025 . . . . . . . . . . . . . . . . . . 391,000 402,085
Albertsons Cos. LLC/Safeway, Inc./NewAlbertsons LP/Albertson’s LLCCompany Guar. Notes5.88% due 02/15/2028* . . . . . . . . . . . . . . . . . 308,000 325,999
Kroger Co.Senior Notes4.65% due 01/15/2048 . . . . . . . . . . . . . . . . . . 82,000 87,754
815,838
Gambling (Non-Hotel) — 0.1%Twin River Worldwide Holdings, Inc.
Senior Notes6.75% due 06/01/2027* . . . . . . . . . . . . . . . . . 240,000 252,000
Waterford Gaming LLC/Waterford GamingFinancial Corp.Escrow Notes8.63% due 09/15/2014†*(4) . . . . . . . . . . . . . 478,062 28,923
280,923
25
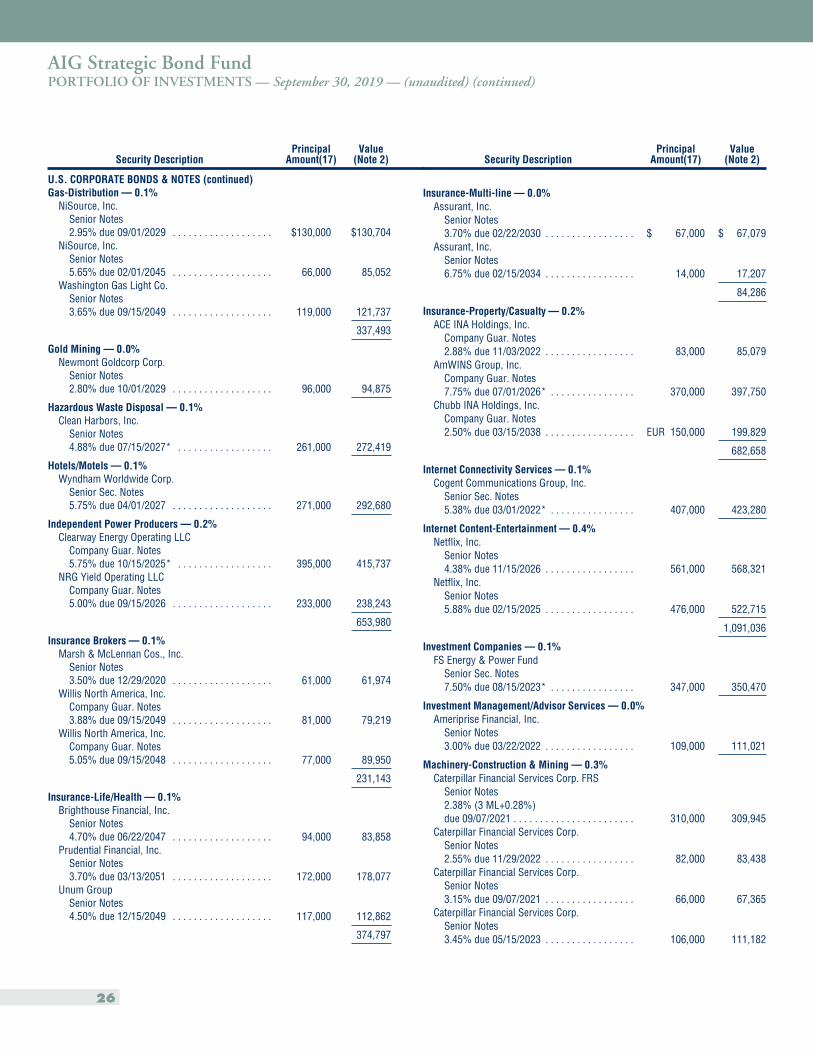
AIG Strategic Bond FundPORTFOLIO OF INVESTMENTS — September 30, 2019 — (unaudited) (continued)
Security DescriptionPrincipal
Amount(17)Value
(Note 2)
U.S. CORPORATE BONDS & NOTES (continued)Gas-Distribution — 0.1%
NiSource, Inc.Senior Notes2.95% due 09/01/2029 . . . . . . . . . . . . . . . . . . . $130,000 $130,704
NiSource, Inc.Senior Notes5.65% due 02/01/2045 . . . . . . . . . . . . . . . . . . . 66,000 85,052
Washington Gas Light Co.Senior Notes3.65% due 09/15/2049 . . . . . . . . . . . . . . . . . . . 119,000 121,737
337,493
Gold Mining — 0.0%Newmont Goldcorp Corp.
Senior Notes2.80% due 10/01/2029 . . . . . . . . . . . . . . . . . . . 96,000 94,875
Hazardous Waste Disposal — 0.1%Clean Harbors, Inc.
Senior Notes4.88% due 07/15/2027* . . . . . . . . . . . . . . . . . . 261,000 272,419
Hotels/Motels — 0.1%Wyndham Worldwide Corp.
Senior Sec. Notes5.75% due 04/01/2027 . . . . . . . . . . . . . . . . . . . 271,000 292,680
Independent Power Producers — 0.2%Clearway Energy Operating LLC
Company Guar. Notes5.75% due 10/15/2025* . . . . . . . . . . . . . . . . . . 395,000 415,737
NRG Yield Operating LLCCompany Guar. Notes5.00% due 09/15/2026 . . . . . . . . . . . . . . . . . . . 233,000 238,243
653,980
Insurance Brokers — 0.1%Marsh & McLennan Cos., Inc.
Senior Notes3.50% due 12/29/2020 . . . . . . . . . . . . . . . . . . . 61,000 61,974
Willis North America, Inc.Company Guar. Notes3.88% due 09/15/2049 . . . . . . . . . . . . . . . . . . . 81,000 79,219
Willis North America, Inc.Company Guar. Notes5.05% due 09/15/2048 . . . . . . . . . . . . . . . . . . . 77,000 89,950
231,143
Insurance-Life/Health — 0.1%Brighthouse Financial, Inc.
Senior Notes4.70% due 06/22/2047 . . . . . . . . . . . . . . . . . . . 94,000 83,858
Prudential Financial, Inc.Senior Notes3.70% due 03/13/2051 . . . . . . . . . . . . . . . . . . . 172,000 178,077
Unum GroupSenior Notes4.50% due 12/15/2049 . . . . . . . . . . . . . . . . . . . 117,000 112,862
374,797
Security DescriptionPrincipal
Amount(17)Value
(Note 2)
Insurance-Multi-line — 0.0%Assurant, Inc.
Senior Notes3.70% due 02/22/2030 . . . . . . . . . . . . . . . . . $ 67,000 $ 67,079
Assurant, Inc.Senior Notes6.75% due 02/15/2034 . . . . . . . . . . . . . . . . . 14,000 17,207
84,286
Insurance-Property/Casualty — 0.2%ACE INA Holdings, Inc.
Company Guar. Notes2.88% due 11/03/2022 . . . . . . . . . . . . . . . . . 83,000 85,079
AmWINS Group, Inc.Company Guar. Notes7.75% due 07/01/2026* . . . . . . . . . . . . . . . . 370,000 397,750
Chubb INA Holdings, Inc.Company Guar. Notes2.50% due 03/15/2038 . . . . . . . . . . . . . . . . . EUR 150,000 199,829
682,658
Internet Connectivity Services — 0.1%Cogent Communications Group, Inc.
Senior Sec. Notes5.38% due 03/01/2022* . . . . . . . . . . . . . . . . 407,000 423,280
Internet Content-Entertainment — 0.4%Netflix, Inc.
Senior Notes4.38% due 11/15/2026 . . . . . . . . . . . . . . . . . 561,000 568,321
Netflix, Inc.Senior Notes5.88% due 02/15/2025 . . . . . . . . . . . . . . . . . 476,000 522,715
1,091,036
Investment Companies — 0.1%FS Energy & Power Fund
Senior Sec. Notes7.50% due 08/15/2023* . . . . . . . . . . . . . . . . 347,000 350,470
Investment Management/Advisor Services — 0.0%Ameriprise Financial, Inc.
Senior Notes3.00% due 03/22/2022 . . . . . . . . . . . . . . . . . 109,000 111,021
Machinery-Construction & Mining — 0.3%Caterpillar Financial Services Corp. FRS
Senior Notes2.38% (3 ML+0.28%)due 09/07/2021 . . . . . . . . . . . . . . . . . . . . . . . 310,000 309,945
Caterpillar Financial Services Corp.Senior Notes2.55% due 11/29/2022 . . . . . . . . . . . . . . . . . 82,000 83,438
Caterpillar Financial Services Corp.Senior Notes3.15% due 09/07/2021 . . . . . . . . . . . . . . . . . 66,000 67,365
Caterpillar Financial Services Corp.Senior Notes3.45% due 05/15/2023 . . . . . . . . . . . . . . . . . 106,000 111,182
26
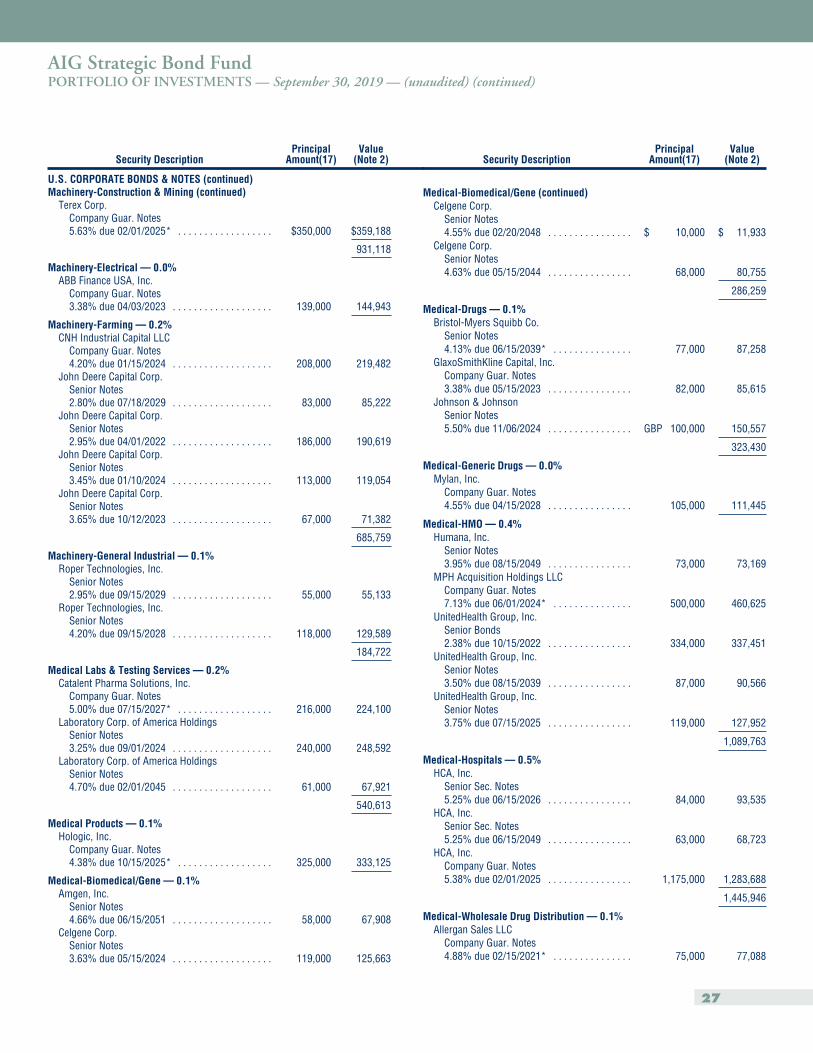
AIG Strategic Bond FundPORTFOLIO OF INVESTMENTS — September 30, 2019 — (unaudited) (continued)
Security DescriptionPrincipal
Amount(17)Value
(Note 2)
U.S. CORPORATE BONDS & NOTES (continued)Machinery-Construction & Mining (continued)
Terex Corp.Company Guar. Notes5.63% due 02/01/2025* . . . . . . . . . . . . . . . . . . $350,000 $359,188
931,118
Machinery-Electrical — 0.0%ABB Finance USA, Inc.
Company Guar. Notes3.38% due 04/03/2023 . . . . . . . . . . . . . . . . . . . 139,000 144,943
Machinery-Farming — 0.2%CNH Industrial Capital LLC
Company Guar. Notes4.20% due 01/15/2024 . . . . . . . . . . . . . . . . . . . 208,000 219,482
John Deere Capital Corp.Senior Notes2.80% due 07/18/2029 . . . . . . . . . . . . . . . . . . . 83,000 85,222
John Deere Capital Corp.Senior Notes2.95% due 04/01/2022 . . . . . . . . . . . . . . . . . . . 186,000 190,619
John Deere Capital Corp.Senior Notes3.45% due 01/10/2024 . . . . . . . . . . . . . . . . . . . 113,000 119,054
John Deere Capital Corp.Senior Notes3.65% due 10/12/2023 . . . . . . . . . . . . . . . . . . . 67,000 71,382
685,759
Machinery-General Industrial — 0.1%Roper Technologies, Inc.
Senior Notes2.95% due 09/15/2029 . . . . . . . . . . . . . . . . . . . 55,000 55,133
Roper Technologies, Inc.Senior Notes4.20% due 09/15/2028 . . . . . . . . . . . . . . . . . . . 118,000 129,589
184,722
Medical Labs & Testing Services — 0.2%Catalent Pharma Solutions, Inc.
Company Guar. Notes5.00% due 07/15/2027* . . . . . . . . . . . . . . . . . . 216,000 224,100
Laboratory Corp. of America HoldingsSenior Notes3.25% due 09/01/2024 . . . . . . . . . . . . . . . . . . . 240,000 248,592
Laboratory Corp. of America HoldingsSenior Notes4.70% due 02/01/2045 . . . . . . . . . . . . . . . . . . . 61,000 67,921
540,613
Medical Products — 0.1%Hologic, Inc.
Company Guar. Notes4.38% due 10/15/2025* . . . . . . . . . . . . . . . . . . 325,000 333,125
Medical-Biomedical/Gene — 0.1%Amgen, Inc.
Senior Notes4.66% due 06/15/2051 . . . . . . . . . . . . . . . . . . . 58,000 67,908
Celgene Corp.Senior Notes3.63% due 05/15/2024 . . . . . . . . . . . . . . . . . . . 119,000 125,663
Security DescriptionPrincipal
Amount(17)Value
(Note 2)
Medical-Biomedical/Gene (continued)Celgene Corp.
Senior Notes4.55% due 02/20/2048 . . . . . . . . . . . . . . . . $ 10,000 $ 11,933
Celgene Corp.Senior Notes4.63% due 05/15/2044 . . . . . . . . . . . . . . . . 68,000 80,755
286,259
Medical-Drugs — 0.1%Bristol-Myers Squibb Co.
Senior Notes4.13% due 06/15/2039* . . . . . . . . . . . . . . . 77,000 87,258
GlaxoSmithKline Capital, Inc.Company Guar. Notes3.38% due 05/15/2023 . . . . . . . . . . . . . . . . 82,000 85,615
Johnson & JohnsonSenior Notes5.50% due 11/06/2024 . . . . . . . . . . . . . . . . GBP 100,000 150,557
323,430
Medical-Generic Drugs — 0.0%Mylan, Inc.
Company Guar. Notes4.55% due 04/15/2028 . . . . . . . . . . . . . . . . 105,000 111,445
Medical-HMO — 0.4%Humana, Inc.
Senior Notes3.95% due 08/15/2049 . . . . . . . . . . . . . . . . 73,000 73,169
MPH Acquisition Holdings LLCCompany Guar. Notes7.13% due 06/01/2024* . . . . . . . . . . . . . . . 500,000 460,625
UnitedHealth Group, Inc.Senior Bonds2.38% due 10/15/2022 . . . . . . . . . . . . . . . . 334,000 337,451
UnitedHealth Group, Inc.Senior Notes3.50% due 08/15/2039 . . . . . . . . . . . . . . . . 87,000 90,566
UnitedHealth Group, Inc.Senior Notes3.75% due 07/15/2025 . . . . . . . . . . . . . . . . 119,000 127,952
1,089,763
Medical-Hospitals — 0.5%HCA, Inc.
Senior Sec. Notes5.25% due 06/15/2026 . . . . . . . . . . . . . . . . 84,000 93,535
HCA, Inc.Senior Sec. Notes5.25% due 06/15/2049 . . . . . . . . . . . . . . . . 63,000 68,723
HCA, Inc.Company Guar. Notes5.38% due 02/01/2025 . . . . . . . . . . . . . . . . 1,175,000 1,283,688
1,445,946
Medical-Wholesale Drug Distribution — 0.1%Allergan Sales LLC
Company Guar. Notes4.88% due 02/15/2021* . . . . . . . . . . . . . . . 75,000 77,088
27
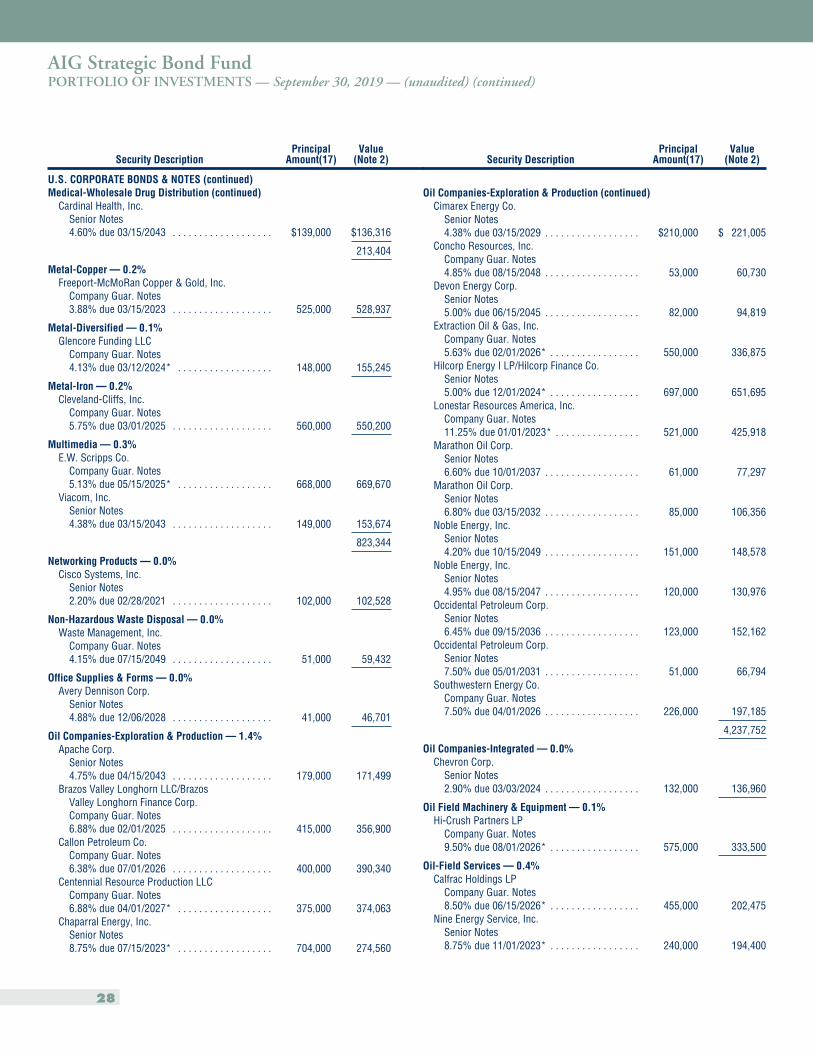
AIG Strategic Bond FundPORTFOLIO OF INVESTMENTS — September 30, 2019 — (unaudited) (continued)
Security DescriptionPrincipal
Amount(17)Value
(Note 2)
U.S. CORPORATE BONDS & NOTES (continued)Medical-Wholesale Drug Distribution (continued)
Cardinal Health, Inc.Senior Notes4.60% due 03/15/2043 . . . . . . . . . . . . . . . . . . . $139,000 $136,316
213,404
Metal-Copper — 0.2%Freeport-McMoRan Copper & Gold, Inc.
Company Guar. Notes3.88% due 03/15/2023 . . . . . . . . . . . . . . . . . . . 525,000 528,937
Metal-Diversified — 0.1%Glencore Funding LLC
Company Guar. Notes4.13% due 03/12/2024* . . . . . . . . . . . . . . . . . . 148,000 155,245
Metal-Iron — 0.2%Cleveland-Cliffs, Inc.
Company Guar. Notes5.75% due 03/01/2025 . . . . . . . . . . . . . . . . . . . 560,000 550,200
Multimedia — 0.3%E.W. Scripps Co.
Company Guar. Notes5.13% due 05/15/2025* . . . . . . . . . . . . . . . . . . 668,000 669,670
Viacom, Inc.Senior Notes4.38% due 03/15/2043 . . . . . . . . . . . . . . . . . . . 149,000 153,674
823,344
Networking Products — 0.0%Cisco Systems, Inc.
Senior Notes2.20% due 02/28/2021 . . . . . . . . . . . . . . . . . . . 102,000 102,528
Non-Hazardous Waste Disposal — 0.0%Waste Management, Inc.
Company Guar. Notes4.15% due 07/15/2049 . . . . . . . . . . . . . . . . . . . 51,000 59,432
Office Supplies & Forms — 0.0%Avery Dennison Corp.
Senior Notes4.88% due 12/06/2028 . . . . . . . . . . . . . . . . . . . 41,000 46,701
Oil Companies-Exploration & Production — 1.4%Apache Corp.
Senior Notes4.75% due 04/15/2043 . . . . . . . . . . . . . . . . . . . 179,000 171,499
Brazos Valley Longhorn LLC/BrazosValley Longhorn Finance Corp.Company Guar. Notes6.88% due 02/01/2025 . . . . . . . . . . . . . . . . . . . 415,000 356,900
Callon Petroleum Co.Company Guar. Notes6.38% due 07/01/2026 . . . . . . . . . . . . . . . . . . . 400,000 390,340
Centennial Resource Production LLCCompany Guar. Notes6.88% due 04/01/2027* . . . . . . . . . . . . . . . . . . 375,000 374,063
Chaparral Energy, Inc.Senior Notes8.75% due 07/15/2023* . . . . . . . . . . . . . . . . . . 704,000 274,560
Security DescriptionPrincipal
Amount(17)Value
(Note 2)
Oil Companies-Exploration & Production (continued)Cimarex Energy Co.
Senior Notes4.38% due 03/15/2029 . . . . . . . . . . . . . . . . . . $210,000 $ 221,005
Concho Resources, Inc.Company Guar. Notes4.85% due 08/15/2048 . . . . . . . . . . . . . . . . . . 53,000 60,730
Devon Energy Corp.Senior Notes5.00% due 06/15/2045 . . . . . . . . . . . . . . . . . . 82,000 94,819
Extraction Oil & Gas, Inc.Company Guar. Notes5.63% due 02/01/2026* . . . . . . . . . . . . . . . . . 550,000 336,875
Hilcorp Energy I LP/Hilcorp Finance Co.Senior Notes5.00% due 12/01/2024* . . . . . . . . . . . . . . . . . 697,000 651,695
Lonestar Resources America, Inc.Company Guar. Notes11.25% due 01/01/2023* . . . . . . . . . . . . . . . . 521,000 425,918
Marathon Oil Corp.Senior Notes6.60% due 10/01/2037 . . . . . . . . . . . . . . . . . . 61,000 77,297
Marathon Oil Corp.Senior Notes6.80% due 03/15/2032 . . . . . . . . . . . . . . . . . . 85,000 106,356
Noble Energy, Inc.Senior Notes4.20% due 10/15/2049 . . . . . . . . . . . . . . . . . . 151,000 148,578
Noble Energy, Inc.Senior Notes4.95% due 08/15/2047 . . . . . . . . . . . . . . . . . . 120,000 130,976
Occidental Petroleum Corp.Senior Notes6.45% due 09/15/2036 . . . . . . . . . . . . . . . . . . 123,000 152,162
Occidental Petroleum Corp.Senior Notes7.50% due 05/01/2031 . . . . . . . . . . . . . . . . . . 51,000 66,794
Southwestern Energy Co.Company Guar. Notes7.50% due 04/01/2026 . . . . . . . . . . . . . . . . . . 226,000 197,185
4,237,752
Oil Companies-Integrated — 0.0%Chevron Corp.
Senior Notes2.90% due 03/03/2024 . . . . . . . . . . . . . . . . . . 132,000 136,960
Oil Field Machinery & Equipment — 0.1%Hi-Crush Partners LP
Company Guar. Notes9.50% due 08/01/2026* . . . . . . . . . . . . . . . . . 575,000 333,500
Oil-Field Services — 0.4%Calfrac Holdings LP
Company Guar. Notes8.50% due 06/15/2026* . . . . . . . . . . . . . . . . . 455,000 202,475
Nine Energy Service, Inc.Senior Notes8.75% due 11/01/2023* . . . . . . . . . . . . . . . . . 240,000 194,400
28
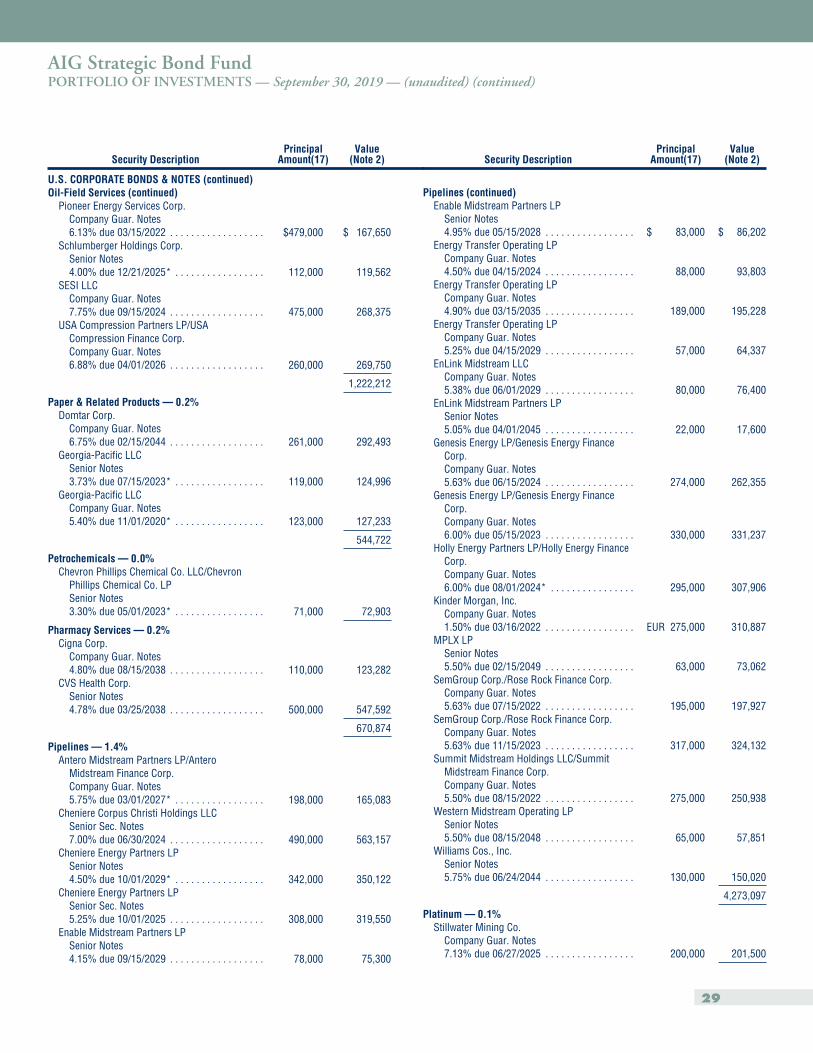
AIG Strategic Bond FundPORTFOLIO OF INVESTMENTS — September 30, 2019 — (unaudited) (continued)
Security DescriptionPrincipal
Amount(17)Value
(Note 2)
U.S. CORPORATE BONDS & NOTES (continued)Oil-Field Services (continued)
Pioneer Energy Services Corp.Company Guar. Notes6.13% due 03/15/2022 . . . . . . . . . . . . . . . . . . $479,000 $ 167,650
Schlumberger Holdings Corp.Senior Notes4.00% due 12/21/2025* . . . . . . . . . . . . . . . . . 112,000 119,562
SESI LLCCompany Guar. Notes7.75% due 09/15/2024 . . . . . . . . . . . . . . . . . . 475,000 268,375
USA Compression Partners LP/USACompression Finance Corp.Company Guar. Notes6.88% due 04/01/2026 . . . . . . . . . . . . . . . . . . 260,000 269,750
1,222,212
Paper & Related Products — 0.2%Domtar Corp.
Company Guar. Notes6.75% due 02/15/2044 . . . . . . . . . . . . . . . . . . 261,000 292,493
Georgia-Pacific LLCSenior Notes3.73% due 07/15/2023* . . . . . . . . . . . . . . . . . 119,000 124,996
Georgia-Pacific LLCCompany Guar. Notes5.40% due 11/01/2020* . . . . . . . . . . . . . . . . . 123,000 127,233
544,722
Petrochemicals — 0.0%Chevron Phillips Chemical Co. LLC/Chevron
Phillips Chemical Co. LPSenior Notes3.30% due 05/01/2023* . . . . . . . . . . . . . . . . . 71,000 72,903
Pharmacy Services — 0.2%Cigna Corp.
Company Guar. Notes4.80% due 08/15/2038 . . . . . . . . . . . . . . . . . . 110,000 123,282
CVS Health Corp.Senior Notes4.78% due 03/25/2038 . . . . . . . . . . . . . . . . . . 500,000 547,592
670,874
Pipelines — 1.4%Antero Midstream Partners LP/Antero
Midstream Finance Corp.Company Guar. Notes5.75% due 03/01/2027* . . . . . . . . . . . . . . . . . 198,000 165,083
Cheniere Corpus Christi Holdings LLCSenior Sec. Notes7.00% due 06/30/2024 . . . . . . . . . . . . . . . . . . 490,000 563,157
Cheniere Energy Partners LPSenior Notes4.50% due 10/01/2029* . . . . . . . . . . . . . . . . . 342,000 350,122
Cheniere Energy Partners LPSenior Sec. Notes5.25% due 10/01/2025 . . . . . . . . . . . . . . . . . . 308,000 319,550
Enable Midstream Partners LPSenior Notes4.15% due 09/15/2029 . . . . . . . . . . . . . . . . . . 78,000 75,300
Security DescriptionPrincipal
Amount(17)Value
(Note 2)
Pipelines (continued)Enable Midstream Partners LP
Senior Notes4.95% due 05/15/2028 . . . . . . . . . . . . . . . . . $ 83,000 $ 86,202
Energy Transfer Operating LPCompany Guar. Notes4.50% due 04/15/2024 . . . . . . . . . . . . . . . . . 88,000 93,803
Energy Transfer Operating LPCompany Guar. Notes4.90% due 03/15/2035 . . . . . . . . . . . . . . . . . 189,000 195,228
Energy Transfer Operating LPCompany Guar. Notes5.25% due 04/15/2029 . . . . . . . . . . . . . . . . . 57,000 64,337
EnLink Midstream LLCCompany Guar. Notes5.38% due 06/01/2029 . . . . . . . . . . . . . . . . . 80,000 76,400
EnLink Midstream Partners LPSenior Notes5.05% due 04/01/2045 . . . . . . . . . . . . . . . . . 22,000 17,600
Genesis Energy LP/Genesis Energy FinanceCorp.Company Guar. Notes5.63% due 06/15/2024 . . . . . . . . . . . . . . . . . 274,000 262,355
Genesis Energy LP/Genesis Energy FinanceCorp.Company Guar. Notes6.00% due 05/15/2023 . . . . . . . . . . . . . . . . . 330,000 331,237
Holly Energy Partners LP/Holly Energy FinanceCorp.Company Guar. Notes6.00% due 08/01/2024* . . . . . . . . . . . . . . . . 295,000 307,906
Kinder Morgan, Inc.Company Guar. Notes1.50% due 03/16/2022 . . . . . . . . . . . . . . . . . EUR 275,000 310,887
MPLX LPSenior Notes5.50% due 02/15/2049 . . . . . . . . . . . . . . . . . 63,000 73,062
SemGroup Corp./Rose Rock Finance Corp.Company Guar. Notes5.63% due 07/15/2022 . . . . . . . . . . . . . . . . . 195,000 197,927
SemGroup Corp./Rose Rock Finance Corp.Company Guar. Notes5.63% due 11/15/2023 . . . . . . . . . . . . . . . . . 317,000 324,132
Summit Midstream Holdings LLC/SummitMidstream Finance Corp.Company Guar. Notes5.50% due 08/15/2022 . . . . . . . . . . . . . . . . . 275,000 250,938
Western Midstream Operating LPSenior Notes5.50% due 08/15/2048 . . . . . . . . . . . . . . . . . 65,000 57,851
Williams Cos., Inc.Senior Notes5.75% due 06/24/2044 . . . . . . . . . . . . . . . . . 130,000 150,020
4,273,097
Platinum — 0.1%Stillwater Mining Co.
Company Guar. Notes7.13% due 06/27/2025 . . . . . . . . . . . . . . . . . 200,000 201,500
29
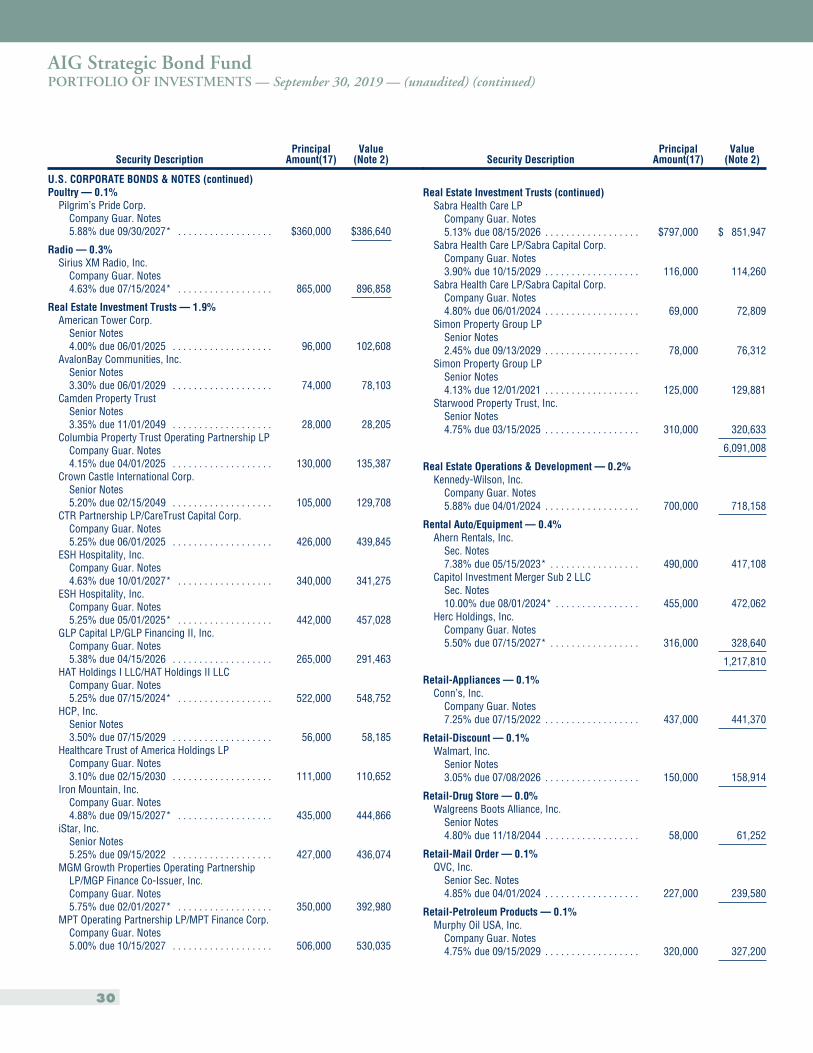
AIG Strategic Bond FundPORTFOLIO OF INVESTMENTS — September 30, 2019 — (unaudited) (continued)
Security DescriptionPrincipal
Amount(17)Value
(Note 2)
U.S. CORPORATE BONDS & NOTES (continued)Poultry — 0.1%
Pilgrim’s Pride Corp.Company Guar. Notes5.88% due 09/30/2027* . . . . . . . . . . . . . . . . . . $360,000 $386,640
Radio — 0.3%Sirius XM Radio, Inc.
Company Guar. Notes4.63% due 07/15/2024* . . . . . . . . . . . . . . . . . . 865,000 896,858
Real Estate Investment Trusts — 1.9%American Tower Corp.
Senior Notes4.00% due 06/01/2025 . . . . . . . . . . . . . . . . . . . 96,000 102,608
AvalonBay Communities, Inc.Senior Notes3.30% due 06/01/2029 . . . . . . . . . . . . . . . . . . . 74,000 78,103
Camden Property TrustSenior Notes3.35% due 11/01/2049 . . . . . . . . . . . . . . . . . . . 28,000 28,205
Columbia Property Trust Operating Partnership LPCompany Guar. Notes4.15% due 04/01/2025 . . . . . . . . . . . . . . . . . . . 130,000 135,387
Crown Castle International Corp.Senior Notes5.20% due 02/15/2049 . . . . . . . . . . . . . . . . . . . 105,000 129,708
CTR Partnership LP/CareTrust Capital Corp.Company Guar. Notes5.25% due 06/01/2025 . . . . . . . . . . . . . . . . . . . 426,000 439,845
ESH Hospitality, Inc.Company Guar. Notes4.63% due 10/01/2027* . . . . . . . . . . . . . . . . . . 340,000 341,275
ESH Hospitality, Inc.Company Guar. Notes5.25% due 05/01/2025* . . . . . . . . . . . . . . . . . . 442,000 457,028
GLP Capital LP/GLP Financing II, Inc.Company Guar. Notes5.38% due 04/15/2026 . . . . . . . . . . . . . . . . . . . 265,000 291,463
HAT Holdings I LLC/HAT Holdings II LLCCompany Guar. Notes5.25% due 07/15/2024* . . . . . . . . . . . . . . . . . . 522,000 548,752
HCP, Inc.Senior Notes3.50% due 07/15/2029 . . . . . . . . . . . . . . . . . . . 56,000 58,185
Healthcare Trust of America Holdings LPCompany Guar. Notes3.10% due 02/15/2030 . . . . . . . . . . . . . . . . . . . 111,000 110,652
Iron Mountain, Inc.Company Guar. Notes4.88% due 09/15/2027* . . . . . . . . . . . . . . . . . . 435,000 444,866
iStar, Inc.Senior Notes5.25% due 09/15/2022 . . . . . . . . . . . . . . . . . . . 427,000 436,074
MGM Growth Properties Operating PartnershipLP/MGP Finance Co-Issuer, Inc.Company Guar. Notes5.75% due 02/01/2027* . . . . . . . . . . . . . . . . . . 350,000 392,980
MPT Operating Partnership LP/MPT Finance Corp.Company Guar. Notes5.00% due 10/15/2027 . . . . . . . . . . . . . . . . . . . 506,000 530,035
Security DescriptionPrincipal
Amount(17)Value
(Note 2)
Real Estate Investment Trusts (continued)Sabra Health Care LP
Company Guar. Notes5.13% due 08/15/2026 . . . . . . . . . . . . . . . . . . $797,000 $ 851,947
Sabra Health Care LP/Sabra Capital Corp.Company Guar. Notes3.90% due 10/15/2029 . . . . . . . . . . . . . . . . . . 116,000 114,260
Sabra Health Care LP/Sabra Capital Corp.Company Guar. Notes4.80% due 06/01/2024 . . . . . . . . . . . . . . . . . . 69,000 72,809
Simon Property Group LPSenior Notes2.45% due 09/13/2029 . . . . . . . . . . . . . . . . . . 78,000 76,312
Simon Property Group LPSenior Notes4.13% due 12/01/2021 . . . . . . . . . . . . . . . . . . 125,000 129,881
Starwood Property Trust, Inc.Senior Notes4.75% due 03/15/2025 . . . . . . . . . . . . . . . . . . 310,000 320,633
6,091,008
Real Estate Operations & Development — 0.2%Kennedy-Wilson, Inc.
Company Guar. Notes5.88% due 04/01/2024 . . . . . . . . . . . . . . . . . . 700,000 718,158
Rental Auto/Equipment — 0.4%Ahern Rentals, Inc.
Sec. Notes7.38% due 05/15/2023* . . . . . . . . . . . . . . . . . 490,000 417,108
Capitol Investment Merger Sub 2 LLCSec. Notes10.00% due 08/01/2024* . . . . . . . . . . . . . . . . 455,000 472,062
Herc Holdings, Inc.Company Guar. Notes5.50% due 07/15/2027* . . . . . . . . . . . . . . . . . 316,000 328,640
1,217,810
Retail-Appliances — 0.1%Conn’s, Inc.
Company Guar. Notes7.25% due 07/15/2022 . . . . . . . . . . . . . . . . . . 437,000 441,370
Retail-Discount — 0.1%Walmart, Inc.
Senior Notes3.05% due 07/08/2026 . . . . . . . . . . . . . . . . . . 150,000 158,914
Retail-Drug Store — 0.0%Walgreens Boots Alliance, Inc.
Senior Notes4.80% due 11/18/2044 . . . . . . . . . . . . . . . . . . 58,000 61,252
Retail-Mail Order — 0.1%QVC, Inc.
Senior Sec. Notes4.85% due 04/01/2024 . . . . . . . . . . . . . . . . . . 227,000 239,580
Retail-Petroleum Products — 0.1%Murphy Oil USA, Inc.
Company Guar. Notes4.75% due 09/15/2029 . . . . . . . . . . . . . . . . . . 320,000 327,200
30
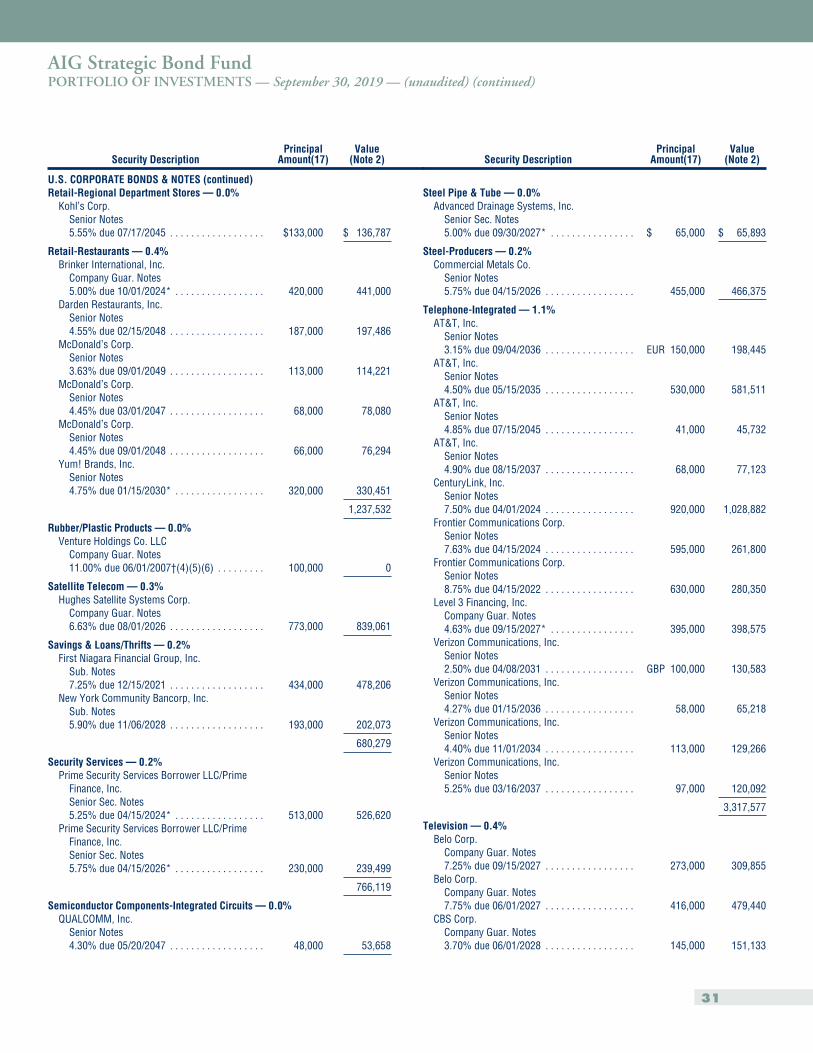
AIG Strategic Bond FundPORTFOLIO OF INVESTMENTS — September 30, 2019 — (unaudited) (continued)
Security DescriptionPrincipal
Amount(17)Value
(Note 2)
U.S. CORPORATE BONDS & NOTES (continued)Retail-Regional Department Stores — 0.0%
Kohl’s Corp.Senior Notes5.55% due 07/17/2045 . . . . . . . . . . . . . . . . . . $133,000 $ 136,787
Retail-Restaurants — 0.4%Brinker International, Inc.
Company Guar. Notes5.00% due 10/01/2024* . . . . . . . . . . . . . . . . . 420,000 441,000
Darden Restaurants, Inc.Senior Notes4.55% due 02/15/2048 . . . . . . . . . . . . . . . . . . 187,000 197,486
McDonald’s Corp.Senior Notes3.63% due 09/01/2049 . . . . . . . . . . . . . . . . . . 113,000 114,221
McDonald’s Corp.Senior Notes4.45% due 03/01/2047 . . . . . . . . . . . . . . . . . . 68,000 78,080
McDonald’s Corp.Senior Notes4.45% due 09/01/2048 . . . . . . . . . . . . . . . . . . 66,000 76,294
Yum! Brands, Inc.Senior Notes4.75% due 01/15/2030* . . . . . . . . . . . . . . . . . 320,000 330,451
1,237,532
Rubber/Plastic Products — 0.0%Venture Holdings Co. LLC
Company Guar. Notes11.00% due 06/01/2007†(4)(5)(6) . . . . . . . . . 100,000 0
Satellite Telecom — 0.3%Hughes Satellite Systems Corp.
Company Guar. Notes6.63% due 08/01/2026 . . . . . . . . . . . . . . . . . . 773,000 839,061
Savings & Loans/Thrifts — 0.2%First Niagara Financial Group, Inc.
Sub. Notes7.25% due 12/15/2021 . . . . . . . . . . . . . . . . . . 434,000 478,206
New York Community Bancorp, Inc.Sub. Notes5.90% due 11/06/2028 . . . . . . . . . . . . . . . . . . 193,000 202,073
680,279
Security Services — 0.2%Prime Security Services Borrower LLC/Prime
Finance, Inc.Senior Sec. Notes5.25% due 04/15/2024* . . . . . . . . . . . . . . . . . 513,000 526,620
Prime Security Services Borrower LLC/PrimeFinance, Inc.Senior Sec. Notes5.75% due 04/15/2026* . . . . . . . . . . . . . . . . . 230,000 239,499
766,119
Semiconductor Components-Integrated Circuits — 0.0%QUALCOMM, Inc.
Senior Notes4.30% due 05/20/2047 . . . . . . . . . . . . . . . . . . 48,000 53,658
Security DescriptionPrincipal
Amount(17)Value
(Note 2)
Steel Pipe & Tube — 0.0%Advanced Drainage Systems, Inc.
Senior Sec. Notes5.00% due 09/30/2027* . . . . . . . . . . . . . . . . $ 65,000 $ 65,893
Steel-Producers — 0.2%Commercial Metals Co.
Senior Notes5.75% due 04/15/2026 . . . . . . . . . . . . . . . . . 455,000 466,375
Telephone-Integrated — 1.1%AT&T, Inc.
Senior Notes3.15% due 09/04/2036 . . . . . . . . . . . . . . . . . EUR 150,000 198,445
AT&T, Inc.Senior Notes4.50% due 05/15/2035 . . . . . . . . . . . . . . . . . 530,000 581,511
AT&T, Inc.Senior Notes4.85% due 07/15/2045 . . . . . . . . . . . . . . . . . 41,000 45,732
AT&T, Inc.Senior Notes4.90% due 08/15/2037 . . . . . . . . . . . . . . . . . 68,000 77,123
CenturyLink, Inc.Senior Notes7.50% due 04/01/2024 . . . . . . . . . . . . . . . . . 920,000 1,028,882
Frontier Communications Corp.Senior Notes7.63% due 04/15/2024 . . . . . . . . . . . . . . . . . 595,000 261,800
Frontier Communications Corp.Senior Notes8.75% due 04/15/2022 . . . . . . . . . . . . . . . . . 630,000 280,350
Level 3 Financing, Inc.Company Guar. Notes4.63% due 09/15/2027* . . . . . . . . . . . . . . . . 395,000 398,575
Verizon Communications, Inc.Senior Notes2.50% due 04/08/2031 . . . . . . . . . . . . . . . . . GBP 100,000 130,583
Verizon Communications, Inc.Senior Notes4.27% due 01/15/2036 . . . . . . . . . . . . . . . . . 58,000 65,218
Verizon Communications, Inc.Senior Notes4.40% due 11/01/2034 . . . . . . . . . . . . . . . . . 113,000 129,266
Verizon Communications, Inc.Senior Notes5.25% due 03/16/2037 . . . . . . . . . . . . . . . . . 97,000 120,092
3,317,577
Television — 0.4%Belo Corp.
Company Guar. Notes7.25% due 09/15/2027 . . . . . . . . . . . . . . . . . 273,000 309,855
Belo Corp.Company Guar. Notes7.75% due 06/01/2027 . . . . . . . . . . . . . . . . . 416,000 479,440
CBS Corp.Company Guar. Notes3.70% due 06/01/2028 . . . . . . . . . . . . . . . . . 145,000 151,133
31

AIG Strategic Bond FundPORTFOLIO OF INVESTMENTS — September 30, 2019 — (unaudited) (continued)
Security DescriptionPrincipal
Amount(17)Value
(Note 2)
U.S. CORPORATE BONDS & NOTES (continued)Television (continued)
Gray Television, Inc.Company Guar. Notes5.13% due 10/15/2024* . . . . . . . . . . . . . . . $ 290,000 $ 300,512
1,240,940
Tools-Hand Held — 0.0%Stanley Black & Decker, Inc.
Senior Notes3.40% due 03/01/2026 . . . . . . . . . . . . . . . . 84,000 88,912
Transport-Equipment & Leasing — 0.1%GATX Corp.
Senior Notes4.35% due 02/15/2024 . . . . . . . . . . . . . . . . 165,000 176,483
Transport-Marine — 0.1%Kirby Corp.
Senior Notes4.20% due 03/01/2028 . . . . . . . . . . . . . . . . 142,000 151,756
Transport-Rail — 0.0%Kansas City Southern
Company Guar. Notes4.70% due 05/01/2048 . . . . . . . . . . . . . . . . 56,000 66,881
Transport-Truck — 0.0%JB Hunt Transport Services, Inc.
Company Guar. Notes3.88% due 03/01/2026 . . . . . . . . . . . . . . . . 74,000 78,468
Trucking/Leasing — 0.1%Penske Truck Leasing Co. LP/PTL Finance
Corp.Senior Notes3.35% due 11/01/2029* . . . . . . . . . . . . . . . 93,000 92,642
Penske Truck Leasing Co. LP/PTL FinanceCorp.Senior Notes3.40% due 11/15/2026* . . . . . . . . . . . . . . . 95,000 97,094
Penske Truck Leasing Co. LP/PTL FinanceCorp.Senior Notes3.95% due 03/10/2025* . . . . . . . . . . . . . . . 216,000 228,154
417,890
Total U.S. Corporate Bonds & Notes(cost $97,446,980) . . . . . . . . . . . . . . . . . . . 98,436,552
FOREIGN CORPORATE BONDS & NOTES — 11.4%Agricultural Chemicals — 0.2%
Consolidated Energy Finance SASenior Notes6.88% due 06/15/2025* . . . . . . . . . . . . . . . 605,000 606,513
Airport Development/Maintenance — 0.2%Heathrow Funding, Ltd.
Senior Sec. Notes6.75% due 12/03/2028 . . . . . . . . . . . . . . . . GBP 100,000 165,654
Mexico City Airport TrustSenior Sec. Notes4.25% due 10/31/2026 . . . . . . . . . . . . . . . . 460,000 462,875
628,529
Security DescriptionPrincipal
Amount(17)Value
(Note 2)
Auto-Cars/Light Trucks — 0.2%FCE Bank PLC
Senior Notes1.11% due 05/13/2020 . . . . . . . . . . . . . . . . EUR 300,000 $ 328,802
Volkswagen International Finance NVCompany Guar. Notes1.88% due 03/30/2027 . . . . . . . . . . . . . . . . EUR 200,000 230,371
559,173
Auto/Truck Parts & Equipment-Original — 0.1%Delphi Jersey Holdings PLC
Company Guar. Notes5.00% due 10/01/2025* . . . . . . . . . . . . . . . 420,000 371,700
Banks-Commercial — 0.9%Banco Bilbao Vizcaya Argentaria SA
Senior Notes1.38% due 05/14/2025 . . . . . . . . . . . . . . . . EUR 100,000 115,737
Banco de Credito e Inversiones SASenior Notes3.50% due 10/12/2027 . . . . . . . . . . . . . . . . 490,000 512,785
Banco do Brasil SASenior Notes4.75% due 03/20/2024* . . . . . . . . . . . . . . . 370,000 388,037
BPCE SASub. Notes4.63% due 07/18/2023 . . . . . . . . . . . . . . . . EUR 300,000 379,841
Credit Suisse AGSub. Notes5.75% due 09/18/2025 . . . . . . . . . . . . . . . . EUR 330,000 378,880
Danske Bank A/SSenior Notes0.88% due 05/22/2023 . . . . . . . . . . . . . . . . EUR 400,000 443,217
Danske Bank A/SSenior Notes3.88% due 09/12/2023* . . . . . . . . . . . . . . . 200,000 207,349
Intesa Sanpaolo SpASub. Notes5.71% due 01/15/2026* . . . . . . . . . . . . . . . 255,000 270,917
Westpac Banking Corp.Sub. Notes4.11% due 07/24/2034 . . . . . . . . . . . . . . . . 88,000 91,870
Westpac Banking Corp.Sub. Notes4.42% due 07/24/2039 . . . . . . . . . . . . . . . . 74,000 81,718
2,870,351
Banks-Export/Import — 0.1%Export-Import Bank of India
Senior Notes3.38% due 08/05/2026 . . . . . . . . . . . . . . . . 450,000 461,878
Banks-Special Purpose — 0.1%Kreditanstalt fuer Wiederaufbau
Government Guar. Notes1.63% due 03/15/2021 . . . . . . . . . . . . . . . . 223,000 222,540
Building Societies — 0.1%Nationwide Building Society
Senior Notes1.50% due 03/08/2026 . . . . . . . . . . . . . . . . EUR 100,000 113,169
32
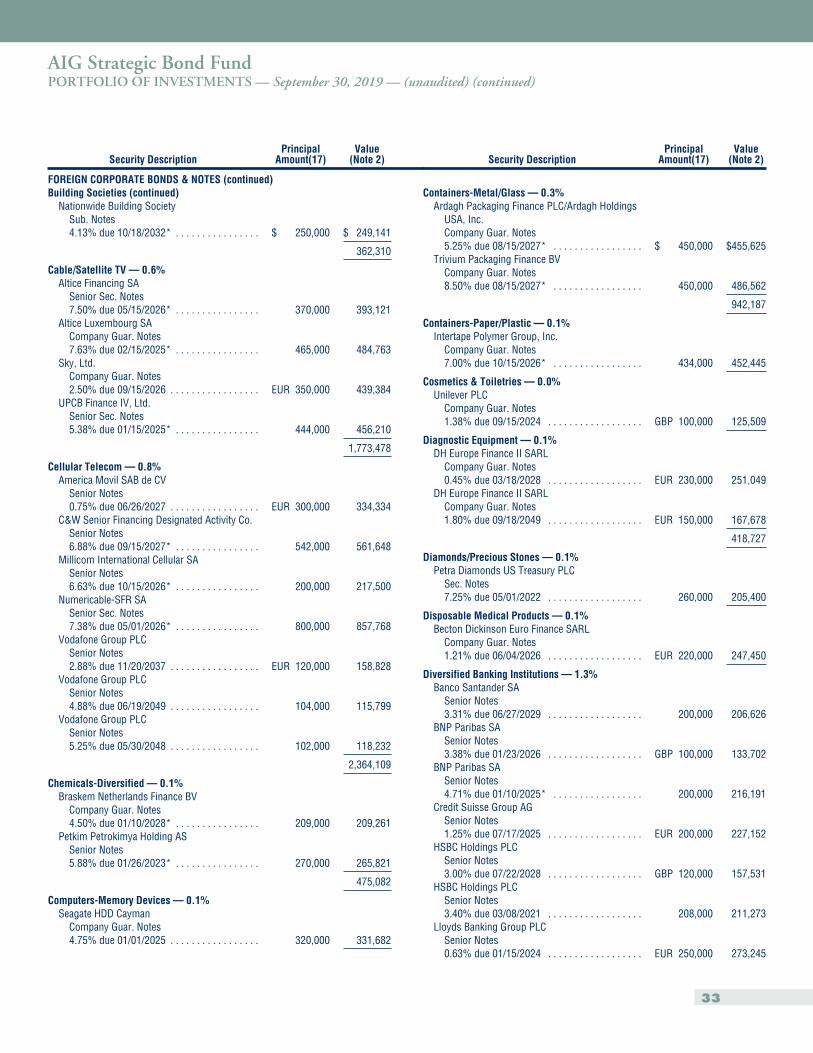
AIG Strategic Bond FundPORTFOLIO OF INVESTMENTS — September 30, 2019 — (unaudited) (continued)
Security DescriptionPrincipal
Amount(17)Value
(Note 2)
FOREIGN CORPORATE BONDS & NOTES (continued)Building Societies (continued)
Nationwide Building SocietySub. Notes4.13% due 10/18/2032* . . . . . . . . . . . . . . . . $ 250,000 $ 249,141
362,310
Cable/Satellite TV — 0.6%Altice Financing SA
Senior Sec. Notes7.50% due 05/15/2026* . . . . . . . . . . . . . . . . 370,000 393,121
Altice Luxembourg SACompany Guar. Notes7.63% due 02/15/2025* . . . . . . . . . . . . . . . . 465,000 484,763
Sky, Ltd.Company Guar. Notes2.50% due 09/15/2026 . . . . . . . . . . . . . . . . . EUR 350,000 439,384
UPCB Finance IV, Ltd.Senior Sec. Notes5.38% due 01/15/2025* . . . . . . . . . . . . . . . . 444,000 456,210
1,773,478
Cellular Telecom — 0.8%America Movil SAB de CV
Senior Notes0.75% due 06/26/2027 . . . . . . . . . . . . . . . . . EUR 300,000 334,334
C&W Senior Financing Designated Activity Co.Senior Notes6.88% due 09/15/2027* . . . . . . . . . . . . . . . . 542,000 561,648
Millicom International Cellular SASenior Notes6.63% due 10/15/2026* . . . . . . . . . . . . . . . . 200,000 217,500
Numericable-SFR SASenior Sec. Notes7.38% due 05/01/2026* . . . . . . . . . . . . . . . . 800,000 857,768
Vodafone Group PLCSenior Notes2.88% due 11/20/2037 . . . . . . . . . . . . . . . . . EUR 120,000 158,828
Vodafone Group PLCSenior Notes4.88% due 06/19/2049 . . . . . . . . . . . . . . . . . 104,000 115,799
Vodafone Group PLCSenior Notes5.25% due 05/30/2048 . . . . . . . . . . . . . . . . . 102,000 118,232
2,364,109
Chemicals-Diversified — 0.1%Braskem Netherlands Finance BV
Company Guar. Notes4.50% due 01/10/2028* . . . . . . . . . . . . . . . . 209,000 209,261
Petkim Petrokimya Holding ASSenior Notes5.88% due 01/26/2023* . . . . . . . . . . . . . . . . 270,000 265,821
475,082
Computers-Memory Devices — 0.1%Seagate HDD Cayman
Company Guar. Notes4.75% due 01/01/2025 . . . . . . . . . . . . . . . . . 320,000 331,682
Security DescriptionPrincipal
Amount(17)Value
(Note 2)
Containers-Metal/Glass — 0.3%Ardagh Packaging Finance PLC/Ardagh Holdings
USA, Inc.Company Guar. Notes5.25% due 08/15/2027* . . . . . . . . . . . . . . . . . $ 450,000 $455,625
Trivium Packaging Finance BVCompany Guar. Notes8.50% due 08/15/2027* . . . . . . . . . . . . . . . . . 450,000 486,562
942,187
Containers-Paper/Plastic — 0.1%Intertape Polymer Group, Inc.
Company Guar. Notes7.00% due 10/15/2026* . . . . . . . . . . . . . . . . . 434,000 452,445
Cosmetics & Toiletries — 0.0%Unilever PLC
Company Guar. Notes1.38% due 09/15/2024 . . . . . . . . . . . . . . . . . . GBP 100,000 125,509
Diagnostic Equipment — 0.1%DH Europe Finance II SARL
Company Guar. Notes0.45% due 03/18/2028 . . . . . . . . . . . . . . . . . . EUR 230,000 251,049
DH Europe Finance II SARLCompany Guar. Notes1.80% due 09/18/2049 . . . . . . . . . . . . . . . . . . EUR 150,000 167,678
418,727
Diamonds/Precious Stones — 0.1%Petra Diamonds US Treasury PLC
Sec. Notes7.25% due 05/01/2022 . . . . . . . . . . . . . . . . . . 260,000 205,400
Disposable Medical Products — 0.1%Becton Dickinson Euro Finance SARL
Company Guar. Notes1.21% due 06/04/2026 . . . . . . . . . . . . . . . . . . EUR 220,000 247,450
Diversified Banking Institutions — 1.3%Banco Santander SA
Senior Notes3.31% due 06/27/2029 . . . . . . . . . . . . . . . . . . 200,000 206,626
BNP Paribas SASenior Notes3.38% due 01/23/2026 . . . . . . . . . . . . . . . . . . GBP 100,000 133,702
BNP Paribas SASenior Notes4.71% due 01/10/2025* . . . . . . . . . . . . . . . . . 200,000 216,191
Credit Suisse Group AGSenior Notes1.25% due 07/17/2025 . . . . . . . . . . . . . . . . . . EUR 200,000 227,152
HSBC Holdings PLCSenior Notes3.00% due 07/22/2028 . . . . . . . . . . . . . . . . . . GBP 120,000 157,531
HSBC Holdings PLCSenior Notes3.40% due 03/08/2021 . . . . . . . . . . . . . . . . . . 208,000 211,273
Lloyds Banking Group PLCSenior Notes0.63% due 01/15/2024 . . . . . . . . . . . . . . . . . . EUR 250,000 273,245
33
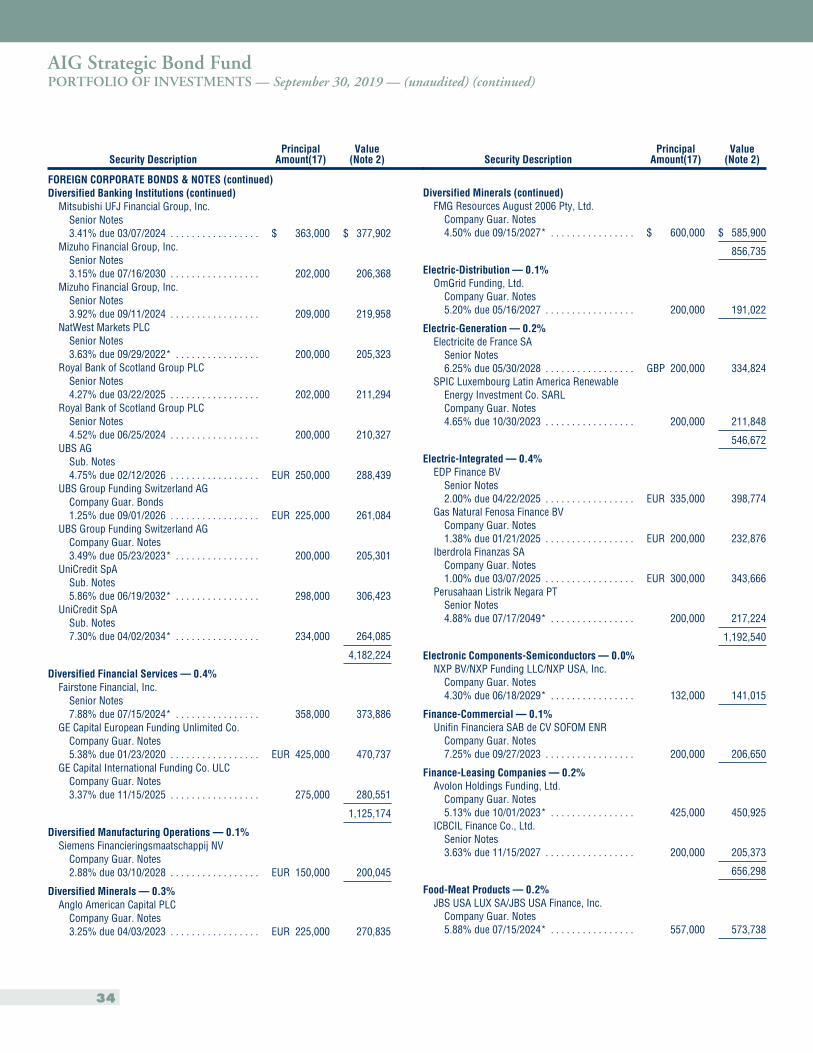
AIG Strategic Bond FundPORTFOLIO OF INVESTMENTS — September 30, 2019 — (unaudited) (continued)
Security DescriptionPrincipal
Amount(17)Value
(Note 2)
FOREIGN CORPORATE BONDS & NOTES (continued)Diversified Banking Institutions (continued)
Mitsubishi UFJ Financial Group, Inc.Senior Notes3.41% due 03/07/2024 . . . . . . . . . . . . . . . . . $ 363,000 $ 377,902
Mizuho Financial Group, Inc.Senior Notes3.15% due 07/16/2030 . . . . . . . . . . . . . . . . . 202,000 206,368
Mizuho Financial Group, Inc.Senior Notes3.92% due 09/11/2024 . . . . . . . . . . . . . . . . . 209,000 219,958
NatWest Markets PLCSenior Notes3.63% due 09/29/2022* . . . . . . . . . . . . . . . . 200,000 205,323
Royal Bank of Scotland Group PLCSenior Notes4.27% due 03/22/2025 . . . . . . . . . . . . . . . . . 202,000 211,294
Royal Bank of Scotland Group PLCSenior Notes4.52% due 06/25/2024 . . . . . . . . . . . . . . . . . 200,000 210,327
UBS AGSub. Notes4.75% due 02/12/2026 . . . . . . . . . . . . . . . . . EUR 250,000 288,439
UBS Group Funding Switzerland AGCompany Guar. Bonds1.25% due 09/01/2026 . . . . . . . . . . . . . . . . . EUR 225,000 261,084
UBS Group Funding Switzerland AGCompany Guar. Notes3.49% due 05/23/2023* . . . . . . . . . . . . . . . . 200,000 205,301
UniCredit SpASub. Notes5.86% due 06/19/2032* . . . . . . . . . . . . . . . . 298,000 306,423
UniCredit SpASub. Notes7.30% due 04/02/2034* . . . . . . . . . . . . . . . . 234,000 264,085
4,182,224
Diversified Financial Services — 0.4%Fairstone Financial, Inc.
Senior Notes7.88% due 07/15/2024* . . . . . . . . . . . . . . . . 358,000 373,886
GE Capital European Funding Unlimited Co.Company Guar. Notes5.38% due 01/23/2020 . . . . . . . . . . . . . . . . . EUR 425,000 470,737
GE Capital International Funding Co. ULCCompany Guar. Notes3.37% due 11/15/2025 . . . . . . . . . . . . . . . . . 275,000 280,551
1,125,174
Diversified Manufacturing Operations — 0.1%Siemens Financieringsmaatschappij NV
Company Guar. Notes2.88% due 03/10/2028 . . . . . . . . . . . . . . . . . EUR 150,000 200,045
Diversified Minerals — 0.3%Anglo American Capital PLC
Company Guar. Notes3.25% due 04/03/2023 . . . . . . . . . . . . . . . . . EUR 225,000 270,835
Security DescriptionPrincipal
Amount(17)Value
(Note 2)
Diversified Minerals (continued)FMG Resources August 2006 Pty, Ltd.
Company Guar. Notes4.50% due 09/15/2027* . . . . . . . . . . . . . . . . $ 600,000 $ 585,900
856,735
Electric-Distribution — 0.1%OmGrid Funding, Ltd.
Company Guar. Notes5.20% due 05/16/2027 . . . . . . . . . . . . . . . . . 200,000 191,022
Electric-Generation — 0.2%Electricite de France SA
Senior Notes6.25% due 05/30/2028 . . . . . . . . . . . . . . . . . GBP 200,000 334,824
SPIC Luxembourg Latin America RenewableEnergy Investment Co. SARLCompany Guar. Notes4.65% due 10/30/2023 . . . . . . . . . . . . . . . . . 200,000 211,848
546,672
Electric-Integrated — 0.4%EDP Finance BV
Senior Notes2.00% due 04/22/2025 . . . . . . . . . . . . . . . . . EUR 335,000 398,774
Gas Natural Fenosa Finance BVCompany Guar. Notes1.38% due 01/21/2025 . . . . . . . . . . . . . . . . . EUR 200,000 232,876
Iberdrola Finanzas SACompany Guar. Notes1.00% due 03/07/2025 . . . . . . . . . . . . . . . . . EUR 300,000 343,666
Perusahaan Listrik Negara PTSenior Notes4.88% due 07/17/2049* . . . . . . . . . . . . . . . . 200,000 217,224
1,192,540
Electronic Components-Semiconductors — 0.0%NXP BV/NXP Funding LLC/NXP USA, Inc.
Company Guar. Notes4.30% due 06/18/2029* . . . . . . . . . . . . . . . . 132,000 141,015
Finance-Commercial — 0.1%Unifin Financiera SAB de CV SOFOM ENR
Company Guar. Notes7.25% due 09/27/2023 . . . . . . . . . . . . . . . . . 200,000 206,650
Finance-Leasing Companies — 0.2%Avolon Holdings Funding, Ltd.
Company Guar. Notes5.13% due 10/01/2023* . . . . . . . . . . . . . . . . 425,000 450,925
ICBCIL Finance Co., Ltd.Senior Notes3.63% due 11/15/2027 . . . . . . . . . . . . . . . . . 200,000 205,373
656,298
Food-Meat Products — 0.2%JBS USA LUX SA/JBS USA Finance, Inc.
Company Guar. Notes5.88% due 07/15/2024* . . . . . . . . . . . . . . . . 557,000 573,738
34
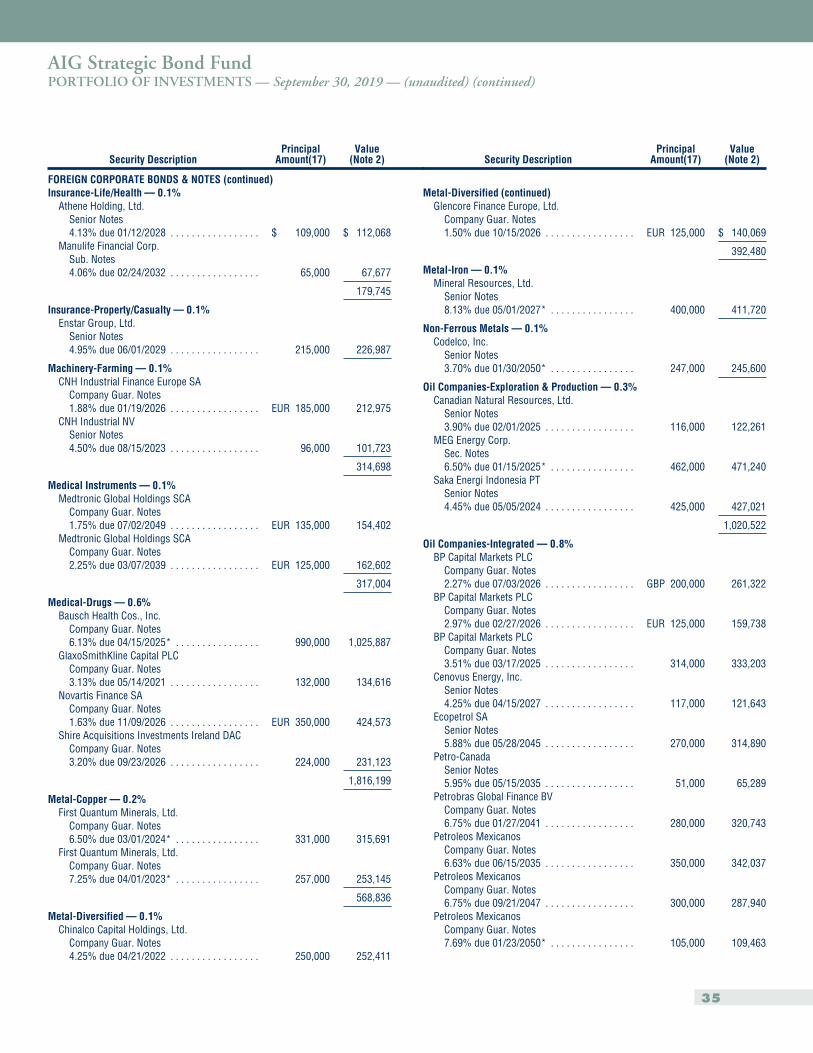
AIG Strategic Bond FundPORTFOLIO OF INVESTMENTS — September 30, 2019 — (unaudited) (continued)
Security DescriptionPrincipal
Amount(17)Value
(Note 2)
FOREIGN CORPORATE BONDS & NOTES (continued)Insurance-Life/Health — 0.1%
Athene Holding, Ltd.Senior Notes4.13% due 01/12/2028 . . . . . . . . . . . . . . . . . $ 109,000 $ 112,068
Manulife Financial Corp.Sub. Notes4.06% due 02/24/2032 . . . . . . . . . . . . . . . . . 65,000 67,677
179,745
Insurance-Property/Casualty — 0.1%Enstar Group, Ltd.
Senior Notes4.95% due 06/01/2029 . . . . . . . . . . . . . . . . . 215,000 226,987
Machinery-Farming — 0.1%CNH Industrial Finance Europe SA
Company Guar. Notes1.88% due 01/19/2026 . . . . . . . . . . . . . . . . . EUR 185,000 212,975
CNH Industrial NVSenior Notes4.50% due 08/15/2023 . . . . . . . . . . . . . . . . . 96,000 101,723
314,698
Medical Instruments — 0.1%Medtronic Global Holdings SCA
Company Guar. Notes1.75% due 07/02/2049 . . . . . . . . . . . . . . . . . EUR 135,000 154,402
Medtronic Global Holdings SCACompany Guar. Notes2.25% due 03/07/2039 . . . . . . . . . . . . . . . . . EUR 125,000 162,602
317,004
Medical-Drugs — 0.6%Bausch Health Cos., Inc.
Company Guar. Notes6.13% due 04/15/2025* . . . . . . . . . . . . . . . . 990,000 1,025,887
GlaxoSmithKline Capital PLCCompany Guar. Notes3.13% due 05/14/2021 . . . . . . . . . . . . . . . . . 132,000 134,616
Novartis Finance SACompany Guar. Notes1.63% due 11/09/2026 . . . . . . . . . . . . . . . . . EUR 350,000 424,573
Shire Acquisitions Investments Ireland DACCompany Guar. Notes3.20% due 09/23/2026 . . . . . . . . . . . . . . . . . 224,000 231,123
1,816,199
Metal-Copper — 0.2%First Quantum Minerals, Ltd.
Company Guar. Notes6.50% due 03/01/2024* . . . . . . . . . . . . . . . . 331,000 315,691
First Quantum Minerals, Ltd.Company Guar. Notes7.25% due 04/01/2023* . . . . . . . . . . . . . . . . 257,000 253,145
568,836
Metal-Diversified — 0.1%Chinalco Capital Holdings, Ltd.
Company Guar. Notes4.25% due 04/21/2022 . . . . . . . . . . . . . . . . . 250,000 252,411
Security DescriptionPrincipal
Amount(17)Value
(Note 2)
Metal-Diversified (continued)Glencore Finance Europe, Ltd.
Company Guar. Notes1.50% due 10/15/2026 . . . . . . . . . . . . . . . . . EUR 125,000 $ 140,069
392,480
Metal-Iron — 0.1%Mineral Resources, Ltd.
Senior Notes8.13% due 05/01/2027* . . . . . . . . . . . . . . . . 400,000 411,720
Non-Ferrous Metals — 0.1%Codelco, Inc.
Senior Notes3.70% due 01/30/2050* . . . . . . . . . . . . . . . . 247,000 245,600
Oil Companies-Exploration & Production — 0.3%Canadian Natural Resources, Ltd.
Senior Notes3.90% due 02/01/2025 . . . . . . . . . . . . . . . . . 116,000 122,261
MEG Energy Corp.Sec. Notes6.50% due 01/15/2025* . . . . . . . . . . . . . . . . 462,000 471,240
Saka Energi Indonesia PTSenior Notes4.45% due 05/05/2024 . . . . . . . . . . . . . . . . . 425,000 427,021
1,020,522
Oil Companies-Integrated — 0.8%BP Capital Markets PLC
Company Guar. Notes2.27% due 07/03/2026 . . . . . . . . . . . . . . . . . GBP 200,000 261,322
BP Capital Markets PLCCompany Guar. Notes2.97% due 02/27/2026 . . . . . . . . . . . . . . . . . EUR 125,000 159,738
BP Capital Markets PLCCompany Guar. Notes3.51% due 03/17/2025 . . . . . . . . . . . . . . . . . 314,000 333,203
Cenovus Energy, Inc.Senior Notes4.25% due 04/15/2027 . . . . . . . . . . . . . . . . . 117,000 121,643
Ecopetrol SASenior Notes5.88% due 05/28/2045 . . . . . . . . . . . . . . . . . 270,000 314,890
Petro-CanadaSenior Notes5.95% due 05/15/2035 . . . . . . . . . . . . . . . . . 51,000 65,289
Petrobras Global Finance BVCompany Guar. Notes6.75% due 01/27/2041 . . . . . . . . . . . . . . . . . 280,000 320,743
Petroleos MexicanosCompany Guar. Notes6.63% due 06/15/2035 . . . . . . . . . . . . . . . . . 350,000 342,037
Petroleos MexicanosCompany Guar. Notes6.75% due 09/21/2047 . . . . . . . . . . . . . . . . . 300,000 287,940
Petroleos MexicanosCompany Guar. Notes7.69% due 01/23/2050* . . . . . . . . . . . . . . . . 105,000 109,463
35
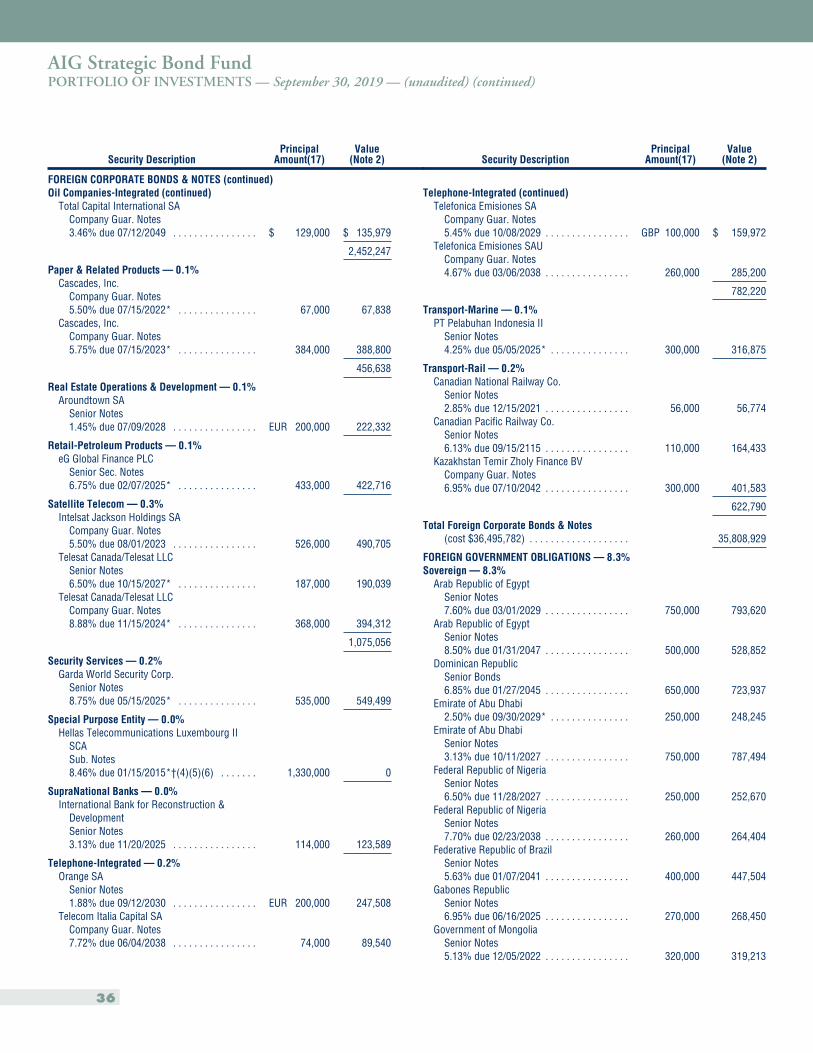
AIG Strategic Bond FundPORTFOLIO OF INVESTMENTS — September 30, 2019 — (unaudited) (continued)
Security DescriptionPrincipal
Amount(17)Value
(Note 2)
FOREIGN CORPORATE BONDS & NOTES (continued)Oil Companies-Integrated (continued)
Total Capital International SACompany Guar. Notes3.46% due 07/12/2049 . . . . . . . . . . . . . . . . $ 129,000 $ 135,979
2,452,247
Paper & Related Products — 0.1%Cascades, Inc.
Company Guar. Notes5.50% due 07/15/2022* . . . . . . . . . . . . . . . 67,000 67,838
Cascades, Inc.Company Guar. Notes5.75% due 07/15/2023* . . . . . . . . . . . . . . . 384,000 388,800
456,638
Real Estate Operations & Development — 0.1%Aroundtown SA
Senior Notes1.45% due 07/09/2028 . . . . . . . . . . . . . . . . EUR 200,000 222,332
Retail-Petroleum Products — 0.1%eG Global Finance PLC
Senior Sec. Notes6.75% due 02/07/2025* . . . . . . . . . . . . . . . 433,000 422,716
Satellite Telecom — 0.3%Intelsat Jackson Holdings SA
Company Guar. Notes5.50% due 08/01/2023 . . . . . . . . . . . . . . . . 526,000 490,705
Telesat Canada/Telesat LLCSenior Notes6.50% due 10/15/2027* . . . . . . . . . . . . . . . 187,000 190,039
Telesat Canada/Telesat LLCCompany Guar. Notes8.88% due 11/15/2024* . . . . . . . . . . . . . . . 368,000 394,312
1,075,056
Security Services — 0.2%Garda World Security Corp.
Senior Notes8.75% due 05/15/2025* . . . . . . . . . . . . . . . 535,000 549,499
Special Purpose Entity — 0.0%Hellas Telecommunications Luxembourg II
SCASub. Notes8.46% due 01/15/2015*†(4)(5)(6) . . . . . . . 1,330,000 0
SupraNational Banks — 0.0%International Bank for Reconstruction &
DevelopmentSenior Notes3.13% due 11/20/2025 . . . . . . . . . . . . . . . . 114,000 123,589
Telephone-Integrated — 0.2%Orange SA
Senior Notes1.88% due 09/12/2030 . . . . . . . . . . . . . . . . EUR 200,000 247,508
Telecom Italia Capital SACompany Guar. Notes7.72% due 06/04/2038 . . . . . . . . . . . . . . . . 74,000 89,540
Security DescriptionPrincipal
Amount(17)Value
(Note 2)
Telephone-Integrated (continued)Telefonica Emisiones SA
Company Guar. Notes5.45% due 10/08/2029 . . . . . . . . . . . . . . . . GBP 100,000 $ 159,972
Telefonica Emisiones SAUCompany Guar. Notes4.67% due 03/06/2038 . . . . . . . . . . . . . . . . 260,000 285,200
782,220
Transport-Marine — 0.1%PT Pelabuhan Indonesia II
Senior Notes4.25% due 05/05/2025* . . . . . . . . . . . . . . . 300,000 316,875
Transport-Rail — 0.2%Canadian National Railway Co.
Senior Notes2.85% due 12/15/2021 . . . . . . . . . . . . . . . . 56,000 56,774
Canadian Pacific Railway Co.Senior Notes6.13% due 09/15/2115 . . . . . . . . . . . . . . . . 110,000 164,433
Kazakhstan Temir Zholy Finance BVCompany Guar. Notes6.95% due 07/10/2042 . . . . . . . . . . . . . . . . 300,000 401,583
622,790
Total Foreign Corporate Bonds & Notes(cost $36,495,782) . . . . . . . . . . . . . . . . . . . 35,808,929
FOREIGN GOVERNMENT OBLIGATIONS — 8.3%Sovereign — 8.3%
Arab Republic of EgyptSenior Notes7.60% due 03/01/2029 . . . . . . . . . . . . . . . . 750,000 793,620
Arab Republic of EgyptSenior Notes8.50% due 01/31/2047 . . . . . . . . . . . . . . . . 500,000 528,852
Dominican RepublicSenior Bonds6.85% due 01/27/2045 . . . . . . . . . . . . . . . . 650,000 723,937
Emirate of Abu Dhabi2.50% due 09/30/2029* . . . . . . . . . . . . . . . 250,000 248,245
Emirate of Abu DhabiSenior Notes3.13% due 10/11/2027 . . . . . . . . . . . . . . . . 750,000 787,494
Federal Republic of NigeriaSenior Notes6.50% due 11/28/2027 . . . . . . . . . . . . . . . . 250,000 252,670
Federal Republic of NigeriaSenior Notes7.70% due 02/23/2038 . . . . . . . . . . . . . . . . 260,000 264,404
Federative Republic of BrazilSenior Notes5.63% due 01/07/2041 . . . . . . . . . . . . . . . . 400,000 447,504
Gabones RepublicSenior Notes6.95% due 06/16/2025 . . . . . . . . . . . . . . . . 270,000 268,450
Government of MongoliaSenior Notes5.13% due 12/05/2022 . . . . . . . . . . . . . . . . 320,000 319,213
36
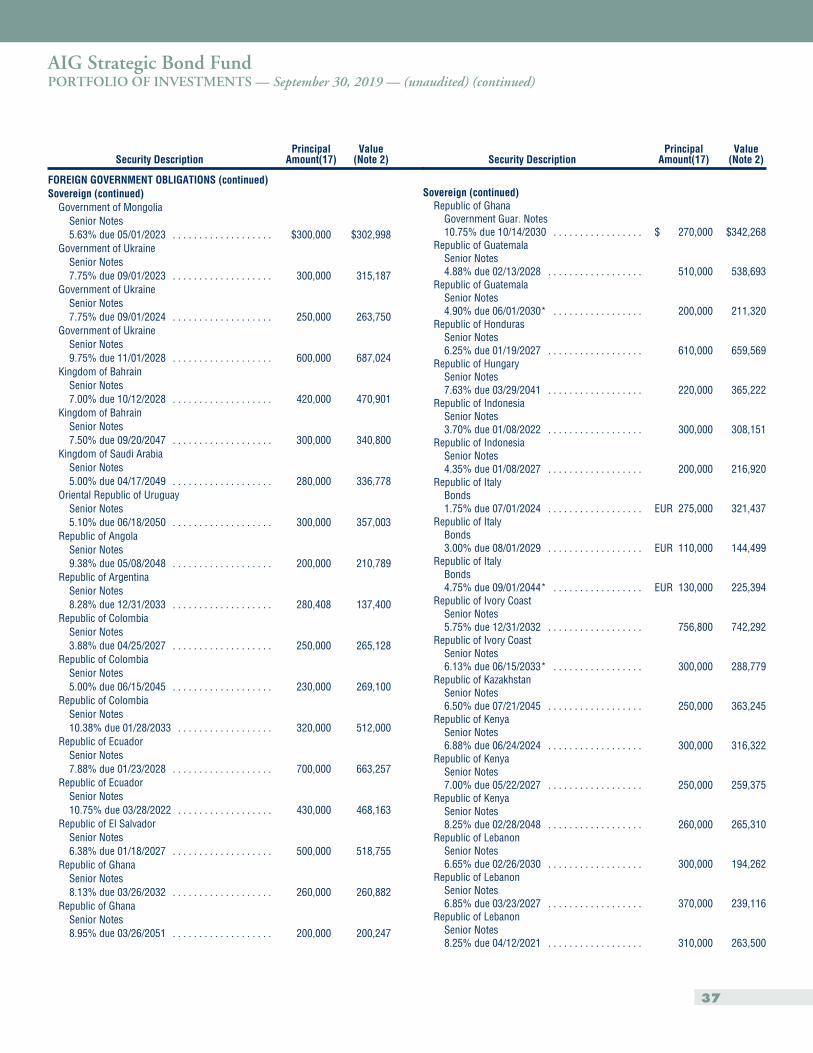
AIG Strategic Bond FundPORTFOLIO OF INVESTMENTS — September 30, 2019 — (unaudited) (continued)
Security DescriptionPrincipal
Amount(17)Value
(Note 2)
FOREIGN GOVERNMENT OBLIGATIONS (continued)Sovereign (continued)
Government of MongoliaSenior Notes5.63% due 05/01/2023 . . . . . . . . . . . . . . . . . . . $300,000 $302,998
Government of UkraineSenior Notes7.75% due 09/01/2023 . . . . . . . . . . . . . . . . . . . 300,000 315,187
Government of UkraineSenior Notes7.75% due 09/01/2024 . . . . . . . . . . . . . . . . . . . 250,000 263,750
Government of UkraineSenior Notes9.75% due 11/01/2028 . . . . . . . . . . . . . . . . . . . 600,000 687,024
Kingdom of BahrainSenior Notes7.00% due 10/12/2028 . . . . . . . . . . . . . . . . . . . 420,000 470,901
Kingdom of BahrainSenior Notes7.50% due 09/20/2047 . . . . . . . . . . . . . . . . . . . 300,000 340,800
Kingdom of Saudi ArabiaSenior Notes5.00% due 04/17/2049 . . . . . . . . . . . . . . . . . . . 280,000 336,778
Oriental Republic of UruguaySenior Notes5.10% due 06/18/2050 . . . . . . . . . . . . . . . . . . . 300,000 357,003
Republic of AngolaSenior Notes9.38% due 05/08/2048 . . . . . . . . . . . . . . . . . . . 200,000 210,789
Republic of ArgentinaSenior Notes8.28% due 12/31/2033 . . . . . . . . . . . . . . . . . . . 280,408 137,400
Republic of ColombiaSenior Notes3.88% due 04/25/2027 . . . . . . . . . . . . . . . . . . . 250,000 265,128
Republic of ColombiaSenior Notes5.00% due 06/15/2045 . . . . . . . . . . . . . . . . . . . 230,000 269,100
Republic of ColombiaSenior Notes10.38% due 01/28/2033 . . . . . . . . . . . . . . . . . . 320,000 512,000
Republic of EcuadorSenior Notes7.88% due 01/23/2028 . . . . . . . . . . . . . . . . . . . 700,000 663,257
Republic of EcuadorSenior Notes10.75% due 03/28/2022 . . . . . . . . . . . . . . . . . . 430,000 468,163
Republic of El SalvadorSenior Notes6.38% due 01/18/2027 . . . . . . . . . . . . . . . . . . . 500,000 518,755
Republic of GhanaSenior Notes8.13% due 03/26/2032 . . . . . . . . . . . . . . . . . . . 260,000 260,882
Republic of GhanaSenior Notes8.95% due 03/26/2051 . . . . . . . . . . . . . . . . . . . 200,000 200,247
Security DescriptionPrincipal
Amount(17)Value
(Note 2)
Sovereign (continued)Republic of Ghana
Government Guar. Notes10.75% due 10/14/2030 . . . . . . . . . . . . . . . . . $ 270,000 $342,268
Republic of GuatemalaSenior Notes4.88% due 02/13/2028 . . . . . . . . . . . . . . . . . . 510,000 538,693
Republic of GuatemalaSenior Notes4.90% due 06/01/2030* . . . . . . . . . . . . . . . . . 200,000 211,320
Republic of HondurasSenior Notes6.25% due 01/19/2027 . . . . . . . . . . . . . . . . . . 610,000 659,569
Republic of HungarySenior Notes7.63% due 03/29/2041 . . . . . . . . . . . . . . . . . . 220,000 365,222
Republic of IndonesiaSenior Notes3.70% due 01/08/2022 . . . . . . . . . . . . . . . . . . 300,000 308,151
Republic of IndonesiaSenior Notes4.35% due 01/08/2027 . . . . . . . . . . . . . . . . . . 200,000 216,920
Republic of ItalyBonds1.75% due 07/01/2024 . . . . . . . . . . . . . . . . . . EUR 275,000 321,437
Republic of ItalyBonds3.00% due 08/01/2029 . . . . . . . . . . . . . . . . . . EUR 110,000 144,499
Republic of ItalyBonds4.75% due 09/01/2044* . . . . . . . . . . . . . . . . . EUR 130,000 225,394
Republic of Ivory CoastSenior Notes5.75% due 12/31/2032 . . . . . . . . . . . . . . . . . . 756,800 742,292
Republic of Ivory CoastSenior Notes6.13% due 06/15/2033* . . . . . . . . . . . . . . . . . 300,000 288,779
Republic of KazakhstanSenior Notes6.50% due 07/21/2045 . . . . . . . . . . . . . . . . . . 250,000 363,245
Republic of KenyaSenior Notes6.88% due 06/24/2024 . . . . . . . . . . . . . . . . . . 300,000 316,322
Republic of KenyaSenior Notes7.00% due 05/22/2027 . . . . . . . . . . . . . . . . . . 250,000 259,375
Republic of KenyaSenior Notes8.25% due 02/28/2048 . . . . . . . . . . . . . . . . . . 260,000 265,310
Republic of LebanonSenior Notes6.65% due 02/26/2030 . . . . . . . . . . . . . . . . . . 300,000 194,262
Republic of LebanonSenior Notes6.85% due 03/23/2027 . . . . . . . . . . . . . . . . . . 370,000 239,116
Republic of LebanonSenior Notes8.25% due 04/12/2021 . . . . . . . . . . . . . . . . . . 310,000 263,500
37
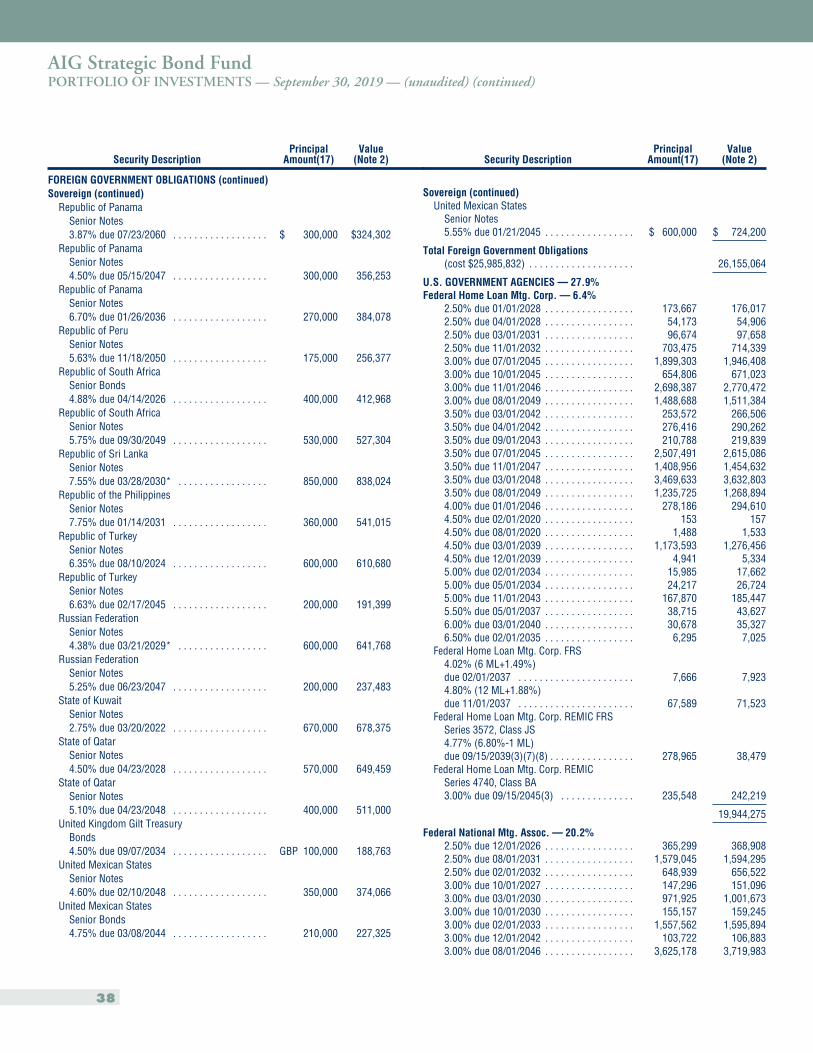
AIG Strategic Bond FundPORTFOLIO OF INVESTMENTS — September 30, 2019 — (unaudited) (continued)
Security DescriptionPrincipal
Amount(17)Value
(Note 2)
FOREIGN GOVERNMENT OBLIGATIONS (continued)Sovereign (continued)
Republic of PanamaSenior Notes3.87% due 07/23/2060 . . . . . . . . . . . . . . . . . . $ 300,000 $324,302
Republic of PanamaSenior Notes4.50% due 05/15/2047 . . . . . . . . . . . . . . . . . . 300,000 356,253
Republic of PanamaSenior Notes6.70% due 01/26/2036 . . . . . . . . . . . . . . . . . . 270,000 384,078
Republic of PeruSenior Notes5.63% due 11/18/2050 . . . . . . . . . . . . . . . . . . 175,000 256,377
Republic of South AfricaSenior Bonds4.88% due 04/14/2026 . . . . . . . . . . . . . . . . . . 400,000 412,968
Republic of South AfricaSenior Notes5.75% due 09/30/2049 . . . . . . . . . . . . . . . . . . 530,000 527,304
Republic of Sri LankaSenior Notes7.55% due 03/28/2030* . . . . . . . . . . . . . . . . . 850,000 838,024
Republic of the PhilippinesSenior Notes7.75% due 01/14/2031 . . . . . . . . . . . . . . . . . . 360,000 541,015
Republic of TurkeySenior Notes6.35% due 08/10/2024 . . . . . . . . . . . . . . . . . . 600,000 610,680
Republic of TurkeySenior Notes6.63% due 02/17/2045 . . . . . . . . . . . . . . . . . . 200,000 191,399
Russian FederationSenior Notes4.38% due 03/21/2029* . . . . . . . . . . . . . . . . . 600,000 641,768
Russian FederationSenior Notes5.25% due 06/23/2047 . . . . . . . . . . . . . . . . . . 200,000 237,483
State of KuwaitSenior Notes2.75% due 03/20/2022 . . . . . . . . . . . . . . . . . . 670,000 678,375
State of QatarSenior Notes4.50% due 04/23/2028 . . . . . . . . . . . . . . . . . . 570,000 649,459
State of QatarSenior Notes5.10% due 04/23/2048 . . . . . . . . . . . . . . . . . . 400,000 511,000
United Kingdom Gilt TreasuryBonds4.50% due 09/07/2034 . . . . . . . . . . . . . . . . . . GBP 100,000 188,763
United Mexican StatesSenior Notes4.60% due 02/10/2048 . . . . . . . . . . . . . . . . . . 350,000 374,066
United Mexican StatesSenior Bonds4.75% due 03/08/2044 . . . . . . . . . . . . . . . . . . 210,000 227,325
Security DescriptionPrincipal
Amount(17)Value
(Note 2)
Sovereign (continued)United Mexican States
Senior Notes5.55% due 01/21/2045 . . . . . . . . . . . . . . . . . $ 600,000 $ 724,200
Total Foreign Government Obligations(cost $25,985,832) . . . . . . . . . . . . . . . . . . . . 26,155,064
U.S. GOVERNMENT AGENCIES — 27.9%Federal Home Loan Mtg. Corp. — 6.4%
2.50% due 01/01/2028 . . . . . . . . . . . . . . . . . 173,667 176,0172.50% due 04/01/2028 . . . . . . . . . . . . . . . . . 54,173 54,9062.50% due 03/01/2031 . . . . . . . . . . . . . . . . . 96,674 97,6582.50% due 11/01/2032 . . . . . . . . . . . . . . . . . 703,475 714,3393.00% due 07/01/2045 . . . . . . . . . . . . . . . . . 1,899,303 1,946,4083.00% due 10/01/2045 . . . . . . . . . . . . . . . . . 654,806 671,0233.00% due 11/01/2046 . . . . . . . . . . . . . . . . . 2,698,387 2,770,4723.00% due 08/01/2049 . . . . . . . . . . . . . . . . . 1,488,688 1,511,3843.50% due 03/01/2042 . . . . . . . . . . . . . . . . . 253,572 266,5063.50% due 04/01/2042 . . . . . . . . . . . . . . . . . 276,416 290,2623.50% due 09/01/2043 . . . . . . . . . . . . . . . . . 210,788 219,8393.50% due 07/01/2045 . . . . . . . . . . . . . . . . . 2,507,491 2,615,0863.50% due 11/01/2047 . . . . . . . . . . . . . . . . . 1,408,956 1,454,6323.50% due 03/01/2048 . . . . . . . . . . . . . . . . . 3,469,633 3,632,8033.50% due 08/01/2049 . . . . . . . . . . . . . . . . . 1,235,725 1,268,8944.00% due 01/01/2046 . . . . . . . . . . . . . . . . . 278,186 294,6104.50% due 02/01/2020 . . . . . . . . . . . . . . . . . 153 1574.50% due 08/01/2020 . . . . . . . . . . . . . . . . . 1,488 1,5334.50% due 03/01/2039 . . . . . . . . . . . . . . . . . 1,173,593 1,276,4564.50% due 12/01/2039 . . . . . . . . . . . . . . . . . 4,941 5,3345.00% due 02/01/2034 . . . . . . . . . . . . . . . . . 15,985 17,6625.00% due 05/01/2034 . . . . . . . . . . . . . . . . . 24,217 26,7245.00% due 11/01/2043 . . . . . . . . . . . . . . . . . 167,870 185,4475.50% due 05/01/2037 . . . . . . . . . . . . . . . . . 38,715 43,6276.00% due 03/01/2040 . . . . . . . . . . . . . . . . . 30,678 35,3276.50% due 02/01/2035 . . . . . . . . . . . . . . . . . 6,295 7,025
Federal Home Loan Mtg. Corp. FRS4.02% (6 ML+1.49%)due 02/01/2037 . . . . . . . . . . . . . . . . . . . . . . 7,666 7,9234.80% (12 ML+1.88%)due 11/01/2037 . . . . . . . . . . . . . . . . . . . . . . 67,589 71,523
Federal Home Loan Mtg. Corp. REMIC FRSSeries 3572, Class JS4.77% (6.80%-1 ML)due 09/15/2039(3)(7)(8) . . . . . . . . . . . . . . . . 278,965 38,479
Federal Home Loan Mtg. Corp. REMICSeries 4740, Class BA3.00% due 09/15/2045(3) . . . . . . . . . . . . . . 235,548 242,219
19,944,275
Federal National Mtg. Assoc. — 20.2%2.50% due 12/01/2026 . . . . . . . . . . . . . . . . . 365,299 368,9082.50% due 08/01/2031 . . . . . . . . . . . . . . . . . 1,579,045 1,594,2952.50% due 02/01/2032 . . . . . . . . . . . . . . . . . 648,939 656,5223.00% due 10/01/2027 . . . . . . . . . . . . . . . . . 147,296 151,0963.00% due 03/01/2030 . . . . . . . . . . . . . . . . . 971,925 1,001,6733.00% due 10/01/2030 . . . . . . . . . . . . . . . . . 155,157 159,2453.00% due 02/01/2033 . . . . . . . . . . . . . . . . . 1,557,562 1,595,8943.00% due 12/01/2042 . . . . . . . . . . . . . . . . . 103,722 106,8833.00% due 08/01/2046 . . . . . . . . . . . . . . . . . 3,625,178 3,719,983
38
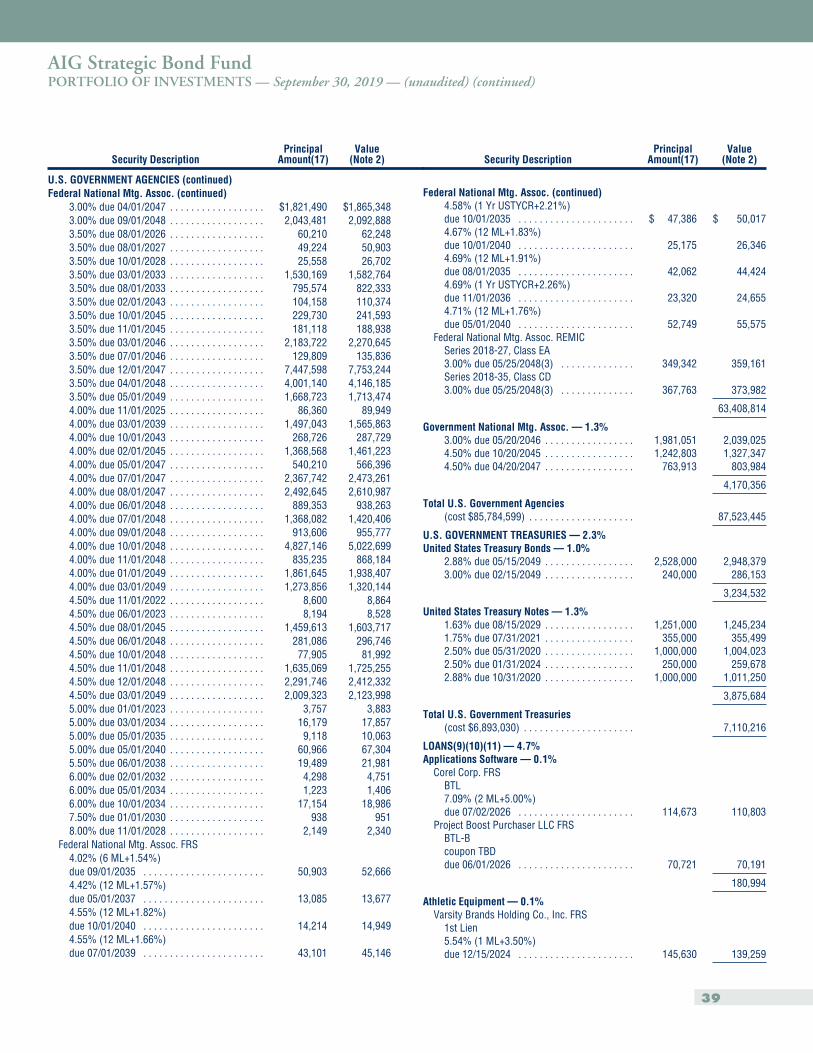
AIG Strategic Bond FundPORTFOLIO OF INVESTMENTS — September 30, 2019 — (unaudited) (continued)
Security DescriptionPrincipal
Amount(17)Value
(Note 2)
U.S. GOVERNMENT AGENCIES (continued)Federal National Mtg. Assoc. (continued)
3.00% due 04/01/2047 . . . . . . . . . . . . . . . . . . $1,821,490 $1,865,3483.00% due 09/01/2048 . . . . . . . . . . . . . . . . . . 2,043,481 2,092,8883.50% due 08/01/2026 . . . . . . . . . . . . . . . . . . 60,210 62,2483.50% due 08/01/2027 . . . . . . . . . . . . . . . . . . 49,224 50,9033.50% due 10/01/2028 . . . . . . . . . . . . . . . . . . 25,558 26,7023.50% due 03/01/2033 . . . . . . . . . . . . . . . . . . 1,530,169 1,582,7643.50% due 08/01/2033 . . . . . . . . . . . . . . . . . . 795,574 822,3333.50% due 02/01/2043 . . . . . . . . . . . . . . . . . . 104,158 110,3743.50% due 10/01/2045 . . . . . . . . . . . . . . . . . . 229,730 241,5933.50% due 11/01/2045 . . . . . . . . . . . . . . . . . . 181,118 188,9383.50% due 03/01/2046 . . . . . . . . . . . . . . . . . . 2,183,722 2,270,6453.50% due 07/01/2046 . . . . . . . . . . . . . . . . . . 129,809 135,8363.50% due 12/01/2047 . . . . . . . . . . . . . . . . . . 7,447,598 7,753,2443.50% due 04/01/2048 . . . . . . . . . . . . . . . . . . 4,001,140 4,146,1853.50% due 05/01/2049 . . . . . . . . . . . . . . . . . . 1,668,723 1,713,4744.00% due 11/01/2025 . . . . . . . . . . . . . . . . . . 86,360 89,9494.00% due 03/01/2039 . . . . . . . . . . . . . . . . . . 1,497,043 1,565,8634.00% due 10/01/2043 . . . . . . . . . . . . . . . . . . 268,726 287,7294.00% due 02/01/2045 . . . . . . . . . . . . . . . . . . 1,368,568 1,461,2234.00% due 05/01/2047 . . . . . . . . . . . . . . . . . . 540,210 566,3964.00% due 07/01/2047 . . . . . . . . . . . . . . . . . . 2,367,742 2,473,2614.00% due 08/01/2047 . . . . . . . . . . . . . . . . . . 2,492,645 2,610,9874.00% due 06/01/2048 . . . . . . . . . . . . . . . . . . 889,353 938,2634.00% due 07/01/2048 . . . . . . . . . . . . . . . . . . 1,368,082 1,420,4064.00% due 09/01/2048 . . . . . . . . . . . . . . . . . . 913,606 955,7774.00% due 10/01/2048 . . . . . . . . . . . . . . . . . . 4,827,146 5,022,6994.00% due 11/01/2048 . . . . . . . . . . . . . . . . . . 835,235 868,1844.00% due 01/01/2049 . . . . . . . . . . . . . . . . . . 1,861,645 1,938,4074.00% due 03/01/2049 . . . . . . . . . . . . . . . . . . 1,273,856 1,320,1444.50% due 11/01/2022 . . . . . . . . . . . . . . . . . . 8,600 8,8644.50% due 06/01/2023 . . . . . . . . . . . . . . . . . . 8,194 8,5284.50% due 08/01/2045 . . . . . . . . . . . . . . . . . . 1,459,613 1,603,7174.50% due 06/01/2048 . . . . . . . . . . . . . . . . . . 281,086 296,7464.50% due 10/01/2048 . . . . . . . . . . . . . . . . . . 77,905 81,9924.50% due 11/01/2048 . . . . . . . . . . . . . . . . . . 1,635,069 1,725,2554.50% due 12/01/2048 . . . . . . . . . . . . . . . . . . 2,291,746 2,412,3324.50% due 03/01/2049 . . . . . . . . . . . . . . . . . . 2,009,323 2,123,9985.00% due 01/01/2023 . . . . . . . . . . . . . . . . . . 3,757 3,8835.00% due 03/01/2034 . . . . . . . . . . . . . . . . . . 16,179 17,8575.00% due 05/01/2035 . . . . . . . . . . . . . . . . . . 9,118 10,0635.00% due 05/01/2040 . . . . . . . . . . . . . . . . . . 60,966 67,3045.50% due 06/01/2038 . . . . . . . . . . . . . . . . . . 19,489 21,9816.00% due 02/01/2032 . . . . . . . . . . . . . . . . . . 4,298 4,7516.00% due 05/01/2034 . . . . . . . . . . . . . . . . . . 1,223 1,4066.00% due 10/01/2034 . . . . . . . . . . . . . . . . . . 17,154 18,9867.50% due 01/01/2030 . . . . . . . . . . . . . . . . . . 938 9518.00% due 11/01/2028 . . . . . . . . . . . . . . . . . . 2,149 2,340
Federal National Mtg. Assoc. FRS4.02% (6 ML+1.54%)due 09/01/2035 . . . . . . . . . . . . . . . . . . . . . . . 50,903 52,6664.42% (12 ML+1.57%)due 05/01/2037 . . . . . . . . . . . . . . . . . . . . . . . 13,085 13,6774.55% (12 ML+1.82%)due 10/01/2040 . . . . . . . . . . . . . . . . . . . . . . . 14,214 14,9494.55% (12 ML+1.66%)due 07/01/2039 . . . . . . . . . . . . . . . . . . . . . . . 43,101 45,146
Security DescriptionPrincipal
Amount(17)Value
(Note 2)
Federal National Mtg. Assoc. (continued)4.58% (1 Yr USTYCR+2.21%)due 10/01/2035 . . . . . . . . . . . . . . . . . . . . . . $ 47,386 $ 50,0174.67% (12 ML+1.83%)due 10/01/2040 . . . . . . . . . . . . . . . . . . . . . . 25,175 26,3464.69% (12 ML+1.91%)due 08/01/2035 . . . . . . . . . . . . . . . . . . . . . . 42,062 44,4244.69% (1 Yr USTYCR+2.26%)due 11/01/2036 . . . . . . . . . . . . . . . . . . . . . . 23,320 24,6554.71% (12 ML+1.76%)due 05/01/2040 . . . . . . . . . . . . . . . . . . . . . . 52,749 55,575
Federal National Mtg. Assoc. REMICSeries 2018-27, Class EA3.00% due 05/25/2048(3) . . . . . . . . . . . . . . 349,342 359,161Series 2018-35, Class CD3.00% due 05/25/2048(3) . . . . . . . . . . . . . . 367,763 373,982
63,408,814
Government National Mtg. Assoc. — 1.3%3.00% due 05/20/2046 . . . . . . . . . . . . . . . . . 1,981,051 2,039,0254.50% due 10/20/2045 . . . . . . . . . . . . . . . . . 1,242,803 1,327,3474.50% due 04/20/2047 . . . . . . . . . . . . . . . . . 763,913 803,984
4,170,356
Total U.S. Government Agencies(cost $85,784,599) . . . . . . . . . . . . . . . . . . . . 87,523,445
U.S. GOVERNMENT TREASURIES — 2.3%United States Treasury Bonds — 1.0%
2.88% due 05/15/2049 . . . . . . . . . . . . . . . . . 2,528,000 2,948,3793.00% due 02/15/2049 . . . . . . . . . . . . . . . . . 240,000 286,153
3,234,532
United States Treasury Notes — 1.3%1.63% due 08/15/2029 . . . . . . . . . . . . . . . . . 1,251,000 1,245,2341.75% due 07/31/2021 . . . . . . . . . . . . . . . . . 355,000 355,4992.50% due 05/31/2020 . . . . . . . . . . . . . . . . . 1,000,000 1,004,0232.50% due 01/31/2024 . . . . . . . . . . . . . . . . . 250,000 259,6782.88% due 10/31/2020 . . . . . . . . . . . . . . . . . 1,000,000 1,011,250
3,875,684
Total U.S. Government Treasuries(cost $6,893,030) . . . . . . . . . . . . . . . . . . . . . 7,110,216
LOANS(9)(10)(11) — 4.7%Applications Software — 0.1%
Corel Corp. FRSBTL7.09% (2 ML+5.00%)due 07/02/2026 . . . . . . . . . . . . . . . . . . . . . . 114,673 110,803
Project Boost Purchaser LLC FRSBTL-Bcoupon TBDdue 06/01/2026 . . . . . . . . . . . . . . . . . . . . . . 70,721 70,191
180,994
Athletic Equipment — 0.1%Varsity Brands Holding Co., Inc. FRS
1st Lien5.54% (1 ML+3.50%)due 12/15/2024 . . . . . . . . . . . . . . . . . . . . . . 145,630 139,259
39
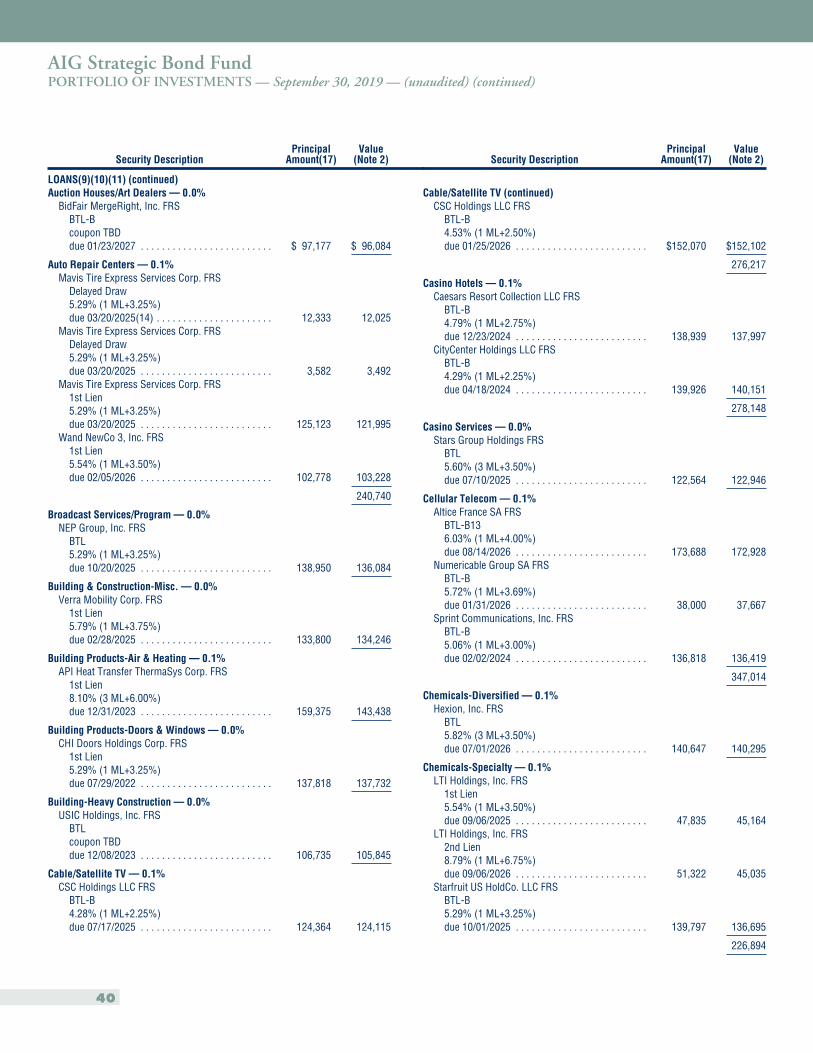
AIG Strategic Bond FundPORTFOLIO OF INVESTMENTS — September 30, 2019 — (unaudited) (continued)
Security DescriptionPrincipal
Amount(17)Value
(Note 2)
LOANS(9)(10)(11) (continued)Auction Houses/Art Dealers — 0.0%
BidFair MergeRight, Inc. FRSBTL-Bcoupon TBDdue 01/23/2027 . . . . . . . . . . . . . . . . . . . . . . . . . $ 97,177 $ 96,084
Auto Repair Centers — 0.1%Mavis Tire Express Services Corp. FRS
Delayed Draw5.29% (1 ML+3.25%)due 03/20/2025(14) . . . . . . . . . . . . . . . . . . . . . . 12,333 12,025
Mavis Tire Express Services Corp. FRSDelayed Draw5.29% (1 ML+3.25%)due 03/20/2025 . . . . . . . . . . . . . . . . . . . . . . . . . 3,582 3,492
Mavis Tire Express Services Corp. FRS1st Lien5.29% (1 ML+3.25%)due 03/20/2025 . . . . . . . . . . . . . . . . . . . . . . . . . 125,123 121,995
Wand NewCo 3, Inc. FRS1st Lien5.54% (1 ML+3.50%)due 02/05/2026 . . . . . . . . . . . . . . . . . . . . . . . . . 102,778 103,228
240,740
Broadcast Services/Program — 0.0%NEP Group, Inc. FRS
BTL5.29% (1 ML+3.25%)due 10/20/2025 . . . . . . . . . . . . . . . . . . . . . . . . . 138,950 136,084
Building & Construction-Misc. — 0.0%Verra Mobility Corp. FRS
1st Lien5.79% (1 ML+3.75%)due 02/28/2025 . . . . . . . . . . . . . . . . . . . . . . . . . 133,800 134,246
Building Products-Air & Heating — 0.1%API Heat Transfer ThermaSys Corp. FRS
1st Lien8.10% (3 ML+6.00%)due 12/31/2023 . . . . . . . . . . . . . . . . . . . . . . . . . 159,375 143,438
Building Products-Doors & Windows — 0.0%CHI Doors Holdings Corp. FRS
1st Lien5.29% (1 ML+3.25%)due 07/29/2022 . . . . . . . . . . . . . . . . . . . . . . . . . 137,818 137,732
Building-Heavy Construction — 0.0%USIC Holdings, Inc. FRS
BTLcoupon TBDdue 12/08/2023 . . . . . . . . . . . . . . . . . . . . . . . . . 106,735 105,845
Cable/Satellite TV — 0.1%CSC Holdings LLC FRS
BTL-B4.28% (1 ML+2.25%)due 07/17/2025 . . . . . . . . . . . . . . . . . . . . . . . . . 124,364 124,115
Security DescriptionPrincipal
Amount(17)Value
(Note 2)
Cable/Satellite TV (continued)CSC Holdings LLC FRS
BTL-B4.53% (1 ML+2.50%)due 01/25/2026 . . . . . . . . . . . . . . . . . . . . . . . . . $152,070 $152,102
276,217
Casino Hotels — 0.1%Caesars Resort Collection LLC FRS
BTL-B4.79% (1 ML+2.75%)due 12/23/2024 . . . . . . . . . . . . . . . . . . . . . . . . . 138,939 137,997
CityCenter Holdings LLC FRSBTL-B4.29% (1 ML+2.25%)due 04/18/2024 . . . . . . . . . . . . . . . . . . . . . . . . . 139,926 140,151
278,148
Casino Services — 0.0%Stars Group Holdings FRS
BTL5.60% (3 ML+3.50%)due 07/10/2025 . . . . . . . . . . . . . . . . . . . . . . . . . 122,564 122,946
Cellular Telecom — 0.1%Altice France SA FRS
BTL-B136.03% (1 ML+4.00%)due 08/14/2026 . . . . . . . . . . . . . . . . . . . . . . . . . 173,688 172,928
Numericable Group SA FRSBTL-B5.72% (1 ML+3.69%)due 01/31/2026 . . . . . . . . . . . . . . . . . . . . . . . . . 38,000 37,667
Sprint Communications, Inc. FRSBTL-B5.06% (1 ML+3.00%)due 02/02/2024 . . . . . . . . . . . . . . . . . . . . . . . . . 136,818 136,419
347,014
Chemicals-Diversified — 0.1%Hexion, Inc. FRS
BTL5.82% (3 ML+3.50%)due 07/01/2026 . . . . . . . . . . . . . . . . . . . . . . . . . 140,647 140,295
Chemicals-Specialty — 0.1%LTI Holdings, Inc. FRS
1st Lien5.54% (1 ML+3.50%)due 09/06/2025 . . . . . . . . . . . . . . . . . . . . . . . . . 47,835 45,164
LTI Holdings, Inc. FRS2nd Lien8.79% (1 ML+6.75%)due 09/06/2026 . . . . . . . . . . . . . . . . . . . . . . . . . 51,322 45,035
Starfruit US HoldCo. LLC FRSBTL-B5.29% (1 ML+3.25%)due 10/01/2025 . . . . . . . . . . . . . . . . . . . . . . . . . 139,797 136,695
226,894
40
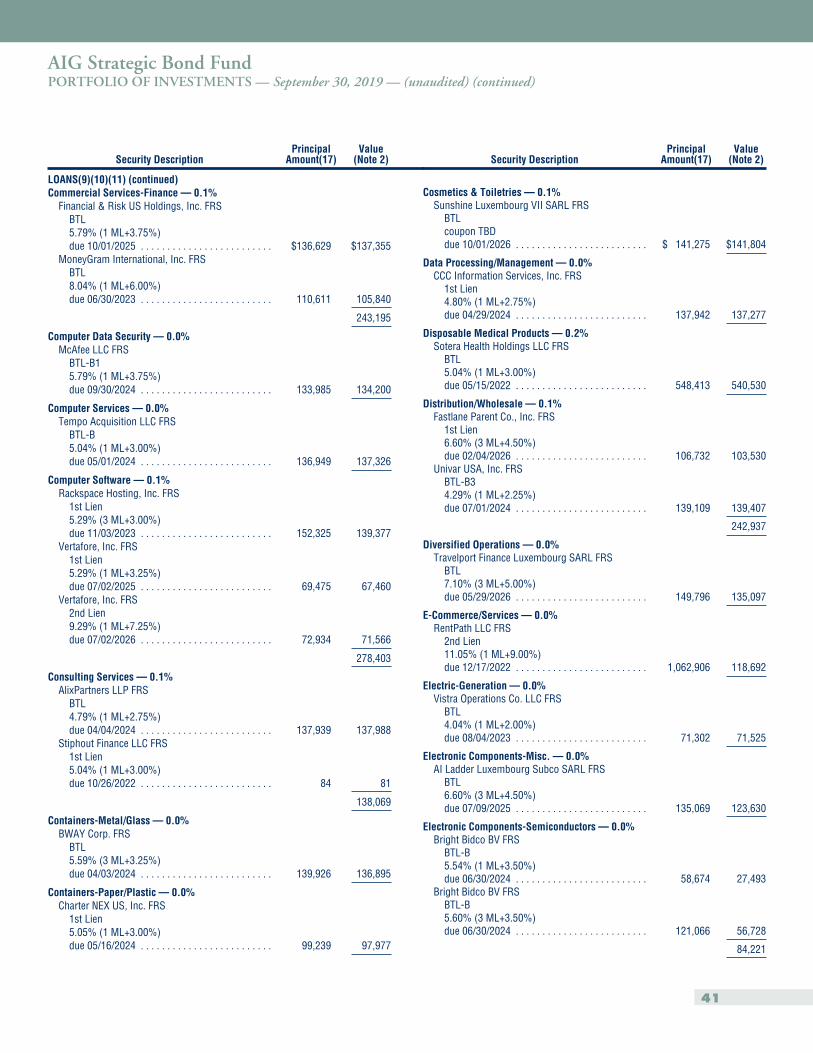
AIG Strategic Bond FundPORTFOLIO OF INVESTMENTS — September 30, 2019 — (unaudited) (continued)
Security DescriptionPrincipal
Amount(17)Value
(Note 2)
LOANS(9)(10)(11) (continued)Commercial Services-Finance — 0.1%
Financial & Risk US Holdings, Inc. FRSBTL5.79% (1 ML+3.75%)due 10/01/2025 . . . . . . . . . . . . . . . . . . . . . . . . . $136,629 $137,355
MoneyGram International, Inc. FRSBTL8.04% (1 ML+6.00%)due 06/30/2023 . . . . . . . . . . . . . . . . . . . . . . . . . 110,611 105,840
243,195
Computer Data Security — 0.0%McAfee LLC FRS
BTL-B15.79% (1 ML+3.75%)due 09/30/2024 . . . . . . . . . . . . . . . . . . . . . . . . . 133,985 134,200
Computer Services — 0.0%Tempo Acquisition LLC FRS
BTL-B5.04% (1 ML+3.00%)due 05/01/2024 . . . . . . . . . . . . . . . . . . . . . . . . . 136,949 137,326
Computer Software — 0.1%Rackspace Hosting, Inc. FRS
1st Lien5.29% (3 ML+3.00%)due 11/03/2023 . . . . . . . . . . . . . . . . . . . . . . . . . 152,325 139,377
Vertafore, Inc. FRS1st Lien5.29% (1 ML+3.25%)due 07/02/2025 . . . . . . . . . . . . . . . . . . . . . . . . . 69,475 67,460
Vertafore, Inc. FRS2nd Lien9.29% (1 ML+7.25%)due 07/02/2026 . . . . . . . . . . . . . . . . . . . . . . . . . 72,934 71,566
278,403
Consulting Services — 0.1%AlixPartners LLP FRS
BTL4.79% (1 ML+2.75%)due 04/04/2024 . . . . . . . . . . . . . . . . . . . . . . . . . 137,939 137,988
Stiphout Finance LLC FRS1st Lien5.04% (1 ML+3.00%)due 10/26/2022 . . . . . . . . . . . . . . . . . . . . . . . . . 84 81
138,069
Containers-Metal/Glass — 0.0%BWAY Corp. FRS
BTL5.59% (3 ML+3.25%)due 04/03/2024 . . . . . . . . . . . . . . . . . . . . . . . . . 139,926 136,895
Containers-Paper/Plastic — 0.0%Charter NEX US, Inc. FRS
1st Lien5.05% (1 ML+3.00%)due 05/16/2024 . . . . . . . . . . . . . . . . . . . . . . . . . 99,239 97,977
Security DescriptionPrincipal
Amount(17)Value
(Note 2)
Cosmetics & Toiletries — 0.1%Sunshine Luxembourg VII SARL FRS
BTLcoupon TBDdue 10/01/2026 . . . . . . . . . . . . . . . . . . . . . . . . . $ 141,275 $141,804
Data Processing/Management — 0.0%CCC Information Services, Inc. FRS
1st Lien4.80% (1 ML+2.75%)due 04/29/2024 . . . . . . . . . . . . . . . . . . . . . . . . . 137,942 137,277
Disposable Medical Products — 0.2%Sotera Health Holdings LLC FRS
BTL5.04% (1 ML+3.00%)due 05/15/2022 . . . . . . . . . . . . . . . . . . . . . . . . . 548,413 540,530
Distribution/Wholesale — 0.1%Fastlane Parent Co., Inc. FRS
1st Lien6.60% (3 ML+4.50%)due 02/04/2026 . . . . . . . . . . . . . . . . . . . . . . . . . 106,732 103,530
Univar USA, Inc. FRSBTL-B34.29% (1 ML+2.25%)due 07/01/2024 . . . . . . . . . . . . . . . . . . . . . . . . . 139,109 139,407
242,937
Diversified Operations — 0.0%Travelport Finance Luxembourg SARL FRS
BTL7.10% (3 ML+5.00%)due 05/29/2026 . . . . . . . . . . . . . . . . . . . . . . . . . 149,796 135,097
E-Commerce/Services — 0.0%RentPath LLC FRS
2nd Lien11.05% (1 ML+9.00%)due 12/17/2022 . . . . . . . . . . . . . . . . . . . . . . . . . 1,062,906 118,692
Electric-Generation — 0.0%Vistra Operations Co. LLC FRS
BTL4.04% (1 ML+2.00%)due 08/04/2023 . . . . . . . . . . . . . . . . . . . . . . . . . 71,302 71,525
Electronic Components-Misc. — 0.0%AI Ladder Luxembourg Subco SARL FRS
BTL6.60% (3 ML+4.50%)due 07/09/2025 . . . . . . . . . . . . . . . . . . . . . . . . . 135,069 123,630
Electronic Components-Semiconductors — 0.0%Bright Bidco BV FRS
BTL-B5.54% (1 ML+3.50%)due 06/30/2024 . . . . . . . . . . . . . . . . . . . . . . . . . 58,674 27,493
Bright Bidco BV FRSBTL-B5.60% (3 ML+3.50%)due 06/30/2024 . . . . . . . . . . . . . . . . . . . . . . . . . 121,066 56,728
84,221
41
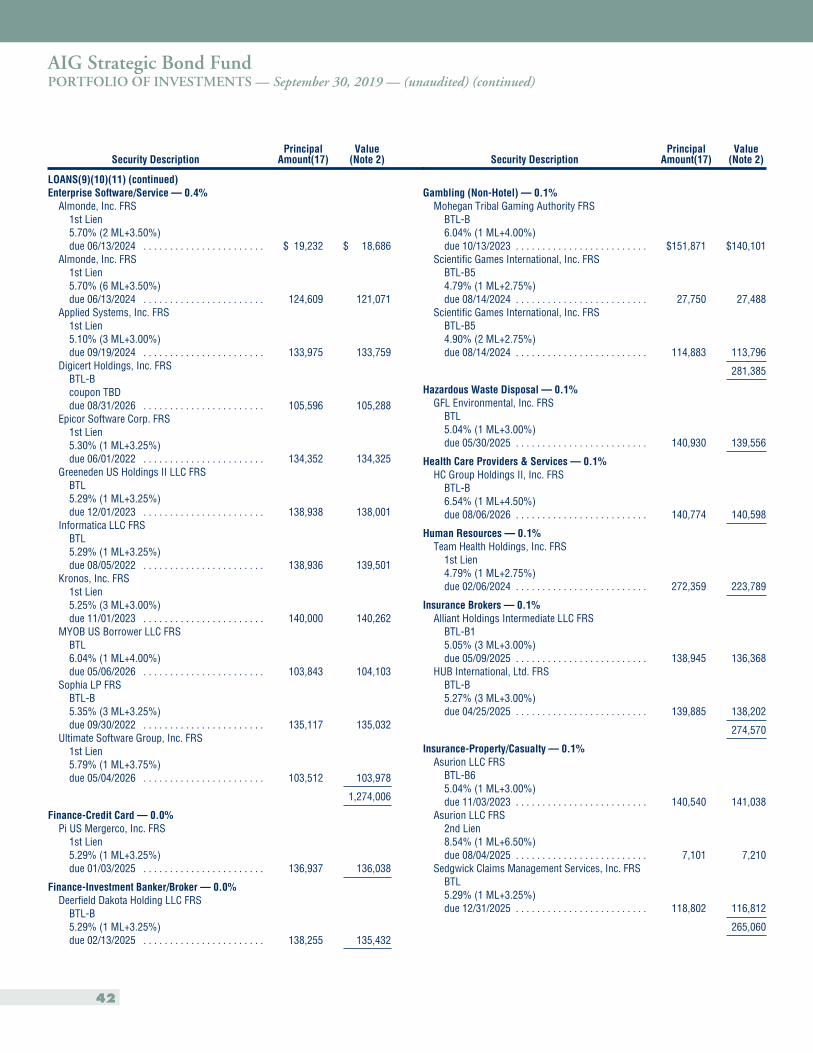
AIG Strategic Bond FundPORTFOLIO OF INVESTMENTS — September 30, 2019 — (unaudited) (continued)
Security DescriptionPrincipal
Amount(17)Value
(Note 2)
LOANS(9)(10)(11) (continued)Enterprise Software/Service — 0.4%
Almonde, Inc. FRS1st Lien5.70% (2 ML+3.50%)due 06/13/2024 . . . . . . . . . . . . . . . . . . . . . . . $ 19,232 $ 18,686
Almonde, Inc. FRS1st Lien5.70% (6 ML+3.50%)due 06/13/2024 . . . . . . . . . . . . . . . . . . . . . . . 124,609 121,071
Applied Systems, Inc. FRS1st Lien5.10% (3 ML+3.00%)due 09/19/2024 . . . . . . . . . . . . . . . . . . . . . . . 133,975 133,759
Digicert Holdings, Inc. FRSBTL-Bcoupon TBDdue 08/31/2026 . . . . . . . . . . . . . . . . . . . . . . . 105,596 105,288
Epicor Software Corp. FRS1st Lien5.30% (1 ML+3.25%)due 06/01/2022 . . . . . . . . . . . . . . . . . . . . . . . 134,352 134,325
Greeneden US Holdings II LLC FRSBTL5.29% (1 ML+3.25%)due 12/01/2023 . . . . . . . . . . . . . . . . . . . . . . . 138,938 138,001
Informatica LLC FRSBTL5.29% (1 ML+3.25%)due 08/05/2022 . . . . . . . . . . . . . . . . . . . . . . . 138,936 139,501
Kronos, Inc. FRS1st Lien5.25% (3 ML+3.00%)due 11/01/2023 . . . . . . . . . . . . . . . . . . . . . . . 140,000 140,262
MYOB US Borrower LLC FRSBTL6.04% (1 ML+4.00%)due 05/06/2026 . . . . . . . . . . . . . . . . . . . . . . . 103,843 104,103
Sophia LP FRSBTL-B5.35% (3 ML+3.25%)due 09/30/2022 . . . . . . . . . . . . . . . . . . . . . . . 135,117 135,032
Ultimate Software Group, Inc. FRS1st Lien5.79% (1 ML+3.75%)due 05/04/2026 . . . . . . . . . . . . . . . . . . . . . . . 103,512 103,978
1,274,006
Finance-Credit Card — 0.0%Pi US Mergerco, Inc. FRS
1st Lien5.29% (1 ML+3.25%)due 01/03/2025 . . . . . . . . . . . . . . . . . . . . . . . 136,937 136,038
Finance-Investment Banker/Broker — 0.0%Deerfield Dakota Holding LLC FRS
BTL-B5.29% (1 ML+3.25%)due 02/13/2025 . . . . . . . . . . . . . . . . . . . . . . . 138,255 135,432
Security DescriptionPrincipal
Amount(17)Value
(Note 2)
Gambling (Non-Hotel) — 0.1%Mohegan Tribal Gaming Authority FRS
BTL-B6.04% (1 ML+4.00%)due 10/13/2023 . . . . . . . . . . . . . . . . . . . . . . . . . $151,871 $140,101
Scientific Games International, Inc. FRSBTL-B54.79% (1 ML+2.75%)due 08/14/2024 . . . . . . . . . . . . . . . . . . . . . . . . . 27,750 27,488
Scientific Games International, Inc. FRSBTL-B54.90% (2 ML+2.75%)due 08/14/2024 . . . . . . . . . . . . . . . . . . . . . . . . . 114,883 113,796
281,385
Hazardous Waste Disposal — 0.1%GFL Environmental, Inc. FRS
BTL5.04% (1 ML+3.00%)due 05/30/2025 . . . . . . . . . . . . . . . . . . . . . . . . . 140,930 139,556
Health Care Providers & Services — 0.1%HC Group Holdings II, Inc. FRS
BTL-B6.54% (1 ML+4.50%)due 08/06/2026 . . . . . . . . . . . . . . . . . . . . . . . . . 140,774 140,598
Human Resources — 0.1%Team Health Holdings, Inc. FRS
1st Lien4.79% (1 ML+2.75%)due 02/06/2024 . . . . . . . . . . . . . . . . . . . . . . . . . 272,359 223,789
Insurance Brokers — 0.1%Alliant Holdings Intermediate LLC FRS
BTL-B15.05% (3 ML+3.00%)due 05/09/2025 . . . . . . . . . . . . . . . . . . . . . . . . . 138,945 136,368
HUB International, Ltd. FRSBTL-B5.27% (3 ML+3.00%)due 04/25/2025 . . . . . . . . . . . . . . . . . . . . . . . . . 139,885 138,202
274,570
Insurance-Property/Casualty — 0.1%Asurion LLC FRS
BTL-B65.04% (1 ML+3.00%)due 11/03/2023 . . . . . . . . . . . . . . . . . . . . . . . . . 140,540 141,038
Asurion LLC FRS2nd Lien8.54% (1 ML+6.50%)due 08/04/2025 . . . . . . . . . . . . . . . . . . . . . . . . . 7,101 7,210
Sedgwick Claims Management Services, Inc. FRSBTL5.29% (1 ML+3.25%)due 12/31/2025 . . . . . . . . . . . . . . . . . . . . . . . . . 118,802 116,812
265,060
42
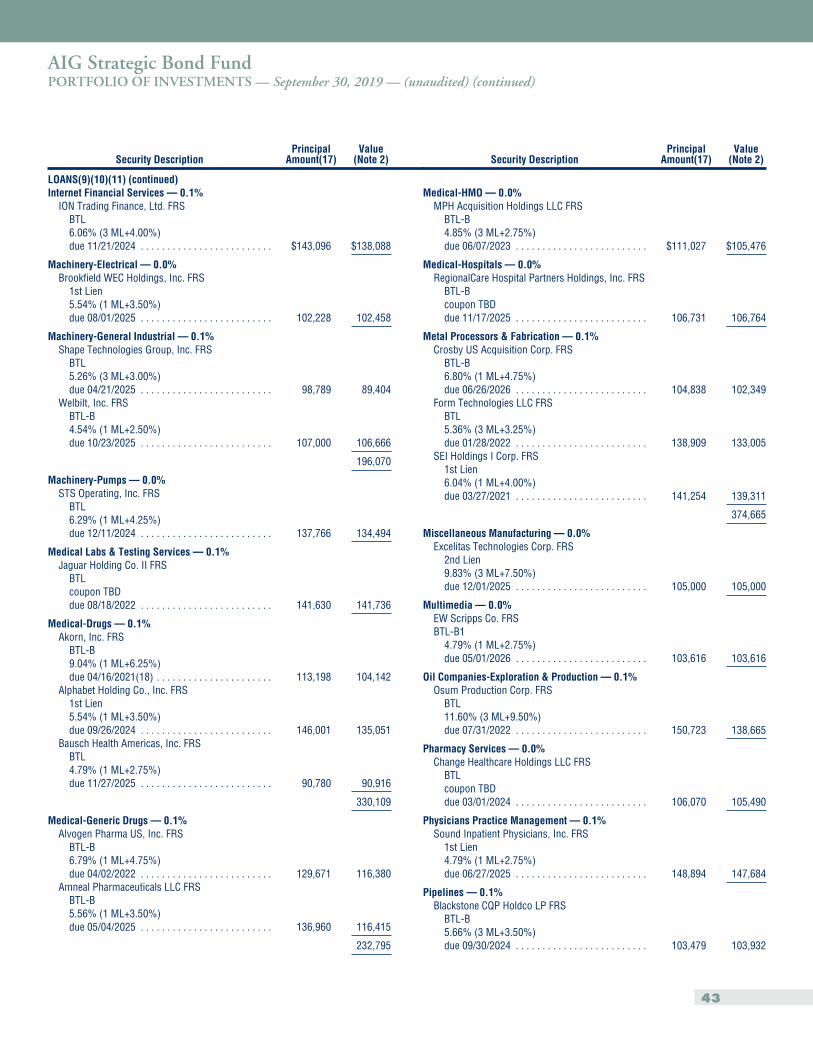
AIG Strategic Bond FundPORTFOLIO OF INVESTMENTS — September 30, 2019 — (unaudited) (continued)
Security DescriptionPrincipal
Amount(17)Value
(Note 2)
LOANS(9)(10)(11) (continued)Internet Financial Services — 0.1%
ION Trading Finance, Ltd. FRSBTL6.06% (3 ML+4.00%)due 11/21/2024 . . . . . . . . . . . . . . . . . . . . . . . . . $143,096 $138,088
Machinery-Electrical — 0.0%Brookfield WEC Holdings, Inc. FRS
1st Lien5.54% (1 ML+3.50%)due 08/01/2025 . . . . . . . . . . . . . . . . . . . . . . . . . 102,228 102,458
Machinery-General Industrial — 0.1%Shape Technologies Group, Inc. FRS
BTL5.26% (3 ML+3.00%)due 04/21/2025 . . . . . . . . . . . . . . . . . . . . . . . . . 98,789 89,404
Welbilt, Inc. FRSBTL-B4.54% (1 ML+2.50%)due 10/23/2025 . . . . . . . . . . . . . . . . . . . . . . . . . 107,000 106,666
196,070
Machinery-Pumps — 0.0%STS Operating, Inc. FRS
BTL6.29% (1 ML+4.25%)due 12/11/2024 . . . . . . . . . . . . . . . . . . . . . . . . . 137,766 134,494
Medical Labs & Testing Services — 0.1%Jaguar Holding Co. II FRS
BTLcoupon TBDdue 08/18/2022 . . . . . . . . . . . . . . . . . . . . . . . . . 141,630 141,736
Medical-Drugs — 0.1%Akorn, Inc. FRS
BTL-B9.04% (1 ML+6.25%)due 04/16/2021(18) . . . . . . . . . . . . . . . . . . . . . . 113,198 104,142
Alphabet Holding Co., Inc. FRS1st Lien5.54% (1 ML+3.50%)due 09/26/2024 . . . . . . . . . . . . . . . . . . . . . . . . . 146,001 135,051
Bausch Health Americas, Inc. FRSBTL4.79% (1 ML+2.75%)due 11/27/2025 . . . . . . . . . . . . . . . . . . . . . . . . . 90,780 90,916
330,109
Medical-Generic Drugs — 0.1%Alvogen Pharma US, Inc. FRS
BTL-B6.79% (1 ML+4.75%)due 04/02/2022 . . . . . . . . . . . . . . . . . . . . . . . . . 129,671 116,380
Amneal Pharmaceuticals LLC FRSBTL-B5.56% (1 ML+3.50%)due 05/04/2025 . . . . . . . . . . . . . . . . . . . . . . . . . 136,960 116,415
232,795
Security DescriptionPrincipal
Amount(17)Value
(Note 2)
Medical-HMO — 0.0%MPH Acquisition Holdings LLC FRS
BTL-B4.85% (3 ML+2.75%)due 06/07/2023 . . . . . . . . . . . . . . . . . . . . . . . . . $111,027 $105,476
Medical-Hospitals — 0.0%RegionalCare Hospital Partners Holdings, Inc. FRS
BTL-Bcoupon TBDdue 11/17/2025 . . . . . . . . . . . . . . . . . . . . . . . . . 106,731 106,764
Metal Processors & Fabrication — 0.1%Crosby US Acquisition Corp. FRS
BTL-B6.80% (1 ML+4.75%)due 06/26/2026 . . . . . . . . . . . . . . . . . . . . . . . . . 104,838 102,349
Form Technologies LLC FRSBTL5.36% (3 ML+3.25%)due 01/28/2022 . . . . . . . . . . . . . . . . . . . . . . . . . 138,909 133,005
SEI Holdings I Corp. FRS1st Lien6.04% (1 ML+4.00%)due 03/27/2021 . . . . . . . . . . . . . . . . . . . . . . . . . 141,254 139,311
374,665
Miscellaneous Manufacturing — 0.0%Excelitas Technologies Corp. FRS
2nd Lien9.83% (3 ML+7.50%)due 12/01/2025 . . . . . . . . . . . . . . . . . . . . . . . . . 105,000 105,000
Multimedia — 0.0%EW Scripps Co. FRSBTL-B1
4.79% (1 ML+2.75%)due 05/01/2026 . . . . . . . . . . . . . . . . . . . . . . . . . 103,616 103,616
Oil Companies-Exploration & Production — 0.1%Osum Production Corp. FRS
BTL11.60% (3 ML+9.50%)due 07/31/2022 . . . . . . . . . . . . . . . . . . . . . . . . . 150,723 138,665
Pharmacy Services — 0.0%Change Healthcare Holdings LLC FRS
BTLcoupon TBDdue 03/01/2024 . . . . . . . . . . . . . . . . . . . . . . . . . 106,070 105,490
Physicians Practice Management — 0.1%Sound Inpatient Physicians, Inc. FRS
1st Lien4.79% (1 ML+2.75%)due 06/27/2025 . . . . . . . . . . . . . . . . . . . . . . . . . 148,894 147,684
Pipelines — 0.1%Blackstone CQP Holdco LP FRS
BTL-B5.66% (3 ML+3.50%)due 09/30/2024 . . . . . . . . . . . . . . . . . . . . . . . . . 103,479 103,932
43
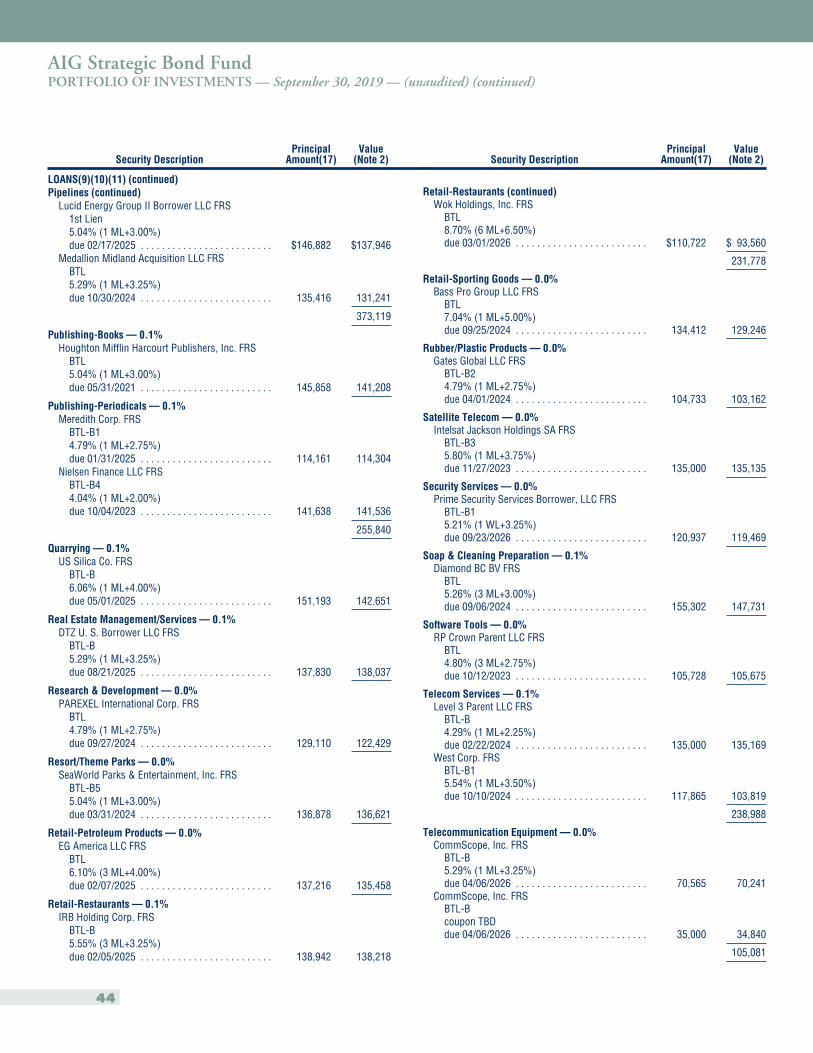
AIG Strategic Bond FundPORTFOLIO OF INVESTMENTS — September 30, 2019 — (unaudited) (continued)
Security DescriptionPrincipal
Amount(17)Value
(Note 2)
LOANS(9)(10)(11) (continued)Pipelines (continued)
Lucid Energy Group II Borrower LLC FRS1st Lien5.04% (1 ML+3.00%)due 02/17/2025 . . . . . . . . . . . . . . . . . . . . . . . . . $146,882 $137,946
Medallion Midland Acquisition LLC FRSBTL5.29% (1 ML+3.25%)due 10/30/2024 . . . . . . . . . . . . . . . . . . . . . . . . . 135,416 131,241
373,119
Publishing-Books — 0.1%Houghton Mifflin Harcourt Publishers, Inc. FRS
BTL5.04% (1 ML+3.00%)due 05/31/2021 . . . . . . . . . . . . . . . . . . . . . . . . . 145,858 141,208
Publishing-Periodicals — 0.1%Meredith Corp. FRS
BTL-B14.79% (1 ML+2.75%)due 01/31/2025 . . . . . . . . . . . . . . . . . . . . . . . . . 114,161 114,304
Nielsen Finance LLC FRSBTL-B44.04% (1 ML+2.00%)due 10/04/2023 . . . . . . . . . . . . . . . . . . . . . . . . . 141,638 141,536
255,840
Quarrying — 0.1%US Silica Co. FRS
BTL-B6.06% (1 ML+4.00%)due 05/01/2025 . . . . . . . . . . . . . . . . . . . . . . . . . 151,193 142,651
Real Estate Management/Services — 0.1%DTZ U. S. Borrower LLC FRS
BTL-B5.29% (1 ML+3.25%)due 08/21/2025 . . . . . . . . . . . . . . . . . . . . . . . . . 137,830 138,037
Research & Development — 0.0%PAREXEL International Corp. FRS
BTL4.79% (1 ML+2.75%)due 09/27/2024 . . . . . . . . . . . . . . . . . . . . . . . . . 129,110 122,429
Resort/Theme Parks — 0.0%SeaWorld Parks & Entertainment, Inc. FRS
BTL-B55.04% (1 ML+3.00%)due 03/31/2024 . . . . . . . . . . . . . . . . . . . . . . . . . 136,878 136,621
Retail-Petroleum Products — 0.0%EG America LLC FRS
BTL6.10% (3 ML+4.00%)due 02/07/2025 . . . . . . . . . . . . . . . . . . . . . . . . . 137,216 135,458
Retail-Restaurants — 0.1%IRB Holding Corp. FRS
BTL-B5.55% (3 ML+3.25%)due 02/05/2025 . . . . . . . . . . . . . . . . . . . . . . . . . 138,942 138,218
Security DescriptionPrincipal
Amount(17)Value
(Note 2)
Retail-Restaurants (continued)Wok Holdings, Inc. FRS
BTL8.70% (6 ML+6.50%)due 03/01/2026 . . . . . . . . . . . . . . . . . . . . . . . . . $110,722 $ 93,560
231,778
Retail-Sporting Goods — 0.0%Bass Pro Group LLC FRS
BTL7.04% (1 ML+5.00%)due 09/25/2024 . . . . . . . . . . . . . . . . . . . . . . . . . 134,412 129,246
Rubber/Plastic Products — 0.0%Gates Global LLC FRS
BTL-B24.79% (1 ML+2.75%)due 04/01/2024 . . . . . . . . . . . . . . . . . . . . . . . . . 104,733 103,162
Satellite Telecom — 0.0%Intelsat Jackson Holdings SA FRS
BTL-B35.80% (1 ML+3.75%)due 11/27/2023 . . . . . . . . . . . . . . . . . . . . . . . . . 135,000 135,135
Security Services — 0.0%Prime Security Services Borrower, LLC FRS
BTL-B15.21% (1 WL+3.25%)due 09/23/2026 . . . . . . . . . . . . . . . . . . . . . . . . . 120,937 119,469
Soap & Cleaning Preparation — 0.1%Diamond BC BV FRS
BTL5.26% (3 ML+3.00%)due 09/06/2024 . . . . . . . . . . . . . . . . . . . . . . . . . 155,302 147,731
Software Tools — 0.0%RP Crown Parent LLC FRS
BTL4.80% (3 ML+2.75%)due 10/12/2023 . . . . . . . . . . . . . . . . . . . . . . . . . 105,728 105,675
Telecom Services — 0.1%Level 3 Parent LLC FRS
BTL-B4.29% (1 ML+2.25%)due 02/22/2024 . . . . . . . . . . . . . . . . . . . . . . . . . 135,000 135,169
West Corp. FRSBTL-B15.54% (1 ML+3.50%)due 10/10/2024 . . . . . . . . . . . . . . . . . . . . . . . . . 117,865 103,819
238,988
Telecommunication Equipment — 0.0%CommScope, Inc. FRS
BTL-B5.29% (1 ML+3.25%)due 04/06/2026 . . . . . . . . . . . . . . . . . . . . . . . . . 70,565 70,241
CommScope, Inc. FRSBTL-Bcoupon TBDdue 04/06/2026 . . . . . . . . . . . . . . . . . . . . . . . . . 35,000 34,840
105,081
44
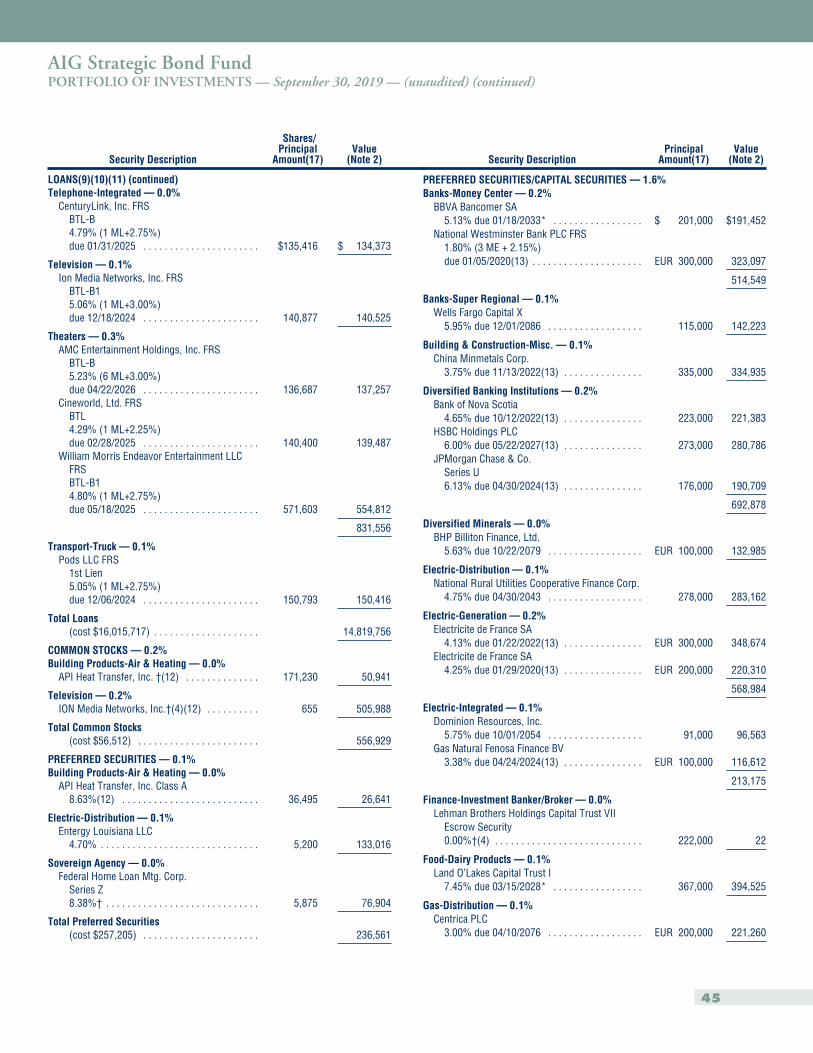
AIG Strategic Bond FundPORTFOLIO OF INVESTMENTS — September 30, 2019 — (unaudited) (continued)
Security Description
Shares/Principal
Amount(17)Value
(Note 2)
LOANS(9)(10)(11) (continued)Telephone-Integrated — 0.0%
CenturyLink, Inc. FRSBTL-B4.79% (1 ML+2.75%)due 01/31/2025 . . . . . . . . . . . . . . . . . . . . . . $135,416 $ 134,373
Television — 0.1%Ion Media Networks, Inc. FRS
BTL-B15.06% (1 ML+3.00%)due 12/18/2024 . . . . . . . . . . . . . . . . . . . . . . 140,877 140,525
Theaters — 0.3%AMC Entertainment Holdings, Inc. FRS
BTL-B5.23% (6 ML+3.00%)due 04/22/2026 . . . . . . . . . . . . . . . . . . . . . . 136,687 137,257
Cineworld, Ltd. FRSBTL4.29% (1 ML+2.25%)due 02/28/2025 . . . . . . . . . . . . . . . . . . . . . . 140,400 139,487
William Morris Endeavor Entertainment LLCFRSBTL-B14.80% (1 ML+2.75%)due 05/18/2025 . . . . . . . . . . . . . . . . . . . . . . 571,603 554,812
831,556
Transport-Truck — 0.1%Pods LLC FRS
1st Lien5.05% (1 ML+2.75%)due 12/06/2024 . . . . . . . . . . . . . . . . . . . . . . 150,793 150,416
Total Loans(cost $16,015,717) . . . . . . . . . . . . . . . . . . . . 14,819,756
COMMON STOCKS — 0.2%Building Products-Air & Heating — 0.0%
API Heat Transfer, Inc. †(12) . . . . . . . . . . . . . . 171,230 50,941
Television — 0.2%ION Media Networks, Inc.†(4)(12) . . . . . . . . . . 655 505,988
Total Common Stocks(cost $56,512) . . . . . . . . . . . . . . . . . . . . . . . 556,929
PREFERRED SECURITIES — 0.1%Building Products-Air & Heating — 0.0%
API Heat Transfer, Inc. Class A8.63%(12) . . . . . . . . . . . . . . . . . . . . . . . . . . 36,495 26,641
Electric-Distribution — 0.1%Entergy Louisiana LLC
4.70% . . . . . . . . . . . . . . . . . . . . . . . . . . . . . . 5,200 133,016
Sovereign Agency — 0.0%Federal Home Loan Mtg. Corp.
Series Z8.38%† . . . . . . . . . . . . . . . . . . . . . . . . . . . . . 5,875 76,904
Total Preferred Securities(cost $257,205) . . . . . . . . . . . . . . . . . . . . . . 236,561
Security DescriptionPrincipal
Amount(17)Value
(Note 2)
PREFERRED SECURITIES/CAPITAL SECURITIES — 1.6%Banks-Money Center — 0.2%
BBVA Bancomer SA5.13% due 01/18/2033* . . . . . . . . . . . . . . . . . $ 201,000 $191,452
National Westminster Bank PLC FRS1.80% (3 ME + 2.15%)due 01/05/2020(13) . . . . . . . . . . . . . . . . . . . . . EUR 300,000 323,097
514,549
Banks-Super Regional — 0.1%Wells Fargo Capital X
5.95% due 12/01/2086 . . . . . . . . . . . . . . . . . . 115,000 142,223
Building & Construction-Misc. — 0.1%China Minmetals Corp.
3.75% due 11/13/2022(13) . . . . . . . . . . . . . . . 335,000 334,935
Diversified Banking Institutions — 0.2%Bank of Nova Scotia
4.65% due 10/12/2022(13) . . . . . . . . . . . . . . . 223,000 221,383HSBC Holdings PLC
6.00% due 05/22/2027(13) . . . . . . . . . . . . . . . 273,000 280,786JPMorgan Chase & Co.
Series U6.13% due 04/30/2024(13) . . . . . . . . . . . . . . . 176,000 190,709
692,878
Diversified Minerals — 0.0%BHP Billiton Finance, Ltd.
5.63% due 10/22/2079 . . . . . . . . . . . . . . . . . . EUR 100,000 132,985
Electric-Distribution — 0.1%National Rural Utilities Cooperative Finance Corp.
4.75% due 04/30/2043 . . . . . . . . . . . . . . . . . . 278,000 283,162
Electric-Generation — 0.2%Electricite de France SA
4.13% due 01/22/2022(13) . . . . . . . . . . . . . . . EUR 300,000 348,674Electricite de France SA
4.25% due 01/29/2020(13) . . . . . . . . . . . . . . . EUR 200,000 220,310
568,984
Electric-Integrated — 0.1%Dominion Resources, Inc.
5.75% due 10/01/2054 . . . . . . . . . . . . . . . . . . 91,000 96,563Gas Natural Fenosa Finance BV
3.38% due 04/24/2024(13) . . . . . . . . . . . . . . . EUR 100,000 116,612
213,175
Finance-Investment Banker/Broker — 0.0%Lehman Brothers Holdings Capital Trust VII
Escrow Security0.00%†(4) . . . . . . . . . . . . . . . . . . . . . . . . . . . . 222,000 22
Food-Dairy Products — 0.1%Land O’Lakes Capital Trust I
7.45% due 03/15/2028* . . . . . . . . . . . . . . . . . 367,000 394,525
Gas-Distribution — 0.1%Centrica PLC
3.00% due 04/10/2076 . . . . . . . . . . . . . . . . . . EUR 200,000 221,260
45
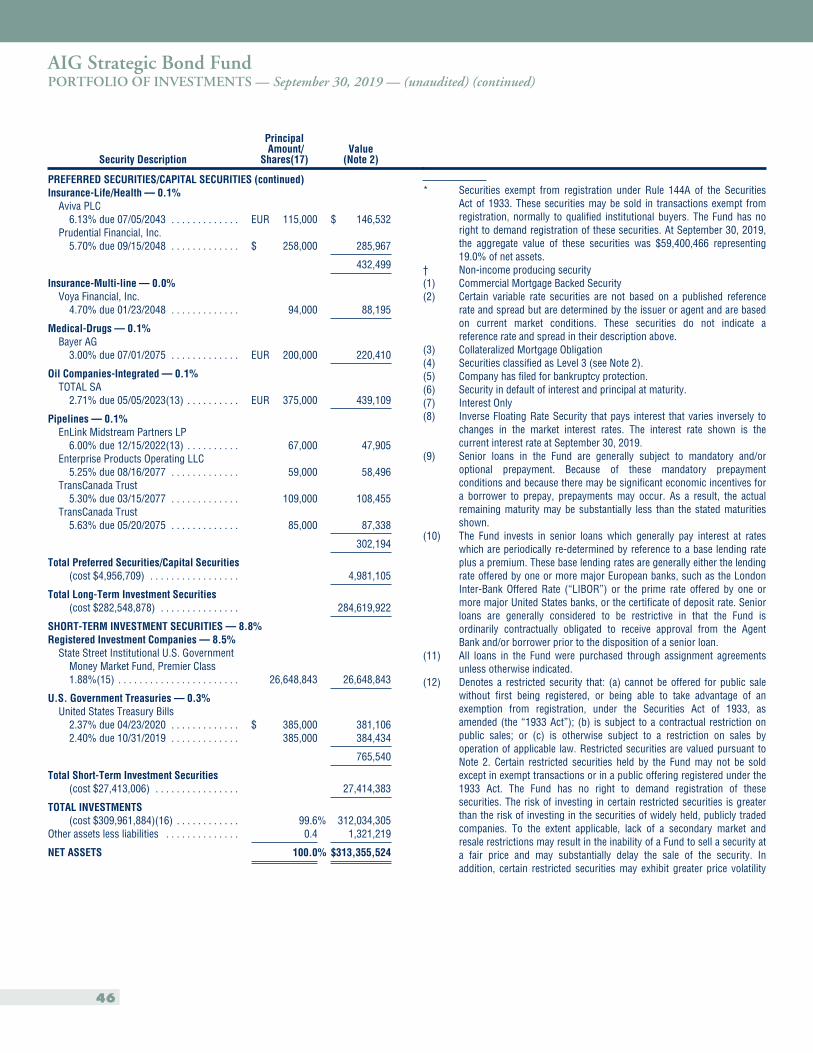
AIG Strategic Bond FundPORTFOLIO OF INVESTMENTS — September 30, 2019 — (unaudited) (continued)
Security Description
PrincipalAmount/
Shares(17)Value
(Note 2)
PREFERRED SECURITIES/CAPITAL SECURITIES (continued)Insurance-Life/Health — 0.1%
Aviva PLC6.13% due 07/05/2043 . . . . . . . . . . . . . EUR 115,000 $ 146,532
Prudential Financial, Inc.5.70% due 09/15/2048 . . . . . . . . . . . . . $ 258,000 285,967
432,499
Insurance-Multi-line — 0.0%Voya Financial, Inc.
4.70% due 01/23/2048 . . . . . . . . . . . . . 94,000 88,195
Medical-Drugs — 0.1%Bayer AG
3.00% due 07/01/2075 . . . . . . . . . . . . . EUR 200,000 220,410
Oil Companies-Integrated — 0.1%TOTAL SA
2.71% due 05/05/2023(13) . . . . . . . . . . EUR 375,000 439,109
Pipelines — 0.1%EnLink Midstream Partners LP
6.00% due 12/15/2022(13) . . . . . . . . . . 67,000 47,905Enterprise Products Operating LLC
5.25% due 08/16/2077 . . . . . . . . . . . . . 59,000 58,496TransCanada Trust
5.30% due 03/15/2077 . . . . . . . . . . . . . 109,000 108,455TransCanada Trust
5.63% due 05/20/2075 . . . . . . . . . . . . . 85,000 87,338
302,194
Total Preferred Securities/Capital Securities(cost $4,956,709) . . . . . . . . . . . . . . . . . 4,981,105
Total Long-Term Investment Securities(cost $282,548,878) . . . . . . . . . . . . . . . 284,619,922
SHORT-TERM INVESTMENT SECURITIES — 8.8%Registered Investment Companies — 8.5%
State Street Institutional U.S. GovernmentMoney Market Fund, Premier Class1.88%(15) . . . . . . . . . . . . . . . . . . . . . . . 26,648,843 26,648,843
U.S. Government Treasuries — 0.3%United States Treasury Bills
2.37% due 04/23/2020 . . . . . . . . . . . . . $ 385,000 381,1062.40% due 10/31/2019 . . . . . . . . . . . . . 385,000 384,434
765,540
Total Short-Term Investment Securities(cost $27,413,006) . . . . . . . . . . . . . . . . 27,414,383
TOTAL INVESTMENTS(cost $309,961,884)(16) . . . . . . . . . . . . 99.6% 312,034,305
Other assets less liabilities . . . . . . . . . . . . . . 0.4 1,321,219
NET ASSETS 100.0% $313,355,524
* Securities exempt from registration under Rule 144A of the SecuritiesAct of 1933. These securities may be sold in transactions exempt fromregistration, normally to qualified institutional buyers. The Fund has noright to demand registration of these securities. At September 30, 2019,the aggregate value of these securities was $59,400,466 representing19.0% of net assets.
† Non-income producing security(1) Commercial Mortgage Backed Security(2) Certain variable rate securities are not based on a published reference
rate and spread but are determined by the issuer or agent and are basedon current market conditions. These securities do not indicate areference rate and spread in their description above.
(3) Collateralized Mortgage Obligation(4) Securities classified as Level 3 (see Note 2).(5) Company has filed for bankruptcy protection.(6) Security in default of interest and principal at maturity.(7) Interest Only(8) Inverse Floating Rate Security that pays interest that varies inversely to
changes in the market interest rates. The interest rate shown is thecurrent interest rate at September 30, 2019.
(9) Senior loans in the Fund are generally subject to mandatory and/oroptional prepayment. Because of these mandatory prepaymentconditions and because there may be significant economic incentives fora borrower to prepay, prepayments may occur. As a result, the actualremaining maturity may be substantially less than the stated maturitiesshown.
(10) The Fund invests in senior loans which generally pay interest at rateswhich are periodically re-determined by reference to a base lending rateplus a premium. These base lending rates are generally either the lendingrate offered by one or more major European banks, such as the LondonInter-Bank Offered Rate (“LIBOR”) or the prime rate offered by one ormore major United States banks, or the certificate of deposit rate. Seniorloans are generally considered to be restrictive in that the Fund isordinarily contractually obligated to receive approval from the AgentBank and/or borrower prior to the disposition of a senior loan.
(11) All loans in the Fund were purchased through assignment agreementsunless otherwise indicated.
(12) Denotes a restricted security that: (a) cannot be offered for public salewithout first being registered, or being able to take advantage of anexemption from registration, under the Securities Act of 1933, asamended (the “1933 Act”); (b) is subject to a contractual restriction onpublic sales; or (c) is otherwise subject to a restriction on sales byoperation of applicable law. Restricted securities are valued pursuant toNote 2. Certain restricted securities held by the Fund may not be soldexcept in exempt transactions or in a public offering registered under the1933 Act. The Fund has no right to demand registration of thesesecurities. The risk of investing in certain restricted securities is greaterthan the risk of investing in the securities of widely held, publicly tradedcompanies. To the extent applicable, lack of a secondary market andresale restrictions may result in the inability of a Fund to sell a security ata fair price and may substantially delay the sale of the security. Inaddition, certain restricted securities may exhibit greater price volatility
46
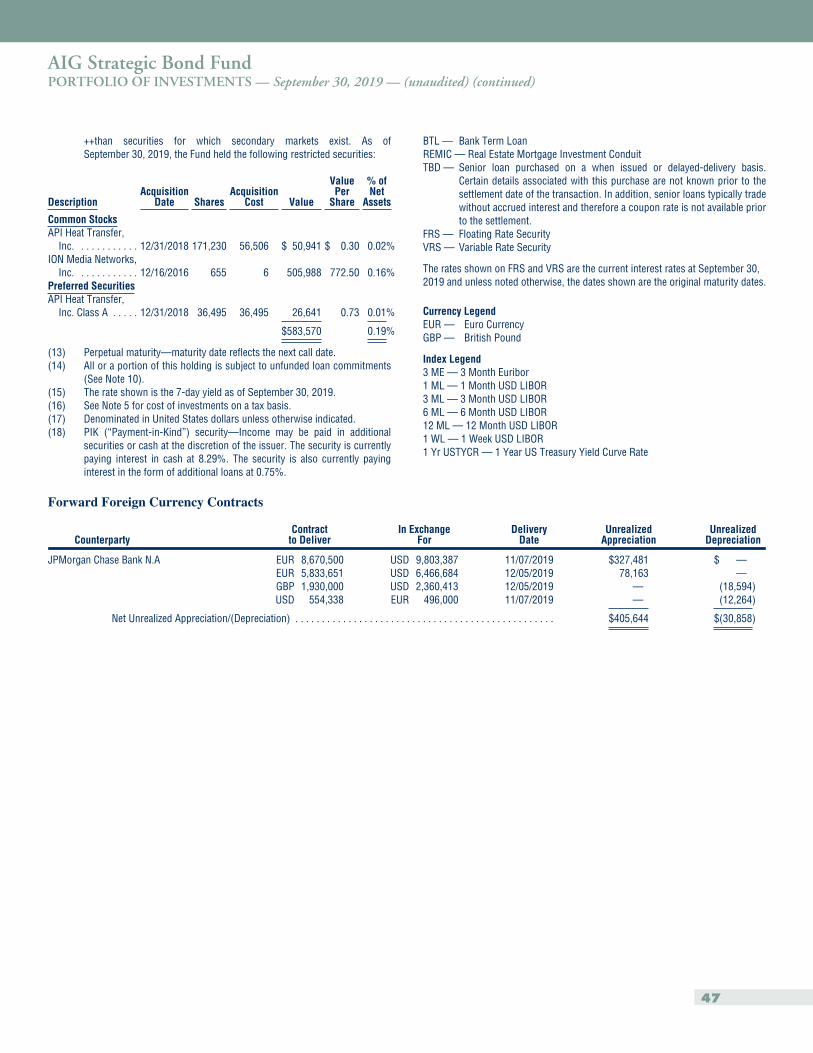
AIG Strategic Bond FundPORTFOLIO OF INVESTMENTS — September 30, 2019 — (unaudited) (continued)
++than securities for which secondary markets exist. As ofSeptember 30, 2019, the Fund held the following restricted securities:
DescriptionAcquisition
Date SharesAcquisition
Cost Value
ValuePer
Share
% ofNet
Assets
Common StocksAPI Heat Transfer,
Inc. . . . . . . . . . . . 12/31/2018 171,230 56,506 $ 50,941 $ 0.30 0.02%ION Media Networks,
Inc. . . . . . . . . . . . 12/16/2016 655 6 505,988 772.50 0.16%Preferred SecuritiesAPI Heat Transfer,
Inc. Class A . . . . . 12/31/2018 36,495 36,495 26,641 0.73 0.01%
$583,570 0.19%
(13) Perpetual maturity—maturity date reflects the next call date.(14) All or a portion of this holding is subject to unfunded loan commitments
(See Note 10).(15) The rate shown is the 7-day yield as of September 30, 2019.(16) See Note 5 for cost of investments on a tax basis.(17) Denominated in United States dollars unless otherwise indicated.(18) PIK (“Payment-in-Kind”) security—Income may be paid in additional
securities or cash at the discretion of the issuer. The security is currentlypaying interest in cash at 8.29%. The security is also currently payinginterest in the form of additional loans at 0.75%.
BTL — Bank Term LoanREMIC — Real Estate Mortgage Investment ConduitTBD — Senior loan purchased on a when issued or delayed-delivery basis.
Certain details associated with this purchase are not known prior to thesettlement date of the transaction. In addition, senior loans typically tradewithout accrued interest and therefore a coupon rate is not available priorto the settlement.
FRS — Floating Rate SecurityVRS — Variable Rate Security
The rates shown on FRS and VRS are the current interest rates at September 30,2019 and unless noted otherwise, the dates shown are the original maturity dates.
Currency LegendEUR — Euro CurrencyGBP — British Pound
Index Legend3 ME — 3 Month Euribor1 ML — 1 Month USD LIBOR3 ML — 3 Month USD LIBOR6 ML — 6 Month USD LIBOR12 ML — 12 Month USD LIBOR1 WL — 1 Week USD LIBOR1 Yr USTYCR — 1 Year US Treasury Yield Curve Rate
Forward Foreign Currency Contracts
CounterpartyContract
to DeliverIn Exchange
ForDelivery
DateUnrealized
AppreciationUnrealized
Depreciation
JPMorgan Chase Bank N.A EUR 8,670,500 USD 9,803,387 11/07/2019 $327,481 $ —EUR 5,833,651 USD 6,466,684 12/05/2019 78,163 —GBP 1,930,000 USD 2,360,413 12/05/2019 — (18,594)USD 554,338 EUR 496,000 11/07/2019 — (12,264)
Net Unrealized Appreciation/(Depreciation) . . . . . . . . . . . . . . . . . . . . . . . . . . . . . . . . . . . . . . . . . . . . . . . . . $405,644 $(30,858)
47
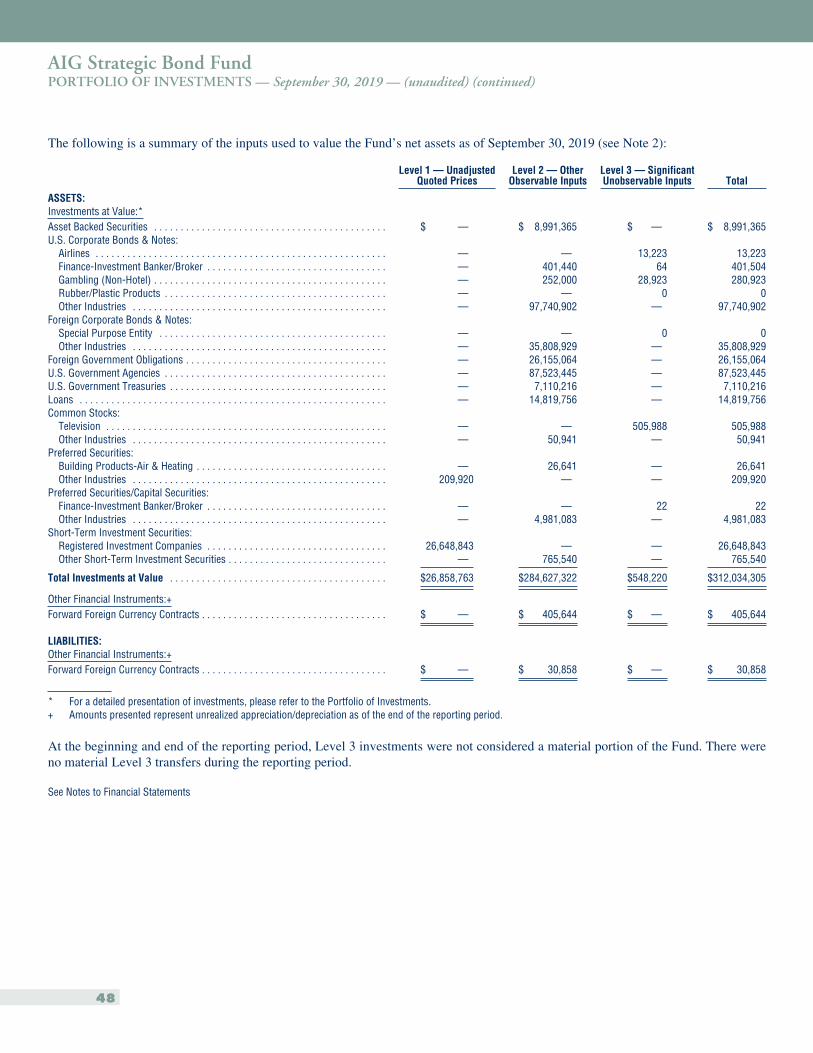
AIG Strategic Bond FundPORTFOLIO OF INVESTMENTS — September 30, 2019 — (unaudited) (continued)
The following is a summary of the inputs used to value the Fund’s net assets as of September 30, 2019 (see Note 2):
Level 1 — UnadjustedQuoted Prices
Level 2 — OtherObservable Inputs
Level 3 — SignificantUnobservable Inputs Total
ASSETS:Investments at Value:*Asset Backed Securities . . . . . . . . . . . . . . . . . . . . . . . . . . . . . . . . . . . . . . . . . . . . $ — $ 8,991,365 $ — $ 8,991,365U.S. Corporate Bonds & Notes:
Airlines . . . . . . . . . . . . . . . . . . . . . . . . . . . . . . . . . . . . . . . . . . . . . . . . . . . . . . . — — 13,223 13,223Finance-Investment Banker/Broker . . . . . . . . . . . . . . . . . . . . . . . . . . . . . . . . . . — 401,440 64 401,504Gambling (Non-Hotel) . . . . . . . . . . . . . . . . . . . . . . . . . . . . . . . . . . . . . . . . . . . . — 252,000 28,923 280,923Rubber/Plastic Products . . . . . . . . . . . . . . . . . . . . . . . . . . . . . . . . . . . . . . . . . . — — 0 0Other Industries . . . . . . . . . . . . . . . . . . . . . . . . . . . . . . . . . . . . . . . . . . . . . . . . — 97,740,902 — 97,740,902
Foreign Corporate Bonds & Notes:Special Purpose Entity . . . . . . . . . . . . . . . . . . . . . . . . . . . . . . . . . . . . . . . . . . . — — 0 0Other Industries . . . . . . . . . . . . . . . . . . . . . . . . . . . . . . . . . . . . . . . . . . . . . . . . — 35,808,929 — 35,808,929
Foreign Government Obligations . . . . . . . . . . . . . . . . . . . . . . . . . . . . . . . . . . . . . . — 26,155,064 — 26,155,064U.S. Government Agencies . . . . . . . . . . . . . . . . . . . . . . . . . . . . . . . . . . . . . . . . . . — 87,523,445 — 87,523,445U.S. Government Treasuries . . . . . . . . . . . . . . . . . . . . . . . . . . . . . . . . . . . . . . . . . — 7,110,216 — 7,110,216Loans . . . . . . . . . . . . . . . . . . . . . . . . . . . . . . . . . . . . . . . . . . . . . . . . . . . . . . . . . . — 14,819,756 — 14,819,756Common Stocks:
Television . . . . . . . . . . . . . . . . . . . . . . . . . . . . . . . . . . . . . . . . . . . . . . . . . . . . . — — 505,988 505,988Other Industries . . . . . . . . . . . . . . . . . . . . . . . . . . . . . . . . . . . . . . . . . . . . . . . . — 50,941 — 50,941
Preferred Securities:Building Products-Air & Heating . . . . . . . . . . . . . . . . . . . . . . . . . . . . . . . . . . . . — 26,641 — 26,641Other Industries . . . . . . . . . . . . . . . . . . . . . . . . . . . . . . . . . . . . . . . . . . . . . . . . 209,920 — — 209,920
Preferred Securities/Capital Securities:Finance-Investment Banker/Broker . . . . . . . . . . . . . . . . . . . . . . . . . . . . . . . . . . — — 22 22Other Industries . . . . . . . . . . . . . . . . . . . . . . . . . . . . . . . . . . . . . . . . . . . . . . . . — 4,981,083 — 4,981,083
Short-Term Investment Securities:Registered Investment Companies . . . . . . . . . . . . . . . . . . . . . . . . . . . . . . . . . . 26,648,843 — — 26,648,843Other Short-Term Investment Securities . . . . . . . . . . . . . . . . . . . . . . . . . . . . . . — 765,540 — 765,540
Total Investments at Value . . . . . . . . . . . . . . . . . . . . . . . . . . . . . . . . . . . . . . . . . $26,858,763 $284,627,322 $548,220 $312,034,305
Other Financial Instruments:+Forward Foreign Currency Contracts . . . . . . . . . . . . . . . . . . . . . . . . . . . . . . . . . . . $ — $ 405,644 $ — $ 405,644
LIABILITIES:Other Financial Instruments:+Forward Foreign Currency Contracts . . . . . . . . . . . . . . . . . . . . . . . . . . . . . . . . . . . $ — $ 30,858 $ — $ 30,858
* For a detailed presentation of investments, please refer to the Portfolio of Investments.+ Amounts presented represent unrealized appreciation/depreciation as of the end of the reporting period.
At the beginning and end of the reporting period, Level 3 investments were not considered a material portion of the Fund. There wereno material Level 3 transfers during the reporting period.
See Notes to Financial Statements
48
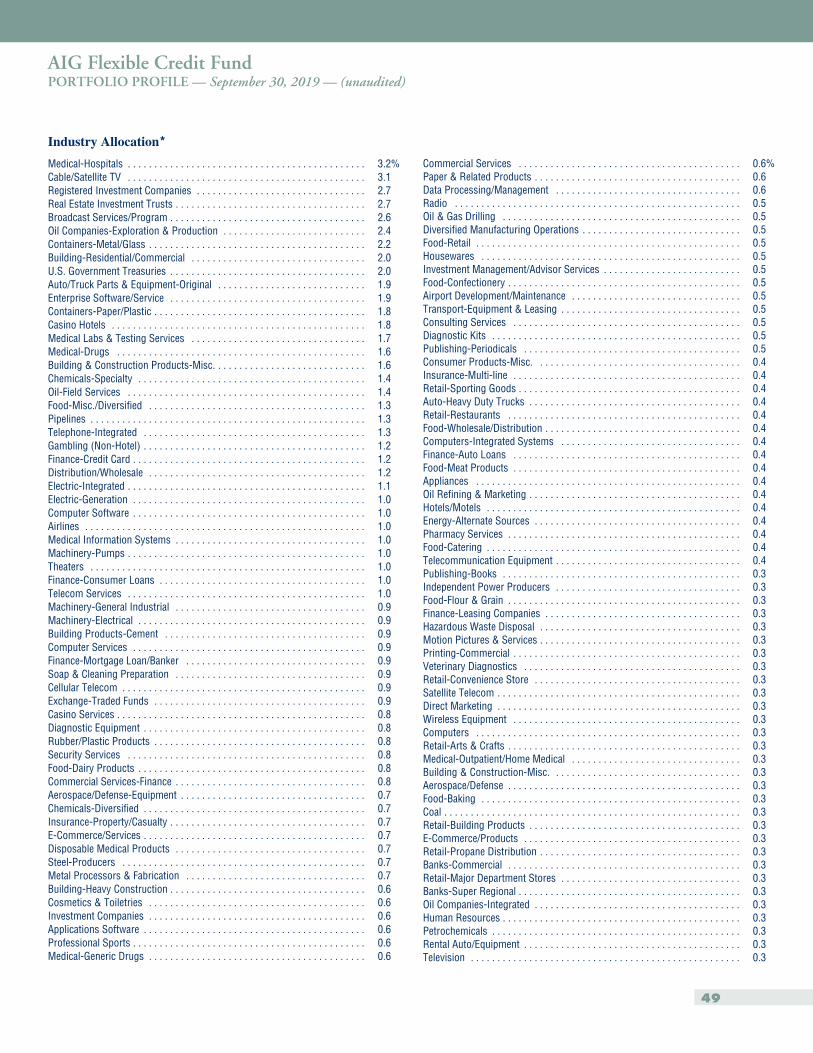
AIG Flexible Credit FundPORTFOLIO PROFILE — September 30, 2019 — (unaudited)
Industry Allocation*
Medical-Hospitals . . . . . . . . . . . . . . . . . . . . . . . . . . . . . . . . . . . . . . . . . . . . . 3.2%Cable/Satellite TV . . . . . . . . . . . . . . . . . . . . . . . . . . . . . . . . . . . . . . . . . . . . . 3.1Registered Investment Companies . . . . . . . . . . . . . . . . . . . . . . . . . . . . . . . . 2.7Real Estate Investment Trusts . . . . . . . . . . . . . . . . . . . . . . . . . . . . . . . . . . . . 2.7Broadcast Services/Program . . . . . . . . . . . . . . . . . . . . . . . . . . . . . . . . . . . . . 2.6Oil Companies-Exploration & Production . . . . . . . . . . . . . . . . . . . . . . . . . . . 2.4Containers-Metal/Glass . . . . . . . . . . . . . . . . . . . . . . . . . . . . . . . . . . . . . . . . . 2.2Building-Residential/Commercial . . . . . . . . . . . . . . . . . . . . . . . . . . . . . . . . . 2.0U.S. Government Treasuries . . . . . . . . . . . . . . . . . . . . . . . . . . . . . . . . . . . . . 2.0Auto/Truck Parts & Equipment-Original . . . . . . . . . . . . . . . . . . . . . . . . . . . . 1.9Enterprise Software/Service . . . . . . . . . . . . . . . . . . . . . . . . . . . . . . . . . . . . . 1.9Containers-Paper/Plastic . . . . . . . . . . . . . . . . . . . . . . . . . . . . . . . . . . . . . . . . 1.8Casino Hotels . . . . . . . . . . . . . . . . . . . . . . . . . . . . . . . . . . . . . . . . . . . . . . . . 1.8Medical Labs & Testing Services . . . . . . . . . . . . . . . . . . . . . . . . . . . . . . . . . 1.7Medical-Drugs . . . . . . . . . . . . . . . . . . . . . . . . . . . . . . . . . . . . . . . . . . . . . . . 1.6Building & Construction Products-Misc. . . . . . . . . . . . . . . . . . . . . . . . . . . . . 1.6Chemicals-Specialty . . . . . . . . . . . . . . . . . . . . . . . . . . . . . . . . . . . . . . . . . . . 1.4Oil-Field Services . . . . . . . . . . . . . . . . . . . . . . . . . . . . . . . . . . . . . . . . . . . . . 1.4Food-Misc./Diversified . . . . . . . . . . . . . . . . . . . . . . . . . . . . . . . . . . . . . . . . . 1.3Pipelines . . . . . . . . . . . . . . . . . . . . . . . . . . . . . . . . . . . . . . . . . . . . . . . . . . . . 1.3Telephone-Integrated . . . . . . . . . . . . . . . . . . . . . . . . . . . . . . . . . . . . . . . . . . 1.3Gambling (Non-Hotel) . . . . . . . . . . . . . . . . . . . . . . . . . . . . . . . . . . . . . . . . . . 1.2Finance-Credit Card . . . . . . . . . . . . . . . . . . . . . . . . . . . . . . . . . . . . . . . . . . . . 1.2Distribution/Wholesale . . . . . . . . . . . . . . . . . . . . . . . . . . . . . . . . . . . . . . . . . 1.2Electric-Integrated . . . . . . . . . . . . . . . . . . . . . . . . . . . . . . . . . . . . . . . . . . . . . 1.1Electric-Generation . . . . . . . . . . . . . . . . . . . . . . . . . . . . . . . . . . . . . . . . . . . . 1.0Computer Software . . . . . . . . . . . . . . . . . . . . . . . . . . . . . . . . . . . . . . . . . . . . 1.0Airlines . . . . . . . . . . . . . . . . . . . . . . . . . . . . . . . . . . . . . . . . . . . . . . . . . . . . . 1.0Medical Information Systems . . . . . . . . . . . . . . . . . . . . . . . . . . . . . . . . . . . . 1.0Machinery-Pumps . . . . . . . . . . . . . . . . . . . . . . . . . . . . . . . . . . . . . . . . . . . . . 1.0Theaters . . . . . . . . . . . . . . . . . . . . . . . . . . . . . . . . . . . . . . . . . . . . . . . . . . . . 1.0Finance-Consumer Loans . . . . . . . . . . . . . . . . . . . . . . . . . . . . . . . . . . . . . . . 1.0Telecom Services . . . . . . . . . . . . . . . . . . . . . . . . . . . . . . . . . . . . . . . . . . . . . 1.0Machinery-General Industrial . . . . . . . . . . . . . . . . . . . . . . . . . . . . . . . . . . . . 0.9Machinery-Electrical . . . . . . . . . . . . . . . . . . . . . . . . . . . . . . . . . . . . . . . . . . . 0.9Building Products-Cement . . . . . . . . . . . . . . . . . . . . . . . . . . . . . . . . . . . . . . 0.9Computer Services . . . . . . . . . . . . . . . . . . . . . . . . . . . . . . . . . . . . . . . . . . . . 0.9Finance-Mortgage Loan/Banker . . . . . . . . . . . . . . . . . . . . . . . . . . . . . . . . . . 0.9Soap & Cleaning Preparation . . . . . . . . . . . . . . . . . . . . . . . . . . . . . . . . . . . . 0.9Cellular Telecom . . . . . . . . . . . . . . . . . . . . . . . . . . . . . . . . . . . . . . . . . . . . . . 0.9Exchange-Traded Funds . . . . . . . . . . . . . . . . . . . . . . . . . . . . . . . . . . . . . . . . 0.9Casino Services . . . . . . . . . . . . . . . . . . . . . . . . . . . . . . . . . . . . . . . . . . . . . . . 0.8Diagnostic Equipment . . . . . . . . . . . . . . . . . . . . . . . . . . . . . . . . . . . . . . . . . . 0.8Rubber/Plastic Products . . . . . . . . . . . . . . . . . . . . . . . . . . . . . . . . . . . . . . . . 0.8Security Services . . . . . . . . . . . . . . . . . . . . . . . . . . . . . . . . . . . . . . . . . . . . . 0.8Food-Dairy Products . . . . . . . . . . . . . . . . . . . . . . . . . . . . . . . . . . . . . . . . . . . 0.8Commercial Services-Finance . . . . . . . . . . . . . . . . . . . . . . . . . . . . . . . . . . . . 0.8Aerospace/Defense-Equipment . . . . . . . . . . . . . . . . . . . . . . . . . . . . . . . . . . . 0.7Chemicals-Diversified . . . . . . . . . . . . . . . . . . . . . . . . . . . . . . . . . . . . . . . . . . 0.7Insurance-Property/Casualty . . . . . . . . . . . . . . . . . . . . . . . . . . . . . . . . . . . . . 0.7E-Commerce/Services . . . . . . . . . . . . . . . . . . . . . . . . . . . . . . . . . . . . . . . . . . 0.7Disposable Medical Products . . . . . . . . . . . . . . . . . . . . . . . . . . . . . . . . . . . . 0.7Steel-Producers . . . . . . . . . . . . . . . . . . . . . . . . . . . . . . . . . . . . . . . . . . . . . . 0.7Metal Processors & Fabrication . . . . . . . . . . . . . . . . . . . . . . . . . . . . . . . . . . 0.7Building-Heavy Construction . . . . . . . . . . . . . . . . . . . . . . . . . . . . . . . . . . . . . 0.6Cosmetics & Toiletries . . . . . . . . . . . . . . . . . . . . . . . . . . . . . . . . . . . . . . . . . 0.6Investment Companies . . . . . . . . . . . . . . . . . . . . . . . . . . . . . . . . . . . . . . . . . 0.6Applications Software . . . . . . . . . . . . . . . . . . . . . . . . . . . . . . . . . . . . . . . . . . 0.6Professional Sports . . . . . . . . . . . . . . . . . . . . . . . . . . . . . . . . . . . . . . . . . . . . 0.6Medical-Generic Drugs . . . . . . . . . . . . . . . . . . . . . . . . . . . . . . . . . . . . . . . . . 0.6
Commercial Services . . . . . . . . . . . . . . . . . . . . . . . . . . . . . . . . . . . . . . . . . . 0.6%Paper & Related Products . . . . . . . . . . . . . . . . . . . . . . . . . . . . . . . . . . . . . . . 0.6Data Processing/Management . . . . . . . . . . . . . . . . . . . . . . . . . . . . . . . . . . . 0.6Radio . . . . . . . . . . . . . . . . . . . . . . . . . . . . . . . . . . . . . . . . . . . . . . . . . . . . . . 0.5Oil & Gas Drilling . . . . . . . . . . . . . . . . . . . . . . . . . . . . . . . . . . . . . . . . . . . . . 0.5Diversified Manufacturing Operations . . . . . . . . . . . . . . . . . . . . . . . . . . . . . . 0.5Food-Retail . . . . . . . . . . . . . . . . . . . . . . . . . . . . . . . . . . . . . . . . . . . . . . . . . . 0.5Housewares . . . . . . . . . . . . . . . . . . . . . . . . . . . . . . . . . . . . . . . . . . . . . . . . . 0.5Investment Management/Advisor Services . . . . . . . . . . . . . . . . . . . . . . . . . . 0.5Food-Confectionery . . . . . . . . . . . . . . . . . . . . . . . . . . . . . . . . . . . . . . . . . . . . 0.5Airport Development/Maintenance . . . . . . . . . . . . . . . . . . . . . . . . . . . . . . . . 0.5Transport-Equipment & Leasing . . . . . . . . . . . . . . . . . . . . . . . . . . . . . . . . . . 0.5Consulting Services . . . . . . . . . . . . . . . . . . . . . . . . . . . . . . . . . . . . . . . . . . . 0.5Diagnostic Kits . . . . . . . . . . . . . . . . . . . . . . . . . . . . . . . . . . . . . . . . . . . . . . . 0.5Publishing-Periodicals . . . . . . . . . . . . . . . . . . . . . . . . . . . . . . . . . . . . . . . . . 0.5Consumer Products-Misc. . . . . . . . . . . . . . . . . . . . . . . . . . . . . . . . . . . . . . . 0.4Insurance-Multi-line . . . . . . . . . . . . . . . . . . . . . . . . . . . . . . . . . . . . . . . . . . . 0.4Retail-Sporting Goods . . . . . . . . . . . . . . . . . . . . . . . . . . . . . . . . . . . . . . . . . . 0.4Auto-Heavy Duty Trucks . . . . . . . . . . . . . . . . . . . . . . . . . . . . . . . . . . . . . . . . 0.4Retail-Restaurants . . . . . . . . . . . . . . . . . . . . . . . . . . . . . . . . . . . . . . . . . . . . 0.4Food-Wholesale/Distribution . . . . . . . . . . . . . . . . . . . . . . . . . . . . . . . . . . . . . 0.4Computers-Integrated Systems . . . . . . . . . . . . . . . . . . . . . . . . . . . . . . . . . . 0.4Finance-Auto Loans . . . . . . . . . . . . . . . . . . . . . . . . . . . . . . . . . . . . . . . . . . . 0.4Food-Meat Products . . . . . . . . . . . . . . . . . . . . . . . . . . . . . . . . . . . . . . . . . . . 0.4Appliances . . . . . . . . . . . . . . . . . . . . . . . . . . . . . . . . . . . . . . . . . . . . . . . . . . 0.4Oil Refining & Marketing . . . . . . . . . . . . . . . . . . . . . . . . . . . . . . . . . . . . . . . . 0.4Hotels/Motels . . . . . . . . . . . . . . . . . . . . . . . . . . . . . . . . . . . . . . . . . . . . . . . . 0.4Energy-Alternate Sources . . . . . . . . . . . . . . . . . . . . . . . . . . . . . . . . . . . . . . . 0.4Pharmacy Services . . . . . . . . . . . . . . . . . . . . . . . . . . . . . . . . . . . . . . . . . . . . 0.4Food-Catering . . . . . . . . . . . . . . . . . . . . . . . . . . . . . . . . . . . . . . . . . . . . . . . . 0.4Telecommunication Equipment . . . . . . . . . . . . . . . . . . . . . . . . . . . . . . . . . . . 0.4Publishing-Books . . . . . . . . . . . . . . . . . . . . . . . . . . . . . . . . . . . . . . . . . . . . . 0.3Independent Power Producers . . . . . . . . . . . . . . . . . . . . . . . . . . . . . . . . . . . 0.3Food-Flour & Grain . . . . . . . . . . . . . . . . . . . . . . . . . . . . . . . . . . . . . . . . . . . . 0.3Finance-Leasing Companies . . . . . . . . . . . . . . . . . . . . . . . . . . . . . . . . . . . . . 0.3Hazardous Waste Disposal . . . . . . . . . . . . . . . . . . . . . . . . . . . . . . . . . . . . . . 0.3Motion Pictures & Services . . . . . . . . . . . . . . . . . . . . . . . . . . . . . . . . . . . . . . 0.3Printing-Commercial . . . . . . . . . . . . . . . . . . . . . . . . . . . . . . . . . . . . . . . . . . . 0.3Veterinary Diagnostics . . . . . . . . . . . . . . . . . . . . . . . . . . . . . . . . . . . . . . . . . 0.3Retail-Convenience Store . . . . . . . . . . . . . . . . . . . . . . . . . . . . . . . . . . . . . . . 0.3Satellite Telecom . . . . . . . . . . . . . . . . . . . . . . . . . . . . . . . . . . . . . . . . . . . . . . 0.3Direct Marketing . . . . . . . . . . . . . . . . . . . . . . . . . . . . . . . . . . . . . . . . . . . . . . 0.3Wireless Equipment . . . . . . . . . . . . . . . . . . . . . . . . . . . . . . . . . . . . . . . . . . . 0.3Computers . . . . . . . . . . . . . . . . . . . . . . . . . . . . . . . . . . . . . . . . . . . . . . . . . . 0.3Retail-Arts & Crafts . . . . . . . . . . . . . . . . . . . . . . . . . . . . . . . . . . . . . . . . . . . . 0.3Medical-Outpatient/Home Medical . . . . . . . . . . . . . . . . . . . . . . . . . . . . . . . . 0.3Building & Construction-Misc. . . . . . . . . . . . . . . . . . . . . . . . . . . . . . . . . . . . 0.3Aerospace/Defense . . . . . . . . . . . . . . . . . . . . . . . . . . . . . . . . . . . . . . . . . . . . 0.3Food-Baking . . . . . . . . . . . . . . . . . . . . . . . . . . . . . . . . . . . . . . . . . . . . . . . . . 0.3Coal . . . . . . . . . . . . . . . . . . . . . . . . . . . . . . . . . . . . . . . . . . . . . . . . . . . . . . . . 0.3Retail-Building Products . . . . . . . . . . . . . . . . . . . . . . . . . . . . . . . . . . . . . . . . 0.3E-Commerce/Products . . . . . . . . . . . . . . . . . . . . . . . . . . . . . . . . . . . . . . . . . 0.3Retail-Propane Distribution . . . . . . . . . . . . . . . . . . . . . . . . . . . . . . . . . . . . . . 0.3Banks-Commercial . . . . . . . . . . . . . . . . . . . . . . . . . . . . . . . . . . . . . . . . . . . . 0.3Retail-Major Department Stores . . . . . . . . . . . . . . . . . . . . . . . . . . . . . . . . . . 0.3Banks-Super Regional . . . . . . . . . . . . . . . . . . . . . . . . . . . . . . . . . . . . . . . . . . 0.3Oil Companies-Integrated . . . . . . . . . . . . . . . . . . . . . . . . . . . . . . . . . . . . . . . 0.3Human Resources . . . . . . . . . . . . . . . . . . . . . . . . . . . . . . . . . . . . . . . . . . . . . 0.3Petrochemicals . . . . . . . . . . . . . . . . . . . . . . . . . . . . . . . . . . . . . . . . . . . . . . . 0.3Rental Auto/Equipment . . . . . . . . . . . . . . . . . . . . . . . . . . . . . . . . . . . . . . . . . 0.3Television . . . . . . . . . . . . . . . . . . . . . . . . . . . . . . . . . . . . . . . . . . . . . . . . . . . 0.3
49
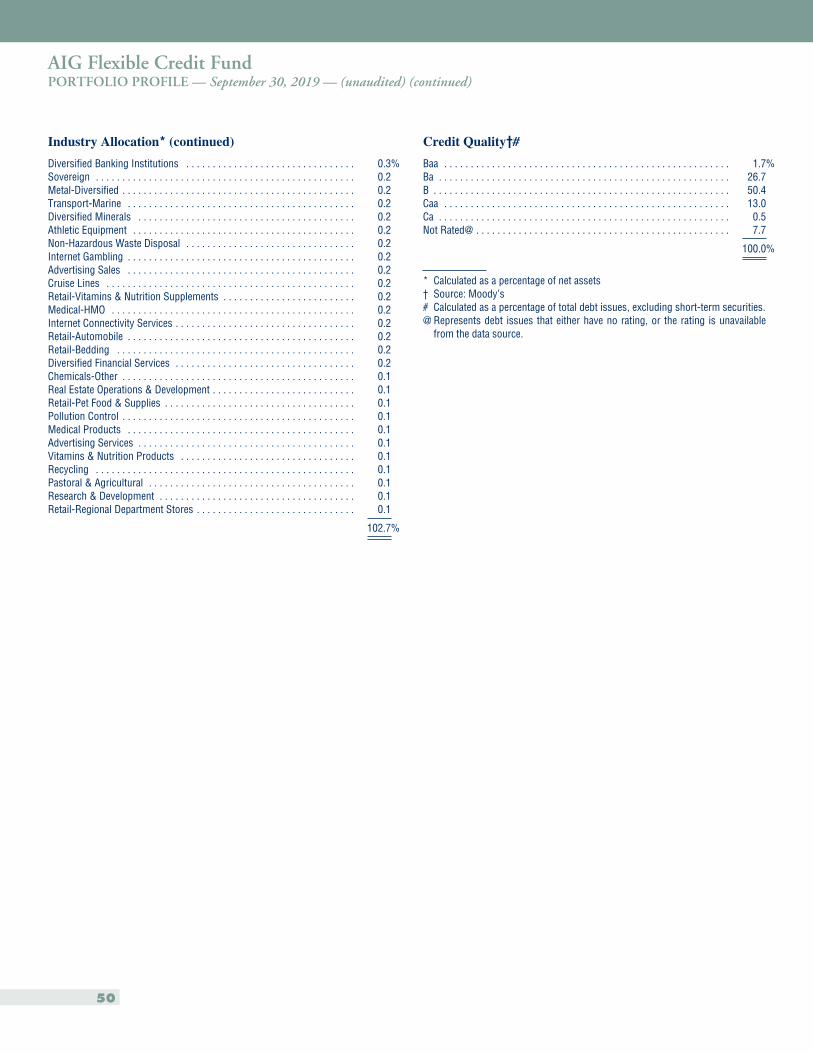
AIG Flexible Credit FundPORTFOLIO PROFILE — September 30, 2019 — (unaudited) (continued)
Industry Allocation* (continued)
Diversified Banking Institutions . . . . . . . . . . . . . . . . . . . . . . . . . . . . . . . . 0.3%Sovereign . . . . . . . . . . . . . . . . . . . . . . . . . . . . . . . . . . . . . . . . . . . . . . . . . 0.2Metal-Diversified . . . . . . . . . . . . . . . . . . . . . . . . . . . . . . . . . . . . . . . . . . . . 0.2Transport-Marine . . . . . . . . . . . . . . . . . . . . . . . . . . . . . . . . . . . . . . . . . . . 0.2Diversified Minerals . . . . . . . . . . . . . . . . . . . . . . . . . . . . . . . . . . . . . . . . . 0.2Athletic Equipment . . . . . . . . . . . . . . . . . . . . . . . . . . . . . . . . . . . . . . . . . . 0.2Non-Hazardous Waste Disposal . . . . . . . . . . . . . . . . . . . . . . . . . . . . . . . . 0.2Internet Gambling . . . . . . . . . . . . . . . . . . . . . . . . . . . . . . . . . . . . . . . . . . . 0.2Advertising Sales . . . . . . . . . . . . . . . . . . . . . . . . . . . . . . . . . . . . . . . . . . . 0.2Cruise Lines . . . . . . . . . . . . . . . . . . . . . . . . . . . . . . . . . . . . . . . . . . . . . . . 0.2Retail-Vitamins & Nutrition Supplements . . . . . . . . . . . . . . . . . . . . . . . . . 0.2Medical-HMO . . . . . . . . . . . . . . . . . . . . . . . . . . . . . . . . . . . . . . . . . . . . . . 0.2Internet Connectivity Services . . . . . . . . . . . . . . . . . . . . . . . . . . . . . . . . . . 0.2Retail-Automobile . . . . . . . . . . . . . . . . . . . . . . . . . . . . . . . . . . . . . . . . . . . 0.2Retail-Bedding . . . . . . . . . . . . . . . . . . . . . . . . . . . . . . . . . . . . . . . . . . . . . 0.2Diversified Financial Services . . . . . . . . . . . . . . . . . . . . . . . . . . . . . . . . . . 0.2Chemicals-Other . . . . . . . . . . . . . . . . . . . . . . . . . . . . . . . . . . . . . . . . . . . . 0.1Real Estate Operations & Development . . . . . . . . . . . . . . . . . . . . . . . . . . . 0.1Retail-Pet Food & Supplies . . . . . . . . . . . . . . . . . . . . . . . . . . . . . . . . . . . . 0.1Pollution Control . . . . . . . . . . . . . . . . . . . . . . . . . . . . . . . . . . . . . . . . . . . . 0.1Medical Products . . . . . . . . . . . . . . . . . . . . . . . . . . . . . . . . . . . . . . . . . . . 0.1Advertising Services . . . . . . . . . . . . . . . . . . . . . . . . . . . . . . . . . . . . . . . . . 0.1Vitamins & Nutrition Products . . . . . . . . . . . . . . . . . . . . . . . . . . . . . . . . . 0.1Recycling . . . . . . . . . . . . . . . . . . . . . . . . . . . . . . . . . . . . . . . . . . . . . . . . . 0.1Pastoral & Agricultural . . . . . . . . . . . . . . . . . . . . . . . . . . . . . . . . . . . . . . . 0.1Research & Development . . . . . . . . . . . . . . . . . . . . . . . . . . . . . . . . . . . . . 0.1Retail-Regional Department Stores . . . . . . . . . . . . . . . . . . . . . . . . . . . . . . 0.1
102.7%
Credit Quality†#
Baa . . . . . . . . . . . . . . . . . . . . . . . . . . . . . . . . . . . . . . . . . . . . . . . . . . . . . . 1.7%Ba . . . . . . . . . . . . . . . . . . . . . . . . . . . . . . . . . . . . . . . . . . . . . . . . . . . . . . . 26.7B . . . . . . . . . . . . . . . . . . . . . . . . . . . . . . . . . . . . . . . . . . . . . . . . . . . . . . . . 50.4Caa . . . . . . . . . . . . . . . . . . . . . . . . . . . . . . . . . . . . . . . . . . . . . . . . . . . . . . 13.0Ca . . . . . . . . . . . . . . . . . . . . . . . . . . . . . . . . . . . . . . . . . . . . . . . . . . . . . . . 0.5Not Rated@ . . . . . . . . . . . . . . . . . . . . . . . . . . . . . . . . . . . . . . . . . . . . . . . . 7.7
100.0%
* Calculated as a percentage of net assets† Source: Moody’s# Calculated as a percentage of total debt issues, excluding short-term securities.@ Represents debt issues that either have no rating, or the rating is unavailable
from the data source.
50
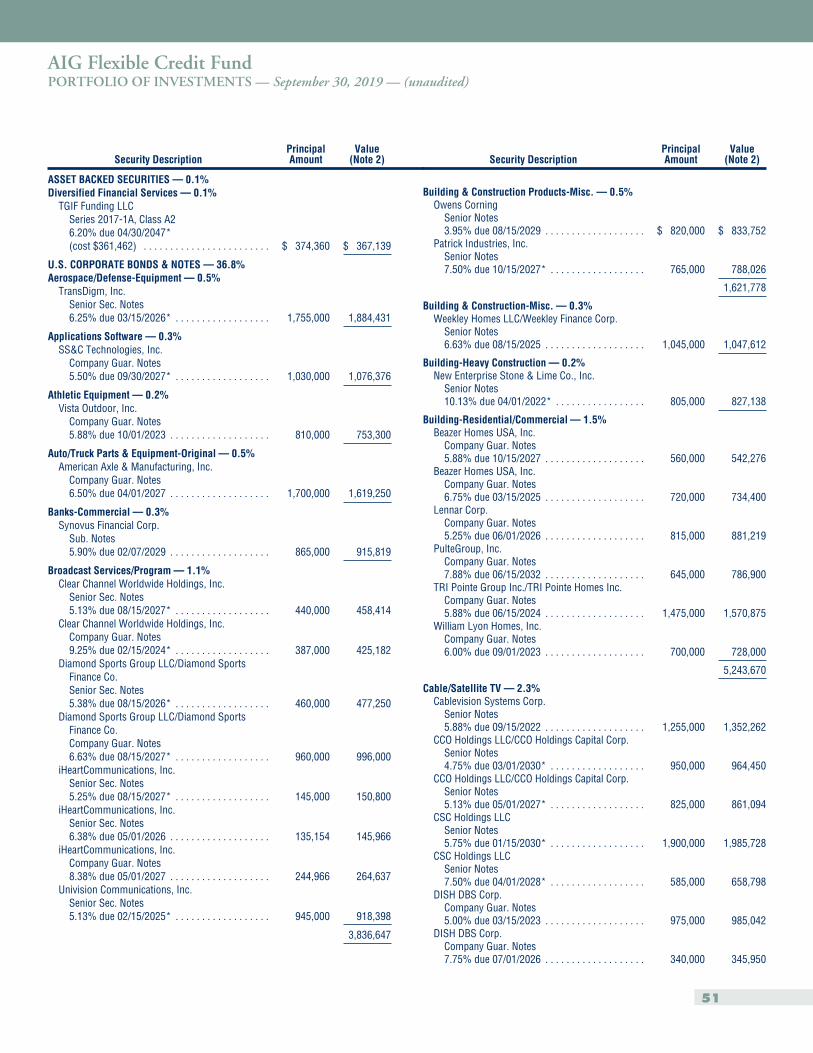
AIG Flexible Credit FundPORTFOLIO OF INVESTMENTS — September 30, 2019 — (unaudited)
Security DescriptionPrincipalAmount
Value(Note 2)
ASSET BACKED SECURITIES — 0.1%Diversified Financial Services — 0.1%
TGIF Funding LLCSeries 2017-1A, Class A26.20% due 04/30/2047*(cost $361,462) . . . . . . . . . . . . . . . . . . . . . . . . $ 374,360 $ 367,139
U.S. CORPORATE BONDS & NOTES — 36.8%Aerospace/Defense-Equipment — 0.5%
TransDigm, Inc.Senior Sec. Notes6.25% due 03/15/2026* . . . . . . . . . . . . . . . . . . 1,755,000 1,884,431
Applications Software — 0.3%SS&C Technologies, Inc.
Company Guar. Notes5.50% due 09/30/2027* . . . . . . . . . . . . . . . . . . 1,030,000 1,076,376
Athletic Equipment — 0.2%Vista Outdoor, Inc.
Company Guar. Notes5.88% due 10/01/2023 . . . . . . . . . . . . . . . . . . . 810,000 753,300
Auto/Truck Parts & Equipment-Original — 0.5%American Axle & Manufacturing, Inc.
Company Guar. Notes6.50% due 04/01/2027 . . . . . . . . . . . . . . . . . . . 1,700,000 1,619,250
Banks-Commercial — 0.3%Synovus Financial Corp.
Sub. Notes5.90% due 02/07/2029 . . . . . . . . . . . . . . . . . . . 865,000 915,819
Broadcast Services/Program — 1.1%Clear Channel Worldwide Holdings, Inc.
Senior Sec. Notes5.13% due 08/15/2027* . . . . . . . . . . . . . . . . . . 440,000 458,414
Clear Channel Worldwide Holdings, Inc.Company Guar. Notes9.25% due 02/15/2024* . . . . . . . . . . . . . . . . . . 387,000 425,182
Diamond Sports Group LLC/Diamond SportsFinance Co.Senior Sec. Notes5.38% due 08/15/2026* . . . . . . . . . . . . . . . . . . 460,000 477,250
Diamond Sports Group LLC/Diamond SportsFinance Co.Company Guar. Notes6.63% due 08/15/2027* . . . . . . . . . . . . . . . . . . 960,000 996,000
iHeartCommunications, Inc.Senior Sec. Notes5.25% due 08/15/2027* . . . . . . . . . . . . . . . . . . 145,000 150,800
iHeartCommunications, Inc.Senior Sec. Notes6.38% due 05/01/2026 . . . . . . . . . . . . . . . . . . . 135,154 145,966
iHeartCommunications, Inc.Company Guar. Notes8.38% due 05/01/2027 . . . . . . . . . . . . . . . . . . . 244,966 264,637
Univision Communications, Inc.Senior Sec. Notes5.13% due 02/15/2025* . . . . . . . . . . . . . . . . . . 945,000 918,398
3,836,647
Security DescriptionPrincipalAmount
Value(Note 2)
Building & Construction Products-Misc. — 0.5%Owens Corning
Senior Notes3.95% due 08/15/2029 . . . . . . . . . . . . . . . . . . . $ 820,000 $ 833,752
Patrick Industries, Inc.Senior Notes7.50% due 10/15/2027* . . . . . . . . . . . . . . . . . . 765,000 788,026
1,621,778
Building & Construction-Misc. — 0.3%Weekley Homes LLC/Weekley Finance Corp.
Senior Notes6.63% due 08/15/2025 . . . . . . . . . . . . . . . . . . . 1,045,000 1,047,612
Building-Heavy Construction — 0.2%New Enterprise Stone & Lime Co., Inc.
Senior Notes10.13% due 04/01/2022* . . . . . . . . . . . . . . . . . 805,000 827,138
Building-Residential/Commercial — 1.5%Beazer Homes USA, Inc.
Company Guar. Notes5.88% due 10/15/2027 . . . . . . . . . . . . . . . . . . . 560,000 542,276
Beazer Homes USA, Inc.Company Guar. Notes6.75% due 03/15/2025 . . . . . . . . . . . . . . . . . . . 720,000 734,400
Lennar Corp.Company Guar. Notes5.25% due 06/01/2026 . . . . . . . . . . . . . . . . . . . 815,000 881,219
PulteGroup, Inc.Company Guar. Notes7.88% due 06/15/2032 . . . . . . . . . . . . . . . . . . . 645,000 786,900
TRI Pointe Group Inc./TRI Pointe Homes Inc.Company Guar. Notes5.88% due 06/15/2024 . . . . . . . . . . . . . . . . . . . 1,475,000 1,570,875
William Lyon Homes, Inc.Company Guar. Notes6.00% due 09/01/2023 . . . . . . . . . . . . . . . . . . . 700,000 728,000
5,243,670
Cable/Satellite TV — 2.3%Cablevision Systems Corp.
Senior Notes5.88% due 09/15/2022 . . . . . . . . . . . . . . . . . . . 1,255,000 1,352,262
CCO Holdings LLC/CCO Holdings Capital Corp.Senior Notes4.75% due 03/01/2030* . . . . . . . . . . . . . . . . . . 950,000 964,450
CCO Holdings LLC/CCO Holdings Capital Corp.Senior Notes5.13% due 05/01/2027* . . . . . . . . . . . . . . . . . . 825,000 861,094
CSC Holdings LLCSenior Notes5.75% due 01/15/2030* . . . . . . . . . . . . . . . . . . 1,900,000 1,985,728
CSC Holdings LLCSenior Notes7.50% due 04/01/2028* . . . . . . . . . . . . . . . . . . 585,000 658,798
DISH DBS Corp.Company Guar. Notes5.00% due 03/15/2023 . . . . . . . . . . . . . . . . . . . 975,000 985,042
DISH DBS Corp.Company Guar. Notes7.75% due 07/01/2026 . . . . . . . . . . . . . . . . . . . 340,000 345,950
51
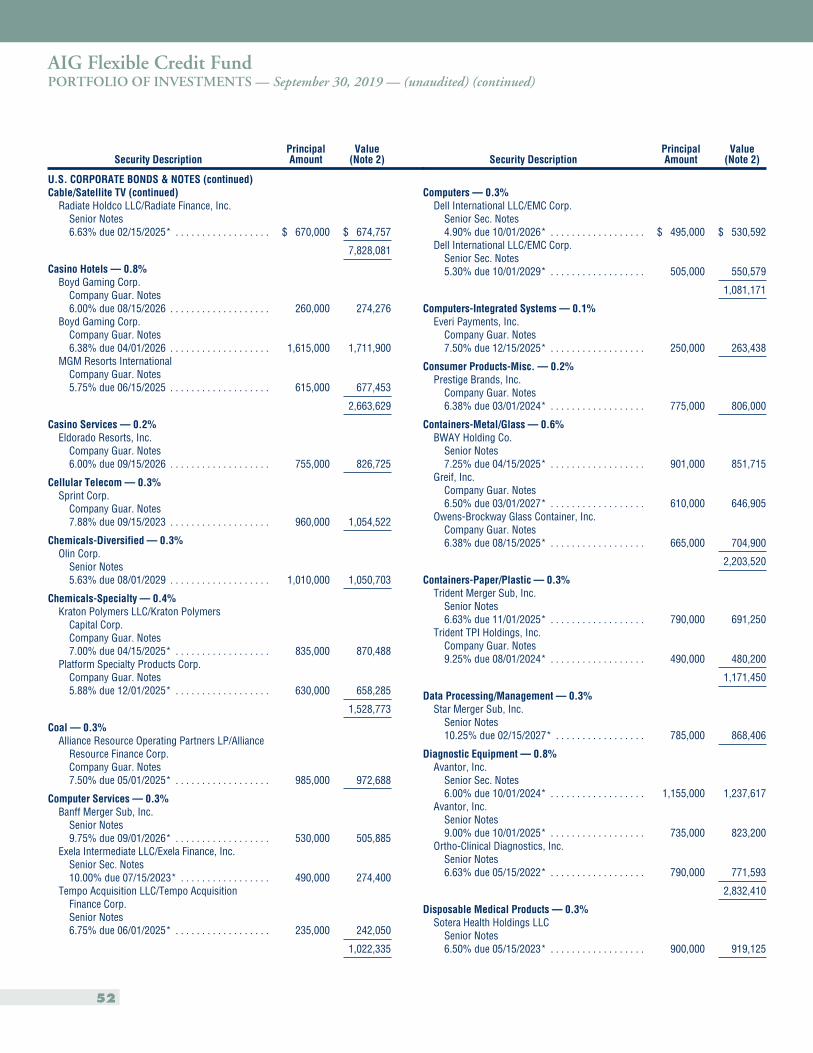
AIG Flexible Credit FundPORTFOLIO OF INVESTMENTS — September 30, 2019 — (unaudited) (continued)
Security DescriptionPrincipalAmount
Value(Note 2)
U.S. CORPORATE BONDS & NOTES (continued)Cable/Satellite TV (continued)
Radiate Holdco LLC/Radiate Finance, Inc.Senior Notes6.63% due 02/15/2025* . . . . . . . . . . . . . . . . . . $ 670,000 $ 674,757
7,828,081
Casino Hotels — 0.8%Boyd Gaming Corp.
Company Guar. Notes6.00% due 08/15/2026 . . . . . . . . . . . . . . . . . . . 260,000 274,276
Boyd Gaming Corp.Company Guar. Notes6.38% due 04/01/2026 . . . . . . . . . . . . . . . . . . . 1,615,000 1,711,900
MGM Resorts InternationalCompany Guar. Notes5.75% due 06/15/2025 . . . . . . . . . . . . . . . . . . . 615,000 677,453
2,663,629
Casino Services — 0.2%Eldorado Resorts, Inc.
Company Guar. Notes6.00% due 09/15/2026 . . . . . . . . . . . . . . . . . . . 755,000 826,725
Cellular Telecom — 0.3%Sprint Corp.
Company Guar. Notes7.88% due 09/15/2023 . . . . . . . . . . . . . . . . . . . 960,000 1,054,522
Chemicals-Diversified — 0.3%Olin Corp.
Senior Notes5.63% due 08/01/2029 . . . . . . . . . . . . . . . . . . . 1,010,000 1,050,703
Chemicals-Specialty — 0.4%Kraton Polymers LLC/Kraton Polymers
Capital Corp.Company Guar. Notes7.00% due 04/15/2025* . . . . . . . . . . . . . . . . . . 835,000 870,488
Platform Specialty Products Corp.Company Guar. Notes5.88% due 12/01/2025* . . . . . . . . . . . . . . . . . . 630,000 658,285
1,528,773
Coal — 0.3%Alliance Resource Operating Partners LP/Alliance
Resource Finance Corp.Company Guar. Notes7.50% due 05/01/2025* . . . . . . . . . . . . . . . . . . 985,000 972,688
Computer Services — 0.3%Banff Merger Sub, Inc.
Senior Notes9.75% due 09/01/2026* . . . . . . . . . . . . . . . . . . 530,000 505,885
Exela Intermediate LLC/Exela Finance, Inc.Senior Sec. Notes10.00% due 07/15/2023* . . . . . . . . . . . . . . . . . 490,000 274,400
Tempo Acquisition LLC/Tempo AcquisitionFinance Corp.Senior Notes6.75% due 06/01/2025* . . . . . . . . . . . . . . . . . . 235,000 242,050
1,022,335
Security DescriptionPrincipalAmount
Value(Note 2)
Computers — 0.3%Dell International LLC/EMC Corp.
Senior Sec. Notes4.90% due 10/01/2026* . . . . . . . . . . . . . . . . . . $ 495,000 $ 530,592
Dell International LLC/EMC Corp.Senior Sec. Notes5.30% due 10/01/2029* . . . . . . . . . . . . . . . . . . 505,000 550,579
1,081,171
Computers-Integrated Systems — 0.1%Everi Payments, Inc.
Company Guar. Notes7.50% due 12/15/2025* . . . . . . . . . . . . . . . . . . 250,000 263,438
Consumer Products-Misc. — 0.2%Prestige Brands, Inc.
Company Guar. Notes6.38% due 03/01/2024* . . . . . . . . . . . . . . . . . . 775,000 806,000
Containers-Metal/Glass — 0.6%BWAY Holding Co.
Senior Notes7.25% due 04/15/2025* . . . . . . . . . . . . . . . . . . 901,000 851,715
Greif, Inc.Company Guar. Notes6.50% due 03/01/2027* . . . . . . . . . . . . . . . . . . 610,000 646,905
Owens-Brockway Glass Container, Inc.Company Guar. Notes6.38% due 08/15/2025* . . . . . . . . . . . . . . . . . . 665,000 704,900
2,203,520
Containers-Paper/Plastic — 0.3%Trident Merger Sub, Inc.
Senior Notes6.63% due 11/01/2025* . . . . . . . . . . . . . . . . . . 790,000 691,250
Trident TPI Holdings, Inc.Company Guar. Notes9.25% due 08/01/2024* . . . . . . . . . . . . . . . . . . 490,000 480,200
1,171,450
Data Processing/Management — 0.3%Star Merger Sub, Inc.
Senior Notes10.25% due 02/15/2027* . . . . . . . . . . . . . . . . . 785,000 868,406
Diagnostic Equipment — 0.8%Avantor, Inc.
Senior Sec. Notes6.00% due 10/01/2024* . . . . . . . . . . . . . . . . . . 1,155,000 1,237,617
Avantor, Inc.Senior Notes9.00% due 10/01/2025* . . . . . . . . . . . . . . . . . . 735,000 823,200
Ortho-Clinical Diagnostics, Inc.Senior Notes6.63% due 05/15/2022* . . . . . . . . . . . . . . . . . . 790,000 771,593
2,832,410
Disposable Medical Products — 0.3%Sotera Health Holdings LLC
Senior Notes6.50% due 05/15/2023* . . . . . . . . . . . . . . . . . . 900,000 919,125
52
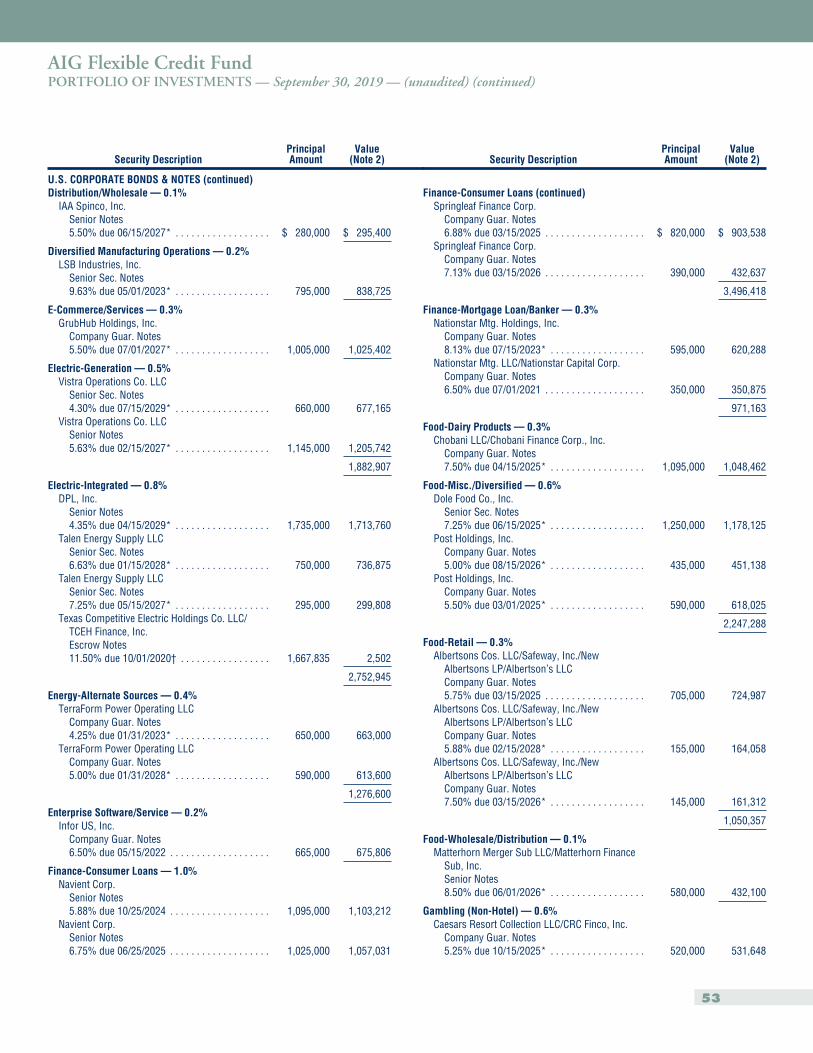
AIG Flexible Credit FundPORTFOLIO OF INVESTMENTS — September 30, 2019 — (unaudited) (continued)
Security DescriptionPrincipalAmount
Value(Note 2)
U.S. CORPORATE BONDS & NOTES (continued)Distribution/Wholesale — 0.1%
IAA Spinco, Inc.Senior Notes5.50% due 06/15/2027* . . . . . . . . . . . . . . . . . . $ 280,000 $ 295,400
Diversified Manufacturing Operations — 0.2%LSB Industries, Inc.
Senior Sec. Notes9.63% due 05/01/2023* . . . . . . . . . . . . . . . . . . 795,000 838,725
E-Commerce/Services — 0.3%GrubHub Holdings, Inc.
Company Guar. Notes5.50% due 07/01/2027* . . . . . . . . . . . . . . . . . . 1,005,000 1,025,402
Electric-Generation — 0.5%Vistra Operations Co. LLC
Senior Sec. Notes4.30% due 07/15/2029* . . . . . . . . . . . . . . . . . . 660,000 677,165
Vistra Operations Co. LLCSenior Notes5.63% due 02/15/2027* . . . . . . . . . . . . . . . . . . 1,145,000 1,205,742
1,882,907
Electric-Integrated — 0.8%DPL, Inc.
Senior Notes4.35% due 04/15/2029* . . . . . . . . . . . . . . . . . . 1,735,000 1,713,760
Talen Energy Supply LLCSenior Sec. Notes6.63% due 01/15/2028* . . . . . . . . . . . . . . . . . . 750,000 736,875
Talen Energy Supply LLCSenior Sec. Notes7.25% due 05/15/2027* . . . . . . . . . . . . . . . . . . 295,000 299,808
Texas Competitive Electric Holdings Co. LLC/TCEH Finance, Inc.Escrow Notes11.50% due 10/01/2020† . . . . . . . . . . . . . . . . . 1,667,835 2,502
2,752,945
Energy-Alternate Sources — 0.4%TerraForm Power Operating LLC
Company Guar. Notes4.25% due 01/31/2023* . . . . . . . . . . . . . . . . . . 650,000 663,000
TerraForm Power Operating LLCCompany Guar. Notes5.00% due 01/31/2028* . . . . . . . . . . . . . . . . . . 590,000 613,600
1,276,600
Enterprise Software/Service — 0.2%Infor US, Inc.
Company Guar. Notes6.50% due 05/15/2022 . . . . . . . . . . . . . . . . . . . 665,000 675,806
Finance-Consumer Loans — 1.0%Navient Corp.
Senior Notes5.88% due 10/25/2024 . . . . . . . . . . . . . . . . . . . 1,095,000 1,103,212
Navient Corp.Senior Notes6.75% due 06/25/2025 . . . . . . . . . . . . . . . . . . . 1,025,000 1,057,031
Security DescriptionPrincipalAmount
Value(Note 2)
Finance-Consumer Loans (continued)Springleaf Finance Corp.
Company Guar. Notes6.88% due 03/15/2025 . . . . . . . . . . . . . . . . . . . $ 820,000 $ 903,538
Springleaf Finance Corp.Company Guar. Notes7.13% due 03/15/2026 . . . . . . . . . . . . . . . . . . . 390,000 432,637
3,496,418
Finance-Mortgage Loan/Banker — 0.3%Nationstar Mtg. Holdings, Inc.
Company Guar. Notes8.13% due 07/15/2023* . . . . . . . . . . . . . . . . . . 595,000 620,288
Nationstar Mtg. LLC/Nationstar Capital Corp.Company Guar. Notes6.50% due 07/01/2021 . . . . . . . . . . . . . . . . . . . 350,000 350,875
971,163
Food-Dairy Products — 0.3%Chobani LLC/Chobani Finance Corp., Inc.
Company Guar. Notes7.50% due 04/15/2025* . . . . . . . . . . . . . . . . . . 1,095,000 1,048,462
Food-Misc./Diversified — 0.6%Dole Food Co., Inc.
Senior Sec. Notes7.25% due 06/15/2025* . . . . . . . . . . . . . . . . . . 1,250,000 1,178,125
Post Holdings, Inc.Company Guar. Notes5.00% due 08/15/2026* . . . . . . . . . . . . . . . . . . 435,000 451,138
Post Holdings, Inc.Company Guar. Notes5.50% due 03/01/2025* . . . . . . . . . . . . . . . . . . 590,000 618,025
2,247,288
Food-Retail — 0.3%Albertsons Cos. LLC/Safeway, Inc./New
Albertsons LP/Albertson’s LLCCompany Guar. Notes5.75% due 03/15/2025 . . . . . . . . . . . . . . . . . . . 705,000 724,987
Albertsons Cos. LLC/Safeway, Inc./NewAlbertsons LP/Albertson’s LLCCompany Guar. Notes5.88% due 02/15/2028* . . . . . . . . . . . . . . . . . . 155,000 164,058
Albertsons Cos. LLC/Safeway, Inc./NewAlbertsons LP/Albertson’s LLCCompany Guar. Notes7.50% due 03/15/2026* . . . . . . . . . . . . . . . . . . 145,000 161,312
1,050,357
Food-Wholesale/Distribution — 0.1%Matterhorn Merger Sub LLC/Matterhorn Finance
Sub, Inc.Senior Notes8.50% due 06/01/2026* . . . . . . . . . . . . . . . . . . 580,000 432,100
Gambling (Non-Hotel) — 0.6%Caesars Resort Collection LLC/CRC Finco, Inc.
Company Guar. Notes5.25% due 10/15/2025* . . . . . . . . . . . . . . . . . . 520,000 531,648
53
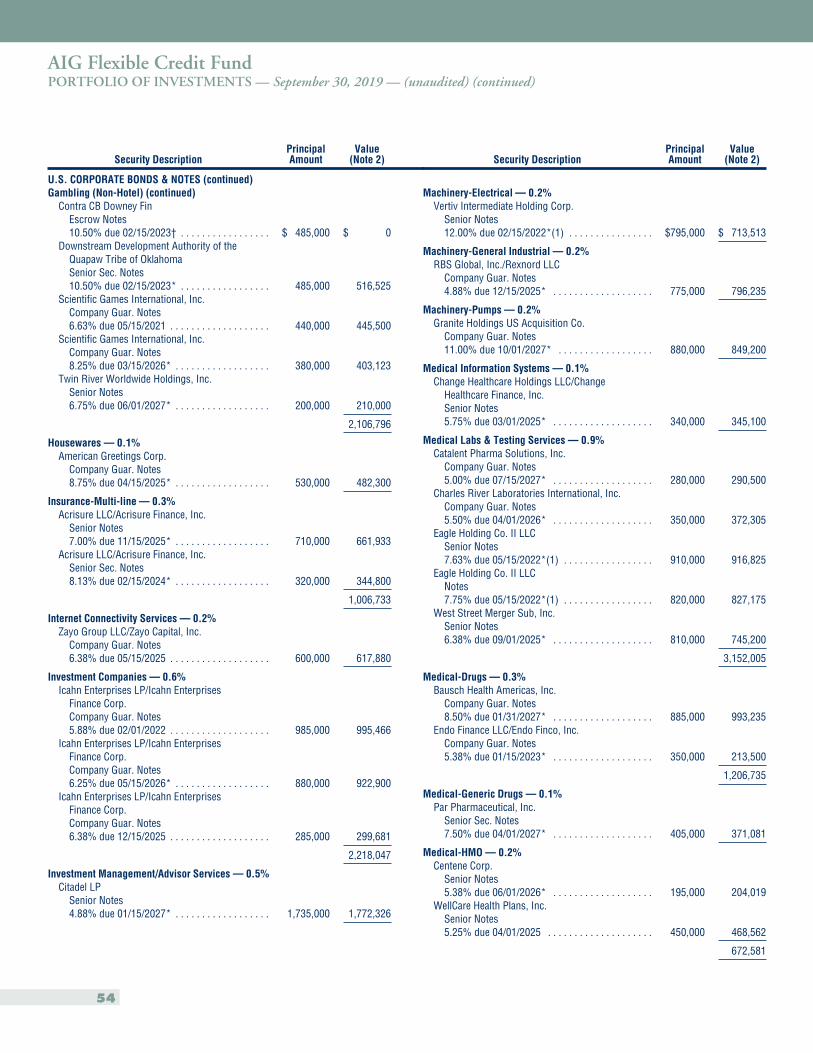
AIG Flexible Credit FundPORTFOLIO OF INVESTMENTS — September 30, 2019 — (unaudited) (continued)
Security DescriptionPrincipalAmount
Value(Note 2)
U.S. CORPORATE BONDS & NOTES (continued)Gambling (Non-Hotel) (continued)
Contra CB Downey FinEscrow Notes10.50% due 02/15/2023† . . . . . . . . . . . . . . . . . $ 485,000 $ 0
Downstream Development Authority of theQuapaw Tribe of OklahomaSenior Sec. Notes10.50% due 02/15/2023* . . . . . . . . . . . . . . . . . 485,000 516,525
Scientific Games International, Inc.Company Guar. Notes6.63% due 05/15/2021 . . . . . . . . . . . . . . . . . . . 440,000 445,500
Scientific Games International, Inc.Company Guar. Notes8.25% due 03/15/2026* . . . . . . . . . . . . . . . . . . 380,000 403,123
Twin River Worldwide Holdings, Inc.Senior Notes6.75% due 06/01/2027* . . . . . . . . . . . . . . . . . . 200,000 210,000
2,106,796
Housewares — 0.1%American Greetings Corp.
Company Guar. Notes8.75% due 04/15/2025* . . . . . . . . . . . . . . . . . . 530,000 482,300
Insurance-Multi-line — 0.3%Acrisure LLC/Acrisure Finance, Inc.
Senior Notes7.00% due 11/15/2025* . . . . . . . . . . . . . . . . . . 710,000 661,933
Acrisure LLC/Acrisure Finance, Inc.Senior Sec. Notes8.13% due 02/15/2024* . . . . . . . . . . . . . . . . . . 320,000 344,800
1,006,733
Internet Connectivity Services — 0.2%Zayo Group LLC/Zayo Capital, Inc.
Company Guar. Notes6.38% due 05/15/2025 . . . . . . . . . . . . . . . . . . . 600,000 617,880
Investment Companies — 0.6%Icahn Enterprises LP/Icahn Enterprises
Finance Corp.Company Guar. Notes5.88% due 02/01/2022 . . . . . . . . . . . . . . . . . . . 985,000 995,466
Icahn Enterprises LP/Icahn EnterprisesFinance Corp.Company Guar. Notes6.25% due 05/15/2026* . . . . . . . . . . . . . . . . . . 880,000 922,900
Icahn Enterprises LP/Icahn EnterprisesFinance Corp.Company Guar. Notes6.38% due 12/15/2025 . . . . . . . . . . . . . . . . . . . 285,000 299,681
2,218,047
Investment Management/Advisor Services — 0.5%Citadel LP
Senior Notes4.88% due 01/15/2027* . . . . . . . . . . . . . . . . . . 1,735,000 1,772,326
Security DescriptionPrincipalAmount
Value(Note 2)
Machinery-Electrical — 0.2%Vertiv Intermediate Holding Corp.
Senior Notes12.00% due 02/15/2022*(1) . . . . . . . . . . . . . . . . $795,000 $ 713,513
Machinery-General Industrial — 0.2%RBS Global, Inc./Rexnord LLC
Company Guar. Notes4.88% due 12/15/2025* . . . . . . . . . . . . . . . . . . . 775,000 796,235
Machinery-Pumps — 0.2%Granite Holdings US Acquisition Co.
Company Guar. Notes11.00% due 10/01/2027* . . . . . . . . . . . . . . . . . . 880,000 849,200
Medical Information Systems — 0.1%Change Healthcare Holdings LLC/Change
Healthcare Finance, Inc.Senior Notes5.75% due 03/01/2025* . . . . . . . . . . . . . . . . . . . 340,000 345,100
Medical Labs & Testing Services — 0.9%Catalent Pharma Solutions, Inc.
Company Guar. Notes5.00% due 07/15/2027* . . . . . . . . . . . . . . . . . . . 280,000 290,500
Charles River Laboratories International, Inc.Company Guar. Notes5.50% due 04/01/2026* . . . . . . . . . . . . . . . . . . . 350,000 372,305
Eagle Holding Co. II LLCSenior Notes7.63% due 05/15/2022*(1) . . . . . . . . . . . . . . . . . 910,000 916,825
Eagle Holding Co. II LLCNotes7.75% due 05/15/2022*(1) . . . . . . . . . . . . . . . . . 820,000 827,175
West Street Merger Sub, Inc.Senior Notes6.38% due 09/01/2025* . . . . . . . . . . . . . . . . . . . 810,000 745,200
3,152,005
Medical-Drugs — 0.3%Bausch Health Americas, Inc.
Company Guar. Notes8.50% due 01/31/2027* . . . . . . . . . . . . . . . . . . . 885,000 993,235
Endo Finance LLC/Endo Finco, Inc.Company Guar. Notes5.38% due 01/15/2023* . . . . . . . . . . . . . . . . . . . 350,000 213,500
1,206,735
Medical-Generic Drugs — 0.1%Par Pharmaceutical, Inc.
Senior Sec. Notes7.50% due 04/01/2027* . . . . . . . . . . . . . . . . . . . 405,000 371,081
Medical-HMO — 0.2%Centene Corp.
Senior Notes5.38% due 06/01/2026* . . . . . . . . . . . . . . . . . . . 195,000 204,019
WellCare Health Plans, Inc.Senior Notes5.25% due 04/01/2025 . . . . . . . . . . . . . . . . . . . . 450,000 468,562
672,581
54
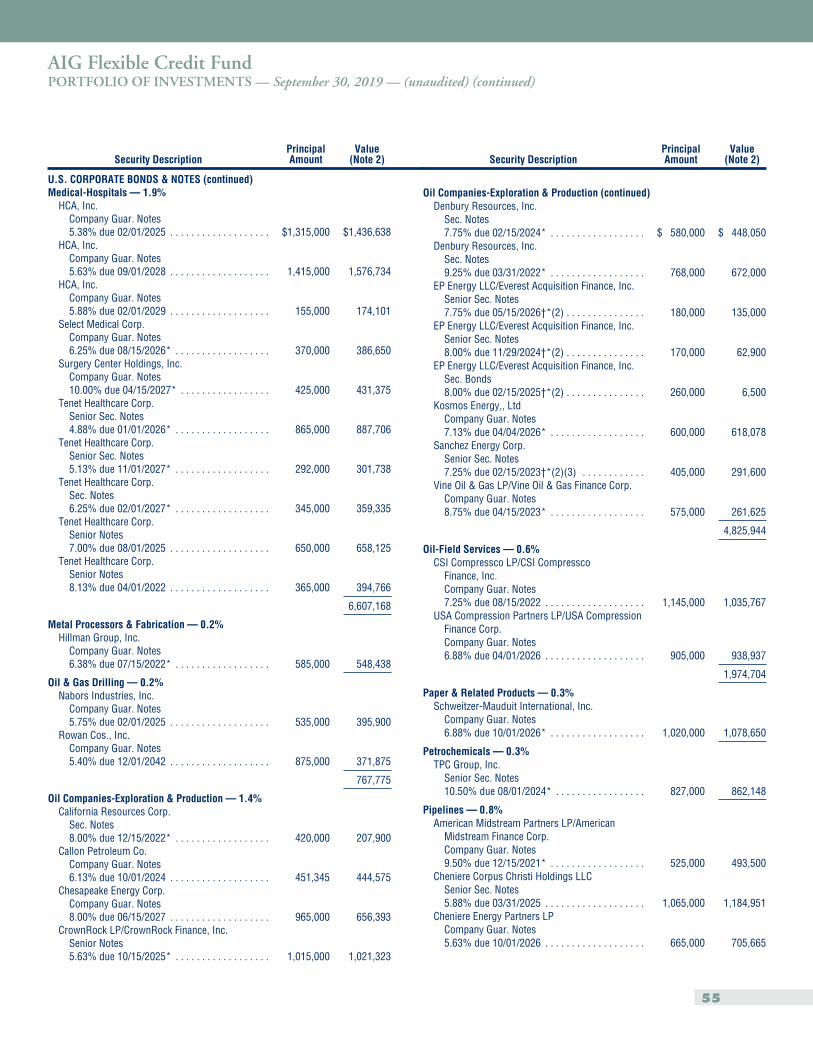
AIG Flexible Credit FundPORTFOLIO OF INVESTMENTS — September 30, 2019 — (unaudited) (continued)
Security DescriptionPrincipalAmount
Value(Note 2)
U.S. CORPORATE BONDS & NOTES (continued)Medical-Hospitals — 1.9%
HCA, Inc.Company Guar. Notes5.38% due 02/01/2025 . . . . . . . . . . . . . . . . . . . $1,315,000 $1,436,638
HCA, Inc.Company Guar. Notes5.63% due 09/01/2028 . . . . . . . . . . . . . . . . . . . 1,415,000 1,576,734
HCA, Inc.Company Guar. Notes5.88% due 02/01/2029 . . . . . . . . . . . . . . . . . . . 155,000 174,101
Select Medical Corp.Company Guar. Notes6.25% due 08/15/2026* . . . . . . . . . . . . . . . . . . 370,000 386,650
Surgery Center Holdings, Inc.Company Guar. Notes10.00% due 04/15/2027* . . . . . . . . . . . . . . . . . 425,000 431,375
Tenet Healthcare Corp.Senior Sec. Notes4.88% due 01/01/2026* . . . . . . . . . . . . . . . . . . 865,000 887,706
Tenet Healthcare Corp.Senior Sec. Notes5.13% due 11/01/2027* . . . . . . . . . . . . . . . . . . 292,000 301,738
Tenet Healthcare Corp.Sec. Notes6.25% due 02/01/2027* . . . . . . . . . . . . . . . . . . 345,000 359,335
Tenet Healthcare Corp.Senior Notes7.00% due 08/01/2025 . . . . . . . . . . . . . . . . . . . 650,000 658,125
Tenet Healthcare Corp.Senior Notes8.13% due 04/01/2022 . . . . . . . . . . . . . . . . . . . 365,000 394,766
6,607,168
Metal Processors & Fabrication — 0.2%Hillman Group, Inc.
Company Guar. Notes6.38% due 07/15/2022* . . . . . . . . . . . . . . . . . . 585,000 548,438
Oil & Gas Drilling — 0.2%Nabors Industries, Inc.
Company Guar. Notes5.75% due 02/01/2025 . . . . . . . . . . . . . . . . . . . 535,000 395,900
Rowan Cos., Inc.Company Guar. Notes5.40% due 12/01/2042 . . . . . . . . . . . . . . . . . . . 875,000 371,875
767,775
Oil Companies-Exploration & Production — 1.4%California Resources Corp.
Sec. Notes8.00% due 12/15/2022* . . . . . . . . . . . . . . . . . . 420,000 207,900
Callon Petroleum Co.Company Guar. Notes6.13% due 10/01/2024 . . . . . . . . . . . . . . . . . . . 451,345 444,575
Chesapeake Energy Corp.Company Guar. Notes8.00% due 06/15/2027 . . . . . . . . . . . . . . . . . . . 965,000 656,393
CrownRock LP/CrownRock Finance, Inc.Senior Notes5.63% due 10/15/2025* . . . . . . . . . . . . . . . . . . 1,015,000 1,021,323
Security DescriptionPrincipalAmount
Value(Note 2)
Oil Companies-Exploration & Production (continued)Denbury Resources, Inc.
Sec. Notes7.75% due 02/15/2024* . . . . . . . . . . . . . . . . . . $ 580,000 $ 448,050
Denbury Resources, Inc.Sec. Notes9.25% due 03/31/2022* . . . . . . . . . . . . . . . . . . 768,000 672,000
EP Energy LLC/Everest Acquisition Finance, Inc.Senior Sec. Notes7.75% due 05/15/2026†*(2) . . . . . . . . . . . . . . . 180,000 135,000
EP Energy LLC/Everest Acquisition Finance, Inc.Senior Sec. Notes8.00% due 11/29/2024†*(2) . . . . . . . . . . . . . . . 170,000 62,900
EP Energy LLC/Everest Acquisition Finance, Inc.Sec. Bonds8.00% due 02/15/2025†*(2) . . . . . . . . . . . . . . . 260,000 6,500
Kosmos Energy,, LtdCompany Guar. Notes7.13% due 04/04/2026* . . . . . . . . . . . . . . . . . . 600,000 618,078
Sanchez Energy Corp.Senior Sec. Notes7.25% due 02/15/2023†*(2)(3) . . . . . . . . . . . . 405,000 291,600
Vine Oil & Gas LP/Vine Oil & Gas Finance Corp.Company Guar. Notes8.75% due 04/15/2023* . . . . . . . . . . . . . . . . . . 575,000 261,625
4,825,944
Oil-Field Services — 0.6%CSI Compressco LP/CSI Compressco
Finance, Inc.Company Guar. Notes7.25% due 08/15/2022 . . . . . . . . . . . . . . . . . . . 1,145,000 1,035,767
USA Compression Partners LP/USA CompressionFinance Corp.Company Guar. Notes6.88% due 04/01/2026 . . . . . . . . . . . . . . . . . . . 905,000 938,937
1,974,704
Paper & Related Products — 0.3%Schweitzer-Mauduit International, Inc.
Company Guar. Notes6.88% due 10/01/2026* . . . . . . . . . . . . . . . . . . 1,020,000 1,078,650
Petrochemicals — 0.3%TPC Group, Inc.
Senior Sec. Notes10.50% due 08/01/2024* . . . . . . . . . . . . . . . . . 827,000 862,148
Pipelines — 0.8%American Midstream Partners LP/American
Midstream Finance Corp.Company Guar. Notes9.50% due 12/15/2021* . . . . . . . . . . . . . . . . . . 525,000 493,500
Cheniere Corpus Christi Holdings LLCSenior Sec. Notes5.88% due 03/31/2025 . . . . . . . . . . . . . . . . . . . 1,065,000 1,184,951
Cheniere Energy Partners LPCompany Guar. Notes5.63% due 10/01/2026 . . . . . . . . . . . . . . . . . . . 665,000 705,665
55
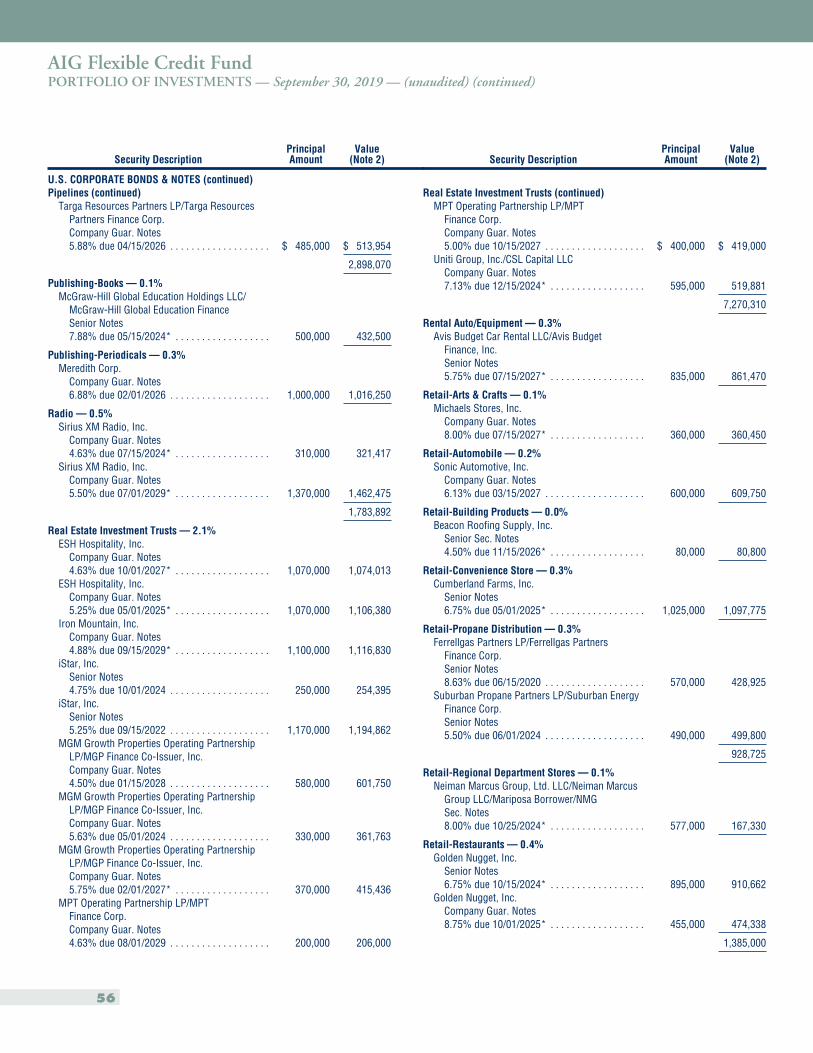
AIG Flexible Credit FundPORTFOLIO OF INVESTMENTS — September 30, 2019 — (unaudited) (continued)
Security DescriptionPrincipalAmount
Value(Note 2)
U.S. CORPORATE BONDS & NOTES (continued)Pipelines (continued)
Targa Resources Partners LP/Targa ResourcesPartners Finance Corp.Company Guar. Notes5.88% due 04/15/2026 . . . . . . . . . . . . . . . . . . . $ 485,000 $ 513,954
2,898,070
Publishing-Books — 0.1%McGraw-Hill Global Education Holdings LLC/
McGraw-Hill Global Education FinanceSenior Notes7.88% due 05/15/2024* . . . . . . . . . . . . . . . . . . 500,000 432,500
Publishing-Periodicals — 0.3%Meredith Corp.
Company Guar. Notes6.88% due 02/01/2026 . . . . . . . . . . . . . . . . . . . 1,000,000 1,016,250
Radio — 0.5%Sirius XM Radio, Inc.
Company Guar. Notes4.63% due 07/15/2024* . . . . . . . . . . . . . . . . . . 310,000 321,417
Sirius XM Radio, Inc.Company Guar. Notes5.50% due 07/01/2029* . . . . . . . . . . . . . . . . . . 1,370,000 1,462,475
1,783,892
Real Estate Investment Trusts — 2.1%ESH Hospitality, Inc.
Company Guar. Notes4.63% due 10/01/2027* . . . . . . . . . . . . . . . . . . 1,070,000 1,074,013
ESH Hospitality, Inc.Company Guar. Notes5.25% due 05/01/2025* . . . . . . . . . . . . . . . . . . 1,070,000 1,106,380
Iron Mountain, Inc.Company Guar. Notes4.88% due 09/15/2029* . . . . . . . . . . . . . . . . . . 1,100,000 1,116,830
iStar, Inc.Senior Notes4.75% due 10/01/2024 . . . . . . . . . . . . . . . . . . . 250,000 254,395
iStar, Inc.Senior Notes5.25% due 09/15/2022 . . . . . . . . . . . . . . . . . . . 1,170,000 1,194,862
MGM Growth Properties Operating PartnershipLP/MGP Finance Co-Issuer, Inc.Company Guar. Notes4.50% due 01/15/2028 . . . . . . . . . . . . . . . . . . . 580,000 601,750
MGM Growth Properties Operating PartnershipLP/MGP Finance Co-Issuer, Inc.Company Guar. Notes5.63% due 05/01/2024 . . . . . . . . . . . . . . . . . . . 330,000 361,763
MGM Growth Properties Operating PartnershipLP/MGP Finance Co-Issuer, Inc.Company Guar. Notes5.75% due 02/01/2027* . . . . . . . . . . . . . . . . . . 370,000 415,436
MPT Operating Partnership LP/MPTFinance Corp.Company Guar. Notes4.63% due 08/01/2029 . . . . . . . . . . . . . . . . . . . 200,000 206,000
Security DescriptionPrincipalAmount
Value(Note 2)
Real Estate Investment Trusts (continued)MPT Operating Partnership LP/MPT
Finance Corp.Company Guar. Notes5.00% due 10/15/2027 . . . . . . . . . . . . . . . . . . . $ 400,000 $ 419,000
Uniti Group, Inc./CSL Capital LLCCompany Guar. Notes7.13% due 12/15/2024* . . . . . . . . . . . . . . . . . . 595,000 519,881
7,270,310
Rental Auto/Equipment — 0.3%Avis Budget Car Rental LLC/Avis Budget
Finance, Inc.Senior Notes5.75% due 07/15/2027* . . . . . . . . . . . . . . . . . . 835,000 861,470
Retail-Arts & Crafts — 0.1%Michaels Stores, Inc.
Company Guar. Notes8.00% due 07/15/2027* . . . . . . . . . . . . . . . . . . 360,000 360,450
Retail-Automobile — 0.2%Sonic Automotive, Inc.
Company Guar. Notes6.13% due 03/15/2027 . . . . . . . . . . . . . . . . . . . 600,000 609,750
Retail-Building Products — 0.0%Beacon Roofing Supply, Inc.
Senior Sec. Notes4.50% due 11/15/2026* . . . . . . . . . . . . . . . . . . 80,000 80,800
Retail-Convenience Store — 0.3%Cumberland Farms, Inc.
Senior Notes6.75% due 05/01/2025* . . . . . . . . . . . . . . . . . . 1,025,000 1,097,775
Retail-Propane Distribution — 0.3%Ferrellgas Partners LP/Ferrellgas Partners
Finance Corp.Senior Notes8.63% due 06/15/2020 . . . . . . . . . . . . . . . . . . . 570,000 428,925
Suburban Propane Partners LP/Suburban EnergyFinance Corp.Senior Notes5.50% due 06/01/2024 . . . . . . . . . . . . . . . . . . . 490,000 499,800
928,725
Retail-Regional Department Stores — 0.1%Neiman Marcus Group, Ltd. LLC/Neiman Marcus
Group LLC/Mariposa Borrower/NMGSec. Notes8.00% due 10/25/2024* . . . . . . . . . . . . . . . . . . 577,000 167,330
Retail-Restaurants — 0.4%Golden Nugget, Inc.
Senior Notes6.75% due 10/15/2024* . . . . . . . . . . . . . . . . . . 895,000 910,662
Golden Nugget, Inc.Company Guar. Notes8.75% due 10/01/2025* . . . . . . . . . . . . . . . . . . 455,000 474,338
1,385,000
56
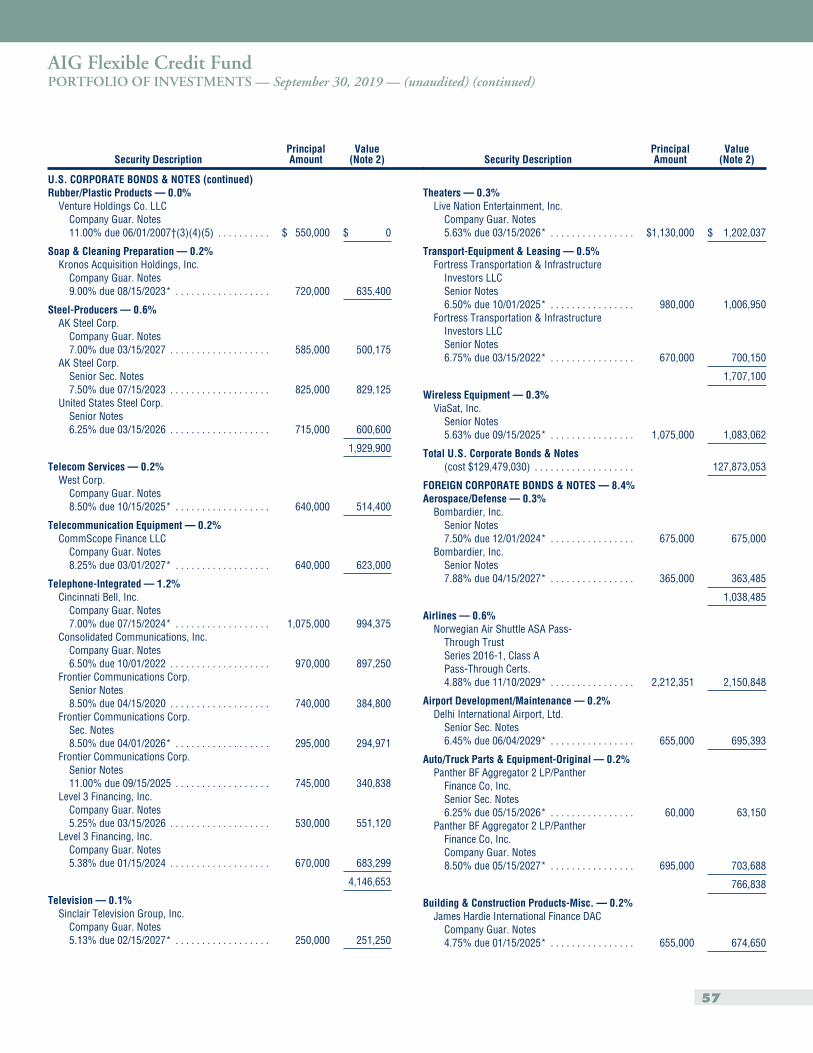
AIG Flexible Credit FundPORTFOLIO OF INVESTMENTS — September 30, 2019 — (unaudited) (continued)
Security DescriptionPrincipalAmount
Value(Note 2)
U.S. CORPORATE BONDS & NOTES (continued)Rubber/Plastic Products — 0.0%
Venture Holdings Co. LLCCompany Guar. Notes11.00% due 06/01/2007†(3)(4)(5) . . . . . . . . . . $ 550,000 $ 0
Soap & Cleaning Preparation — 0.2%Kronos Acquisition Holdings, Inc.
Company Guar. Notes9.00% due 08/15/2023* . . . . . . . . . . . . . . . . . . 720,000 635,400
Steel-Producers — 0.6%AK Steel Corp.
Company Guar. Notes7.00% due 03/15/2027 . . . . . . . . . . . . . . . . . . . 585,000 500,175
AK Steel Corp.Senior Sec. Notes7.50% due 07/15/2023 . . . . . . . . . . . . . . . . . . . 825,000 829,125
United States Steel Corp.Senior Notes6.25% due 03/15/2026 . . . . . . . . . . . . . . . . . . . 715,000 600,600
1,929,900
Telecom Services — 0.2%West Corp.
Company Guar. Notes8.50% due 10/15/2025* . . . . . . . . . . . . . . . . . . 640,000 514,400
Telecommunication Equipment — 0.2%CommScope Finance LLC
Company Guar. Notes8.25% due 03/01/2027* . . . . . . . . . . . . . . . . . . 640,000 623,000
Telephone-Integrated — 1.2%Cincinnati Bell, Inc.
Company Guar. Notes7.00% due 07/15/2024* . . . . . . . . . . . . . . . . . . 1,075,000 994,375
Consolidated Communications, Inc.Company Guar. Notes6.50% due 10/01/2022 . . . . . . . . . . . . . . . . . . . 970,000 897,250
Frontier Communications Corp.Senior Notes8.50% due 04/15/2020 . . . . . . . . . . . . . . . . . . . 740,000 384,800
Frontier Communications Corp.Sec. Notes8.50% due 04/01/2026* . . . . . . . . . . . . . . . . . . 295,000 294,971
Frontier Communications Corp.Senior Notes11.00% due 09/15/2025 . . . . . . . . . . . . . . . . . . 745,000 340,838
Level 3 Financing, Inc.Company Guar. Notes5.25% due 03/15/2026 . . . . . . . . . . . . . . . . . . . 530,000 551,120
Level 3 Financing, Inc.Company Guar. Notes5.38% due 01/15/2024 . . . . . . . . . . . . . . . . . . . 670,000 683,299
4,146,653
Television — 0.1%Sinclair Television Group, Inc.
Company Guar. Notes5.13% due 02/15/2027* . . . . . . . . . . . . . . . . . . 250,000 251,250
Security DescriptionPrincipalAmount
Value(Note 2)
Theaters — 0.3%Live Nation Entertainment, Inc.
Company Guar. Notes5.63% due 03/15/2026* . . . . . . . . . . . . . . . . $1,130,000 $ 1,202,037
Transport-Equipment & Leasing — 0.5%Fortress Transportation & Infrastructure
Investors LLCSenior Notes6.50% due 10/01/2025* . . . . . . . . . . . . . . . . 980,000 1,006,950
Fortress Transportation & InfrastructureInvestors LLCSenior Notes6.75% due 03/15/2022* . . . . . . . . . . . . . . . . 670,000 700,150
1,707,100
Wireless Equipment — 0.3%ViaSat, Inc.
Senior Notes5.63% due 09/15/2025* . . . . . . . . . . . . . . . . 1,075,000 1,083,062
Total U.S. Corporate Bonds & Notes(cost $129,479,030) . . . . . . . . . . . . . . . . . . . 127,873,053
FOREIGN CORPORATE BONDS & NOTES — 8.4%Aerospace/Defense — 0.3%
Bombardier, Inc.Senior Notes7.50% due 12/01/2024* . . . . . . . . . . . . . . . . 675,000 675,000
Bombardier, Inc.Senior Notes7.88% due 04/15/2027* . . . . . . . . . . . . . . . . 365,000 363,485
1,038,485
Airlines — 0.6%Norwegian Air Shuttle ASA Pass-
Through TrustSeries 2016-1, Class APass-Through Certs.4.88% due 11/10/2029* . . . . . . . . . . . . . . . . 2,212,351 2,150,848
Airport Development/Maintenance — 0.2%Delhi International Airport, Ltd.
Senior Sec. Notes6.45% due 06/04/2029* . . . . . . . . . . . . . . . . 655,000 695,393
Auto/Truck Parts & Equipment-Original — 0.2%Panther BF Aggregator 2 LP/Panther
Finance Co, Inc.Senior Sec. Notes6.25% due 05/15/2026* . . . . . . . . . . . . . . . . 60,000 63,150
Panther BF Aggregator 2 LP/PantherFinance Co, Inc.Company Guar. Notes8.50% due 05/15/2027* . . . . . . . . . . . . . . . . 695,000 703,688
766,838
Building & Construction Products-Misc. — 0.2%James Hardie International Finance DAC
Company Guar. Notes4.75% due 01/15/2025* . . . . . . . . . . . . . . . . 655,000 674,650
57
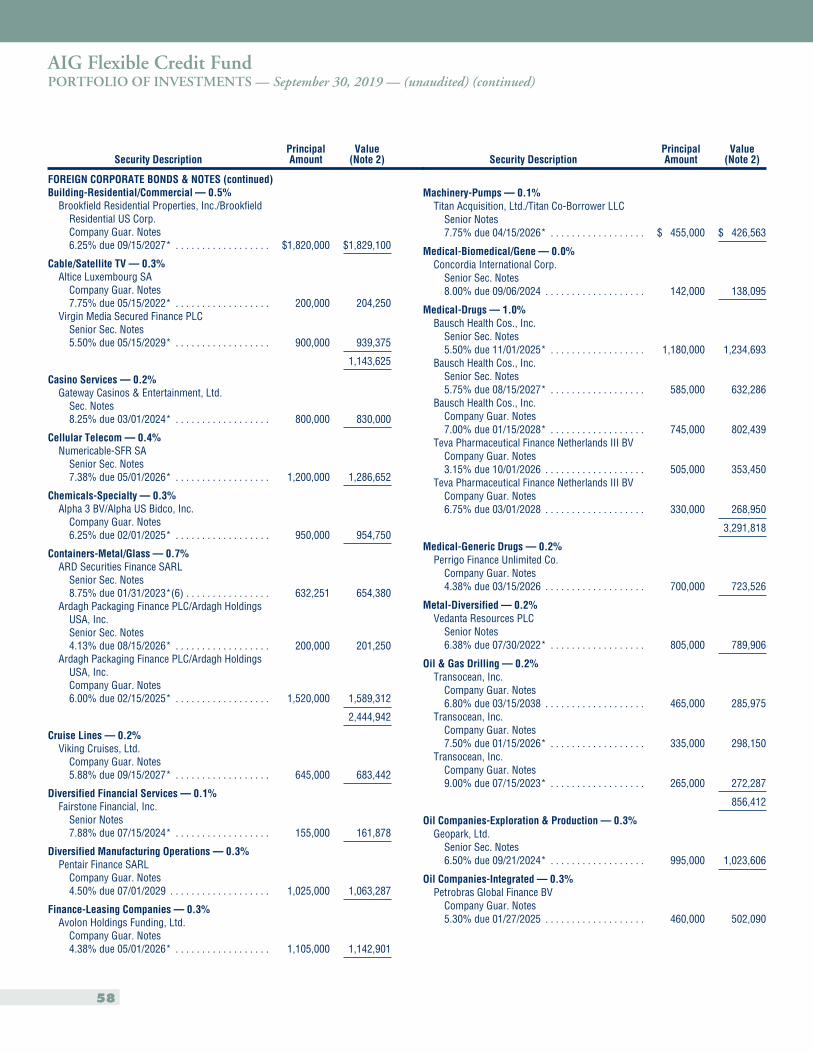
AIG Flexible Credit FundPORTFOLIO OF INVESTMENTS — September 30, 2019 — (unaudited) (continued)
Security DescriptionPrincipalAmount
Value(Note 2)
FOREIGN CORPORATE BONDS & NOTES (continued)Building-Residential/Commercial — 0.5%
Brookfield Residential Properties, Inc./BrookfieldResidential US Corp.Company Guar. Notes6.25% due 09/15/2027* . . . . . . . . . . . . . . . . . . $1,820,000 $1,829,100
Cable/Satellite TV — 0.3%Altice Luxembourg SA
Company Guar. Notes7.75% due 05/15/2022* . . . . . . . . . . . . . . . . . . 200,000 204,250
Virgin Media Secured Finance PLCSenior Sec. Notes5.50% due 05/15/2029* . . . . . . . . . . . . . . . . . . 900,000 939,375
1,143,625
Casino Services — 0.2%Gateway Casinos & Entertainment, Ltd.
Sec. Notes8.25% due 03/01/2024* . . . . . . . . . . . . . . . . . . 800,000 830,000
Cellular Telecom — 0.4%Numericable-SFR SA
Senior Sec. Notes7.38% due 05/01/2026* . . . . . . . . . . . . . . . . . . 1,200,000 1,286,652
Chemicals-Specialty — 0.3%Alpha 3 BV/Alpha US Bidco, Inc.
Company Guar. Notes6.25% due 02/01/2025* . . . . . . . . . . . . . . . . . . 950,000 954,750
Containers-Metal/Glass — 0.7%ARD Securities Finance SARL
Senior Sec. Notes8.75% due 01/31/2023*(6) . . . . . . . . . . . . . . . . 632,251 654,380
Ardagh Packaging Finance PLC/Ardagh HoldingsUSA, Inc.Senior Sec. Notes4.13% due 08/15/2026* . . . . . . . . . . . . . . . . . . 200,000 201,250
Ardagh Packaging Finance PLC/Ardagh HoldingsUSA, Inc.Company Guar. Notes6.00% due 02/15/2025* . . . . . . . . . . . . . . . . . . 1,520,000 1,589,312
2,444,942
Cruise Lines — 0.2%Viking Cruises, Ltd.
Company Guar. Notes5.88% due 09/15/2027* . . . . . . . . . . . . . . . . . . 645,000 683,442
Diversified Financial Services — 0.1%Fairstone Financial, Inc.
Senior Notes7.88% due 07/15/2024* . . . . . . . . . . . . . . . . . . 155,000 161,878
Diversified Manufacturing Operations — 0.3%Pentair Finance SARL
Company Guar. Notes4.50% due 07/01/2029 . . . . . . . . . . . . . . . . . . . 1,025,000 1,063,287
Finance-Leasing Companies — 0.3%Avolon Holdings Funding, Ltd.
Company Guar. Notes4.38% due 05/01/2026* . . . . . . . . . . . . . . . . . . 1,105,000 1,142,901
Security DescriptionPrincipalAmount
Value(Note 2)
Machinery-Pumps — 0.1%Titan Acquisition, Ltd./Titan Co-Borrower LLC
Senior Notes7.75% due 04/15/2026* . . . . . . . . . . . . . . . . . . $ 455,000 $ 426,563
Medical-Biomedical/Gene — 0.0%Concordia International Corp.
Senior Sec. Notes8.00% due 09/06/2024 . . . . . . . . . . . . . . . . . . . 142,000 138,095
Medical-Drugs — 1.0%Bausch Health Cos., Inc.
Senior Sec. Notes5.50% due 11/01/2025* . . . . . . . . . . . . . . . . . . 1,180,000 1,234,693
Bausch Health Cos., Inc.Senior Sec. Notes5.75% due 08/15/2027* . . . . . . . . . . . . . . . . . . 585,000 632,286
Bausch Health Cos., Inc.Company Guar. Notes7.00% due 01/15/2028* . . . . . . . . . . . . . . . . . . 745,000 802,439
Teva Pharmaceutical Finance Netherlands III BVCompany Guar. Notes3.15% due 10/01/2026 . . . . . . . . . . . . . . . . . . . 505,000 353,450
Teva Pharmaceutical Finance Netherlands III BVCompany Guar. Notes6.75% due 03/01/2028 . . . . . . . . . . . . . . . . . . . 330,000 268,950
3,291,818
Medical-Generic Drugs — 0.2%Perrigo Finance Unlimited Co.
Company Guar. Notes4.38% due 03/15/2026 . . . . . . . . . . . . . . . . . . . 700,000 723,526
Metal-Diversified — 0.2%Vedanta Resources PLC
Senior Notes6.38% due 07/30/2022* . . . . . . . . . . . . . . . . . . 805,000 789,906
Oil & Gas Drilling — 0.2%Transocean, Inc.
Company Guar. Notes6.80% due 03/15/2038 . . . . . . . . . . . . . . . . . . . 465,000 285,975
Transocean, Inc.Company Guar. Notes7.50% due 01/15/2026* . . . . . . . . . . . . . . . . . . 335,000 298,150
Transocean, Inc.Company Guar. Notes9.00% due 07/15/2023* . . . . . . . . . . . . . . . . . . 265,000 272,287
856,412
Oil Companies-Exploration & Production — 0.3%Geopark, Ltd.
Senior Sec. Notes6.50% due 09/21/2024* . . . . . . . . . . . . . . . . . . 995,000 1,023,606
Oil Companies-Integrated — 0.3%Petrobras Global Finance BV
Company Guar. Notes5.30% due 01/27/2025 . . . . . . . . . . . . . . . . . . . 460,000 502,090
58
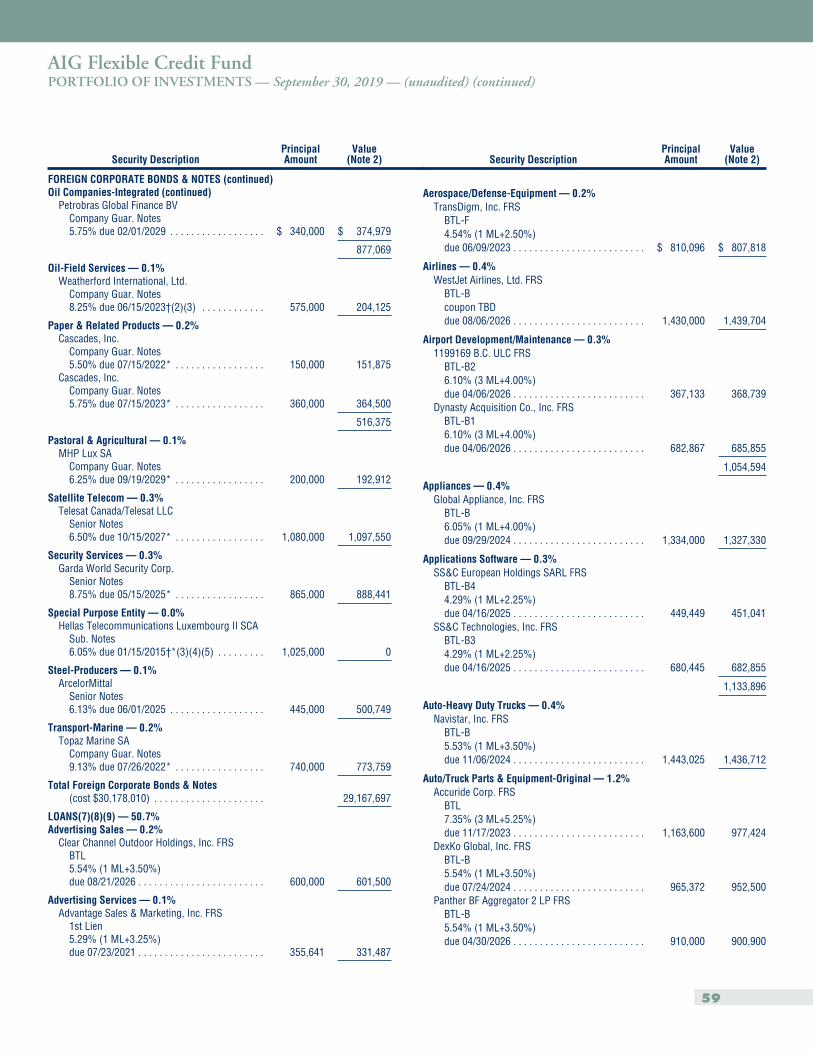
AIG Flexible Credit FundPORTFOLIO OF INVESTMENTS — September 30, 2019 — (unaudited) (continued)
Security DescriptionPrincipalAmount
Value(Note 2)
FOREIGN CORPORATE BONDS & NOTES (continued)Oil Companies-Integrated (continued)
Petrobras Global Finance BVCompany Guar. Notes5.75% due 02/01/2029 . . . . . . . . . . . . . . . . . . $ 340,000 $ 374,979
877,069
Oil-Field Services — 0.1%Weatherford International, Ltd.
Company Guar. Notes8.25% due 06/15/2023†(2)(3) . . . . . . . . . . . . 575,000 204,125
Paper & Related Products — 0.2%Cascades, Inc.
Company Guar. Notes5.50% due 07/15/2022* . . . . . . . . . . . . . . . . . 150,000 151,875
Cascades, Inc.Company Guar. Notes5.75% due 07/15/2023* . . . . . . . . . . . . . . . . . 360,000 364,500
516,375
Pastoral & Agricultural — 0.1%MHP Lux SA
Company Guar. Notes6.25% due 09/19/2029* . . . . . . . . . . . . . . . . . 200,000 192,912
Satellite Telecom — 0.3%Telesat Canada/Telesat LLC
Senior Notes6.50% due 10/15/2027* . . . . . . . . . . . . . . . . . 1,080,000 1,097,550
Security Services — 0.3%Garda World Security Corp.
Senior Notes8.75% due 05/15/2025* . . . . . . . . . . . . . . . . . 865,000 888,441
Special Purpose Entity — 0.0%Hellas Telecommunications Luxembourg II SCA
Sub. Notes6.05% due 01/15/2015†*(3)(4)(5) . . . . . . . . . 1,025,000 0
Steel-Producers — 0.1%ArcelorMittal
Senior Notes6.13% due 06/01/2025 . . . . . . . . . . . . . . . . . . 445,000 500,749
Transport-Marine — 0.2%Topaz Marine SA
Company Guar. Notes9.13% due 07/26/2022* . . . . . . . . . . . . . . . . . 740,000 773,759
Total Foreign Corporate Bonds & Notes(cost $30,178,010) . . . . . . . . . . . . . . . . . . . . . 29,167,697
LOANS(7)(8)(9) — 50.7%Advertising Sales — 0.2%
Clear Channel Outdoor Holdings, Inc. FRSBTL5.54% (1 ML+3.50%)due 08/21/2026 . . . . . . . . . . . . . . . . . . . . . . . . 600,000 601,500
Advertising Services — 0.1%Advantage Sales & Marketing, Inc. FRS
1st Lien5.29% (1 ML+3.25%)due 07/23/2021 . . . . . . . . . . . . . . . . . . . . . . . . 355,641 331,487
Security DescriptionPrincipalAmount
Value(Note 2)
Aerospace/Defense-Equipment — 0.2%TransDigm, Inc. FRS
BTL-F4.54% (1 ML+2.50%)due 06/09/2023 . . . . . . . . . . . . . . . . . . . . . . . . . $ 810,096 $ 807,818
Airlines — 0.4%WestJet Airlines, Ltd. FRS
BTL-Bcoupon TBDdue 08/06/2026 . . . . . . . . . . . . . . . . . . . . . . . . . 1,430,000 1,439,704
Airport Development/Maintenance — 0.3%1199169 B.C. ULC FRS
BTL-B26.10% (3 ML+4.00%)due 04/06/2026 . . . . . . . . . . . . . . . . . . . . . . . . . 367,133 368,739
Dynasty Acquisition Co., Inc. FRSBTL-B16.10% (3 ML+4.00%)due 04/06/2026 . . . . . . . . . . . . . . . . . . . . . . . . . 682,867 685,855
1,054,594
Appliances — 0.4%Global Appliance, Inc. FRS
BTL-B6.05% (1 ML+4.00%)due 09/29/2024 . . . . . . . . . . . . . . . . . . . . . . . . . 1,334,000 1,327,330
Applications Software — 0.3%SS&C European Holdings SARL FRS
BTL-B44.29% (1 ML+2.25%)due 04/16/2025 . . . . . . . . . . . . . . . . . . . . . . . . . 449,449 451,041
SS&C Technologies, Inc. FRSBTL-B34.29% (1 ML+2.25%)due 04/16/2025 . . . . . . . . . . . . . . . . . . . . . . . . . 680,445 682,855
1,133,896
Auto-Heavy Duty Trucks — 0.4%Navistar, Inc. FRS
BTL-B5.53% (1 ML+3.50%)due 11/06/2024 . . . . . . . . . . . . . . . . . . . . . . . . . 1,443,025 1,436,712
Auto/Truck Parts & Equipment-Original — 1.2%Accuride Corp. FRS
BTL7.35% (3 ML+5.25%)due 11/17/2023 . . . . . . . . . . . . . . . . . . . . . . . . . 1,163,600 977,424
DexKo Global, Inc. FRSBTL-B5.54% (1 ML+3.50%)due 07/24/2024 . . . . . . . . . . . . . . . . . . . . . . . . . 965,372 952,500
Panther BF Aggregator 2 LP FRSBTL-B5.54% (1 ML+3.50%)due 04/30/2026 . . . . . . . . . . . . . . . . . . . . . . . . . 910,000 900,900
59
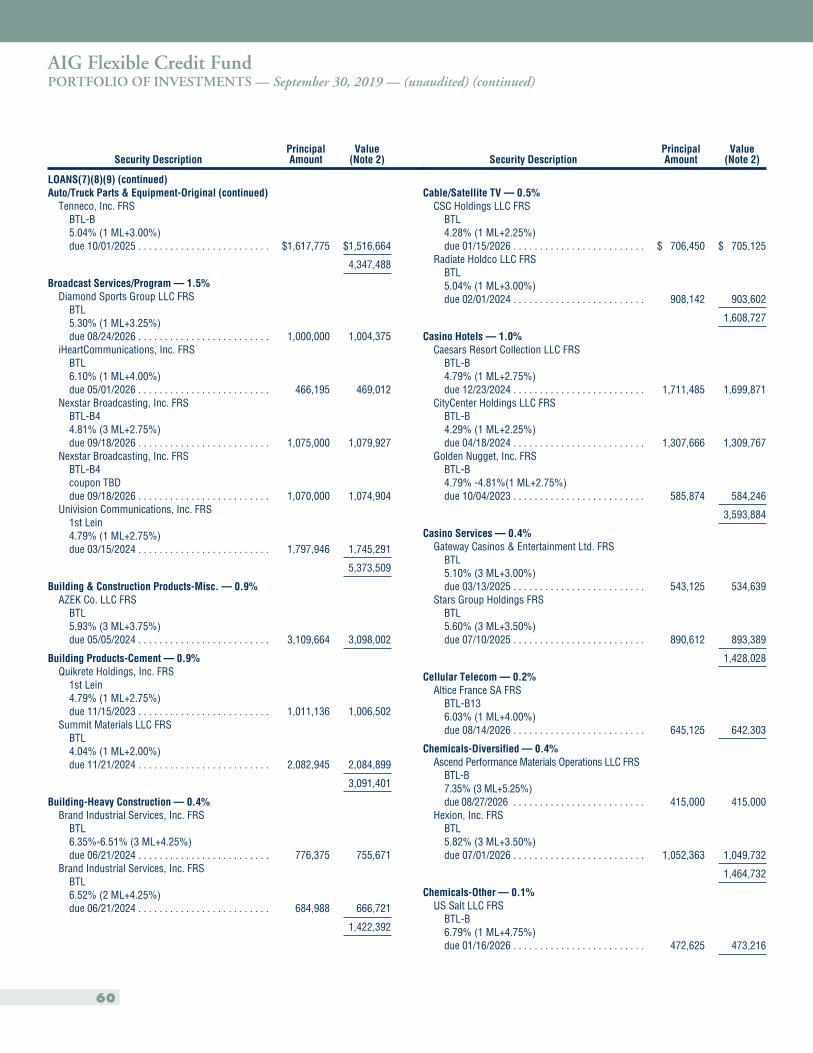
AIG Flexible Credit FundPORTFOLIO OF INVESTMENTS — September 30, 2019 — (unaudited) (continued)
Security DescriptionPrincipalAmount
Value(Note 2)
LOANS(7)(8)(9) (continued)Auto/Truck Parts & Equipment-Original (continued)
Tenneco, Inc. FRSBTL-B5.04% (1 ML+3.00%)due 10/01/2025 . . . . . . . . . . . . . . . . . . . . . . . . . $1,617,775 $1,516,664
4,347,488
Broadcast Services/Program — 1.5%Diamond Sports Group LLC FRS
BTL5.30% (1 ML+3.25%)due 08/24/2026 . . . . . . . . . . . . . . . . . . . . . . . . . 1,000,000 1,004,375
iHeartCommunications, Inc. FRSBTL6.10% (1 ML+4.00%)due 05/01/2026 . . . . . . . . . . . . . . . . . . . . . . . . . 466,195 469,012
Nexstar Broadcasting, Inc. FRSBTL-B44.81% (3 ML+2.75%)due 09/18/2026 . . . . . . . . . . . . . . . . . . . . . . . . . 1,075,000 1,079,927
Nexstar Broadcasting, Inc. FRSBTL-B4coupon TBDdue 09/18/2026 . . . . . . . . . . . . . . . . . . . . . . . . . 1,070,000 1,074,904
Univision Communications, Inc. FRS1st Lein4.79% (1 ML+2.75%)due 03/15/2024 . . . . . . . . . . . . . . . . . . . . . . . . . 1,797,946 1,745,291
5,373,509
Building & Construction Products-Misc. — 0.9%AZEK Co. LLC FRS
BTL5.93% (3 ML+3.75%)due 05/05/2024 . . . . . . . . . . . . . . . . . . . . . . . . . 3,109,664 3,098,002
Building Products-Cement — 0.9%Quikrete Holdings, Inc. FRS
1st Lein4.79% (1 ML+2.75%)due 11/15/2023 . . . . . . . . . . . . . . . . . . . . . . . . . 1,011,136 1,006,502
Summit Materials LLC FRSBTL4.04% (1 ML+2.00%)due 11/21/2024 . . . . . . . . . . . . . . . . . . . . . . . . . 2,082,945 2,084,899
3,091,401
Building-Heavy Construction — 0.4%Brand Industrial Services, Inc. FRS
BTL6.35%-6.51% (3 ML+4.25%)due 06/21/2024 . . . . . . . . . . . . . . . . . . . . . . . . . 776,375 755,671
Brand Industrial Services, Inc. FRSBTL6.52% (2 ML+4.25%)due 06/21/2024 . . . . . . . . . . . . . . . . . . . . . . . . . 684,988 666,721
1,422,392
Security DescriptionPrincipalAmount
Value(Note 2)
Cable/Satellite TV — 0.5%CSC Holdings LLC FRS
BTL4.28% (1 ML+2.25%)due 01/15/2026 . . . . . . . . . . . . . . . . . . . . . . . . . $ 706,450 $ 705,125
Radiate Holdco LLC FRSBTL5.04% (1 ML+3.00%)due 02/01/2024 . . . . . . . . . . . . . . . . . . . . . . . . . 908,142 903,602
1,608,727
Casino Hotels — 1.0%Caesars Resort Collection LLC FRS
BTL-B4.79% (1 ML+2.75%)due 12/23/2024 . . . . . . . . . . . . . . . . . . . . . . . . . 1,711,485 1,699,871
CityCenter Holdings LLC FRSBTL-B4.29% (1 ML+2.25%)due 04/18/2024 . . . . . . . . . . . . . . . . . . . . . . . . . 1,307,666 1,309,767
Golden Nugget, Inc. FRSBTL-B4.79% -4.81%(1 ML+2.75%)due 10/04/2023 . . . . . . . . . . . . . . . . . . . . . . . . . 585,874 584,246
3,593,884
Casino Services — 0.4%Gateway Casinos & Entertainment Ltd. FRS
BTL5.10% (3 ML+3.00%)due 03/13/2025 . . . . . . . . . . . . . . . . . . . . . . . . . 543,125 534,639
Stars Group Holdings FRSBTL5.60% (3 ML+3.50%)due 07/10/2025 . . . . . . . . . . . . . . . . . . . . . . . . . 890,612 893,389
1,428,028
Cellular Telecom — 0.2%Altice France SA FRS
BTL-B136.03% (1 ML+4.00%)due 08/14/2026 . . . . . . . . . . . . . . . . . . . . . . . . . 645,125 642,303
Chemicals-Diversified — 0.4%Ascend Performance Materials Operations LLC FRS
BTL-B7.35% (3 ML+5.25%)due 08/27/2026 . . . . . . . . . . . . . . . . . . . . . . . . . 415,000 415,000
Hexion, Inc. FRSBTL5.82% (3 ML+3.50%)due 07/01/2026 . . . . . . . . . . . . . . . . . . . . . . . . . 1,052,363 1,049,732
1,464,732
Chemicals-Other — 0.1%US Salt LLC FRS
BTL-B6.79% (1 ML+4.75%)due 01/16/2026 . . . . . . . . . . . . . . . . . . . . . . . . . 472,625 473,216
60
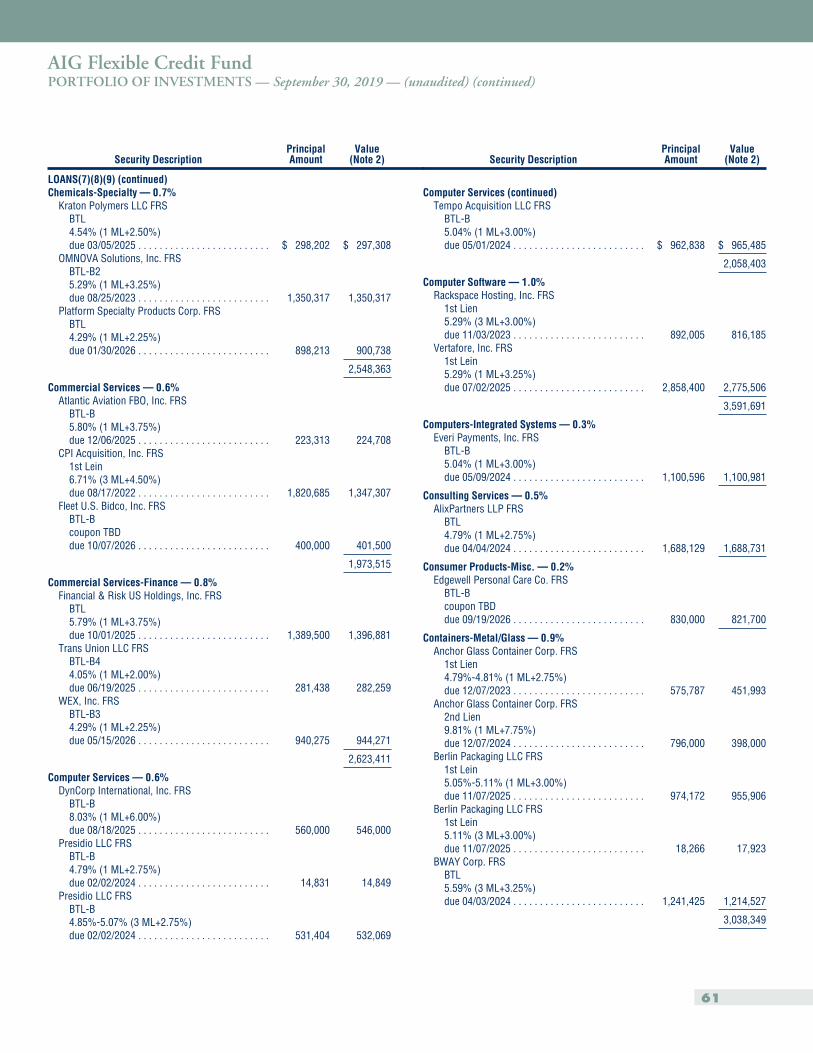
AIG Flexible Credit FundPORTFOLIO OF INVESTMENTS — September 30, 2019 — (unaudited) (continued)
Security DescriptionPrincipalAmount
Value(Note 2)
LOANS(7)(8)(9) (continued)Chemicals-Specialty — 0.7%
Kraton Polymers LLC FRSBTL4.54% (1 ML+2.50%)due 03/05/2025 . . . . . . . . . . . . . . . . . . . . . . . . . $ 298,202 $ 297,308
OMNOVA Solutions, Inc. FRSBTL-B25.29% (1 ML+3.25%)due 08/25/2023 . . . . . . . . . . . . . . . . . . . . . . . . . 1,350,317 1,350,317
Platform Specialty Products Corp. FRSBTL4.29% (1 ML+2.25%)due 01/30/2026 . . . . . . . . . . . . . . . . . . . . . . . . . 898,213 900,738
2,548,363
Commercial Services — 0.6%Atlantic Aviation FBO, Inc. FRS
BTL-B5.80% (1 ML+3.75%)due 12/06/2025 . . . . . . . . . . . . . . . . . . . . . . . . . 223,313 224,708
CPI Acquisition, Inc. FRS1st Lein6.71% (3 ML+4.50%)due 08/17/2022 . . . . . . . . . . . . . . . . . . . . . . . . . 1,820,685 1,347,307
Fleet U.S. Bidco, Inc. FRSBTL-Bcoupon TBDdue 10/07/2026 . . . . . . . . . . . . . . . . . . . . . . . . . 400,000 401,500
1,973,515
Commercial Services-Finance — 0.8%Financial & Risk US Holdings, Inc. FRS
BTL5.79% (1 ML+3.75%)due 10/01/2025 . . . . . . . . . . . . . . . . . . . . . . . . . 1,389,500 1,396,881
Trans Union LLC FRSBTL-B44.05% (1 ML+2.00%)due 06/19/2025 . . . . . . . . . . . . . . . . . . . . . . . . . 281,438 282,259
WEX, Inc. FRSBTL-B34.29% (1 ML+2.25%)due 05/15/2026 . . . . . . . . . . . . . . . . . . . . . . . . . 940,275 944,271
2,623,411
Computer Services — 0.6%DynCorp International, Inc. FRS
BTL-B8.03% (1 ML+6.00%)due 08/18/2025 . . . . . . . . . . . . . . . . . . . . . . . . . 560,000 546,000
Presidio LLC FRSBTL-B4.79% (1 ML+2.75%)due 02/02/2024 . . . . . . . . . . . . . . . . . . . . . . . . . 14,831 14,849
Presidio LLC FRSBTL-B4.85%-5.07% (3 ML+2.75%)due 02/02/2024 . . . . . . . . . . . . . . . . . . . . . . . . . 531,404 532,069
Security DescriptionPrincipalAmount
Value(Note 2)
Computer Services (continued)Tempo Acquisition LLC FRS
BTL-B5.04% (1 ML+3.00%)due 05/01/2024 . . . . . . . . . . . . . . . . . . . . . . . . . $ 962,838 $ 965,485
2,058,403
Computer Software — 1.0%Rackspace Hosting, Inc. FRS
1st Lien5.29% (3 ML+3.00%)due 11/03/2023 . . . . . . . . . . . . . . . . . . . . . . . . . 892,005 816,185
Vertafore, Inc. FRS1st Lein5.29% (1 ML+3.25%)due 07/02/2025 . . . . . . . . . . . . . . . . . . . . . . . . . 2,858,400 2,775,506
3,591,691
Computers-Integrated Systems — 0.3%Everi Payments, Inc. FRS
BTL-B5.04% (1 ML+3.00%)due 05/09/2024 . . . . . . . . . . . . . . . . . . . . . . . . . 1,100,596 1,100,981
Consulting Services — 0.5%AlixPartners LLP FRS
BTL4.79% (1 ML+2.75%)due 04/04/2024 . . . . . . . . . . . . . . . . . . . . . . . . . 1,688,129 1,688,731
Consumer Products-Misc. — 0.2%Edgewell Personal Care Co. FRS
BTL-Bcoupon TBDdue 09/19/2026 . . . . . . . . . . . . . . . . . . . . . . . . . 830,000 821,700
Containers-Metal/Glass — 0.9%Anchor Glass Container Corp. FRS
1st Lien4.79%-4.81% (1 ML+2.75%)due 12/07/2023 . . . . . . . . . . . . . . . . . . . . . . . . . 575,787 451,993
Anchor Glass Container Corp. FRS2nd Lien9.81% (1 ML+7.75%)due 12/07/2024 . . . . . . . . . . . . . . . . . . . . . . . . . 796,000 398,000
Berlin Packaging LLC FRS1st Lein5.05%-5.11% (1 ML+3.00%)due 11/07/2025 . . . . . . . . . . . . . . . . . . . . . . . . . 974,172 955,906
Berlin Packaging LLC FRS1st Lein5.11% (3 ML+3.00%)due 11/07/2025 . . . . . . . . . . . . . . . . . . . . . . . . . 18,266 17,923
BWAY Corp. FRSBTL5.59% (3 ML+3.25%)due 04/03/2024 . . . . . . . . . . . . . . . . . . . . . . . . . 1,241,425 1,214,527
3,038,349
61
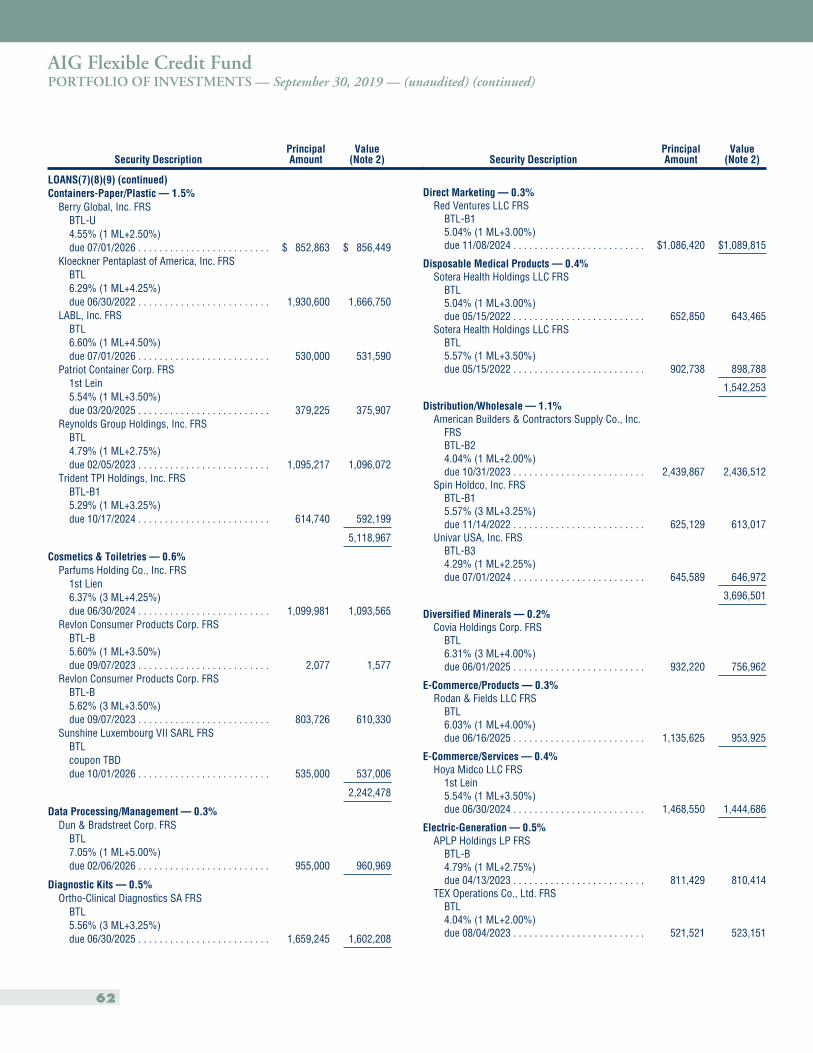
AIG Flexible Credit FundPORTFOLIO OF INVESTMENTS — September 30, 2019 — (unaudited) (continued)
Security DescriptionPrincipalAmount
Value(Note 2)
LOANS(7)(8)(9) (continued)Containers-Paper/Plastic — 1.5%
Berry Global, Inc. FRSBTL-U4.55% (1 ML+2.50%)due 07/01/2026 . . . . . . . . . . . . . . . . . . . . . . . . . $ 852,863 $ 856,449
Kloeckner Pentaplast of America, Inc. FRSBTL6.29% (1 ML+4.25%)due 06/30/2022 . . . . . . . . . . . . . . . . . . . . . . . . . 1,930,600 1,666,750
LABL, Inc. FRSBTL6.60% (1 ML+4.50%)due 07/01/2026 . . . . . . . . . . . . . . . . . . . . . . . . . 530,000 531,590
Patriot Container Corp. FRS1st Lein5.54% (1 ML+3.50%)due 03/20/2025 . . . . . . . . . . . . . . . . . . . . . . . . . 379,225 375,907
Reynolds Group Holdings, Inc. FRSBTL4.79% (1 ML+2.75%)due 02/05/2023 . . . . . . . . . . . . . . . . . . . . . . . . . 1,095,217 1,096,072
Trident TPI Holdings, Inc. FRSBTL-B15.29% (1 ML+3.25%)due 10/17/2024 . . . . . . . . . . . . . . . . . . . . . . . . . 614,740 592,199
5,118,967
Cosmetics & Toiletries — 0.6%Parfums Holding Co., Inc. FRS
1st Lien6.37% (3 ML+4.25%)due 06/30/2024 . . . . . . . . . . . . . . . . . . . . . . . . . 1,099,981 1,093,565
Revlon Consumer Products Corp. FRSBTL-B5.60% (1 ML+3.50%)due 09/07/2023 . . . . . . . . . . . . . . . . . . . . . . . . . 2,077 1,577
Revlon Consumer Products Corp. FRSBTL-B5.62% (3 ML+3.50%)due 09/07/2023 . . . . . . . . . . . . . . . . . . . . . . . . . 803,726 610,330
Sunshine Luxembourg VII SARL FRSBTLcoupon TBDdue 10/01/2026 . . . . . . . . . . . . . . . . . . . . . . . . . 535,000 537,006
2,242,478
Data Processing/Management — 0.3%Dun & Bradstreet Corp. FRS
BTL7.05% (1 ML+5.00%)due 02/06/2026 . . . . . . . . . . . . . . . . . . . . . . . . . 955,000 960,969
Diagnostic Kits — 0.5%Ortho-Clinical Diagnostics SA FRS
BTL5.56% (3 ML+3.25%)due 06/30/2025 . . . . . . . . . . . . . . . . . . . . . . . . . 1,659,245 1,602,208
Security DescriptionPrincipalAmount
Value(Note 2)
Direct Marketing — 0.3%Red Ventures LLC FRS
BTL-B15.04% (1 ML+3.00%)due 11/08/2024 . . . . . . . . . . . . . . . . . . . . . . . . . $1,086,420 $1,089,815
Disposable Medical Products — 0.4%Sotera Health Holdings LLC FRS
BTL5.04% (1 ML+3.00%)due 05/15/2022 . . . . . . . . . . . . . . . . . . . . . . . . . 652,850 643,465
Sotera Health Holdings LLC FRSBTL5.57% (1 ML+3.50%)due 05/15/2022 . . . . . . . . . . . . . . . . . . . . . . . . . 902,738 898,788
1,542,253
Distribution/Wholesale — 1.1%American Builders & Contractors Supply Co., Inc.
FRSBTL-B24.04% (1 ML+2.00%)due 10/31/2023 . . . . . . . . . . . . . . . . . . . . . . . . . 2,439,867 2,436,512
Spin Holdco, Inc. FRSBTL-B15.57% (3 ML+3.25%)due 11/14/2022 . . . . . . . . . . . . . . . . . . . . . . . . . 625,129 613,017
Univar USA, Inc. FRSBTL-B34.29% (1 ML+2.25%)due 07/01/2024 . . . . . . . . . . . . . . . . . . . . . . . . . 645,589 646,972
3,696,501
Diversified Minerals — 0.2%Covia Holdings Corp. FRS
BTL6.31% (3 ML+4.00%)due 06/01/2025 . . . . . . . . . . . . . . . . . . . . . . . . . 932,220 756,962
E-Commerce/Products — 0.3%Rodan & Fields LLC FRS
BTL6.03% (1 ML+4.00%)due 06/16/2025 . . . . . . . . . . . . . . . . . . . . . . . . . 1,135,625 953,925
E-Commerce/Services — 0.4%Hoya Midco LLC FRS
1st Lein5.54% (1 ML+3.50%)due 06/30/2024 . . . . . . . . . . . . . . . . . . . . . . . . . 1,468,550 1,444,686
Electric-Generation — 0.5%APLP Holdings LP FRS
BTL-B4.79% (1 ML+2.75%)due 04/13/2023 . . . . . . . . . . . . . . . . . . . . . . . . . 811,429 810,414
TEX Operations Co., Ltd. FRSBTL4.04% (1 ML+2.00%)due 08/04/2023 . . . . . . . . . . . . . . . . . . . . . . . . . 521,521 523,151
62
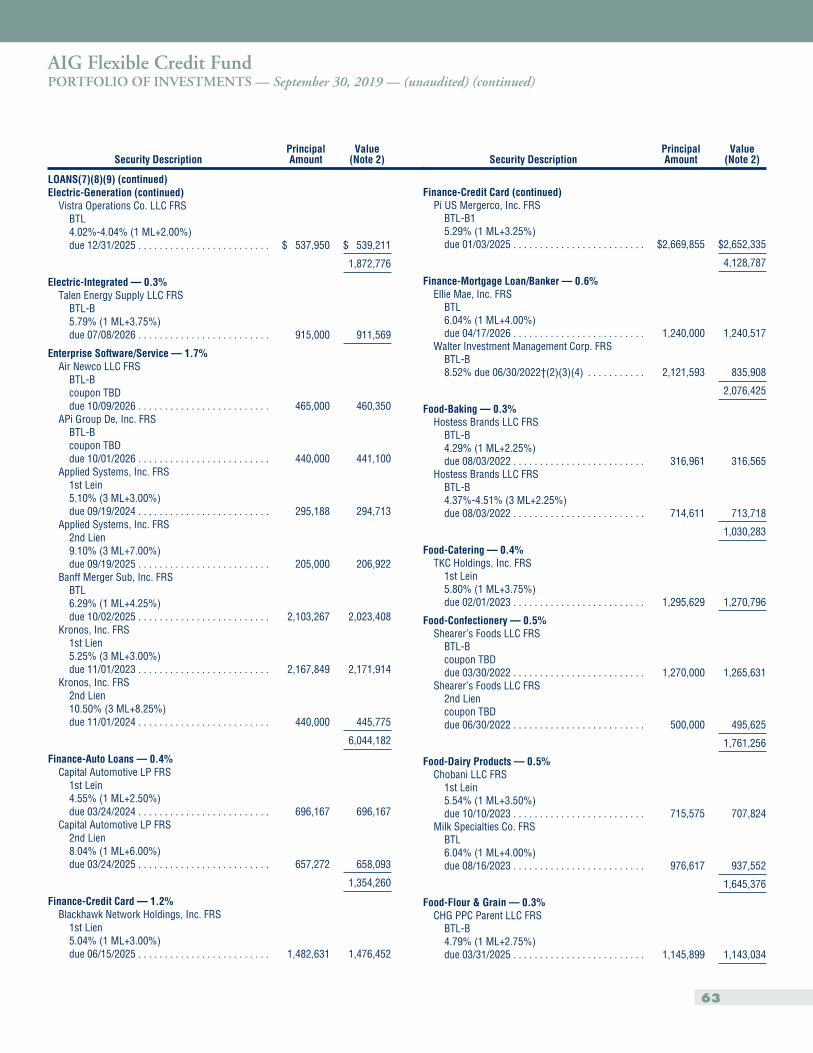
AIG Flexible Credit FundPORTFOLIO OF INVESTMENTS — September 30, 2019 — (unaudited) (continued)
Security DescriptionPrincipalAmount
Value(Note 2)
LOANS(7)(8)(9) (continued)Electric-Generation (continued)
Vistra Operations Co. LLC FRSBTL4.02%-4.04% (1 ML+2.00%)due 12/31/2025 . . . . . . . . . . . . . . . . . . . . . . . . . $ 537,950 $ 539,211
1,872,776
Electric-Integrated — 0.3%Talen Energy Supply LLC FRS
BTL-B5.79% (1 ML+3.75%)due 07/08/2026 . . . . . . . . . . . . . . . . . . . . . . . . . 915,000 911,569
Enterprise Software/Service — 1.7%Air Newco LLC FRS
BTL-Bcoupon TBDdue 10/09/2026 . . . . . . . . . . . . . . . . . . . . . . . . . 465,000 460,350
APi Group De, Inc. FRSBTL-Bcoupon TBDdue 10/01/2026 . . . . . . . . . . . . . . . . . . . . . . . . . 440,000 441,100
Applied Systems, Inc. FRS1st Lein5.10% (3 ML+3.00%)due 09/19/2024 . . . . . . . . . . . . . . . . . . . . . . . . . 295,188 294,713
Applied Systems, Inc. FRS2nd Lien9.10% (3 ML+7.00%)due 09/19/2025 . . . . . . . . . . . . . . . . . . . . . . . . . 205,000 206,922
Banff Merger Sub, Inc. FRSBTL6.29% (1 ML+4.25%)due 10/02/2025 . . . . . . . . . . . . . . . . . . . . . . . . . 2,103,267 2,023,408
Kronos, Inc. FRS1st Lien5.25% (3 ML+3.00%)due 11/01/2023 . . . . . . . . . . . . . . . . . . . . . . . . . 2,167,849 2,171,914
Kronos, Inc. FRS2nd Lien10.50% (3 ML+8.25%)due 11/01/2024 . . . . . . . . . . . . . . . . . . . . . . . . . 440,000 445,775
6,044,182
Finance-Auto Loans — 0.4%Capital Automotive LP FRS
1st Lein4.55% (1 ML+2.50%)due 03/24/2024 . . . . . . . . . . . . . . . . . . . . . . . . . 696,167 696,167
Capital Automotive LP FRS2nd Lien8.04% (1 ML+6.00%)due 03/24/2025 . . . . . . . . . . . . . . . . . . . . . . . . . 657,272 658,093
1,354,260
Finance-Credit Card — 1.2%Blackhawk Network Holdings, Inc. FRS
1st Lien5.04% (1 ML+3.00%)due 06/15/2025 . . . . . . . . . . . . . . . . . . . . . . . . . 1,482,631 1,476,452
Security DescriptionPrincipalAmount
Value(Note 2)
Finance-Credit Card (continued)Pi US Mergerco, Inc. FRS
BTL-B15.29% (1 ML+3.25%)due 01/03/2025 . . . . . . . . . . . . . . . . . . . . . . . . . $2,669,855 $2,652,335
4,128,787
Finance-Mortgage Loan/Banker — 0.6%Ellie Mae, Inc. FRS
BTL6.04% (1 ML+4.00%)due 04/17/2026 . . . . . . . . . . . . . . . . . . . . . . . . . 1,240,000 1,240,517
Walter Investment Management Corp. FRSBTL-B8.52% due 06/30/2022†(2)(3)(4) . . . . . . . . . . . 2,121,593 835,908
2,076,425
Food-Baking — 0.3%Hostess Brands LLC FRS
BTL-B4.29% (1 ML+2.25%)due 08/03/2022 . . . . . . . . . . . . . . . . . . . . . . . . . 316,961 316,565
Hostess Brands LLC FRSBTL-B4.37%-4.51% (3 ML+2.25%)due 08/03/2022 . . . . . . . . . . . . . . . . . . . . . . . . . 714,611 713,718
1,030,283
Food-Catering — 0.4%TKC Holdings, Inc. FRS
1st Lein5.80% (1 ML+3.75%)due 02/01/2023 . . . . . . . . . . . . . . . . . . . . . . . . . 1,295,629 1,270,796
Food-Confectionery — 0.5%Shearer’s Foods LLC FRS
BTL-Bcoupon TBDdue 03/30/2022 . . . . . . . . . . . . . . . . . . . . . . . . . 1,270,000 1,265,631
Shearer’s Foods LLC FRS2nd Liencoupon TBDdue 06/30/2022 . . . . . . . . . . . . . . . . . . . . . . . . . 500,000 495,625
1,761,256
Food-Dairy Products — 0.5%Chobani LLC FRS
1st Lein5.54% (1 ML+3.50%)due 10/10/2023 . . . . . . . . . . . . . . . . . . . . . . . . . 715,575 707,824
Milk Specialties Co. FRSBTL6.04% (1 ML+4.00%)due 08/16/2023 . . . . . . . . . . . . . . . . . . . . . . . . . 976,617 937,552
1,645,376
Food-Flour & Grain — 0.3%CHG PPC Parent LLC FRS
BTL-B4.79% (1 ML+2.75%)due 03/31/2025 . . . . . . . . . . . . . . . . . . . . . . . . . 1,145,899 1,143,034
63
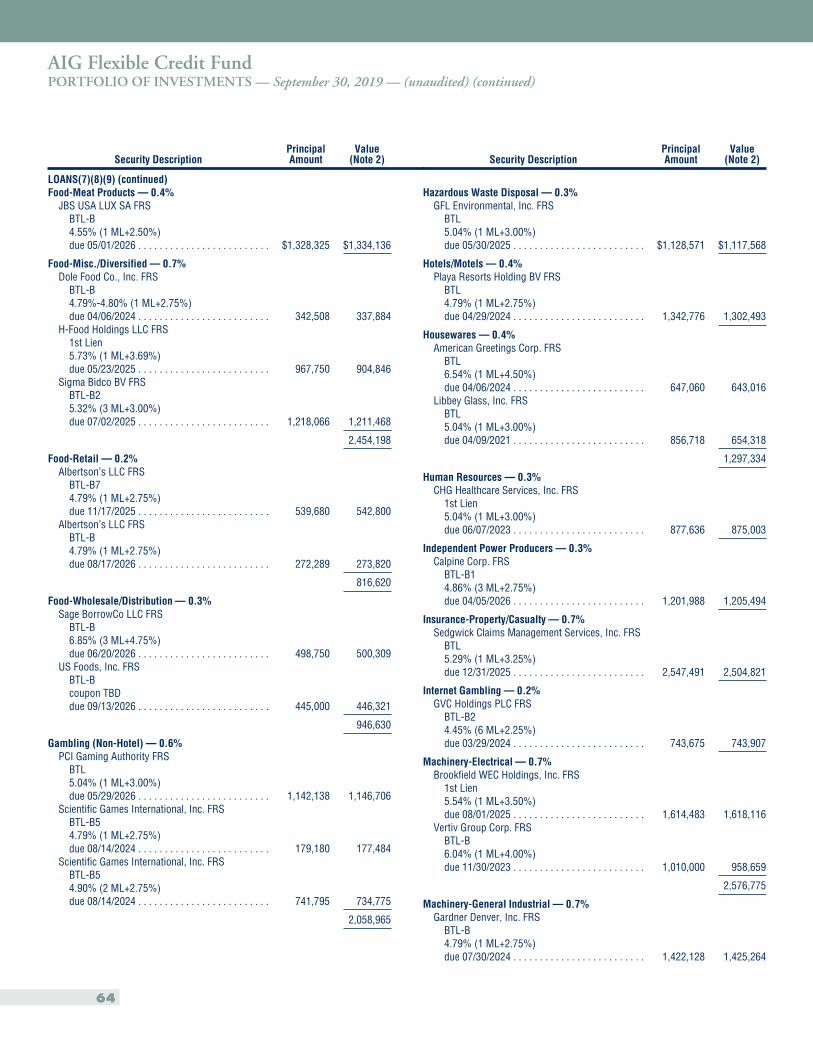
AIG Flexible Credit FundPORTFOLIO OF INVESTMENTS — September 30, 2019 — (unaudited) (continued)
Security DescriptionPrincipalAmount
Value(Note 2)
LOANS(7)(8)(9) (continued)Food-Meat Products — 0.4%
JBS USA LUX SA FRSBTL-B4.55% (1 ML+2.50%)due 05/01/2026 . . . . . . . . . . . . . . . . . . . . . . . . . $1,328,325 $1,334,136
Food-Misc./Diversified — 0.7%Dole Food Co., Inc. FRS
BTL-B4.79%-4.80% (1 ML+2.75%)due 04/06/2024 . . . . . . . . . . . . . . . . . . . . . . . . . 342,508 337,884
H-Food Holdings LLC FRS1st Lien5.73% (1 ML+3.69%)due 05/23/2025 . . . . . . . . . . . . . . . . . . . . . . . . . 967,750 904,846
Sigma Bidco BV FRSBTL-B25.32% (3 ML+3.00%)due 07/02/2025 . . . . . . . . . . . . . . . . . . . . . . . . . 1,218,066 1,211,468
2,454,198
Food-Retail — 0.2%Albertson’s LLC FRS
BTL-B74.79% (1 ML+2.75%)due 11/17/2025 . . . . . . . . . . . . . . . . . . . . . . . . . 539,680 542,800
Albertson’s LLC FRSBTL-B4.79% (1 ML+2.75%)due 08/17/2026 . . . . . . . . . . . . . . . . . . . . . . . . . 272,289 273,820
816,620
Food-Wholesale/Distribution — 0.3%Sage BorrowCo LLC FRS
BTL-B6.85% (3 ML+4.75%)due 06/20/2026 . . . . . . . . . . . . . . . . . . . . . . . . . 498,750 500,309
US Foods, Inc. FRSBTL-Bcoupon TBDdue 09/13/2026 . . . . . . . . . . . . . . . . . . . . . . . . . 445,000 446,321
946,630
Gambling (Non-Hotel) — 0.6%PCI Gaming Authority FRS
BTL5.04% (1 ML+3.00%)due 05/29/2026 . . . . . . . . . . . . . . . . . . . . . . . . . 1,142,138 1,146,706
Scientific Games International, Inc. FRSBTL-B54.79% (1 ML+2.75%)due 08/14/2024 . . . . . . . . . . . . . . . . . . . . . . . . . 179,180 177,484
Scientific Games International, Inc. FRSBTL-B54.90% (2 ML+2.75%)due 08/14/2024 . . . . . . . . . . . . . . . . . . . . . . . . . 741,795 734,775
2,058,965
Security DescriptionPrincipalAmount
Value(Note 2)
Hazardous Waste Disposal — 0.3%GFL Environmental, Inc. FRS
BTL5.04% (1 ML+3.00%)due 05/30/2025 . . . . . . . . . . . . . . . . . . . . . . . . . $1,128,571 $1,117,568
Hotels/Motels — 0.4%Playa Resorts Holding BV FRS
BTL4.79% (1 ML+2.75%)due 04/29/2024 . . . . . . . . . . . . . . . . . . . . . . . . . 1,342,776 1,302,493
Housewares — 0.4%American Greetings Corp. FRS
BTL6.54% (1 ML+4.50%)due 04/06/2024 . . . . . . . . . . . . . . . . . . . . . . . . . 647,060 643,016
Libbey Glass, Inc. FRSBTL5.04% (1 ML+3.00%)due 04/09/2021 . . . . . . . . . . . . . . . . . . . . . . . . . 856,718 654,318
1,297,334
Human Resources — 0.3%CHG Healthcare Services, Inc. FRS
1st Lien5.04% (1 ML+3.00%)due 06/07/2023 . . . . . . . . . . . . . . . . . . . . . . . . . 877,636 875,003
Independent Power Producers — 0.3%Calpine Corp. FRS
BTL-B14.86% (3 ML+2.75%)due 04/05/2026 . . . . . . . . . . . . . . . . . . . . . . . . . 1,201,988 1,205,494
Insurance-Property/Casualty — 0.7%Sedgwick Claims Management Services, Inc. FRS
BTL5.29% (1 ML+3.25%)due 12/31/2025 . . . . . . . . . . . . . . . . . . . . . . . . . 2,547,491 2,504,821
Internet Gambling — 0.2%GVC Holdings PLC FRS
BTL-B24.45% (6 ML+2.25%)due 03/29/2024 . . . . . . . . . . . . . . . . . . . . . . . . . 743,675 743,907
Machinery-Electrical — 0.7%Brookfield WEC Holdings, Inc. FRS
1st Lien5.54% (1 ML+3.50%)due 08/01/2025 . . . . . . . . . . . . . . . . . . . . . . . . . 1,614,483 1,618,116
Vertiv Group Corp. FRSBTL-B6.04% (1 ML+4.00%)due 11/30/2023 . . . . . . . . . . . . . . . . . . . . . . . . . 1,010,000 958,659
2,576,775
Machinery-General Industrial — 0.7%Gardner Denver, Inc. FRS
BTL-B4.79% (1 ML+2.75%)due 07/30/2024 . . . . . . . . . . . . . . . . . . . . . . . . . 1,422,128 1,425,264
64
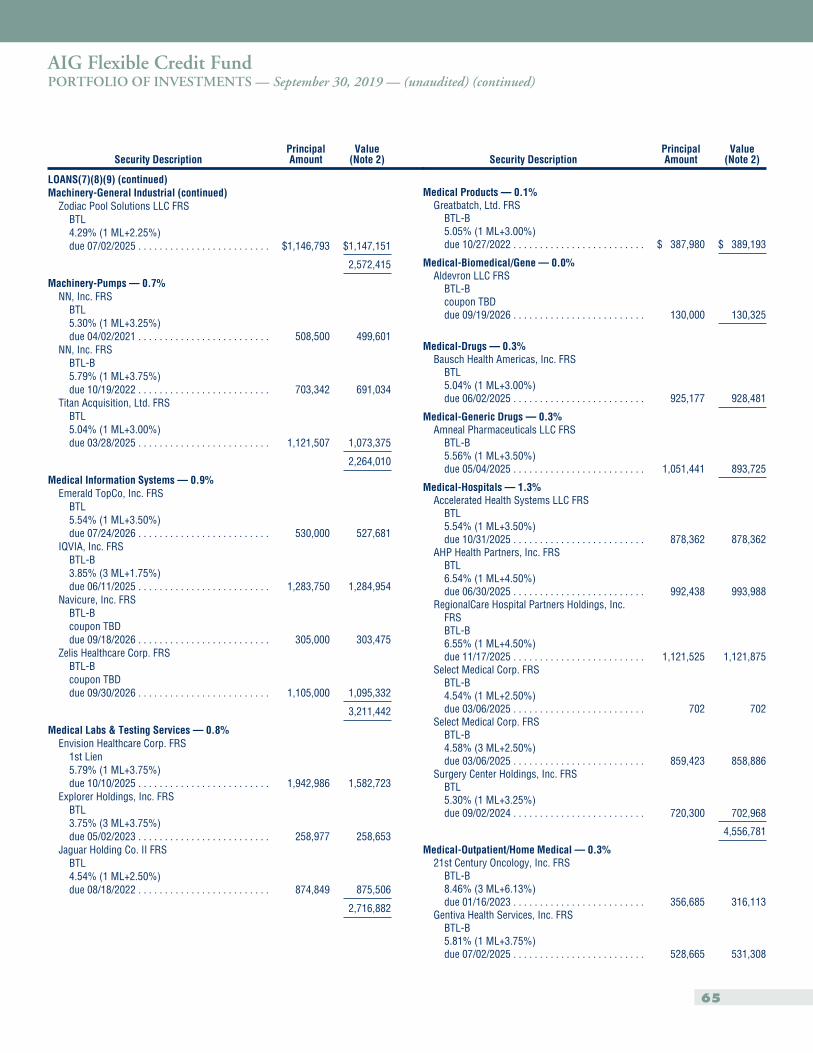
AIG Flexible Credit FundPORTFOLIO OF INVESTMENTS — September 30, 2019 — (unaudited) (continued)
Security DescriptionPrincipalAmount
Value(Note 2)
LOANS(7)(8)(9) (continued)Machinery-General Industrial (continued)
Zodiac Pool Solutions LLC FRSBTL4.29% (1 ML+2.25%)due 07/02/2025 . . . . . . . . . . . . . . . . . . . . . . . . . $1,146,793 $1,147,151
2,572,415
Machinery-Pumps — 0.7%NN, Inc. FRS
BTL5.30% (1 ML+3.25%)due 04/02/2021 . . . . . . . . . . . . . . . . . . . . . . . . . 508,500 499,601
NN, Inc. FRSBTL-B5.79% (1 ML+3.75%)due 10/19/2022 . . . . . . . . . . . . . . . . . . . . . . . . . 703,342 691,034
Titan Acquisition, Ltd. FRSBTL5.04% (1 ML+3.00%)due 03/28/2025 . . . . . . . . . . . . . . . . . . . . . . . . . 1,121,507 1,073,375
2,264,010
Medical Information Systems — 0.9%Emerald TopCo, Inc. FRS
BTL5.54% (1 ML+3.50%)due 07/24/2026 . . . . . . . . . . . . . . . . . . . . . . . . . 530,000 527,681
IQVIA, Inc. FRSBTL-B3.85% (3 ML+1.75%)due 06/11/2025 . . . . . . . . . . . . . . . . . . . . . . . . . 1,283,750 1,284,954
Navicure, Inc. FRSBTL-Bcoupon TBDdue 09/18/2026 . . . . . . . . . . . . . . . . . . . . . . . . . 305,000 303,475
Zelis Healthcare Corp. FRSBTL-Bcoupon TBDdue 09/30/2026 . . . . . . . . . . . . . . . . . . . . . . . . . 1,105,000 1,095,332
3,211,442
Medical Labs & Testing Services — 0.8%Envision Healthcare Corp. FRS
1st Lien5.79% (1 ML+3.75%)due 10/10/2025 . . . . . . . . . . . . . . . . . . . . . . . . . 1,942,986 1,582,723
Explorer Holdings, Inc. FRSBTL3.75% (3 ML+3.75%)due 05/02/2023 . . . . . . . . . . . . . . . . . . . . . . . . . 258,977 258,653
Jaguar Holding Co. II FRSBTL4.54% (1 ML+2.50%)due 08/18/2022 . . . . . . . . . . . . . . . . . . . . . . . . . 874,849 875,506
2,716,882
Security DescriptionPrincipalAmount
Value(Note 2)
Medical Products — 0.1%Greatbatch, Ltd. FRS
BTL-B5.05% (1 ML+3.00%)due 10/27/2022 . . . . . . . . . . . . . . . . . . . . . . . . . $ 387,980 $ 389,193
Medical-Biomedical/Gene — 0.0%Aldevron LLC FRS
BTL-Bcoupon TBDdue 09/19/2026 . . . . . . . . . . . . . . . . . . . . . . . . . 130,000 130,325
Medical-Drugs — 0.3%Bausch Health Americas, Inc. FRS
BTL5.04% (1 ML+3.00%)due 06/02/2025 . . . . . . . . . . . . . . . . . . . . . . . . . 925,177 928,481
Medical-Generic Drugs — 0.3%Amneal Pharmaceuticals LLC FRS
BTL-B5.56% (1 ML+3.50%)due 05/04/2025 . . . . . . . . . . . . . . . . . . . . . . . . . 1,051,441 893,725
Medical-Hospitals — 1.3%Accelerated Health Systems LLC FRS
BTL5.54% (1 ML+3.50%)due 10/31/2025 . . . . . . . . . . . . . . . . . . . . . . . . . 878,362 878,362
AHP Health Partners, Inc. FRSBTL6.54% (1 ML+4.50%)due 06/30/2025 . . . . . . . . . . . . . . . . . . . . . . . . . 992,438 993,988
RegionalCare Hospital Partners Holdings, Inc.FRSBTL-B6.55% (1 ML+4.50%)due 11/17/2025 . . . . . . . . . . . . . . . . . . . . . . . . . 1,121,525 1,121,875
Select Medical Corp. FRSBTL-B4.54% (1 ML+2.50%)due 03/06/2025 . . . . . . . . . . . . . . . . . . . . . . . . . 702 702
Select Medical Corp. FRSBTL-B4.58% (3 ML+2.50%)due 03/06/2025 . . . . . . . . . . . . . . . . . . . . . . . . . 859,423 858,886
Surgery Center Holdings, Inc. FRSBTL5.30% (1 ML+3.25%)due 09/02/2024 . . . . . . . . . . . . . . . . . . . . . . . . . 720,300 702,968
4,556,781
Medical-Outpatient/Home Medical — 0.3%21st Century Oncology, Inc. FRS
BTL-B8.46% (3 ML+6.13%)due 01/16/2023 . . . . . . . . . . . . . . . . . . . . . . . . . 356,685 316,113
Gentiva Health Services, Inc. FRSBTL-B5.81% (1 ML+3.75%)due 07/02/2025 . . . . . . . . . . . . . . . . . . . . . . . . . 528,665 531,308
65
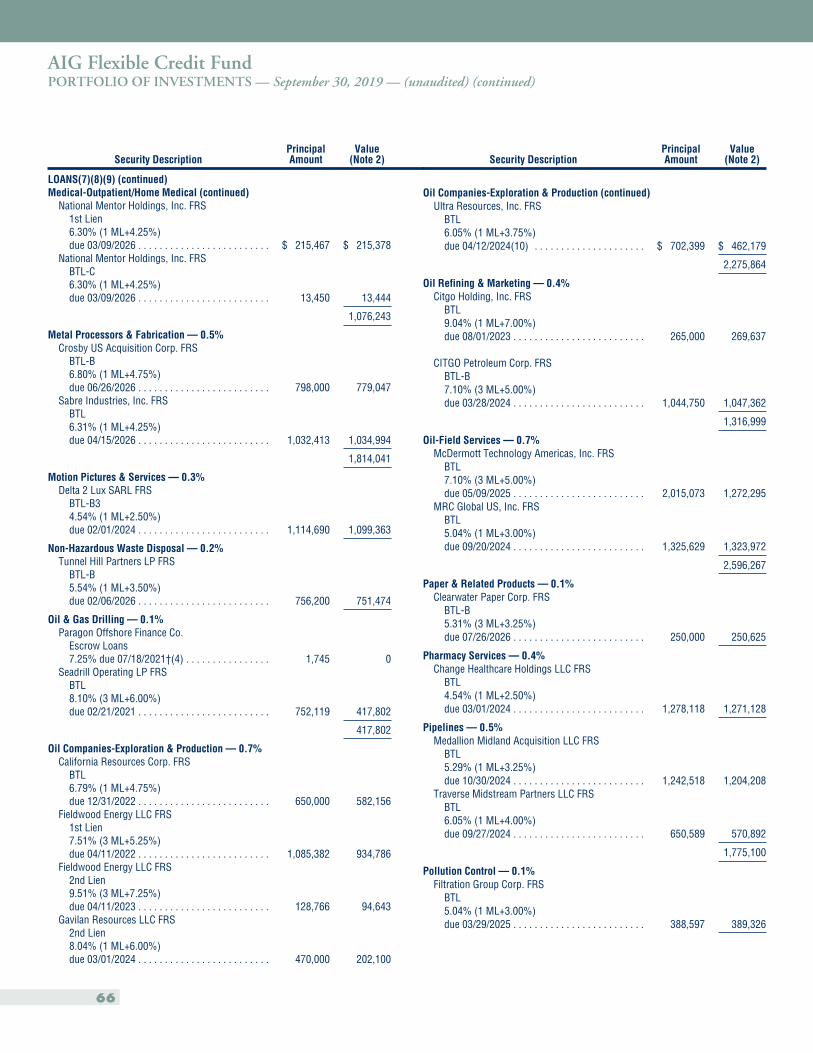
AIG Flexible Credit FundPORTFOLIO OF INVESTMENTS — September 30, 2019 — (unaudited) (continued)
Security DescriptionPrincipalAmount
Value(Note 2)
LOANS(7)(8)(9) (continued)Medical-Outpatient/Home Medical (continued)
National Mentor Holdings, Inc. FRS1st Lien6.30% (1 ML+4.25%)due 03/09/2026 . . . . . . . . . . . . . . . . . . . . . . . . . $ 215,467 $ 215,378
National Mentor Holdings, Inc. FRSBTL-C6.30% (1 ML+4.25%)due 03/09/2026 . . . . . . . . . . . . . . . . . . . . . . . . . 13,450 13,444
1,076,243
Metal Processors & Fabrication — 0.5%Crosby US Acquisition Corp. FRS
BTL-B6.80% (1 ML+4.75%)due 06/26/2026 . . . . . . . . . . . . . . . . . . . . . . . . . 798,000 779,047
Sabre Industries, Inc. FRSBTL6.31% (1 ML+4.25%)due 04/15/2026 . . . . . . . . . . . . . . . . . . . . . . . . . 1,032,413 1,034,994
1,814,041
Motion Pictures & Services — 0.3%Delta 2 Lux SARL FRS
BTL-B34.54% (1 ML+2.50%)due 02/01/2024 . . . . . . . . . . . . . . . . . . . . . . . . . 1,114,690 1,099,363
Non-Hazardous Waste Disposal — 0.2%Tunnel Hill Partners LP FRS
BTL-B5.54% (1 ML+3.50%)due 02/06/2026 . . . . . . . . . . . . . . . . . . . . . . . . . 756,200 751,474
Oil & Gas Drilling — 0.1%Paragon Offshore Finance Co.
Escrow Loans7.25% due 07/18/2021†(4) . . . . . . . . . . . . . . . . 1,745 0
Seadrill Operating LP FRSBTL8.10% (3 ML+6.00%)due 02/21/2021 . . . . . . . . . . . . . . . . . . . . . . . . . 752,119 417,802
417,802
Oil Companies-Exploration & Production — 0.7%California Resources Corp. FRS
BTL6.79% (1 ML+4.75%)due 12/31/2022 . . . . . . . . . . . . . . . . . . . . . . . . . 650,000 582,156
Fieldwood Energy LLC FRS1st Lien7.51% (3 ML+5.25%)due 04/11/2022 . . . . . . . . . . . . . . . . . . . . . . . . . 1,085,382 934,786
Fieldwood Energy LLC FRS2nd Lien9.51% (3 ML+7.25%)due 04/11/2023 . . . . . . . . . . . . . . . . . . . . . . . . . 128,766 94,643
Gavilan Resources LLC FRS2nd Lien8.04% (1 ML+6.00%)due 03/01/2024 . . . . . . . . . . . . . . . . . . . . . . . . . 470,000 202,100
Security DescriptionPrincipalAmount
Value(Note 2)
Oil Companies-Exploration & Production (continued)Ultra Resources, Inc. FRS
BTL6.05% (1 ML+3.75%)due 04/12/2024(10) . . . . . . . . . . . . . . . . . . . . . $ 702,399 $ 462,179
2,275,864
Oil Refining & Marketing — 0.4%Citgo Holding, Inc. FRS
BTL9.04% (1 ML+7.00%)due 08/01/2023 . . . . . . . . . . . . . . . . . . . . . . . . . 265,000 269,637
CITGO Petroleum Corp. FRSBTL-B7.10% (3 ML+5.00%)due 03/28/2024 . . . . . . . . . . . . . . . . . . . . . . . . . 1,044,750 1,047,362
1,316,999
Oil-Field Services — 0.7%McDermott Technology Americas, Inc. FRS
BTL7.10% (3 ML+5.00%)due 05/09/2025 . . . . . . . . . . . . . . . . . . . . . . . . . 2,015,073 1,272,295
MRC Global US, Inc. FRSBTL5.04% (1 ML+3.00%)due 09/20/2024 . . . . . . . . . . . . . . . . . . . . . . . . . 1,325,629 1,323,972
2,596,267
Paper & Related Products — 0.1%Clearwater Paper Corp. FRS
BTL-B5.31% (3 ML+3.25%)due 07/26/2026 . . . . . . . . . . . . . . . . . . . . . . . . . 250,000 250,625
Pharmacy Services — 0.4%Change Healthcare Holdings LLC FRS
BTL4.54% (1 ML+2.50%)due 03/01/2024 . . . . . . . . . . . . . . . . . . . . . . . . . 1,278,118 1,271,128
Pipelines — 0.5%Medallion Midland Acquisition LLC FRS
BTL5.29% (1 ML+3.25%)due 10/30/2024 . . . . . . . . . . . . . . . . . . . . . . . . . 1,242,518 1,204,208
Traverse Midstream Partners LLC FRSBTL6.05% (1 ML+4.00%)due 09/27/2024 . . . . . . . . . . . . . . . . . . . . . . . . . 650,589 570,892
1,775,100
Pollution Control — 0.1%Filtration Group Corp. FRS
BTL5.04% (1 ML+3.00%)due 03/29/2025 . . . . . . . . . . . . . . . . . . . . . . . . . 388,597 389,326
66
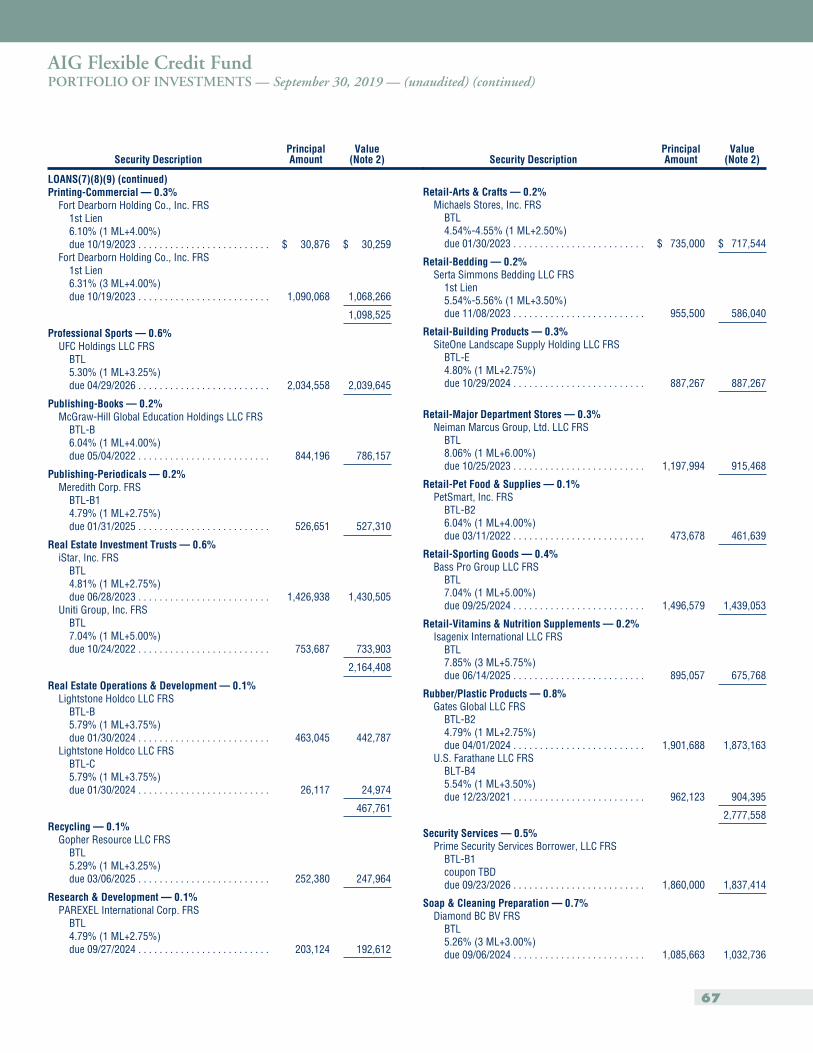
AIG Flexible Credit FundPORTFOLIO OF INVESTMENTS — September 30, 2019 — (unaudited) (continued)
Security DescriptionPrincipalAmount
Value(Note 2)
LOANS(7)(8)(9) (continued)Printing-Commercial — 0.3%
Fort Dearborn Holding Co., Inc. FRS1st Lien6.10% (1 ML+4.00%)due 10/19/2023 . . . . . . . . . . . . . . . . . . . . . . . . . $ 30,876 $ 30,259
Fort Dearborn Holding Co., Inc. FRS1st Lien6.31% (3 ML+4.00%)due 10/19/2023 . . . . . . . . . . . . . . . . . . . . . . . . . 1,090,068 1,068,266
1,098,525
Professional Sports — 0.6%UFC Holdings LLC FRS
BTL5.30% (1 ML+3.25%)due 04/29/2026 . . . . . . . . . . . . . . . . . . . . . . . . . 2,034,558 2,039,645
Publishing-Books — 0.2%McGraw-Hill Global Education Holdings LLC FRS
BTL-B6.04% (1 ML+4.00%)due 05/04/2022 . . . . . . . . . . . . . . . . . . . . . . . . . 844,196 786,157
Publishing-Periodicals — 0.2%Meredith Corp. FRS
BTL-B14.79% (1 ML+2.75%)due 01/31/2025 . . . . . . . . . . . . . . . . . . . . . . . . . 526,651 527,310
Real Estate Investment Trusts — 0.6%iStar, Inc. FRS
BTL4.81% (1 ML+2.75%)due 06/28/2023 . . . . . . . . . . . . . . . . . . . . . . . . . 1,426,938 1,430,505
Uniti Group, Inc. FRSBTL7.04% (1 ML+5.00%)due 10/24/2022 . . . . . . . . . . . . . . . . . . . . . . . . . 753,687 733,903
2,164,408
Real Estate Operations & Development — 0.1%Lightstone Holdco LLC FRS
BTL-B5.79% (1 ML+3.75%)due 01/30/2024 . . . . . . . . . . . . . . . . . . . . . . . . . 463,045 442,787
Lightstone Holdco LLC FRSBTL-C5.79% (1 ML+3.75%)due 01/30/2024 . . . . . . . . . . . . . . . . . . . . . . . . . 26,117 24,974
467,761
Recycling — 0.1%Gopher Resource LLC FRS
BTL5.29% (1 ML+3.25%)due 03/06/2025 . . . . . . . . . . . . . . . . . . . . . . . . . 252,380 247,964
Research & Development — 0.1%PAREXEL International Corp. FRS
BTL4.79% (1 ML+2.75%)due 09/27/2024 . . . . . . . . . . . . . . . . . . . . . . . . . 203,124 192,612
Security DescriptionPrincipalAmount
Value(Note 2)
Retail-Arts & Crafts — 0.2%Michaels Stores, Inc. FRS
BTL4.54%-4.55% (1 ML+2.50%)due 01/30/2023 . . . . . . . . . . . . . . . . . . . . . . . . . $ 735,000 $ 717,544
Retail-Bedding — 0.2%Serta Simmons Bedding LLC FRS
1st Lien5.54%-5.56% (1 ML+3.50%)due 11/08/2023 . . . . . . . . . . . . . . . . . . . . . . . . . 955,500 586,040
Retail-Building Products — 0.3%SiteOne Landscape Supply Holding LLC FRS
BTL-E4.80% (1 ML+2.75%)due 10/29/2024 . . . . . . . . . . . . . . . . . . . . . . . . . 887,267 887,267
Retail-Major Department Stores — 0.3%Neiman Marcus Group, Ltd. LLC FRS
BTL8.06% (1 ML+6.00%)due 10/25/2023 . . . . . . . . . . . . . . . . . . . . . . . . . 1,197,994 915,468
Retail-Pet Food & Supplies — 0.1%PetSmart, Inc. FRS
BTL-B26.04% (1 ML+4.00%)due 03/11/2022 . . . . . . . . . . . . . . . . . . . . . . . . . 473,678 461,639
Retail-Sporting Goods — 0.4%Bass Pro Group LLC FRS
BTL7.04% (1 ML+5.00%)due 09/25/2024 . . . . . . . . . . . . . . . . . . . . . . . . . 1,496,579 1,439,053
Retail-Vitamins & Nutrition Supplements — 0.2%Isagenix International LLC FRS
BTL7.85% (3 ML+5.75%)due 06/14/2025 . . . . . . . . . . . . . . . . . . . . . . . . . 895,057 675,768
Rubber/Plastic Products — 0.8%Gates Global LLC FRS
BTL-B24.79% (1 ML+2.75%)due 04/01/2024 . . . . . . . . . . . . . . . . . . . . . . . . . 1,901,688 1,873,163
U.S. Farathane LLC FRSBLT-B45.54% (1 ML+3.50%)due 12/23/2021 . . . . . . . . . . . . . . . . . . . . . . . . . 962,123 904,395
2,777,558
Security Services — 0.5%Prime Security Services Borrower, LLC FRS
BTL-B1coupon TBDdue 09/23/2026 . . . . . . . . . . . . . . . . . . . . . . . . . 1,860,000 1,837,414
Soap & Cleaning Preparation — 0.7%Diamond BC BV FRS
BTL5.26% (3 ML+3.00%)due 09/06/2024 . . . . . . . . . . . . . . . . . . . . . . . . . 1,085,663 1,032,736
67
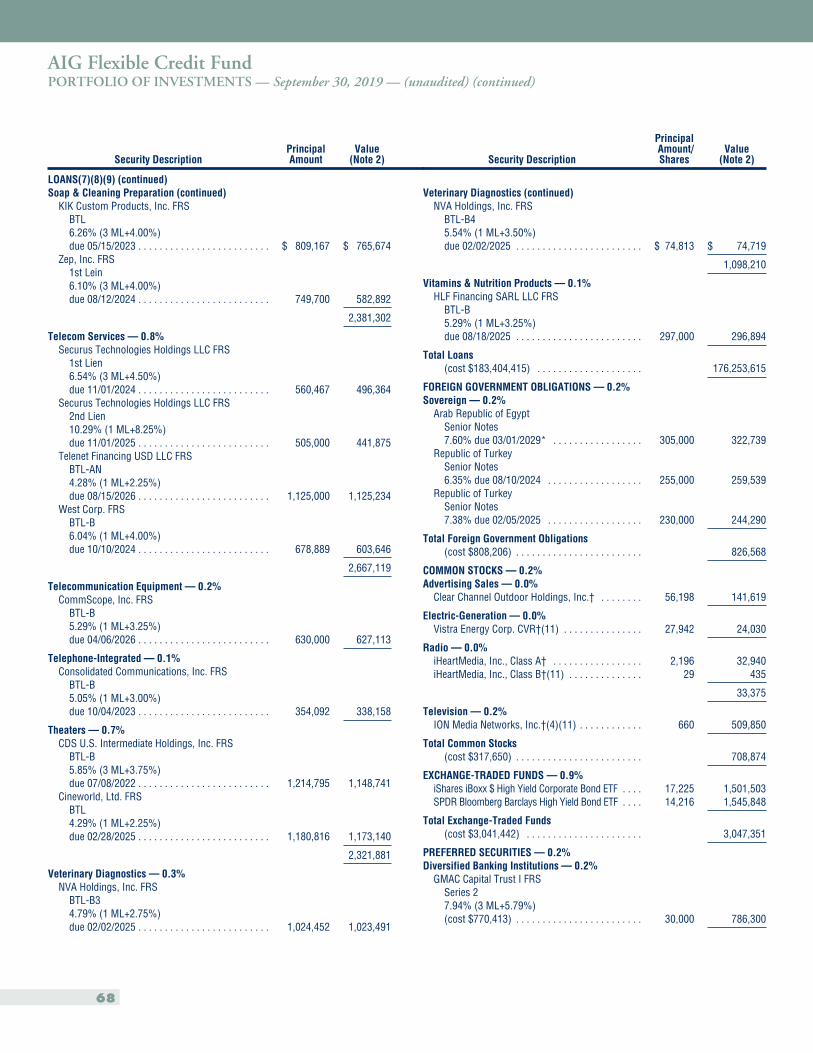
AIG Flexible Credit FundPORTFOLIO OF INVESTMENTS — September 30, 2019 — (unaudited) (continued)
Security DescriptionPrincipalAmount
Value(Note 2)
LOANS(7)(8)(9) (continued)Soap & Cleaning Preparation (continued)
KIK Custom Products, Inc. FRSBTL6.26% (3 ML+4.00%)due 05/15/2023 . . . . . . . . . . . . . . . . . . . . . . . . . $ 809,167 $ 765,674
Zep, Inc. FRS1st Lein6.10% (3 ML+4.00%)due 08/12/2024 . . . . . . . . . . . . . . . . . . . . . . . . . 749,700 582,892
2,381,302
Telecom Services — 0.8%Securus Technologies Holdings LLC FRS
1st Lien6.54% (3 ML+4.50%)due 11/01/2024 . . . . . . . . . . . . . . . . . . . . . . . . . 560,467 496,364
Securus Technologies Holdings LLC FRS2nd Lien10.29% (1 ML+8.25%)due 11/01/2025 . . . . . . . . . . . . . . . . . . . . . . . . . 505,000 441,875
Telenet Financing USD LLC FRSBTL-AN4.28% (1 ML+2.25%)due 08/15/2026 . . . . . . . . . . . . . . . . . . . . . . . . . 1,125,000 1,125,234
West Corp. FRSBTL-B6.04% (1 ML+4.00%)due 10/10/2024 . . . . . . . . . . . . . . . . . . . . . . . . . 678,889 603,646
2,667,119
Telecommunication Equipment — 0.2%CommScope, Inc. FRS
BTL-B5.29% (1 ML+3.25%)due 04/06/2026 . . . . . . . . . . . . . . . . . . . . . . . . . 630,000 627,113
Telephone-Integrated — 0.1%Consolidated Communications, Inc. FRS
BTL-B5.05% (1 ML+3.00%)due 10/04/2023 . . . . . . . . . . . . . . . . . . . . . . . . . 354,092 338,158
Theaters — 0.7%CDS U.S. Intermediate Holdings, Inc. FRS
BTL-B5.85% (3 ML+3.75%)due 07/08/2022 . . . . . . . . . . . . . . . . . . . . . . . . . 1,214,795 1,148,741
Cineworld, Ltd. FRSBTL4.29% (1 ML+2.25%)due 02/28/2025 . . . . . . . . . . . . . . . . . . . . . . . . . 1,180,816 1,173,140
2,321,881
Veterinary Diagnostics — 0.3%NVA Holdings, Inc. FRS
BTL-B34.79% (1 ML+2.75%)due 02/02/2025 . . . . . . . . . . . . . . . . . . . . . . . . . 1,024,452 1,023,491
Security Description
PrincipalAmount/Shares
Value(Note 2)
Veterinary Diagnostics (continued)NVA Holdings, Inc. FRS
BTL-B45.54% (1 ML+3.50%)due 02/02/2025 . . . . . . . . . . . . . . . . . . . . . . . . $ 74,813 $ 74,719
1,098,210
Vitamins & Nutrition Products — 0.1%HLF Financing SARL LLC FRS
BTL-B5.29% (1 ML+3.25%)due 08/18/2025 . . . . . . . . . . . . . . . . . . . . . . . . 297,000 296,894
Total Loans(cost $183,404,415) . . . . . . . . . . . . . . . . . . . . 176,253,615
FOREIGN GOVERNMENT OBLIGATIONS — 0.2%Sovereign — 0.2%
Arab Republic of EgyptSenior Notes7.60% due 03/01/2029* . . . . . . . . . . . . . . . . . 305,000 322,739
Republic of TurkeySenior Notes6.35% due 08/10/2024 . . . . . . . . . . . . . . . . . . 255,000 259,539
Republic of TurkeySenior Notes7.38% due 02/05/2025 . . . . . . . . . . . . . . . . . . 230,000 244,290
Total Foreign Government Obligations(cost $808,206) . . . . . . . . . . . . . . . . . . . . . . . . 826,568
COMMON STOCKS — 0.2%Advertising Sales — 0.0%
Clear Channel Outdoor Holdings, Inc.† . . . . . . . . 56,198 141,619
Electric-Generation — 0.0%Vistra Energy Corp. CVR†(11) . . . . . . . . . . . . . . . 27,942 24,030
Radio — 0.0%iHeartMedia, Inc., Class A† . . . . . . . . . . . . . . . . . 2,196 32,940iHeartMedia, Inc., Class B†(11) . . . . . . . . . . . . . . 29 435
33,375
Television — 0.2%ION Media Networks, Inc.†(4)(11) . . . . . . . . . . . . 660 509,850
Total Common Stocks(cost $317,650) . . . . . . . . . . . . . . . . . . . . . . . . 708,874
EXCHANGE-TRADED FUNDS — 0.9%iShares iBoxx $ High Yield Corporate Bond ETF . . . . 17,225 1,501,503SPDR Bloomberg Barclays High Yield Bond ETF . . . . 14,216 1,545,848
Total Exchange-Traded Funds(cost $3,041,442) . . . . . . . . . . . . . . . . . . . . . . 3,047,351
PREFERRED SECURITIES — 0.2%Diversified Banking Institutions — 0.2%
GMAC Capital Trust I FRSSeries 27.94% (3 ML+5.79%)(cost $770,413) . . . . . . . . . . . . . . . . . . . . . . . . 30,000 786,300
68
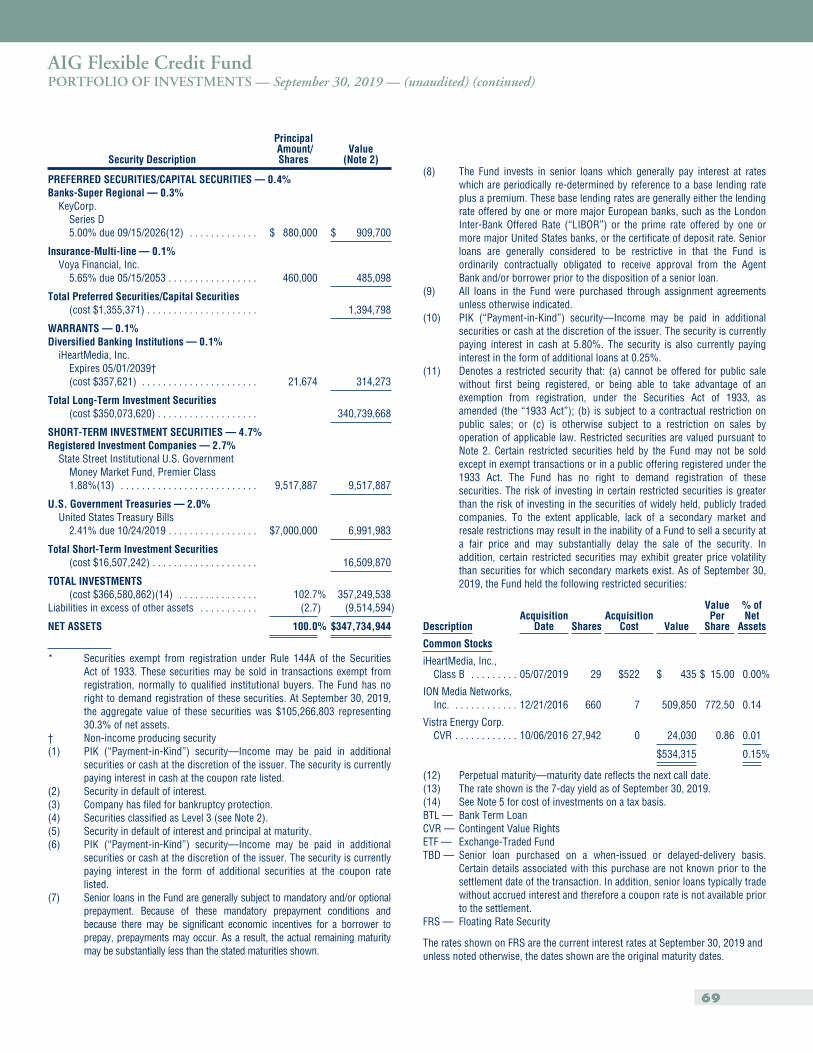
AIG Flexible Credit FundPORTFOLIO OF INVESTMENTS — September 30, 2019 — (unaudited) (continued)
Security Description
PrincipalAmount/Shares
Value(Note 2)
PREFERRED SECURITIES/CAPITAL SECURITIES — 0.4%Banks-Super Regional — 0.3%
KeyCorp.Series D5.00% due 09/15/2026(12) . . . . . . . . . . . . . $ 880,000 $ 909,700
Insurance-Multi-line — 0.1%Voya Financial, Inc.
5.65% due 05/15/2053 . . . . . . . . . . . . . . . . . 460,000 485,098
Total Preferred Securities/Capital Securities(cost $1,355,371) . . . . . . . . . . . . . . . . . . . . . 1,394,798
WARRANTS — 0.1%Diversified Banking Institutions — 0.1%
iHeartMedia, Inc.Expires 05/01/2039†(cost $357,621) . . . . . . . . . . . . . . . . . . . . . . 21,674 314,273
Total Long-Term Investment Securities(cost $350,073,620) . . . . . . . . . . . . . . . . . . . 340,739,668
SHORT-TERM INVESTMENT SECURITIES — 4.7%Registered Investment Companies — 2.7%
State Street Institutional U.S. GovernmentMoney Market Fund, Premier Class1.88%(13) . . . . . . . . . . . . . . . . . . . . . . . . . . 9,517,887 9,517,887
U.S. Government Treasuries — 2.0%United States Treasury Bills
2.41% due 10/24/2019 . . . . . . . . . . . . . . . . . $7,000,000 6,991,983
Total Short-Term Investment Securities(cost $16,507,242) . . . . . . . . . . . . . . . . . . . . 16,509,870
TOTAL INVESTMENTS(cost $366,580,862)(14) . . . . . . . . . . . . . . . 102.7% 357,249,538
Liabilities in excess of other assets . . . . . . . . . . . (2.7) (9,514,594)
NET ASSETS 100.0% $347,734,944
* Securities exempt from registration under Rule 144A of the SecuritiesAct of 1933. These securities may be sold in transactions exempt fromregistration, normally to qualified institutional buyers. The Fund has noright to demand registration of these securities. At September 30, 2019,the aggregate value of these securities was $105,266,803 representing30.3% of net assets.
† Non-income producing security(1) PIK (“Payment-in-Kind”) security—Income may be paid in additional
securities or cash at the discretion of the issuer. The security is currentlypaying interest in cash at the coupon rate listed.
(2) Security in default of interest.(3) Company has filed for bankruptcy protection.(4) Securities classified as Level 3 (see Note 2).(5) Security in default of interest and principal at maturity.(6) PIK (“Payment-in-Kind”) security—Income may be paid in additional
securities or cash at the discretion of the issuer. The security is currentlypaying interest in the form of additional securities at the coupon ratelisted.
(7) Senior loans in the Fund are generally subject to mandatory and/or optionalprepayment. Because of these mandatory prepayment conditions andbecause there may be significant economic incentives for a borrower toprepay, prepayments may occur. As a result, the actual remaining maturitymay be substantially less than the stated maturities shown.
(8) The Fund invests in senior loans which generally pay interest at rateswhich are periodically re-determined by reference to a base lending rateplus a premium. These base lending rates are generally either the lendingrate offered by one or more major European banks, such as the LondonInter-Bank Offered Rate (“LIBOR”) or the prime rate offered by one ormore major United States banks, or the certificate of deposit rate. Seniorloans are generally considered to be restrictive in that the Fund isordinarily contractually obligated to receive approval from the AgentBank and/or borrower prior to the disposition of a senior loan.
(9) All loans in the Fund were purchased through assignment agreementsunless otherwise indicated.
(10) PIK (“Payment-in-Kind”) security—Income may be paid in additionalsecurities or cash at the discretion of the issuer. The security is currentlypaying interest in cash at 5.80%. The security is also currently payinginterest in the form of additional loans at 0.25%.
(11) Denotes a restricted security that: (a) cannot be offered for public salewithout first being registered, or being able to take advantage of anexemption from registration, under the Securities Act of 1933, asamended (the “1933 Act”); (b) is subject to a contractual restriction onpublic sales; or (c) is otherwise subject to a restriction on sales byoperation of applicable law. Restricted securities are valued pursuant toNote 2. Certain restricted securities held by the Fund may not be soldexcept in exempt transactions or in a public offering registered under the1933 Act. The Fund has no right to demand registration of thesesecurities. The risk of investing in certain restricted securities is greaterthan the risk of investing in the securities of widely held, publicly tradedcompanies. To the extent applicable, lack of a secondary market andresale restrictions may result in the inability of a Fund to sell a security ata fair price and may substantially delay the sale of the security. Inaddition, certain restricted securities may exhibit greater price volatilitythan securities for which secondary markets exist. As of September 30,2019, the Fund held the following restricted securities:
DescriptionAcquisition
Date SharesAcquisition
Cost Value
ValuePer
Share
% ofNet
Assets
Common Stocks
iHeartMedia, Inc.,Class B . . . . . . . . . 05/07/2019 29 $522 $ 435 $ 15.00 0.00%
ION Media Networks,Inc. . . . . . . . . . . . . 12/21/2016 660 7 509,850 772.50 0.14
Vistra Energy Corp.CVR . . . . . . . . . . . . 10/06/2016 27,942 0 24,030 0.86 0.01
$534,315 0.15%
(12) Perpetual maturity—maturity date reflects the next call date.(13) The rate shown is the 7-day yield as of September 30, 2019.(14) See Note 5 for cost of investments on a tax basis.BTL — Bank Term LoanCVR — Contingent Value RightsETF — Exchange-Traded FundTBD — Senior loan purchased on a when-issued or delayed-delivery basis.
Certain details associated with this purchase are not known prior to thesettlement date of the transaction. In addition, senior loans typically tradewithout accrued interest and therefore a coupon rate is not available priorto the settlement.
FRS — Floating Rate Security
The rates shown on FRS are the current interest rates at September 30, 2019 andunless noted otherwise, the dates shown are the original maturity dates.
69
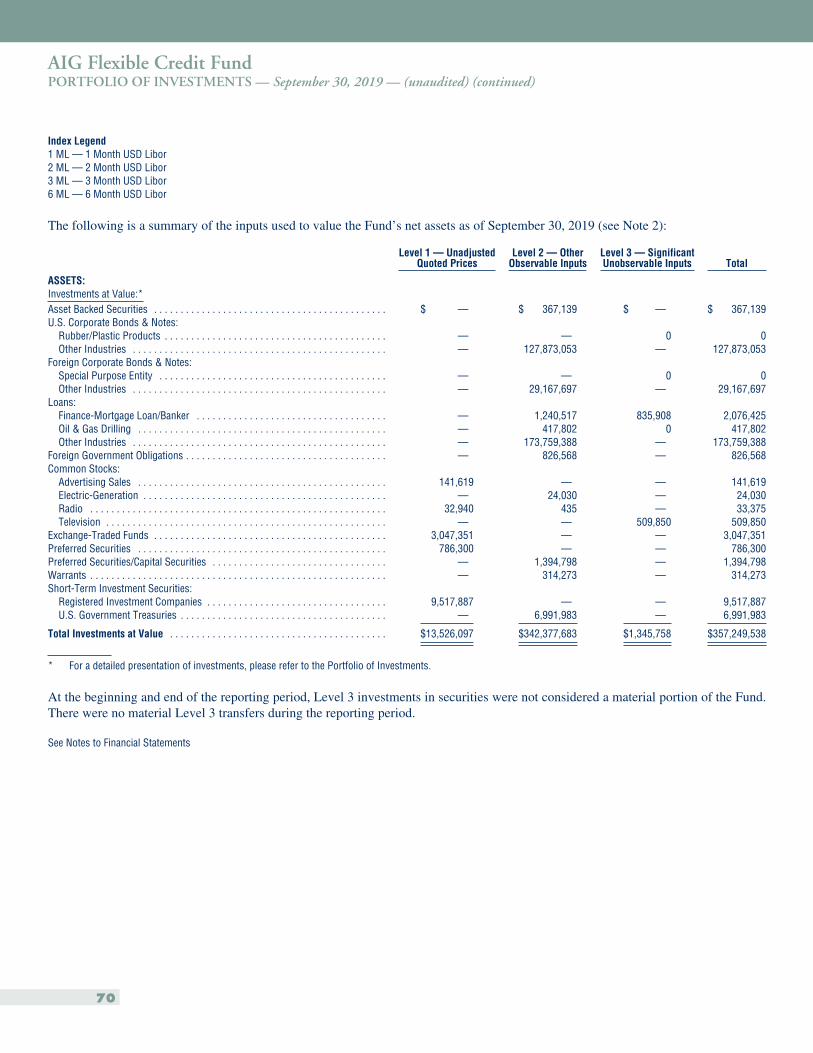
AIG Flexible Credit FundPORTFOLIO OF INVESTMENTS — September 30, 2019 — (unaudited) (continued)
Index Legend1 ML — 1 Month USD Libor2 ML — 2 Month USD Libor3 ML — 3 Month USD Libor6 ML — 6 Month USD Libor
The following is a summary of the inputs used to value the Fund’s net assets as of September 30, 2019 (see Note 2):
Level 1 — UnadjustedQuoted Prices
Level 2 — OtherObservable Inputs
Level 3 — SignificantUnobservable Inputs Total
ASSETS:Investments at Value:*Asset Backed Securities . . . . . . . . . . . . . . . . . . . . . . . . . . . . . . . . . . . . . . . . . . . . $ — $ 367,139 $ — $ 367,139U.S. Corporate Bonds & Notes:
Rubber/Plastic Products . . . . . . . . . . . . . . . . . . . . . . . . . . . . . . . . . . . . . . . . . . — — 0 0Other Industries . . . . . . . . . . . . . . . . . . . . . . . . . . . . . . . . . . . . . . . . . . . . . . . . — 127,873,053 — 127,873,053
Foreign Corporate Bonds & Notes:Special Purpose Entity . . . . . . . . . . . . . . . . . . . . . . . . . . . . . . . . . . . . . . . . . . . — — 0 0Other Industries . . . . . . . . . . . . . . . . . . . . . . . . . . . . . . . . . . . . . . . . . . . . . . . . — 29,167,697 — 29,167,697
Loans:Finance-Mortgage Loan/Banker . . . . . . . . . . . . . . . . . . . . . . . . . . . . . . . . . . . . — 1,240,517 835,908 2,076,425Oil & Gas Drilling . . . . . . . . . . . . . . . . . . . . . . . . . . . . . . . . . . . . . . . . . . . . . . . — 417,802 0 417,802Other Industries . . . . . . . . . . . . . . . . . . . . . . . . . . . . . . . . . . . . . . . . . . . . . . . . — 173,759,388 — 173,759,388
Foreign Government Obligations . . . . . . . . . . . . . . . . . . . . . . . . . . . . . . . . . . . . . . — 826,568 — 826,568Common Stocks:
Advertising Sales . . . . . . . . . . . . . . . . . . . . . . . . . . . . . . . . . . . . . . . . . . . . . . . 141,619 — — 141,619Electric-Generation . . . . . . . . . . . . . . . . . . . . . . . . . . . . . . . . . . . . . . . . . . . . . . — 24,030 — 24,030Radio . . . . . . . . . . . . . . . . . . . . . . . . . . . . . . . . . . . . . . . . . . . . . . . . . . . . . . . . 32,940 435 — 33,375Television . . . . . . . . . . . . . . . . . . . . . . . . . . . . . . . . . . . . . . . . . . . . . . . . . . . . . — — 509,850 509,850
Exchange-Traded Funds . . . . . . . . . . . . . . . . . . . . . . . . . . . . . . . . . . . . . . . . . . . . 3,047,351 — — 3,047,351Preferred Securities . . . . . . . . . . . . . . . . . . . . . . . . . . . . . . . . . . . . . . . . . . . . . . . 786,300 — — 786,300Preferred Securities/Capital Securities . . . . . . . . . . . . . . . . . . . . . . . . . . . . . . . . . — 1,394,798 — 1,394,798Warrants . . . . . . . . . . . . . . . . . . . . . . . . . . . . . . . . . . . . . . . . . . . . . . . . . . . . . . . . — 314,273 — 314,273Short-Term Investment Securities:
Registered Investment Companies . . . . . . . . . . . . . . . . . . . . . . . . . . . . . . . . . . 9,517,887 — — 9,517,887U.S. Government Treasuries . . . . . . . . . . . . . . . . . . . . . . . . . . . . . . . . . . . . . . . — 6,991,983 — 6,991,983
Total Investments at Value . . . . . . . . . . . . . . . . . . . . . . . . . . . . . . . . . . . . . . . . . $13,526,097 $342,377,683 $1,345,758 $357,249,538
* For a detailed presentation of investments, please refer to the Portfolio of Investments.
At the beginning and end of the reporting period, Level 3 investments in securities were not considered a material portion of the Fund.There were no material Level 3 transfers during the reporting period.
See Notes to Financial Statements
70
SunAmerica Income FundsNOTES TO FINANCIAL STATEMENTS — September 30, 2019 — (unaudited)
Note 1. Organization
The SunAmerica Income Funds (the “Trust”) is a diversified open-end management investment company organized as aMassachusetts business trust. The Trust currently consists of three different series (each, a “Fund” and collectively, the “Funds”).Each Fund is a separate series of the Trust with distinct investment objectives and/or strategies. Each Fund is managed bySunAmerica Asset Management, LLC (the “Adviser” or “SunAmerica”), an indirect wholly-owned subsidiary of AmericanInternational Group, Inc. (“AIG”). An investor may invest in one or more of the following Funds: AIG U.S. GovernmentSecurities Fund (“U.S. Government Securities Fund”), AIG Strategic Bond Fund (“Strategic Bond Fund”), and AIG FlexibleCredit Fund (“Flexible Credit Fund”). The Funds are considered to be separate entities for financial and tax reporting purposes.
The investment goals and principal investment techniques for each of the Funds are as follows:
U.S. Government Securities Fund seeks high current income consistent with relative safety of capital by the active trading ofU.S. Government securities, without regard to the maturities of such securities. Under normal market conditions, at least 80% ofthe Fund’s net assets plus any borrowing for investment purposes will be invested in such securities.
Strategic Bond Fund seeks a high level of total return by the active trading of a broad range of bonds, including both investmentgrade and non-investment grade U.S. and foreign bonds (which may include “junk bonds”), U.S. and foreign government andagency obligations, and mortgage-backed securities, without regard to the maturities of such securities. Under normal marketconditions, at least 80% of the Fund’s net assets plus any borrowing for investment purposes will be invested in bonds.
Flexible Credit Fund seeks a high level of total return by the active trading in credit instruments. Under normal circumstances,at least 80% of the Fund’s net assets, plus any borrowings for investment purposes, will be invested in credit instruments andderivative instruments and exchange-traded funds (“ETFs”) that are linked to, or provide investment exposure to, creditinstruments. The Fund considers a credit instrument to be any debt instrument or instrument with debt-like characteristics,including but not limited to, corporate and sovereign bonds, secured floating rate loans and other institutionally traded securedfloating rate debt obligations (“Loans”), and securitized instruments, which are securities backed by pools of assets such asmortgages, loans, or other receivables. The credit instruments in which the Fund intends to primarily invest are U.S. and non-U.S. below investment grade, high yield bonds (commonly referred to as “junk bonds”) and Loans.
Each Fund offers multiple classes of shares. The classes within each Fund are presented in the Statements of Assets andLiabilities. The cost structure for each class is as follows:
Class A shares are offered at net asset value per share plus an initial sales charge. Additionally, purchases of Class A shares inamounts of $1,000,000 or more will be purchased at net asset value but will be subject to a contingent deferred sales charge onredemptions made within two years of purchase.
Class B shares are offered without an initial sales charge, although a declining contingent deferred sales charge may be imposedon redemptions made within six years of purchase. Class B shares convert automatically to Class A shares on the first businessday of the month following the eighth anniversary of the issuance of such Class B shares and at such time will be subject to thelower distribution fee applicable to Class A shares.
Class C shares are offered at net asset value per share without an initial sales charge and may be subject to a contingent deferredsales charge on redemptions made within 12 months of purchase. Class C shares convert automatically to Class A sharesapproximately ten years after purchase and at such time will be subject to the lower distribution fee applicable to Class A shares.
Class W shares are offered at net asset value per share. The class is offered exclusively through advisory fee-based programssponsored by certain financial intermediaries and other programs. Class W shares of the Flexible Credit Fund and the StrategicBond Fund commenced operations effective October 1, 2014 and January 29, 2015, respectively.
Each class of shares bears the same voting, dividend, liquidation and other rights and conditions except as may otherwise beprovided in the Trust’s registration statement. Class A, Class B and Class C shares each makes distribution and account
71
SunAmerica Income FundsNOTES TO FINANCIAL STATEMENTS — September 30, 2019 — (unaudited) (continued)
maintenance and service fee payments under the distribution plan pursuant to Rule 12b-1 under the Investment Company Act of1940, as amended (the “1940 Act”), with Class B and Class C shares being subject to higher distribution fee rates. Class Wshares have not adopted 12b-1 Plans and make no payments thereunder, however, Class W shares pay a service fee to the Funds’distributor for administrative and shareholder services.
Indemnifications: The Trust’s organizational documents provide current and former officers and trustees with a limitedindemnification against liabilities arising out of the performance of their duties to the Trust. In addition, pursuant toIndemnification Agreements between the Trust and each of the current trustees who is not an “interested person,” as defined inSection 2(a)(19) of the 1940 Act, of the Trust (collectively, the “Disinterested Trustees”), the Trust provides the DisinterestedTrustees with a limited indemnification against liabilities arising out of the performance of their duties to the Trust, whether suchliabilities are asserted during or after their service as trustees. In addition, in the normal course of business, the Trust enters intocontracts that contain the obligation to indemnify others. The Trust’s maximum exposure under these arrangements is unknown.Currently, however, the Trust expects the risk of loss to be remote.
Note 2. Significant Accounting Policies
The preparation of financial statements in accordance with U.S. generally accepted accounting principles (“GAAP”) requiresmanagement to make estimates and assumptions that affect the reported amounts and disclosures in the financial statements.Actual results could differ from those estimates and those differences could be significant. The Funds are considered investmentcompanies under GAAP and follow the accounting and reporting guidance applicable to investment companies. The following isa summary of significant accounting policies consistently followed by the Trust in the preparation of its financial statements:
Security Valuation: In accordance with the authoritative guidance on fair value measurements and disclosures under GAAP, theFunds disclose the fair value of their investments in a hierarchy that prioritizes the inputs to valuation techniques used to measurethe fair value. In accordance with GAAP, fair value is defined as the price that the Funds would receive upon selling an asset ortransferring a liability in a timely transaction to an independent third party in the principal or most advantageous market. GAAPestablishes a three-tier hierarchy to provide more transparency around the inputs used to measure fair value and to establishclassification of fair value measurements for disclosure purposes. Inputs refer broadly to the assumptions that market participantswould use in pricing the asset or liability, including assumptions about risk. Inputs may be observable or unobservable.Observable inputs are inputs that reflect the assumptions market participants would use in pricing the asset or liability developedbased on market data obtained from sources independent of the reporting entity. Unobservable inputs are inputs that reflect thereporting entity’s own assumptions about the assumptions market participants would use in pricing the asset or liabilitydeveloped based on the best information available in the circumstances. The three-tiers are as follows:
Level 1 — Unadjusted quoted prices in active markets for identical securitiesLevel 2 — Other significant observable inputs (including quoted prices for similar securities, interest rates, prepayment speeds,credit risk, referenced indices, quoted prices in inactive markets, adjusted quoted prices in active markets, adjusted quoted priceson foreign equity securities that were adjusted in accordance with pricing procedures approved by the Board of Trustees (“theBoard”), etc.)Level 3 — Significant unobservable inputs (includes inputs that reflect the Funds’ own assumptions about the assumptionsmarket participants would use in pricing the security, developed based on the best information available under the circumstances)
Changes in valuation techniques may result in transfers in or out of an investment’s assigned Level within the hierarchy. Themethodology used for valuing investments is not necessarily an indication of the risk associated with investing in thoseinvestments and the determination of the significance of a particular input to the fair value measurement in its entirety requiresjudgment and consideration of factors specific to each security.
The availability of observable inputs can vary from security to security and is affected by a wide variety of factors, including, forexample, the type of security, whether the security is recently issued and not yet established in the marketplace, the liquidity ofmarkets, and other characteristics particular to the security. To the extent that valuation is based on models or inputs that are lessobservable or unobservable in the market, the determination of fair value requires more judgment. Accordingly, the degree ofjudgment exercised in determining fair value is greatest for instruments categorized in Level 3.
72
SunAmerica Income FundsNOTES TO FINANCIAL STATEMENTS — September 30, 2019 — (unaudited) (continued)
The summary of each Fund’s asset and liabilities classified in the fair value hierarchy as of September 30, 2019 is reported on aschedule at the end of each Fund’s Portfolio of Investments.
Stocks are generally valued based upon closing sales prices reported on recognized securities exchanges on which the securitiesare principally traded and are generally categorized as Level 1. Stocks listed on the NASDAQ are valued using the NASDAQOfficial Closing Price (“NOCP”). Generally, the NOCP will be the last sale price unless the reported trade for the stock is outsidethe range of the bid/ask price. In such cases, the NOCP will be normalized to the nearer of the bid or ask price. For listedsecurities having no sales reported and for unlisted securities, such securities will be valued based upon the last reported bidprice.
As of the close of regular trading on the New York Stock Exchange (“NYSE”), securities traded primarily on security exchangesoutside the United States are valued at the last sale price on such exchanges on the day of valuation, or if there is no sale on theday of valuation, at the last-reported bid price. If a security’s price is available from more than one exchange, the Funds use theexchange that is the primary market for the security. Such securities are generally categorized as Level 1. However, dependingon the foreign market, closing prices may be up to 15 hours old when they are used to price a Fund’s shares, and a Fund maydetermine that certain closing prices do not reflect the fair value of the security. This determination will be based on review of anumber of factors, including developments in foreign markets, the performance of U.S. securities markets, and the performanceof instruments trading in U.S. markets that represent foreign securities and baskets of foreign securities. If a Fund determines thatclosing prices do not reflect the fair value of the securities, the Fund will adjust the previous closing prices in accordance withpricing procedures approved by the Board to reflect what it believes to be the fair value of the securities as of the close of regulartrading on the NYSE. The Funds may also fair value securities in other situations, for example, when a particular foreign marketis closed but a Fund is open. For foreign equity securities and foreign equity futures contracts, the Funds use an outside pricingservice to provide it with closing market prices and information used for adjusting those prices and when so adjusted, suchsecurities and futures are generally categorized as Level 2.
Bonds, debentures and other debt securities are valued at evaluated bid prices obtained for the day of valuation from a Board-approved pricing service, and are generally categorized as Level 2. The pricing service may use valuation models or matrixpricing which considers information with respect to comparable bond and note transactions, quotations from bond dealers, or byreference to other securities that are considered comparable in such characteristics as rating, interest rate, and maturity date,option adjusted spread models, prepayments projections, interest rate spreads, and yield curves to determine current value. If aprice is unavailable from a Board-approved pricing service, the securities may be priced at the mean of two independent quotesobtained from brokers.
Senior floating rate loans (“Loans”) are valued at the average of available bids in the market for such Loans, as provided by aBoard-approved loan pricing service, and are generally categorized as Level 2.
Investments in registered investment companies that do not trade on an exchange are valued at the end of day net asset value pershare. Investments in registered investment companies that trade on an exchange are valued at the last sales price or officialclosing price as of the close of the customary trading session on the exchange where the security is principally traded.Investments in registered investment companies are generally categorized as Level 1.
Forward foreign currency contracts (“forward contracts”) are valued at the 4:00 p.m. Eastern Time forward rate and are generallycategorized as Level 2.
Other securities are valued on the basis of last sale or bid price (if a last sale price is not available) which is, in the opinion of theAdviser, the broadest and most representative market, that may be either a securities exchange or over-the-counter market andare generally categorized as Level 1 or Level 2.
The Board is responsible for the share valuation process and has adopted policies and procedures (the “PRC Procedures”) forvaluing the securities and other assets held by the Funds, including procedures for the fair valuation of securities and other assetsfor which market quotations are not readily available or are unreliable. The PRC Procedures provide for the establishment of apricing review committee, which is responsible for, among other things, making certain determinations in connection with the
73
SunAmerica Income FundsNOTES TO FINANCIAL STATEMENTS — September 30, 2019 — (unaudited) (continued)
Trust’s fair valuation procedures. Securities for which market quotations are not readily available or the values of which may besignificantly impacted by the occurrence of developments or significant events are generally categorized as Level 3. There is nosingle standard for making fair value determinations, which may result in prices that vary from those of other funds.
Derivative Instruments:
Forward Foreign Currency Contracts: During the period, the Strategic Bond Fund used forward contracts to attempt to protectsecurities and related receivables and payables against changes in future foreign exchange rates.
A forward contract is an agreement between two parties to buy or sell currency at a set price on a future date. The market valueof the contract will fluctuate with changes in currency exchange rates. The contract is marked-to-market daily using the forwardrate and the cumulative change in market value is recorded by a Fund as unrealized appreciation or depreciation. On thesettlement date, a Fund records either realized gains or losses equal to the difference between the value of the contract at the timeit was opened and the value at the time it was closed.
Risks to the Funds of entering into forward contracts include counterparty risk, market risk and illiquidity risk. Counterparty riskarises upon entering into these contracts from the potential inability of counterparties to meet the terms of their contracts. If thecounterparty defaults, a Fund’s loss will generally consist of the net amount of contractual payments that the Fund has not yetreceived though the Fund’s maximum exposure due to counterparty risk could extend to the notional amount of the contract.Market risk is the risk that the value of the forward contract will depreciate due to unfavorable changes in the exchange rates.These contracts may involve market risk in excess of the unrealized appreciation or depreciation reported on the Statements ofAssets and Liabilities. Illiquidity risk arises because the secondary market for forwards may have less liquidity relative tomarkets for other securities. Currency transactions are also subject to risks different from those of other portfolio transactions.Because currency control is of great importance to the issuing governments and influences economic planning and policy,purchases and sales of currency and related instruments can be adversely affected by government exchange controls, limitationsor restrictions on repatriation of currency, and manipulations or exchange restrictions imposed by governments.
Forward foreign currency contracts outstanding at the end of the period, if any, are reported on a schedule at the end of eachFund’s Portfolio of Investments.
Master Agreements: Certain Funds that hold derivative instruments and other financial instruments may be a party to ISDA(International Swaps and Derivatives Association, Inc.) Master Agreements or similar agreements (“Master Agreements”) withcertain counterparties that govern certain instruments. Master Agreements may contain provisions regarding, among other things,the parties’ general obligations, representations, agreements, collateral requirements, events of default and early termination.Collateral can be in the form of cash or securities as agreed to by the Fund and applicable counterparty. Collateral requirementsare generally determined based on a Fund’s net position with each counterparty. Master Agreements may also include certainprovisions that require a Fund to post additional collateral upon the occurrence of certain events, such as when a Fund’s netassets fall below a specified level. In addition, Master Agreements typically specify certain standard termination events, such asfailure of a party to pay or deliver, credit support defaults and other events of default. Termination events applicable to a Fundmay also occur upon a decline in the Fund’s net assets below a specified level over a certain period of time. Additionaltermination events applicable to counterparties may occur upon a decline in a counterparty’s long-term and short-term creditratings below a specified level, or upon a decline in the ratings of a counterparty’s credit support provider. Upon the occurrenceof a termination event, the other party may elect to terminate early and cause settlement of all instruments outstanding pursuantto a particular Master Agreement, including the payment of any losses and costs resulting from such early termination, asreasonably determined by the terminating party. Any decision by one or more of a Fund’s counterparties to elect earlytermination could cause a Fund to accelerate the payment of liabilities, which settlement amounts could be in excess of theamount of assets that are already posted as collateral. Typically, the Master Agreement will permit a single net payment in theevent of default. Note, however, that bankruptcy or insolvency laws of a particular jurisdiction may impose restrictions on orprohibitions against the right of offset in bankruptcy, insolvency or other events. As a result, the early termination with respect toderivative instruments subject to Master Agreements that are in a net liability position could be material to a Fund’s financialstatements. The Funds do not offset derivative assets and derivative liabilities that are subject to netting arrangements in theStatements of Asset and Liabilities.
74

SunAmerica Income FundsNOTES TO FINANCIAL STATEMENTS — September 30, 2019 — (unaudited) (continued)
The following tables represent the value of derivatives held as of September 30, 2019, by their primary underlying risk exposure.The derivative contracts held during the period are not accounted for as hedging instruments under GAAP. For a detailedpresentation of derivatives held as of September 30, 2019, please refer to the schedule at the end of each Fund’s Portfolio ofInvestments.
Asset DerivativesLiability
DerivativesForeignForward
ExchangeContracts
ForeignForward
ExchangeContracts
Fund
ForeignExchange
Contracts(1)
ForeignExchange
Contracts(2)
Strategic Bond . . . . . . . . . . . . . . . . . . . . . . . . . . . . . . . . . . . . . . . . . . . . . . . . . . . . . . . . . . . . . . . . . . . . . . . . $405,644 $30,858
Statement of Assets and Liabilities Location:(1) Unrealized appreciation on forward foreign currency contracts(2) Unrealized depreciation on forward foreign currency contracts
RealizedGain (Loss) on
DerivativesRecognized inStatement ofOperations
Change inUnrealized
Appreciation(Depreciation) on
DerivativesRecognized inStatement ofOperations
ForeignForward
ExchangeContracts
ForeignForward
ExchangeContracts
Fund
ForeignExchange
Contracts(1)
ForeignExchange
Contracts(2)
Strategic Bond . . . . . . . . . . . . . . . . . . . . . . . . . . . . . . . . . . . . . . . . . . . . . . . . . . . . . . . . . . . . . . . . . . . . . . $605,328 $200,692
Statement of Operations Location:(1) Net realized gain (loss) on forward contracts(2) Change in unrealized appreciation (depreciation) on forward contracts
The following table represents the average monthly balances of derivatives held during the six months ended September 30, 2019:
Average AmountOutstanding
During the Year
Fund
ForeignExchange
Contracts(1)
Strategic Bond . . . . . . . . . . . . . . . . . . . . . . . . . . . . . . . . . . . . . . . . . . . . . . . . . . . . . . . . . . . . . . . . . . . . . . . . . . . . . . . . . . . $18,455,047
(1) Amounts represent notional amounts in US dollars.
The following tables set forth the Funds’ derivative assets and liabilities by counterparty, net of amounts available for offsetunder Master Agreements and net of the related collateral pledged/(received) as of September 30, 2019. The repurchaseagreements held by the Funds as of September 30, 2019, are also subject to Master Agreements but are not included in thefollowing tables. See the Portfolio of Investments of each Fund and the Notes to the Financial Statements for more informationabout the Funds’ holdings in repurchase agreements.
75
SunAmerica Income FundsNOTES TO FINANCIAL STATEMENTS — September 30, 2019 — (unaudited) (continued)
Strategic BondDerivative Assets(1) Derivative Liabilities(1)
Counterparty
ForwardForeignCurrencyContracts
OTCSwaps
OptionsPurchased Total
ForwardForeignCurrencyContracts
OTCSwaps
OptionsWritten Total
NetDerivative
Assets(Liabilities)
CollateralPledged/
(Received)(2) Net Amount(3)
JPMorgan Chase Bank N.A . . . . . $405,644 $ — $ — $405,644 $30,858 $ — $ — $30,858 $374,786 $ — $374,786
(1) Gross amounts of recognized assets and liabilities not offset in the Statement of Assets and Liabilities.(2) For each respective counterparty, collateral pledged or (received) is limited to an amount not to exceed 100% of the derivative asset/liability in the table above.(3) Net amount represents the net amount due (to)/from counterparty in the event of a default based on the contractual set-off rights under the agreement.
Mortgage-Backed Dollar Rolls: Certain Funds may enter into dollar rolls using “to be announced” (“TBA”) mortgage-backedsecurities (“TBA Rolls”). TBA Roll transactions involve the sale of mortgage or other asset backed securities with thecommitment to purchase substantially similar securities on a specified future date. The Funds’ policy is to record the componentsof TBA Rolls as purchase/sale transactions. Any difference between the purchase and sale price is recorded as a realized gain orloss on the date the transaction is entered into. TBA Roll transactions involve the risk that the market value of the securities heldby a Fund may decline below the price of the securities that the Fund has sold but is obligated to repurchase under the agreement.In the event that the buyer of securities in a TBA Roll transaction files bankruptcy or becomes insolvent, a Fund’s use of theproceeds from the sale of the securities may be restricted pending a determination by the other party, or its trustee or receiver,whether to enforce the Fund’s obligation to repurchase the securities. Mortgage-Backed Dollar Rolls outstanding at the end of theperiod, if any, are included in investments purchased/sold on an extended settlement basis in the Statement of Assets andLiabilities.
When-Issued Securities and Forward Commitments: Certain Funds may purchase or sell when-issued securities (includingTBA securities) that have been authorized, but not yet issued in the market. In addition, a Fund may purchase or sell securities ona forward commitment basis. A forward commitment involves entering into a contract to purchase or sell securities, typically onan extended settlement basis, for a fixed price at a future date. The Funds may engage in when-issued or forward commitmenttransactions in order to secure what is considered to be an advantageous price and yield at the time of entering into theobligation. The purchase of securities on a when-issued or forward commitment basis involves a risk of loss if the value of thesecurity to be purchased declines before the settlement date. Conversely, the sale of securities on a when-issued or forwardcommitment basis involves the risk that the value of the securities sold may increase before the settlement date. Securitiespurchased or sold on a when-issued or forward commitment basis outstanding at the end of the period, if any, are included ininvestments purchased/sold on an extended settlement basis in the Statement of Assets and Liabilities.
Loans: The Fund invests in senior loans which generally consist of direct debt obligations of companies (collectively,“Borrowers”), primarily U.S. companies and their affiliates, undertaken to finance the growth of the Borrower’s businessinternally and externally, or to finance a capital restructuring. Transactions in senior loans may settle on a delayed basis.Unsettled loans at the end of the period, if any, are included in investments purchased/sold on an extended settlement basis in theStatement of Assets and Liabilities.
Stripped Mortgage-Backed Securities: Stripped Mortgage-Backed Securities (“SMBS”) are multiple-class mortgage-backedsecurities. SMBS are often structured with two classes that receive different proportions of the interest and principal distributionson a pool of mortgage assets. SMBS have greater market volatility than other types of U.S. government securities in which aFund invests. A common type of SMBS has one class receiving some of the interest and all or most of the principal (the“principal only” class) from the mortgage pool, while the other class will receive all or most of the interest (the “interest only”class). The yield to maturity on an interest only class is extremely sensitive not only to changes in prevailing interest rates, butalso to the rate of principal payments, including principal prepayments, on the underlying pool of mortgage assets, and a rapidrate of principal payment may have a material adverse effect on a Fund’s yield.
Inflation-Indexed Bonds: Certain Funds may purchase inflation-indexed bonds. Inflation-indexed bonds are fixed incomesecurities whose principal value is adjusted periodically according to the rate of inflation. Two structures are common. The U.S.Treasury and certain other issuers use a structure that reflects inflation in the principal value of the bond. Other issuers pay out anyinflation related accruals as part of a semiannual coupon. The value of inflation-indexed bonds is expected to change in
76
SunAmerica Income FundsNOTES TO FINANCIAL STATEMENTS — September 30, 2019 — (unaudited) (continued)
response to changes in real interest rates. Real interest rates, in turn, are tied to the relationship between nominal interest rates(i.e., stated interest rates) and the rate of inflation. Therefore, if the rate of inflation rises at a faster rate than nominal interestrates, real interest rates (i.e., nominal interest rates minus inflation) might decline, leading to an increase in value of inflation-indexed bonds. In contrast, if nominal interest rates increase at a faster rate than inflation, real interest rates might rise, leading toa decrease in value of inflation-indexed bonds. There can be no assurance, however, that the value of inflation-indexed bondswill be directly correlated to changes in nominal interest rates, and short-term increases in inflation may lead to a decline in theirvalue. Coupon payments received from inflation-indexed bonds are recorded in the Statements of Operations as interest income.In addition, any increase or decrease in the principal amount of an inflation-indexed bond will be recorded in the Statements ofOperations as an increase or decrease to interest income, even though principal is not paid until maturity.
Repurchase Agreements: The Funds, along with other affiliated registered investment companies, pursuant to proceduresadopted by the Board and applicable guidance from the Securities and Exchange Commission (“SEC”), may transfer uninvestedcash balances into a single joint account, the daily aggregate balance of which is invested in one or more repurchase agreementscollateralized by U.S. Treasury or federal agency obligations. In a repurchase agreement, the seller of a security agrees torepurchase the security at a mutually agreed-upon time and price, which reflects the effective rate of return for the term of theagreement. For repurchase agreements and joint repurchase agreements, the Trust’s custodian takes possession of the collateralpledged for investments in such repurchase agreements (“repo” or collectively “repos”). The underlying collateral is valued dailyon a mark to market basis, plus accrued interest to ensure that the value, at the time the agreement is entered into, is equal to atleast 102% of the repurchase price, including accrued interest. In the event of default of the obligation to repurchase, a Fund hasthe right to liquidate the collateral and apply the proceeds in satisfaction of the obligation. If the seller defaults and the value ofthe collateral declines or if bankruptcy proceedings are commenced with respect to the seller of the security, realization of thecollateral by a Fund may be delayed or limited.
Securities Transactions, Investment Income, Expenses, Dividends and Distributions to Shareholders: Security transactionsare recorded on a trade date basis. Interest income is accrued daily from settlement date except when collection is not expected.Dividend income is recorded on the ex-dividend date except for certain dividends from foreign securities, which are recorded assoon as the Trust is informed after the ex-dividend date. Paydown gains and losses on mortgage and asset-backed securities arerecorded as components of interest income on the Statements of Operations. For financial statement purposes, the Fundsamortize all premiums and accrete all discounts on fixed income securities.
Realized gains and losses on the sale of investments are calculated on the identified cost basis. Funds which earn foreign income andcapital gains may be subject to foreign withholding taxes and capital gains taxes at various rates. Under applicable foreign law, awithholding of tax may be imposed on interest, dividends, and capital gains from the sale of foreign securities at various rates.
Income and expenses, other than class specific expenses, are allocated daily to each class of shares based upon the relative valueof dividend-eligible shares after adjusting for the current capital share activity of the respective class. Realized and unrealizedgains and losses are allocated daily to each class of shares based upon the relative value of outstanding shares after adjusting forthe current capital share activity of the respective class.
Expenses common to all Funds are allocated among the Funds based upon relative net assets or other appropriate allocationmethods. In all other respects, expenses are charged to each Fund as incurred on a specific identification basis.
Dividends from net investment income are accrued daily and paid monthly. Capital gain distributions, if any, are paid annually.The Funds record dividends and distributions to their shareholders on the ex-dividend date. The Funds reserve the right to declareand pay dividends less frequently than disclosed above, provided that the net realized capital gains and net investment income, ifany, are paid at least annually.
The amount of dividends and distributions from net investment income and net realized capital gains are determined in accordancewith federal income tax regulations, which may differ from GAAP. These “book/tax” differences are either considered temporary orpermanent in nature. To the extent these differences are permanent in nature, such amounts are reclassified within the capitalaccounts at fiscal year end based on their federal tax-basis treatment; temporary differences do not require reclassification. Netassets are not affected by these reclassifications.
77
SunAmerica Income FundsNOTES TO FINANCIAL STATEMENTS — September 30, 2019 — (unaudited) (continued)
Each Fund is considered a separate entity for tax purposes and intends to comply with the requirements of the Internal RevenueCode, as amended, applicable to regulated investment companies and distribute all of its taxable income, including any netcapital gains on investments, to its shareholders. Each Fund also intends to distribute sufficient net investment income and netcapital gains, if any, so that it will not be subject to excise tax on undistributed income and gains. Therefore, no federal incometax or excise tax provision is required.
The Funds recognize the tax benefits of uncertain tax positions only when the position is more likely than not to be sustained,assuming examination by tax authorities. Management has analyzed each Fund’s tax positions and concluded that no liability forunrecognized tax benefits should be recorded related to uncertain tax positions taken on returns filed for open tax years 2016 —2018 or expected to be taken in each Fund’s 2019 tax return. The Funds are not aware of any tax provisions for which it isreasonably possible that the total amounts of unrecognized tax benefits will change materially in the next twelve months. TheFunds file U.S. federal and certain state income tax returns. With few exceptions, the Funds are no longer subject to U.S. federaland state tax examinations by tax authorities for tax returns ending before 2016.
Foreign Currency Translation: The books and records of the Funds are maintained in U.S. dollars. Assets and liabilitiesdenominated in foreign currencies and commitments under forward foreign currency contracts are translated into U.S. dollarsbased on the exchange rate of such currencies against U.S. dollars on the date of valuation.
The Funds do not isolate that portion of the results of operations arising as a result of changes in the foreign exchange rates fromthe changes in the market prices of securities held at the end of the period. Similarly, the Funds do not isolate the effect ofchanges in foreign exchange rates from the changes in the market prices of portfolio securities sold during the period.
Realized foreign exchange gains and losses on other assets and liabilities and change in unrealized foreign exchange gains andlosses on other assets and liabilities located in the Statements of Operations include realized foreign exchange gains and lossesfrom currency gains or losses between the trade and the settlement dates of securities transactions, the difference between theamounts of interest, dividends and foreign withholding taxes recorded on the Funds’ books and the U.S. dollar equivalentamounts actually received or paid and changes in the unrealized foreign exchange gains and losses relating to the other assets andliabilities arising as a result of changes in the exchange rates.
New Accounting Pronouncements: In August 2018, the FASB issued Accounting Standards Update (“ASU”) No. 2018-13“Disclosure Framework — Changes to the Disclosure Requirements for Fair Value Measurement”. The ASU eliminates,modifies, and adds disclosure requirements for fair value measurements and is effective for fiscal years, and interim periodswithin those fiscal years, beginning after December 15, 2019. The ASU allows for early adoption of either the entire standard oronly the provisions that eliminate or modify the requirements. Management has elected to early adopt the provisions thateliminate disclosure requirements and is still evaluating the impact of applying the rest of the ASU.
Effective April 1, 2019, the Funds are subject to ASU 2017-08, “Premium Amortization on Purchased Callable Debt Securities”,which requires the premiums on certain purchased debt securities with non-contingent call features to be amortized to the earliestcall date. The amortization period for callable debt securities purchased at a discount will not be impacted. Adoption of the ASUhad no material impact on the Funds.
Note 3. Investment Advisory and Management Agreement, Distribution Agreement and Service Agreement
The Trust, on behalf of each Fund, has an Investment Advisory and Management Agreement (the “Agreement”) withSunAmerica. Under the Agreement, SunAmerica provides continuous supervision of a Fund’s portfolio and administers itscorporate affairs, subject to general review by the Trustees. In connection therewith, SunAmerica furnishes the Funds with officefacilities, maintains certain of the Funds’ books and records, and pays the salaries and expenses of all personnel, includingofficers of the Funds, who are employees of SunAmerica and its affiliates.
78
SunAmerica Income FundsNOTES TO FINANCIAL STATEMENTS — September 30, 2019 — (unaudited) (continued)
The Funds pay SunAmerica a monthly investment advisory and management fee calculated daily at the following annualpercentages of each Fund’s average daily net assets:
Fund AssetsManagement
Fees
U.S. Government Securities . . . . . . . . . . . . . . . . . . . . . . . . . . . . . . . . . . . . . . . . . . . . . . . . . . . . . . . . . . $0 - $200 million 0.650%> $200 million 0.620> $400 million 0.550
Strategic Bond(1) . . . . . . . . . . . . . . . . . . . . . . . . . . . . . . . . . . . . . . . . . . . . . . . . . . . . . . . . . . . . . . . . . . . $0 - $350 million 0.650> $350 million 0.600
Flexible Credit(2) . . . . . . . . . . . . . . . . . . . . . . . . . . . . . . . . . . . . . . . . . . . . . . . . . . . . . . . . . . . . . . . . . . . $0 - $200 million 0.750> $200 million 0.720> $400 million 0.550
(1) The Advisor contractually agreed to waive its advisory fee with respect to the AIG Strategic Bond Fund through July 31, 2020 so that the advisory fee payable by theFund to the Advisor under the agreement equals 0.38% on the first $350 million and 0.33% above $350 million of average daily net assets.
(2) The Advisor contractually agreed to waive its advisory fee with respect to the AIG Flexible Credit Fund through July 31, 2020 so that the advisory fee payable by theFund to the Advisor under the agreement equals 0.34% of average daily net assets.
For the six months ended September 30, 2019 the amount of investment advisory fees waived for Strategic Bond Fund andFlexible Credit Fund were $397,199 and $661,420, respectively. These amounts are reflected in the Statement of Operations.
The organizations described below act as subadvisers to the Trust and certain of its Funds pursuant to Subadvisory Agreementswith SAAMCo. Under the Subadvisory Agreements, the subadvisers manage the investment and reinvestment of the assets of therespective Funds for which they are responsible.
Each of the subadvisers is independent of SAAMCo and discharges its responsibilities subject to the policies of the Trust’sTrustees and the oversight and supervision of SAAMCo, which pays the subadvisers’ fees.
Subadviser Fund
PineBridge Investments, LLC . . . . . . . . . . . . . . . . . . . . . . . . . . . . . . . . . . . . . . . . . . . . . . . . . . . . . . . . . . . . . . . . . . . . . . Strategic BondNewfleet Asset Management, LLC . . . . . . . . . . . . . . . . . . . . . . . . . . . . . . . . . . . . . . . . . . . . . . . . . . . . . . . . . . . . . . . . . . Flexible Credit
SunAmerica has contractually agreed to waive fees and/or reimburse expenses, to the extent necessary to cap the Funds’ annual fundoperating expenses at the following percentages of each Fund’s average net assets. For the purposes of waived fees and/orreimbursed expense calculations, annual Fund operating expenses shall not include extraordinary expenses (i.e., expenses that areunusual in nature and infrequent in occurrence, such as litigation), or acquired Fund fees and expenses, brokerage commissions andother transactional expenses relating to the purchase and sale of portfolio securities, interest, taxes and governmental fees, and otherexpenses not incurred in the ordinary course of a Fund’s business. The contractual fee waivers and expense reimbursements willcontinue indefinitely, subject to termination by the Trustees, including a majority of the Disinterested Trustees.
Fund Percentage
U.S. Government Securities Class A . . . . . . . . . . . . . . . . . . . . . . . . . . . . . . . . . . . . . . . . . . . . . . . . . . . . . . . . . . . . . . . . . . . . . 0.99%U.S. Government Securities Class C . . . . . . . . . . . . . . . . . . . . . . . . . . . . . . . . . . . . . . . . . . . . . . . . . . . . . . . . . . . . . . . . . . . . 1.64Strategic Bond Class A . . . . . . . . . . . . . . . . . . . . . . . . . . . . . . . . . . . . . . . . . . . . . . . . . . . . . . . . . . . . . . . . . . . . . . . . . . . . . . . . 1.40Strategic Bond Class B . . . . . . . . . . . . . . . . . . . . . . . . . . . . . . . . . . . . . . . . . . . . . . . . . . . . . . . . . . . . . . . . . . . . . . . . . . . . . . . . 2.05Strategic Bond Class C . . . . . . . . . . . . . . . . . . . . . . . . . . . . . . . . . . . . . . . . . . . . . . . . . . . . . . . . . . . . . . . . . . . . . . . . . . . . . . . . 2.05Strategic Bond Class W . . . . . . . . . . . . . . . . . . . . . . . . . . . . . . . . . . . . . . . . . . . . . . . . . . . . . . . . . . . . . . . . . . . . . . . . . . . . . . . 1.20Flexible Credit Class A . . . . . . . . . . . . . . . . . . . . . . . . . . . . . . . . . . . . . . . . . . . . . . . . . . . . . . . . . . . . . . . . . . . . . . . . . . . . . . . . 1.45Flexible Credit Class C . . . . . . . . . . . . . . . . . . . . . . . . . . . . . . . . . . . . . . . . . . . . . . . . . . . . . . . . . . . . . . . . . . . . . . . . . . . . . . . . 2.10Flexible Credit Class W . . . . . . . . . . . . . . . . . . . . . . . . . . . . . . . . . . . . . . . . . . . . . . . . . . . . . . . . . . . . . . . . . . . . . . . . . . . . . . . 1.25
For the U.S. Government Securities Fund, any contractual waivers and/or reimbursements made by SunAmerica are subject torecoupment from the Fund within two years after the occurrence of the waivers and/or reimbursements, provided that the Fund isable to effect such payment to SunAmerica and remain in compliance with the expense limitations in effect at the time thewaivers and/or reimbursements were made.
79
SunAmerica Income FundsNOTES TO FINANCIAL STATEMENTS — September 30, 2019 — (unaudited) (continued)
For the six months ended September 30, 2019, pursuant to the contractual expense limitations in the above tables SunAmericahas waived and/or reimbursed expenses as follows:
FundOther Expenses
Reimbursed
U.S. Government Securities . . . . . . . . . . . . . . . . . . . . . . . . . . . . . . . . . . . . . . . . . . . . . . . . . . . . . . . . . . . . . . . . . . . . . . . . . $ 98,503
FundClass Specific
Expenses
U.S. Government Securities Class A . . . . . . . . . . . . . . . . . . . . . . . . . . . . . . . . . . . . . . . . . . . . . . . . . . . . . . . . . . . . . . . . . . $153,532U.S. Government Securities Class C . . . . . . . . . . . . . . . . . . . . . . . . . . . . . . . . . . . . . . . . . . . . . . . . . . . . . . . . . . . . . . . . . . 22,966
At September 30, 2019, expenses previously waived or reimbursed by SunAmerica that are subject to recoupment and expireduring the time period indicated are as follows:
Other Expenses ReimbursedFund March 31, 2020 March 31, 2021 September 30, 2021
U.S. Government Securities . . . . . . . . . . . . . . . . . . . . . . . . . . . . . . . . . . . . . . . . . . . . $ 83,370 $185,070 $ 98,503
Class Specific Expenses ReimbursedFund March 31, 2020 March 31, 2021 September 30, 2021
U.S. Government Securities Class A . . . . . . . . . . . . . . . . . . . . . . . . . . . . . . . . . . . . . $177,080 $306,262 $153,532U.S. Government Securities Class C . . . . . . . . . . . . . . . . . . . . . . . . . . . . . . . . . . . . . 19,118 33,551 22,966
The Trust, on behalf of each Fund, has entered into a Distribution Agreement with AIG Capital Services, Inc. (“ACS” or“Distributor”), an affiliate of the Adviser. Each Fund has adopted a Distribution Plan on behalf of each Class (other than Class Wshares of the Strategic Bond and Flexible Credit Funds), in accordance with the provisions of Rule 12b-1 under the 1940 Act(each, a “Plan,” and collectively, the “Plans”), hereinafter referred to as the “Class A Plan,” the “Class B Plan” and the “Class CPlan.” In adopting the Class A Plan, the Class B Plan and the Class C Plan, the Trustees determined that there was a reasonablelikelihood that each such Plan would benefit the Trust and the shareholders of the respective class. The sales charge anddistribution fees of a particular class will not be used to subsidize the sale of shares of any other class.
The Class A, Class B and Class C Plans provide that the Trust, on behalf of the respective classes, shall pay the Distributor adistribution fee at an annual rate of up to 0.10%, 0.75% and 0.75%, of average daily net assets of such Fund’s Class A, Class Band Class C shares, respectively, to compensate the Distributor and certain securities firms for providing sales and promotionalactivities for distributing that class of shares. The distribution costs for which the Distributor may be compensated include feespaid to broker-dealers that have sold Fund shares, commissions, and other expenses such as those incurred for sales literature,prospectus printing and distribution and compensation to wholesalers. It is possible that in any given year, the amount paid to theDistributor under the Class A Plan, Class B Plan or Class C Plan may exceed the Distributor’s distribution costs as describedabove. Except for Class W shares of the Strategic Bond and Flexible Credit Funds, the Plans also provide that each class ofshares of the Trust will also pay the Distributor an account maintenance fee at the annual rate of up to 0.25% of the aggregateaverage daily net assets of such class of shares to compensate the Distributor and securities firms for account maintenanceactivities. The Distributor does not receive or retain any distribution and/or account maintenance fees for any shares when theshareholder does not have a broker of record. For the six months ended September 30, 2019, ACS received fees as reflected inthe Statements of Operations based on the aforementioned rates.
The Trust, on behalf of the Strategic Bond and Flexible Credit Funds, has entered into an Administrative and ShareholderServices Agreement with ACS, pursuant to which ACS is paid an annual fee of 0.15% of average daily net assets of Class Wshares as compensation for providing additional shareholder services to Class W shareholders. The Distributor does not receiveor retain any distribution and/or account maintenance fees for any shares when the shareholder does not have a broker of record.For the six months ended September 30, 2019, ACS earned fees as reflected in the Statements of Operations based on theaforementioned rate.
80
SunAmerica Income FundsNOTES TO FINANCIAL STATEMENTS — September 30, 2019 — (unaudited) (continued)
ACS receives sales charges on each Fund’s Class A shares, portions of which are reallowed to affiliated broker-dealers and non-affiliated broker-dealers. ACS also receives the proceeds of contingent deferred sales charges paid by investors in connectionwith certain redemptions of Class A, Class B and Class C shares. ACS has advised the Funds that for the six months endedSeptember 30, 2019, the proceeds received from Class A sales (and paid out to affiliated and non-affiliated broker-dealers) andClass A, Class B and Class C redemptions were as follows:
Class A Class B Class C
FundSales
ChargesAffiliated
Broker-dealersNon-affiliatedBroker-dealers
ContingentDeferred
Sales Charges
ContingentDeferred
Sales Charges
ContingentDeferred
Sales Charges
U.S. Government Securities . . . . . . . . . . . . . . . $ 6,564 $ 722 $ 4,723 $ 44 $ — $ 14Strategic Bond . . . . . . . . . . . . . . . . . . . . . . . . . . 79,212 23,794 42,395 367 33,612 691Flexible Credit . . . . . . . . . . . . . . . . . . . . . . . . . . 178,809 18,140 127,929 2,479 — 7,853
The Trust has entered into a Service Agreement with AIG Fund Services, Inc. (“AFS”), an affiliate of the Adviser. Under theService Agreement, AFS performs certain shareholder account functions by assisting the Funds’ transfer agent, DST AssetManager Solutions, Inc. (“DST”) in connection with the services that it offers to the shareholders of the Funds. The ServiceAgreement permits the Funds to compensate AFS for services rendered, based upon an annual rate of 0.22% of average daily netassets, which is approved annually by the Trustees. For the six months ended September 30, 2019, the Funds incurred thefollowing expenses which are included in transfer agent fees and expenses in the Statements of Operations to compensate AFSpursuant to the terms of the Service Agreement:
Fund ExpensesPayable at
September 30, 2019
U.S. Government Securities Class A . . . . . . . . . . . . . . . . . . . . . . . . . . . . . . . . . . . . . . . . . . . . . . . . . . . . $138,019 $22,870U.S. Government Securities Class C . . . . . . . . . . . . . . . . . . . . . . . . . . . . . . . . . . . . . . . . . . . . . . . . . . . . 8,212 1,319Strategic Bond Class A . . . . . . . . . . . . . . . . . . . . . . . . . . . . . . . . . . . . . . . . . . . . . . . . . . . . . . . . . . . . . . . 170,371 28,156Strategic Bond Class B . . . . . . . . . . . . . . . . . . . . . . . . . . . . . . . . . . . . . . . . . . . . . . . . . . . . . . . . . . . . . . . 18,297 3,042Strategic Bond Class C . . . . . . . . . . . . . . . . . . . . . . . . . . . . . . . . . . . . . . . . . . . . . . . . . . . . . . . . . . . . . . . 57,534 9,144Strategic Bond Class W . . . . . . . . . . . . . . . . . . . . . . . . . . . . . . . . . . . . . . . . . . . . . . . . . . . . . . . . . . . . . . . 77,441 15,926Flexible Credit Class A . . . . . . . . . . . . . . . . . . . . . . . . . . . . . . . . . . . . . . . . . . . . . . . . . . . . . . . . . . . . . . . . 122,768 17,003Flexible Credit Class C . . . . . . . . . . . . . . . . . . . . . . . . . . . . . . . . . . . . . . . . . . . . . . . . . . . . . . . . . . . . . . . . 62,143 10,118Flexible Credit Class W . . . . . . . . . . . . . . . . . . . . . . . . . . . . . . . . . . . . . . . . . . . . . . . . . . . . . . . . . . . . . . . 180,647 35,053
At September 30, 2019, AIG Active Allocation Fund and AIG Multi-Asset Allocation Fund, each a series of SunAmerica Series,Inc., owned a percentage of the outstanding shares of the following Funds:
Holder
Fund
AIGActive
AllocationFund
AIGMulti-AssetAllocation
Fund
U.S. Government Securities . . . . . . . . . . . . . . . . . . . . . . . . . . . . . . . . . . . . . . . . . . . . . . . . . . . . . . . . . . . . . . . . . . . 19.00% 17.02%Strategic Bond . . . . . . . . . . . . . . . . . . . . . . . . . . . . . . . . . . . . . . . . . . . . . . . . . . . . . . . . . . . . . . . . . . . . . . . . . . . . . . 1.76 3.09Flexible Credit . . . . . . . . . . . . . . . . . . . . . . . . . . . . . . . . . . . . . . . . . . . . . . . . . . . . . . . . . . . . . . . . . . . . . . . . . . . . . . 2.17 2.62
Note 4. Purchases and Sales of Investment Securities
The cost of purchases and proceeds from sales and maturities of long-term investments during the six months endedSeptember 30, 2019 were as follows:
Fund
Purchases of InvestmentSecurities (Excluding U.S.
Government Securities)
Sales of InvestmentSecurities (Excluding U.S.
Government Securities)
Purchase of U.S.GovernmentSecurities
Sales of U.S.GovernmentSecurities
U.S. Government Securities . . . . . . . . . . . . . . . . . . . $ — $ — $36,429,795 $39,562,898Strategic Bond . . . . . . . . . . . . . . . . . . . . . . . . . . . . . . 104,085,057 107,305,501 50,040,392 33,497,811Flexible Credit . . . . . . . . . . . . . . . . . . . . . . . . . . . . . . 116,096,904 79,638,293 — —
81
SunAmerica Income FundsNOTES TO FINANCIAL STATEMENTS — September 30, 2019 — (unaudited) (continued)
Note 5. Federal Income Taxes
The following details the tax basis of distributions as well as the components of distributable earnings. The tax basis componentsof distributable earnings differ from the amounts reflected in the Statements of Assets and Liabilities by temporary book/taxdifferences primarily arising from wash sales, post October capital losses, late year ordinary losses, distributions payable,straddle loss deferrals, amortization of premium/discount and treatment of defaulted securities.
Distributable EarningsFor the year ended March 31, 2019
Tax DistributionsFor the year ended March 31, 2019
FundOrdinaryIncome
Long-termGains/Capital
Loss Carryover
UnrealizedAppreciation
(Depreciation)*OrdinaryIncome
Long-TermCapital Gains
U.S. Government Securities . . . . . . . . . . . $ 583,828 $(20,760,887) $ 3,513,319 $ 2,274,447 $ —Strategic Bond . . . . . . . . . . . . . . . . . . . . . . 265,906 (29,106,480) (3,238,024) 13,933,983 —Flexible Credit . . . . . . . . . . . . . . . . . . . . . . 1,452,890 (8,341,072) (10,540,898) 17,530,127 —
* Unrealized appreciation (depreciation) includes amounts for derivatives and other assets and liabilities denominated in foreign currency.
As of March 31, 2019, for Federal income tax purposes, the Funds indicated below have capital loss carryforwards which areavailable to offset future capital gains, if any:
UnlimitedFund ST LT
U.S. Government Securities . . . . . . . . . . . . . . . . . . . . . . . . . . . . . . . . . . . . . . . . . . . . . . . . . . . . . . . . . . . . $13,869,489 $ 6,891,398Strategic Bond . . . . . . . . . . . . . . . . . . . . . . . . . . . . . . . . . . . . . . . . . . . . . . . . . . . . . . . . . . . . . . . . . . . . . . . 7,290,177 21,816,303Flexible Credit . . . . . . . . . . . . . . . . . . . . . . . . . . . . . . . . . . . . . . . . . . . . . . . . . . . . . . . . . . . . . . . . . . . . . . . . 316,999 8,024,073
Under the current law, capital losses realized after October 31 and late year ordinary losses may be deferred and treated asoccurring on the first day of the following year. For the fiscal year ended March 31, 2019, the Funds elected to defer late yearordinary losses and post October capital losses as follows:
Fund
DeferredLate Year
Ordinary Loss
DeferredPost-OctoberShort-TermCapital Loss
DeferredPost-OctoberLong-Term
Capital Loss
U.S. Government Securities . . . . . . . . . . . . . . . . . . . . . . . . . . . . . . . . . . . . . . . . . . . . . . . . . . . $— $ — $ 158,358Strategic Bond . . . . . . . . . . . . . . . . . . . . . . . . . . . . . . . . . . . . . . . . . . . . . . . . . . . . . . . . . . . . . . — 937,916 2,311,945Flexible Credit . . . . . . . . . . . . . . . . . . . . . . . . . . . . . . . . . . . . . . . . . . . . . . . . . . . . . . . . . . . . . . 778 1,038,999 1,764,229
At September 30, 2019, the amounts of aggregate unrealized gain (loss) and the cost of investment securities for federal taxpurposes, including short-term securities and repurchase agreements, were as follows:
Fund
AggregateUnrealized
Gain
AggregateUnrealized
Loss
UnrealizedGain/(Loss)
NetCost of
Investments
U.S. Government Securities . . . . . . . . . . . . . . . . . . . . . . . . . . . . . . . . . . . $6,828,006 $ (625,510) $ 6,202,496 $127,248,635Strategic Bond . . . . . . . . . . . . . . . . . . . . . . . . . . . . . . . . . . . . . . . . . . . . . . 9,243,967 (7,792,815) 1,451,152 310,783,845Flexible Credit Bond . . . . . . . . . . . . . . . . . . . . . . . . . . . . . . . . . . . . . . . . . 5,752,845 (15,684,970) (9,932,125) 367,181,663
82
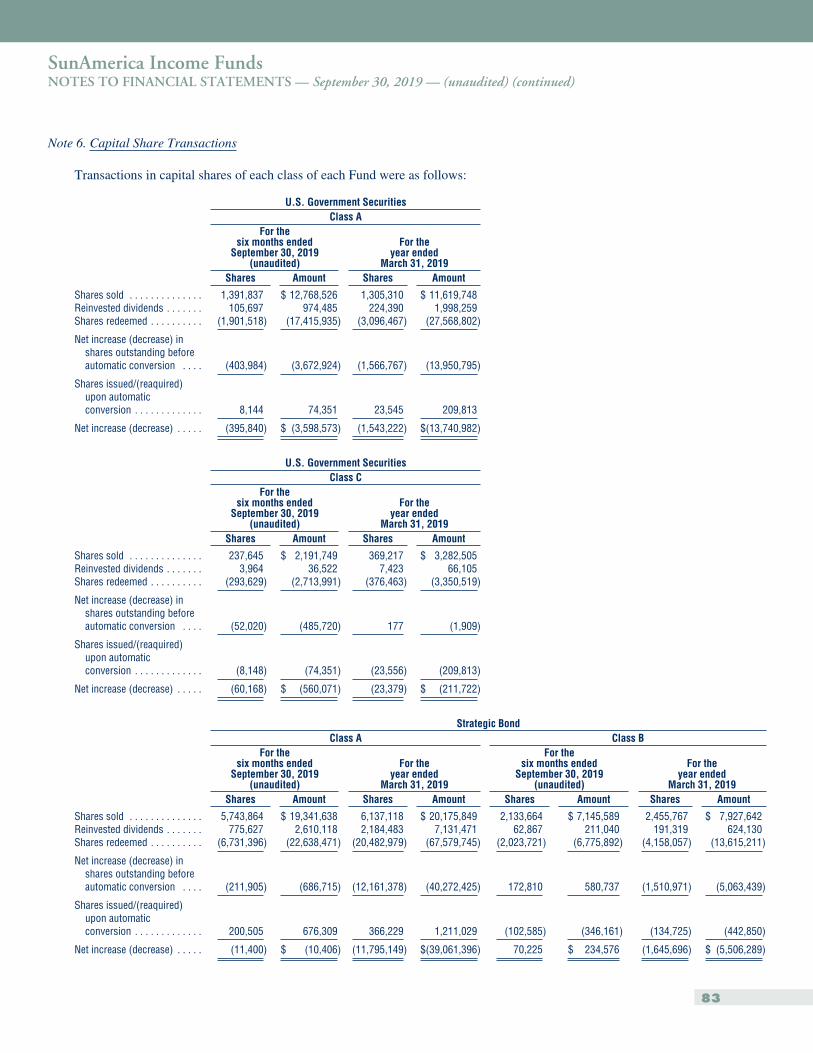
SunAmerica Income FundsNOTES TO FINANCIAL STATEMENTS — September 30, 2019 — (unaudited) (continued)
Note 6. Capital Share Transactions
Transactions in capital shares of each class of each Fund were as follows:
U.S. Government SecuritiesClass A
For thesix months ended
September 30, 2019(unaudited)
For theyear ended
March 31, 2019Shares Amount Shares Amount
Shares sold . . . . . . . . . . . . . . 1,391,837 $ 12,768,526 1,305,310 $ 11,619,748Reinvested dividends . . . . . . . 105,697 974,485 224,390 1,998,259Shares redeemed . . . . . . . . . . (1,901,518) (17,415,935) (3,096,467) (27,568,802)
Net increase (decrease) inshares outstanding beforeautomatic conversion . . . . (403,984) (3,672,924) (1,566,767) (13,950,795)
Shares issued/(reaquired)upon automaticconversion . . . . . . . . . . . . . 8,144 74,351 23,545 209,813
Net increase (decrease) . . . . . (395,840) $ (3,598,573) (1,543,222) $(13,740,982)
U.S. Government SecuritiesClass C
For thesix months ended
September 30, 2019(unaudited)
For theyear ended
March 31, 2019Shares Amount Shares Amount
Shares sold . . . . . . . . . . . . . . 237,645 $ 2,191,749 369,217 $ 3,282,505Reinvested dividends . . . . . . . 3,964 36,522 7,423 66,105Shares redeemed . . . . . . . . . . (293,629) (2,713,991) (376,463) (3,350,519)
Net increase (decrease) inshares outstanding beforeautomatic conversion . . . . (52,020) (485,720) 177 (1,909)
Shares issued/(reaquired)upon automaticconversion . . . . . . . . . . . . . (8,148) (74,351) (23,556) (209,813)
Net increase (decrease) . . . . . (60,168) $ (560,071) (23,379) $ (211,722)
Strategic BondClass A Class B
For thesix months ended
September 30, 2019(unaudited)
For theyear ended
March 31, 2019
For thesix months ended
September 30, 2019(unaudited)
For theyear ended
March 31, 2019Shares Amount Shares Amount Shares Amount Shares Amount
Shares sold . . . . . . . . . . . . . . 5,743,864 $ 19,341,638 6,137,118 $ 20,175,849 2,133,664 $ 7,145,589 2,455,767 $ 7,927,642Reinvested dividends . . . . . . . 775,627 2,610,118 2,184,483 7,131,471 62,867 211,040 191,319 624,130Shares redeemed . . . . . . . . . . (6,731,396) (22,638,471) (20,482,979) (67,579,745) (2,023,721) (6,775,892) (4,158,057) (13,615,211)
Net increase (decrease) inshares outstanding beforeautomatic conversion . . . . (211,905) (686,715) (12,161,378) (40,272,425) 172,810 580,737 (1,510,971) (5,063,439)
Shares issued/(reaquired)upon automaticconversion . . . . . . . . . . . . . 200,505 676,309 366,229 1,211,029 (102,585) (346,161) (134,725) (442,850)
Net increase (decrease) . . . . . (11,400) $ (10,406) (11,795,149) $(39,061,396) 70,225 $ 234,576 (1,645,696) $ (5,506,289)
83
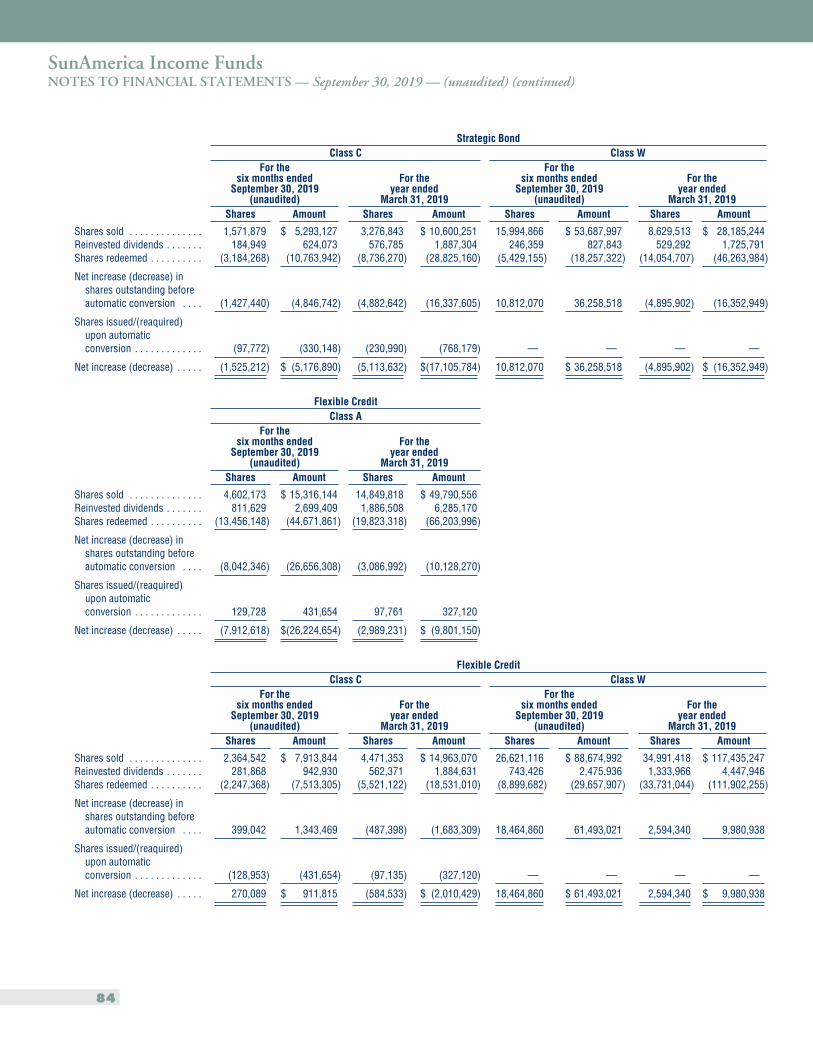
SunAmerica Income FundsNOTES TO FINANCIAL STATEMENTS — September 30, 2019 — (unaudited) (continued)
Strategic BondClass C Class W
For thesix months ended
September 30, 2019(unaudited)
For theyear ended
March 31, 2019
For thesix months ended
September 30, 2019(unaudited)
For theyear ended
March 31, 2019Shares Amount Shares Amount Shares Amount Shares Amount
Shares sold . . . . . . . . . . . . . . 1,571,879 $ 5,293,127 3,276,843 $ 10,600,251 15,994,866 $ 53,687,997 8,629,513 $ 28,185,244Reinvested dividends . . . . . . . 184,949 624,073 576,785 1,887,304 246,359 827,843 529,292 1,725,791Shares redeemed . . . . . . . . . . (3,184,268) (10,763,942) (8,736,270) (28,825,160) (5,429,155) (18,257,322) (14,054,707) (46,263,984)
Net increase (decrease) inshares outstanding beforeautomatic conversion . . . . (1,427,440) (4,846,742) (4,882,642) (16,337,605) 10,812,070 36,258,518 (4,895,902) (16,352,949)
Shares issued/(reaquired)upon automaticconversion . . . . . . . . . . . . . (97,772) (330,148) (230,990) (768,179) — — — —
Net increase (decrease) . . . . . (1,525,212) $ (5,176,890) (5,113,632) $(17,105,784) 10,812,070 $ 36,258,518 (4,895,902) $ (16,352,949)
Flexible CreditClass A
For thesix months ended
September 30, 2019(unaudited)
For theyear ended
March 31, 2019Shares Amount Shares Amount
Shares sold . . . . . . . . . . . . . . 4,602,173 $ 15,316,144 14,849,818 $ 49,790,556Reinvested dividends . . . . . . . 811,629 2,699,409 1,886,508 6,285,170Shares redeemed . . . . . . . . . . (13,456,148) (44,671,861) (19,823,318) (66,203,996)
Net increase (decrease) inshares outstanding beforeautomatic conversion . . . . (8,042,346) (26,656,308) (3,086,992) (10,128,270)
Shares issued/(reaquired)upon automaticconversion . . . . . . . . . . . . . 129,728 431,654 97,761 327,120
Net increase (decrease) . . . . . (7,912,618) $(26,224,654) (2,989,231) $ (9,801,150)
Flexible CreditClass C Class W
For thesix months ended
September 30, 2019(unaudited)
For theyear ended
March 31, 2019
For thesix months ended
September 30, 2019(unaudited)
For theyear ended
March 31, 2019Shares Amount Shares Amount Shares Amount Shares Amount
Shares sold . . . . . . . . . . . . . . 2,364,542 $ 7,913,844 4,471,353 $ 14,963,070 26,621,116 $ 88,674,992 34,991,418 $ 117,435,247Reinvested dividends . . . . . . . 281,868 942,930 562,371 1,884,631 743,426 2,475,936 1,333,966 4,447,946Shares redeemed . . . . . . . . . . (2,247,368) (7,513,305) (5,521,122) (18,531,010) (8,899,682) (29,657,907) (33,731,044) (111,902,255)
Net increase (decrease) inshares outstanding beforeautomatic conversion . . . . 399,042 1,343,469 (487,398) (1,683,309) 18,464,860 61,493,021 2,594,340 9,980,938
Shares issued/(reaquired)upon automaticconversion . . . . . . . . . . . . . (128,953) (431,654) (97,135) (327,120) — — — —
Net increase (decrease) . . . . . 270,089 $ 911,815 (584,533) $ (2,010,429) 18,464,860 $ 61,493,021 2,594,340 $ 9,980,938
84
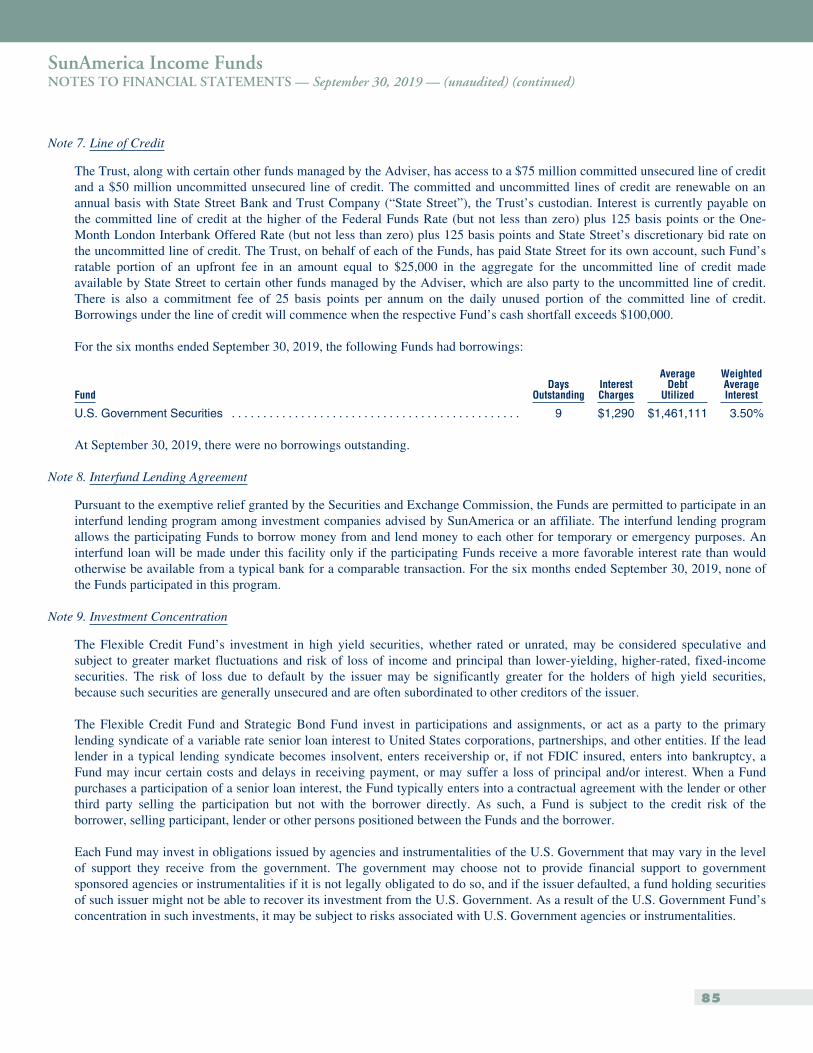
SunAmerica Income FundsNOTES TO FINANCIAL STATEMENTS — September 30, 2019 — (unaudited) (continued)
Note 7. Line of Credit
The Trust, along with certain other funds managed by the Adviser, has access to a $75 million committed unsecured line of creditand a $50 million uncommitted unsecured line of credit. The committed and uncommitted lines of credit are renewable on anannual basis with State Street Bank and Trust Company (“State Street”), the Trust’s custodian. Interest is currently payable onthe committed line of credit at the higher of the Federal Funds Rate (but not less than zero) plus 125 basis points or the One-Month London Interbank Offered Rate (but not less than zero) plus 125 basis points and State Street’s discretionary bid rate onthe uncommitted line of credit. The Trust, on behalf of each of the Funds, has paid State Street for its own account, such Fund’sratable portion of an upfront fee in an amount equal to $25,000 in the aggregate for the uncommitted line of credit madeavailable by State Street to certain other funds managed by the Adviser, which are also party to the uncommitted line of credit.There is also a commitment fee of 25 basis points per annum on the daily unused portion of the committed line of credit.Borrowings under the line of credit will commence when the respective Fund’s cash shortfall exceeds $100,000.
For the six months ended September 30, 2019, the following Funds had borrowings:
FundDays
OutstandingInterestCharges
AverageDebt
Utilized
WeightedAverageInterest
U.S. Government Securities . . . . . . . . . . . . . . . . . . . . . . . . . . . . . . . . . . . . . . . . . . . . . . 9 $1,290 $1,461,111 3.50%
At September 30, 2019, there were no borrowings outstanding.
Note 8. Interfund Lending Agreement
Pursuant to the exemptive relief granted by the Securities and Exchange Commission, the Funds are permitted to participate in aninterfund lending program among investment companies advised by SunAmerica or an affiliate. The interfund lending programallows the participating Funds to borrow money from and lend money to each other for temporary or emergency purposes. Aninterfund loan will be made under this facility only if the participating Funds receive a more favorable interest rate than wouldotherwise be available from a typical bank for a comparable transaction. For the six months ended September 30, 2019, none ofthe Funds participated in this program.
Note 9. Investment Concentration
The Flexible Credit Fund’s investment in high yield securities, whether rated or unrated, may be considered speculative andsubject to greater market fluctuations and risk of loss of income and principal than lower-yielding, higher-rated, fixed-incomesecurities. The risk of loss due to default by the issuer may be significantly greater for the holders of high yield securities,because such securities are generally unsecured and are often subordinated to other creditors of the issuer.
The Flexible Credit Fund and Strategic Bond Fund invest in participations and assignments, or act as a party to the primarylending syndicate of a variable rate senior loan interest to United States corporations, partnerships, and other entities. If the leadlender in a typical lending syndicate becomes insolvent, enters receivership or, if not FDIC insured, enters into bankruptcy, aFund may incur certain costs and delays in receiving payment, or may suffer a loss of principal and/or interest. When a Fundpurchases a participation of a senior loan interest, the Fund typically enters into a contractual agreement with the lender or otherthird party selling the participation but not with the borrower directly. As such, a Fund is subject to the credit risk of theborrower, selling participant, lender or other persons positioned between the Funds and the borrower.
Each Fund may invest in obligations issued by agencies and instrumentalities of the U.S. Government that may vary in the levelof support they receive from the government. The government may choose not to provide financial support to governmentsponsored agencies or instrumentalities if it is not legally obligated to do so, and if the issuer defaulted, a fund holding securitiesof such issuer might not be able to recover its investment from the U.S. Government. As a result of the U.S. Government Fund’sconcentration in such investments, it may be subject to risks associated with U.S. Government agencies or instrumentalities.
85
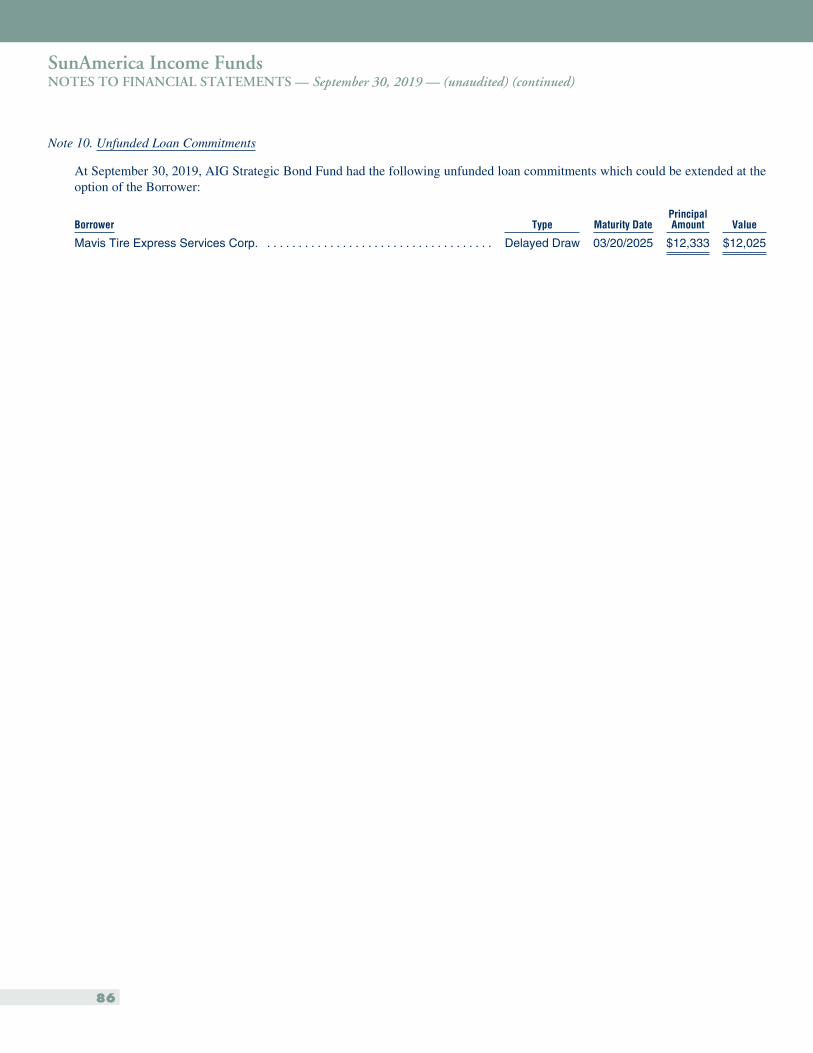
SunAmerica Income FundsNOTES TO FINANCIAL STATEMENTS — September 30, 2019 — (unaudited) (continued)
Note 10. Unfunded Loan Commitments
At September 30, 2019, AIG Strategic Bond Fund had the following unfunded loan commitments which could be extended at theoption of the Borrower:
Borrower Type Maturity DatePrincipalAmount Value
Mavis Tire Express Services Corp. . . . . . . . . . . . . . . . . . . . . . . . . . . . . . . . . . . . . Delayed Draw 03/20/2025 $12,333 $12,025
86
SunAmerica Income FundsAPPROVAL OF ADVISORY AGREEMENTS — September 30, 2019 — (unaudited)
Approval of the Investment Advisory and Management Agreement
The Board of Directors (the “Board” the members of which are referred to as “Directors”) of SunAmerica Series, Inc. (the“Corporation”), including the Directors who are not “interested persons,” as defined in Section 2(a)(19) of the Investment CompanyAct of 1940, as amended (the “1940 Act”) (the “Independent Directors”), of the Corporation or its separate series (each, a “Fund,” andcollectively, the “Funds”) or SunAmerica Asset Management, LLC (“SunAmerica”), approved the continuation of the InvestmentAdvisory and Management Agreement between the Corporation, on behalf of the Funds, and SunAmerica (the “AdvisoryAgreement”) for a one-year period ending June 30, 2020 at an in-person meeting held on June 4-5, 2019 (the “Meeting”). TheCorporation currently consists of the following six separate Funds: AIG Active Allocation Fund (“Active Allocation Fund”), AIGMulti-Asset Allocation Fund (“Multi-Asset Allocation Fund”), AIG Focused Dividend Strategy Fund (“Dividend Strategy Fund”),AIG Focused Dividend Strategy II Fund, AIG Strategic Value Fund (“Strategic Value Fund “) and AIG Select Dividend Growth Fund(“Dividend Growth Fund”).
In accordance with Section 15(c) of the 1940 Act, the Board requested, and SunAmerica provided, materials relating to the Board’sconsideration of whether to approve the continuation of the Advisory Agreement. These materials included, among other things: (a) asummary of the services provided to the Funds by SunAmerica and its affiliates; (b) information independently compiled and preparedby Broadridge Financial Solutions, Inc. (“Broadridge”), an independent third-party provider of mutual fund data, on fees and expensesof the Funds and the investment performance of the Funds as compared with a peer group of funds, along with fee and performancedata with respect to the Funds and any other mutual funds or other accounts advised by SunAmerica with similar investmentobjectives and/or strategies, as applicable; (c) information on the profitability of SunAmerica and its affiliates, and a discussionrelating to indirect benefits; (d) information relating to economies of scale; (e) information about SunAmerica’s general compliancepolicies and procedures and the services it provides to the Funds; (f) information about SunAmerica’s risk management processes;(g) information regarding brokerage and soft dollar practices; and (h) information about the key personnel of SunAmerica and itsaffiliates that are involved in the investment management, administration, compliance and risk management activities with respect tothe Funds, as well as current and projected staffing levels and compensation practices.
In determining whether to approve the continuation of the Advisory Agreement, the Board, including the Independent Directors,considered at the Meeting, and from time to time as appropriate, factors that it deemed relevant, including the following information:
Nature, Extent and Quality of Services Provided by SunAmerica. The Board, including the Independent Directors, considered thenature, extent and quality of services provided by SunAmerica. The Board noted that the services include acting as investmentmanager and adviser to the Funds, managing the daily business affairs of the Funds, and obtaining and evaluating economic, statisticaland financial information to formulate and implement investment policies. Additionally, the Board observed that SunAmericaprovides office space, bookkeeping, accounting, legal, compliance, clerical and administrative services, and has authorized its officersand employees, if elected, to serve as officers or directors of the Corporation without compensation. The Board also noted thatSunAmerica is responsible for monitoring and reviewing the activities of affiliated and unaffiliated third-party service providers. Inaddition to the quality of the advisory services provided by SunAmerica, the Board considered the quality of the administrative andother services provided by SunAmerica to the Funds pursuant to the Advisory Agreement. The Board also considered the significantrisks assumed by SunAmerica in connection with the services provided to the Funds including entrepreneurial risk in sponsoring newfunds and ongoing risks including investment, operational, enterprise, litigation, regulatory and compliance risks with respect to allFunds.
In connection with the services provided by SunAmerica, the Board analyzed the structure and duties of SunAmerica’s fundadministration, accounting, operations, legal and compliance departments and concluded that they were adequate to meet the needs ofthe Funds. The Board also reviewed the personnel responsible for providing advisory services to the Funds and other key personnel ofSunAmerica, in addition to current and projected staffing levels and compensation practices. The Board concluded, based on itsexperience and interaction with SunAmerica, that: (i) SunAmerica would continue to be able, to retain quality investment and otherpersonnel; (ii) SunAmerica has exhibited a high level of diligence and attention to detail in carrying out its advisory and otherresponsibilities; (iii) SunAmerica has been responsive to requests of the Board; and (iv) SunAmerica has kept the Board apprised ofdevelopments relating to the Funds and the industry in general. The Board concluded that the nature and extent of services providedunder the Advisory Agreement were reasonable and appropriate in relation to the management fee and that the quality of servicescontinues to be high.
87
SunAmerica Income FundsAPPROVAL OF ADVISORY AGREEMENTS — September 30, 2019 — (unaudited) (continued)
The Board also considered SunAmerica’s reputation and long-standing relationship with the Funds and considered the benefit toshareholders of investing in funds that are part of a family of funds offering a variety of types of mutual funds and shareholderservices. The Board considered SunAmerica’s experience in providing management and investment advisory and administrativeservices to advisory clients and noted that as of March 31, 2019, SunAmerica managed, advised and/or administered approximately$85.8 billion in assets. In addition, the Board considered SunAmerica’s code of ethics and its commitment to compliance generallyand with respect to its management and administration of the Funds. The Board also considered SunAmerica’s risk managementprocesses. The Board further observed that SunAmerica has developed internal procedures for monitoring compliance with theinvestment objectives, policies and restrictions of the Funds as set forth in the Funds’ prospectuses. The Board also reviewedSunAmerica’s compliance and regulatory history and noted that there were no material legal, regulatory or compliance issues thatwould potentially impact SunAmerica in effectively serving as the investment adviser to the Funds.
Investment Performance. The Board, including the Independent Directors, also considered the investment performance of SunAmericawith respect to the Funds. In connection with its review, the Board received and reviewed information regarding the investmentperformance of the Funds as compared to each Fund’s peer universe (“Peer Universe”) and/or peer group (“Peer Group”) asindependently determined by Broadridge and to an appropriate index or combination of indices, including the Fund’s benchmarks.The Board was provided with a description of the methodology used by Broadridge to select the funds in the Peer Groups and PeerUniverses.
The Board noted that performance information was for the periods ended March 31, 2019. The Board also noted that it regularlyreviews the performance of the Funds throughout the year. The Board further noted that, while it monitors performance of the Fundsclosely, it generally attaches more importance to performance over relatively long periods of time, typically three to five years.
Active Allocation Fund. The Board considered that the Fund’s performance was above the median of its Peer Group for the one-,three- and five-year periods. The Board further considered that the Fund underperformed its Peer Universe for the one-year period andoutperformed its Peer Universe for the three- and five-year periods. The Board further considered that the Fund underperformed itsBroadridge Index for the one-, three- and five-year periods. The Board noted management’s discussion of the Fund’s performance andconcluded that the Fund’s performance was satisfactory.
Multi-Asset Allocation Fund. The Board considered that the Fund’s performance was below the medians of its Peer Group and PeerUniverse for the one-, three- and five-year periods. The Board also considered that the Fund underperformed its Broadridge Index forthe one-, three- and five-year periods. The Board took into account management’s discussion of the reasons for the Fund’s recentunderperformance as well as management’s discussion of the Fund’s portfolio construction and investment strategy and concludedthat the Fund’s performance was being appropriately monitored.
Dividend Strategy Fund. The Board considered that the Fund’s performance was above the medians of its Peer Group and PeerUniverse for the one- and five-year periods and was below the medians of its Peer Group and Peer Universe for the three-year period.The Board also considered that the Fund outperformed its Broadridge Index for the one- and five-year periods and underperformed itsBroadridge Index for the three-year period. The Board noted management’s discussion of the Fund’s performance, and concluded thatthe Fund’s performance was satisfactory.
Strategic Value Fund. The Board considered that the Fund’s performance was below the medians of its Peer Group and Peer Universefor the one-, three- and five-year periods. The Board also considered that the Fund underperformed its Broadridge Index for the one-and three- year periods and outperformed its Broadridge Index for the five-year period. The Board noted management’s discussion ofthe Fund’s performance, including the Fund’s investment approach, and concluded that the Fund’s performance was beingappropriately monitored.
Select Dividend Growth Fund. The Board noted that the Fund’s performance was below the median of its Peer Group for the one-yearperiod and was equal to the median of its Peer Group for the three-year period. The Board further considered that the Fund’sperformance was below the median of its Peer Universe for the one- and three-year periods. The Board further considered that theFund underperformed its Broadridge Index for the one- and three-year periods. The Board noted management’s discussion of theFund’s performance, including the impact of market conditions on the Fund’s performance, and concluded that the Fund’sperformance is being appropriately monitored.
88
SunAmerica Income FundsAPPROVAL OF ADVISORY AGREEMENTS — September 30, 2019 — (unaudited) (continued)
Consideration of the Management Fees and the Cost of the Services and Profits to be Realized by SunAmerica and its Affiliates fromthe Relationship with the Funds. The Board, including the Independent Directors, received and reviewed information regarding thefees paid by the Funds to SunAmerica pursuant to the Advisory Agreement. The Board examined this information in order todetermine the reasonableness of the fees in light of the nature and quality of services to be provided and any potential additionalbenefits to be received by SunAmerica or its affiliates in connection with providing such services to the Funds.
To assist in analyzing the reasonableness of the management fee for each of the Funds, the Board received reports independentlyprepared by Broadridge. The reports showed comparative fee information for each Fund’s Peer Group and/or Peer Universe, asdetermined by Broadridge, including rankings within each category. In considering the reasonableness of the management fee to bepaid by each Fund to SunAmerica, the Board reviewed a number of expense comparisons, including: (i) contractual and actualmanagement fees and (ii) actual total operating expenses. In considering each Fund’s total operating expenses, the Board analyzed thelevel of fee waivers and expense reimbursements and the net expense caps contractually agreed upon by SunAmerica with respect tocertain classes of AIG Strategic Value Fund and AIG Select Dividend Growth Fund. The Board also considered the voluntary feewaivers and/or expense reimbursements being made by SunAmerica with respect to the AIG Active Allocation Fund and AIG Multi-Asset Allocation Fund (collectively, the “Allocation Funds”). The Board further considered that, unlike the funds in the Peer Groupand Peer Universe, the fee waivers and/or reimbursements being made by SunAmerica with respect to the Funds are only reflected inthe total expenses category of the Broadridge reports, rather than also being reflected as specific management fee waivers in the actualmanagement fees category of the Broadridge reports. As a result, the Board took into account that the actual management feespresented by Broadridge for the funds in the Peer Group and Peer Universe may appear lower on a relative basis. The Board alsoconsidered the various expense components of the Funds and compared each Fund’s net expense ratio (taking into account thecontractual fee caps) to those of other funds within its Peer Group and/or Peer Universe as a guide to help assess the reasonableness ofeach Fund’s management fee. The Board acknowledged that it was difficult to make precise comparisons with other funds in the PeerGroups and Peer Universes since the exact nature of services provided under the various fund agreements is often not apparent. TheBoard noted, however, that the comparative fee information provided by Broadridge as a whole was useful in assessing whetherSunAmerica was providing services at a cost that was competitive with other, similar funds.
The Board also considered the management fees received by SunAmerica with respect to other mutual funds and accounts withsimilar investment strategies to the Funds, as applicable. The Board noted that certain of the mutual funds identified as similar tocertain of the Funds are sold only in the variable annuity market and, accordingly, are in different Broadridge classifications, withpeer groups consisting of funds underlying variable insurance products. The Board further noted that SunAmerica serves assubadviser to certain of these similar mutual funds and observed that the services SunAmerica provides as subadviser are much morelimited in scope than in its role as investment manager and adviser to the Funds. The Board then noted the management fees paid bythe Funds were reasonable as compared to the fees SunAmerica was receiving from other mutual funds and accounts for which itserves as adviser or subadviser.
Active Allocation Fund. The Board considered that the Fund’s actual management fees were above the medians of its Peer Group andPeer Universe. The Board also considered that the Fund’s total expenses were above the medians of its Peer Group and Peer Universe.The Board noted management’s discussion regarding the Fund’s expenses.
Multi-Asset Allocation Fund. The Board considered that the Fund’s actual management fees were above the medians of its PeerGroup and Peer Universe. The Board also considered that the Fund’s total expenses were above the medians of its Peer Group andPeer Universe. The Board noted management’s discussion regarding the Fund’s expenses.
Dividend Strategy Fund. The Board considered that the Dividend Strategy Fund’s actual management fees were below the medians ofits Peer Group and Peer Universe. The Board also considered that the Portfolio’s total expenses were below the median of its PeerGroup and above the median of its Peer Universe.
Strategic Value Fund. The Board considered that the Fund’s actual management fees were above the medians of its Peer Group andPeer Universe. The Board also considered that the Fund’s total expenses were above the medians of its Peer Group and Peer Universe.The Board noted management’s discussion regarding the Fund’s expenses.
89
SunAmerica Income FundsAPPROVAL OF ADVISORY AGREEMENTS — September 30, 2019 — (unaudited) (continued)
Select Dividend Growth Fund. The Board considered that the Fund’s actual management fees were above the medians of its PeerGroup and Peer Universe. The Board also considered that the Fund’s total expenses were below the median of its Peer Group andwere above the median of its Peer Universe. The Board noted management’s discussion regarding the Fund’s expenses.
Profitability. The Board also considered SunAmerica’s profitability and the benefits SunAmerica and its affiliates received from theirrelationship with the Funds. The Board received and reviewed financial statements relating to SunAmerica’s financial condition andprofitability with respect to the services it provides the Funds and considered how profit margins could affect SunAmerica’s ability toattract and retain high quality investment professionals and other key personnel. The Board was also provided with a profitabilityanalysis that detailed the revenues earned and the expenses incurred by SunAmerica and its affiliates that provide services to theFunds on a Fund by Fund basis, as well as an Investment Management Profitability Analysis prepared by an independent informationservice, Broadridge. In particular, the Board considered the contractual and voluntary fee waivers and/or expense reimbursementsagreed to by SunAmerica.
The Board considered the profitability of SunAmerica under the Advisory Agreement and considered the profitability ofSunAmerica’s affiliates under the Rule 12b-1 Plans. Additionally, the Board considered whether SunAmerica and its affiliatesreceived any indirect benefits from the relationship with the Funds. The Board further considered whether there were any collateral or“fall-out” benefits that SunAmerica and its affiliates may derive as a result of their relationship with the Funds. The Board noted thatSunAmerica believes that any such benefits are de minimis and do not impact the reasonableness of the management fees.
The Board concluded that SunAmerica had the financial resources necessary to perform its obligations under the Advisory Agreementand to continue to provide the Funds with the high quality services that it had provided in the past. The Board further concluded thatthe management fees payable by the Funds under the Advisory Agreement were reasonable in light of the factors discussed above.
Economies of Scale. The Board, including the Independent Directors, considered whether the shareholders would benefit fromeconomies of scale and whether there was potential for future realization of economies with respect to the Funds. The Boardconsidered that as a result of being part of the AIG fund complex, the Funds share common resources and may share certain expenses,and if the size of the complex increases, each fund could incur lower expenses than they otherwise would achieve as stand-aloneentities. The Board also took into account that the management fee arrangements with respect to AIG Focused Dividend StrategyFund included breakpoints that will adjust the fee downward as the size of those Funds increase, thereby allowing the shareholders toparticipate in any economies of scale. The Board further noted that, with respect to the AIG Strategic Value Fund and AIG SelectDividend Growth Fund, SunAmerica has agreed to contractually cap the total annual operating expenses of certain classes of theFunds, at certain levels. The Board also noted that with respect to the Allocation Funds, SunAmerica has agreed to voluntarily cap thetotal annual operating expenses of certain classes of the Funds, at certain levels. The Board observed that those expense caps benefitedshareholders by limiting total fees even in the absence of breakpoints. The Board concluded that the Funds’ management fee structurewas reasonable and that it would continue to review fees in connection with the renewal of the Advisory Agreement, includingwhether the implementation of additional breakpoints would be appropriate in the future due to an increase in asset size or otherwise.
Other Factors. In consideration of the Advisory Agreement the Board also received information regarding SunAmerica’s brokerageand soft dollar practices. The Board considered that SunAmerica is responsible for decisions to buy and sell securities for the Funds,selection of broker-dealers and negotiation of commission rates. The Board noted that it receives reports from SunAmerica and froman independent third party which included information on brokerage commissions and execution throughout the year. The Board alsoconsidered the benefits SunAmerica derives from its soft dollar arrangements, including arrangements under which brokers providebrokerage and/or research services to SunAmerica in return for allocating brokerage.
Conclusion. After a full and complete discussion, the Board approved the Advisory Agreement for a one-year period ending June 30,2020. Based upon their evaluation of all these factors in their totality, the Board, including the Independent Directors, was satisfiedthat the terms of the Advisory Agreement and were fair and reasonable and in the best interests of the respective Funds and the Funds’shareholders. In arriving at a decision to approve the Advisory Agreement the Board did not identify any single factor or group offactors as all-important or controlling, but considered all factors together, and each Independent Director may have attributed differentweights to different factors. The Independent Directors were also assisted by the advice of independent legal counsel in making thisdetermination.
90
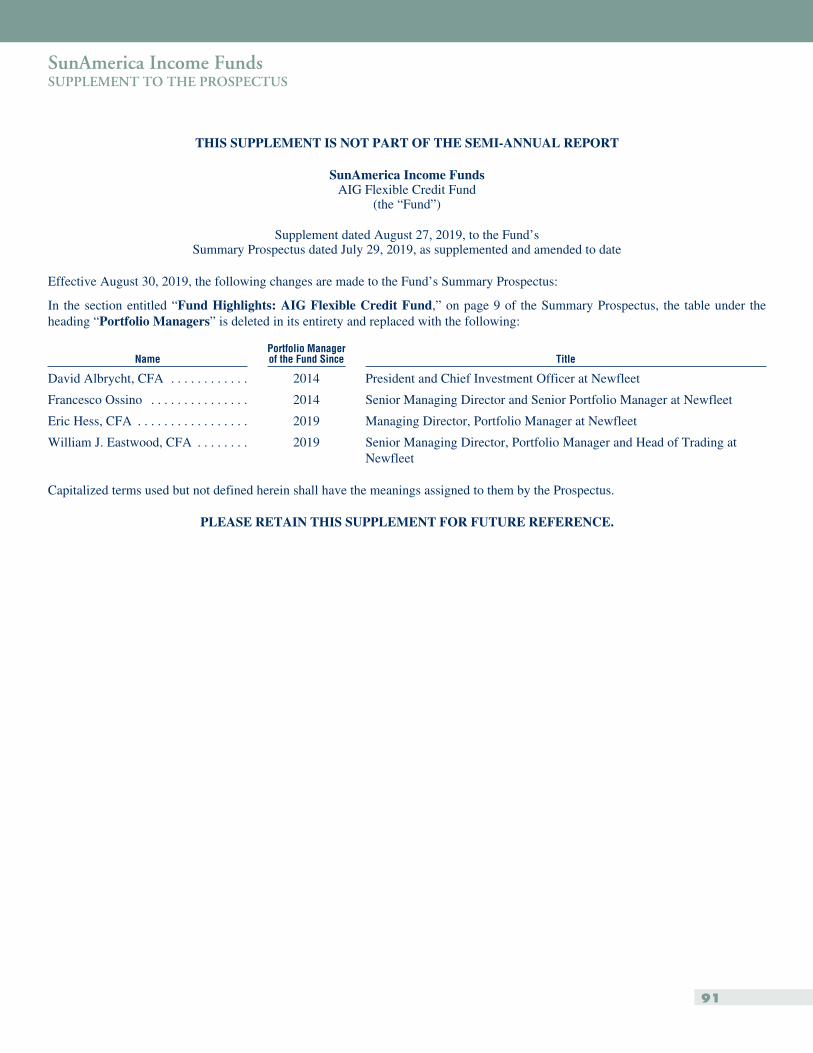
SunAmerica Income FundsSUPPLEMENT TO THE PROSPECTUS
THIS SUPPLEMENT IS NOT PART OF THE SEMI-ANNUAL REPORT
SunAmerica Income FundsAIG Flexible Credit Fund
(the “Fund”)
Supplement dated August 27, 2019, to the Fund’sSummary Prospectus dated July 29, 2019, as supplemented and amended to date
Effective August 30, 2019, the following changes are made to the Fund’s Summary Prospectus:
In the section entitled “Fund Highlights: AIG Flexible Credit Fund,” on page 9 of the Summary Prospectus, the table under theheading “Portfolio Managers” is deleted in its entirety and replaced with the following:
NamePortfolio Managerof the Fund Since Title
David Albrycht, CFA . . . . . . . . . . . . 2014 President and Chief Investment Officer at Newfleet
Francesco Ossino . . . . . . . . . . . . . . . 2014 Senior Managing Director and Senior Portfolio Manager at Newfleet
Eric Hess, CFA . . . . . . . . . . . . . . . . . 2019 Managing Director, Portfolio Manager at Newfleet
William J. Eastwood, CFA . . . . . . . . 2019 Senior Managing Director, Portfolio Manager and Head of Trading atNewfleet
Capitalized terms used but not defined herein shall have the meanings assigned to them by the Prospectus.
PLEASE RETAIN THIS SUPPLEMENT FOR FUTURE REFERENCE.
91
AIG FundsHarborside 5185 Hudson Street, Suite 3300Jersey City, NJ 07311
TrusteesRichard W. GrantPeter A. HarbeckDr. Judith L. CravenWilliam F. DevinStephen J. GutmanEileen A. Kamerick
OfficersJohn T. Genoy, PresidentSharon French, Executive Vice PresidentJames Nichols, Vice PresidentChristopher C. Joe, Chief Compliance OfficerGregory N. Bressler, SecretaryKathleen Fuentes, Chief Legal Officer and Assistant
SecretaryGregory R. Kingston, TreasurerDonna McManus, Vice President and Assistant
TreasurerShawn Parry, Vice President and Assistant
TreasurerMatthew J. Hackethal, Anti-Money Laundering
Compliance Officer
Investment AdviserSunAmerica Asset Management, LLCHarborside 5185 Hudson Street, Suite 3300Jersey City, NJ 07311
DistributorAIG Capital Services, Inc.Harborside 5185 Hudson Street, Suite 3300Jersey City, NJ 07311
Shareholder Servicing AgentAIG Fund Services, Inc.Harborside 5185 Hudson Street, Suite 3300Jersey City, NJ 07311
CustodianState Street Bank and Trust CompanyOne Lincoln StreetBoston, MA 02111
Transfer AgentDST Asset Manager Solutions, Inc.303 W 11th StreetKansas City, MO 64105
VOTING PROXIES ON TRUST PORTFOLIOSECURITIESA description of the policies and proce-dures that the Trust uses to determinehow to vote proxies relating to secu-rities held in a Fund’s portfolio, whichis available in the Trust’s Statement ofAdditional Information, may be ob-tained without charge upon request, bycalling (800) 858-8850. The in-formation is also available from theEDGAR database on the U.S. Secu-rities and Exchange Commission’swebsite at http://www.sec.gov.
DELIVERY OF SHAREHOLDER DOCUMENTSThe Funds have adopted a policy thatallows them to send only one copy of aFund’s prospectus, proxy material,annual report and semi-annual report(the “shareholder documents”) toshareholders with multiple accountsresiding at the same “household.” Thispractice is called householding andreduces Fund expenses, which benefitsyou and other shareholders. Unless theFunds receive instructions to the con-trary, you will only receive one copy ofthe shareholder documents. The Fundswill continue to household the share-holder documents indefinitely, until weare instructed otherwise. If you do notwish to participate in householdingplease contact Shareholder Services at(800) 858-8850 ext. 6010 or send awritten request with your name, thename of your fund(s) and youraccount number(s) to AIG Funds,P.O. Box 219186, Kansas City MO,64121-9186. We will resume in-dividual mailings for your accountwithin thirty (30) days of receipt ofyour request.
DISCLOSURE OF QUARTERLY PORTFOLIOHOLDINGSThe Trust is required to file its completeschedule of portfolio holdings quarterlywith the U.S. Securities and ExchangeCommission on Form N-PORT. TheTrusts’ Forms N-PORT are available onthe U.S. Securities and ExchangeCommission’s website athttp://www.sec.gov.
PROXY VOTING RECORD ONSUNAMERICA INCOME FUNDSInformation regarding how the Fundsvoted proxies relating to securities held inthe Funds during the most recent twelvemonth period ended June 30 is available,once filed with the U.S. Securities andExchange Commission, without charge,upon request, by calling (800) 858-8850or on the U.S. Securities and ExchangeCommission’s website athttp://www.sec.gov.
This report is submitted solely for thegeneral information of shareholders ofthe Funds. Distribution of this reportto persons other than shareholders ofthe Funds is authorized only in con-nection with a currently effective pro-spectus, setting forth details of theFunds, which must precede or accom-pany this report.
The accompanying report has not beenaudited by independent accountantsand accordingly no opinion has beenexpressed thereon.

Go Paperless!!Did you know that you have the option toreceive your shareholder reports online?
By choosing this convenient service, you will no longer receive paper copies of Funddocuments such as annual reports, semi-annual reports, prospectuses and proxy state-ments in the mail. Instead, you are provided with quick and easy access to this informationvia the Internet.
Why Choose Electronic Delivery?
It’s Quick — Fund documents will be receivedfaster than via traditional mail.
It’s Convenient — Elimination of bulkydocuments from personal files.
It’s Cost Effective — Reduction of yourFund’s printing and mailing costs.
To sign up for electronic delivery, followthese simple steps:
1 Go to www.aig.com/funds
2 Click on the link to “Go Paperless!!”
The email address you provide will be kept strictly confidential. Once your enrollmenthas been processed, you will begin receiving email notifications when anything youreceive electronically is available online.
You can return to www.aig.com/funds at any time to change your email address, edityour preferences or to cancel this service if you choose to resume physical delivery ofyour Fund documents.
Please note - this option is only available to accounts opened through the Funds.

For information on receiving this report online, see inside back cover.
AIG Funds are advised by SunAmerica Asset Management, LLC (SAAMCo) and distributed byAIG Capital Services, Inc. (ACS), Member FINRA. Harborside 5, 185 Hudson Street, Suite 3300, Jersey City,NJ 07311, 800-858-8850. SAAMCo and ACS are members of American International Group, Inc. (AIG).
This fund report must be preceded by or accompanied by a prospectus.
Investors should carefully consider a Fund’s investment objectives, risks, charges andexpenses before investing. The prospectus, containing this and other important information,can be obtained from your financial adviser, the AIG Funds Sales Desk at 800-858-8850,ext. 6003, or at aig.com/funds. Read the prospectus carefully before investing.
aig.com/funds
INSAN - 9/19