Embed Size (px)
Citation preview

SUNBURST WATER-SUPPLY RENOVATION Project Report to the
Montana Department of Natural Resources and Conservation
Montana Bureau of Mines and Geology Open-File Report 548
By
Peter M. Norbeck
Montana Bureau of Mines and Geology
Sponsored by the town of Sunburst
Funded by the Montana Department of Natural Resources and Conservation
Agreement # RIT-04-8649
April 2006
i
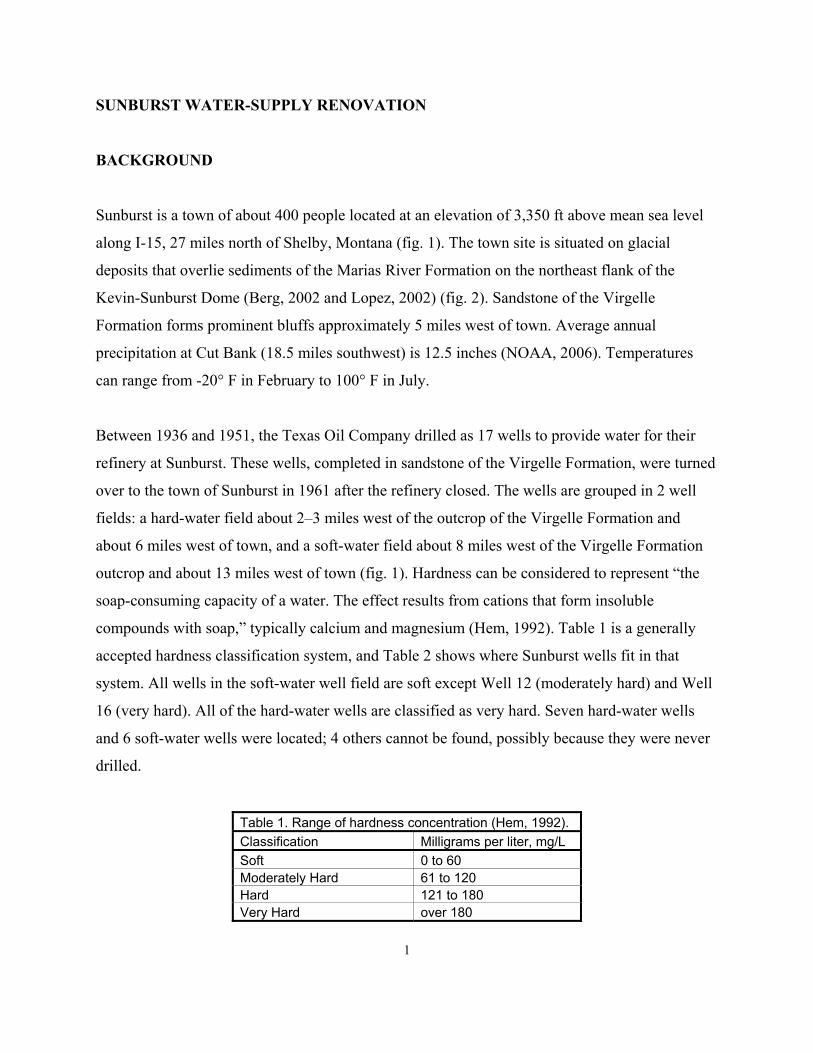
CONTENTS ABSTRACT...........................................................................................................................ii SUNBURST WATER-SUPPLY RENOVATION................................................................1 BACKGROUND ...................................................................................................................1 PROBLEM.............................................................................................................................4 HYDROGEOLOGIC EVALUATION..................................................................................7 Physical Condition of Wells ..............................................................................................7 Hydrogeologic Properties ..................................................................................................9 Water Quality.....................................................................................................................10 WELL PLUGGING AND ABANDONMENT.....................................................................17 WELL RENOVATION OR REPLACEMENT.....................................................................18 SUMMARY...........................................................................................................................18 RECOMMENDATIONS.......................................................................................................19 REFERENCES ......................................................................................................................20
FIGURES Figure 1. Town of Sunburst, well locations...........................................................................2 Figure 2. Geologic map and cross section .............................................................................3 Figure 3. Dark stains caused by water entering Well 15 through corroded casing ...............5 Figure 4. Pump being pulled from Well 13 ...........................................................................8 Figure 5. Observed water level elevations with Wells 15 and 17 in use ...............................11 Figure 6. Modeled water level elevations ..............................................................................12 Figure 7. Generalized water quality in glacial till (Qgt) ........................................................13 Figure 8. Generalized water quality in the Two Medicine Formation (Ktm)........................14 Figure 9. Generalized water quality in the Virgelle Formation (Kvi) ...................................15
TABLES Table 1. Range of hardness concentration .............................................................................1 Table 2. Hardness classification of Sunburst wells ...............................................................4 Table 3. Well data summary ..................................................................................................8 Table 4. Aquifer test data.......................................................................................................9 Table 5. Well measurements and water-quality summary.....................................................16 Appendix A–Water-Well Inventory and Water-Quality Data ...............................................A-1 Appendix B–Downhole Camera Logs ...................................................................................B-1

ii
ABSTRACT
The town of Sunburst has water rights on 12 wells originally drilled to provide water for the
Texas Oil Company’s refinery at Sunburst. Mixing water from Well 17 (hard water) and Well 15
(soft water) has historically provided a suitable water supply for the community. However, in the
summer of 2001, bacteria in the water from Well 15 (soft water) overwhelmed the town's
chlorination system, forcing the town to shut down the well. A sample collected by the Montana
Department of Environmental Quality was found to contain large amounts of sulfur-reducing
bacteria (SRB) (greater than 100 colony-forming units per milliliter). A preliminary
hydrogeologic analysis by the Montana Bureau of Mines and Geology (MBMG) and inspection
of the casing using MBMG's downhole camera indicated that a likely source for SRB was poor-
quality water from shallow aquifers entering the well through holes caused by corrosion of the
steel casing.
MBMG staff supervised pulling pumps from the unused wells, purged the wells by pumping, and
collected samples for major cations (calcium, magnesium, sodium, potassium, iron, and
manganese), major anions (bicarbonate, carbonate, sulfate, chloride, nitrate (as nitrogen), and
fluoride), metals (silver, aluminum, arsenic, boron, barium, beryllium, bromide, cadmium,
cobalt, chromium, lithium, molybdenum, nickel, lead, antimony, selium, strontium, titanium,
vanadium, zinc, zirconium, thallium, and uranium), SRB, iron-related bacteria, and extractible
petroleum hydrocarbons. Well bores were inspected using a downhole camera. Based on a
hydrogeologic analysis by MBMG, analytical results, and the condition of all wells, a decision
was made to attempt to rehabilitate Well 5 (hard water) and Well 13 (soft water) for use as
backup water supply. The remaining wells have been plugged and abandoned except for Well 6,
which was capped for possible future use as an additional supply well.
Unfortunately, the soft-water well could not be rehabilitated, necessitating drilling a replacement.
Well 13 was cased with 10-in casing, which is too small to allow placement and successful
cementing of an 8-in liner. When the 10-in casing could not be pulled, a replacement well
became the most cost-effective alternative. The additional cost of replacing the soft-water well
precluded connecting the backup wells to the system.
1
SUNBURST WATER-SUPPLY RENOVATION
BACKGROUND
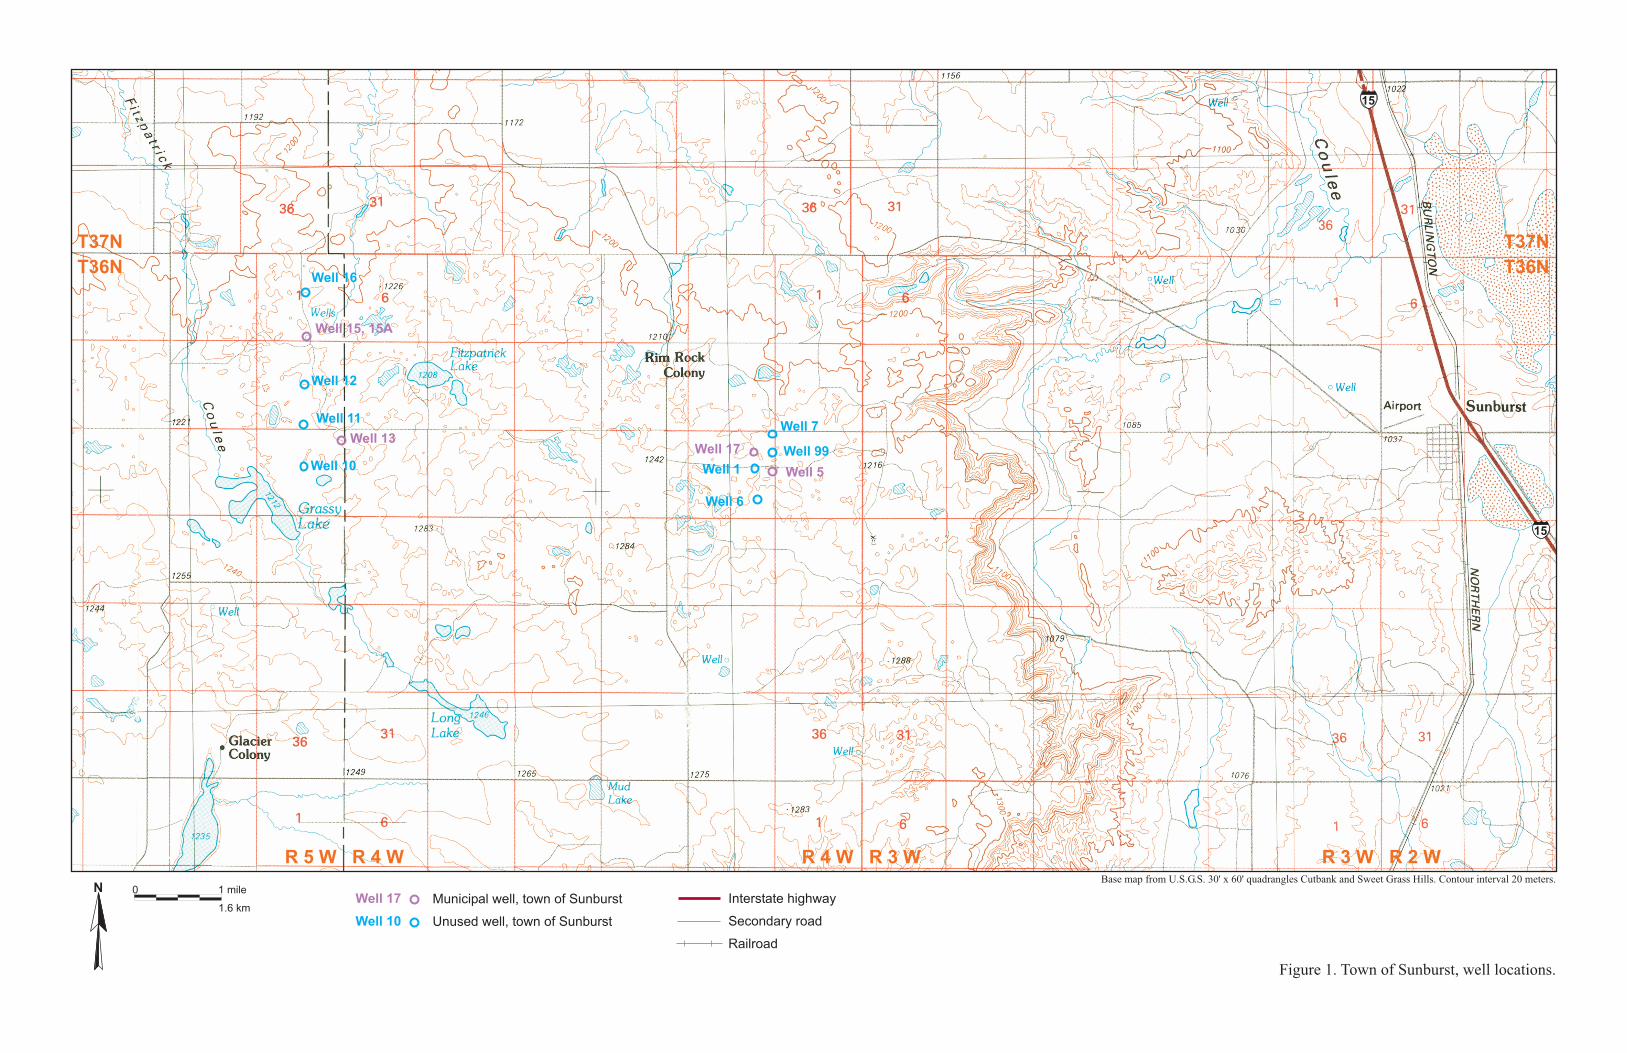
Sunburst is a town of about 400 people located at an elevation of 3,350 ft above mean sea level
along I-15, 27 miles north of Shelby, Montana (fig. 1). The town site is situated on glacial
deposits that overlie sediments of the Marias River Formation on the northeast flank of the
Kevin-Sunburst Dome (Berg, 2002 and Lopez, 2002) (fig. 2). Sandstone of the Virgelle
Formation forms prominent bluffs approximately 5 miles west of town. Average annual
precipitation at Cut Bank (18.5 miles southwest) is 12.5 inches (NOAA, 2006). Temperatures
can range from -20° F in February to 100° F in July.
Between 1936 and 1951, the Texas Oil Company drilled as 17 wells to provide water for their
refinery at Sunburst. These wells, completed in sandstone of the Virgelle Formation, were turned
over to the town of Sunburst in 1961 after the refinery closed. The wells are grouped in 2 well
fields: a hard-water field about 2–3 miles west of the outcrop of the Virgelle Formation and
about 6 miles west of town, and a soft-water field about 8 miles west of the Virgelle Formation
outcrop and about 13 miles west of town (fig. 1). Hardness can be considered to represent “the
soap-consuming capacity of a water. The effect results from cations that form insoluble
compounds with soap,” typically calcium and magnesium (Hem, 1992). Table 1 is a generally
accepted hardness classification system, and Table 2 shows where Sunburst wells fit in that
system. All wells in the soft-water well field are soft except Well 12 (moderately hard) and Well
16 (very hard). All of the hard-water wells are classified as very hard. Seven hard-water wells
and 6 soft-water wells were located; 4 others cannot be found, possibly because they were never
drilled.
Table 1. Range of hardness concentration (Hem, 1992). Classification Milligrams per liter, mg/L Soft 0 to 60 Moderately Hard 61 to 120 Hard 121 to 180 Very Hard over 180
��������
���������� �����������
��������
�����������
�����
���
�����
��������
�����
�����
�����
�����
����
����
�����
����
���������� ��������������� �������������
����������������������� �!���"��#��������$�����%���#�� ����������&�����$������������'���(��������
�����
�����
���������� ��������������
�������� ��������������
�����������������
�������������
�������
� ����
�� !�
�
�
�

Kmk
Kmk
Kmk
Ktc Kmk
Ktc
Ktc
Kvi Qac
(Kmk)
(Kmk)
(Kmk)(Kmk)
(Kvi)
QacKmk
KtcKvi
QacKmk
(Ktm)
(Ktm)
WELL 17
WELL 16
WELL 13
WELL 12WELL 09
WELL 11 WELL 07
WELL 15, 15A
WELL 99WELL 01WELL 06
WELL 10 WELL 05Sunburst
Kmk
Kmk
Qac
Qac
Kmk
KmkKtcKvi
Kvi Kmk
Kmk
Kmk
Kmk
Kmk
Ktc
Ktc
Kmk
Ktc
Ktc
Kmk
Kmk
Qac
Kmk
Ktm
Ktc
11 1666
313636 3131 36
36 31 36 31 36 31
T36NR4W
T36NR3W
T36NR5W
T37NR3W
T37NR4W
T36NR2W
T37NR5W
T37NR2W
Figure 2. Geologic map and cross section
Parentheses indicate that formation ispresent but covered by glacial deposits
0 1 2 30.5Miles
A
A'
LegendQac Alluvium-colluvium
Kmk Kevin Member of Marias River Fm.Ktc Telegraph Creek Fm.
Ktm Two Medicine Fm.Kvi Virgelle Fm.
Cities & towns
Lakes & reservoirsWell locationsPetroleum well locations
Streams
RoadsPrimary highway, undivided
Street or unimproved roadLight duty or improved roadSecondary highway, undivided
Geology from Berg, 2002 and Lopez, 2001
4
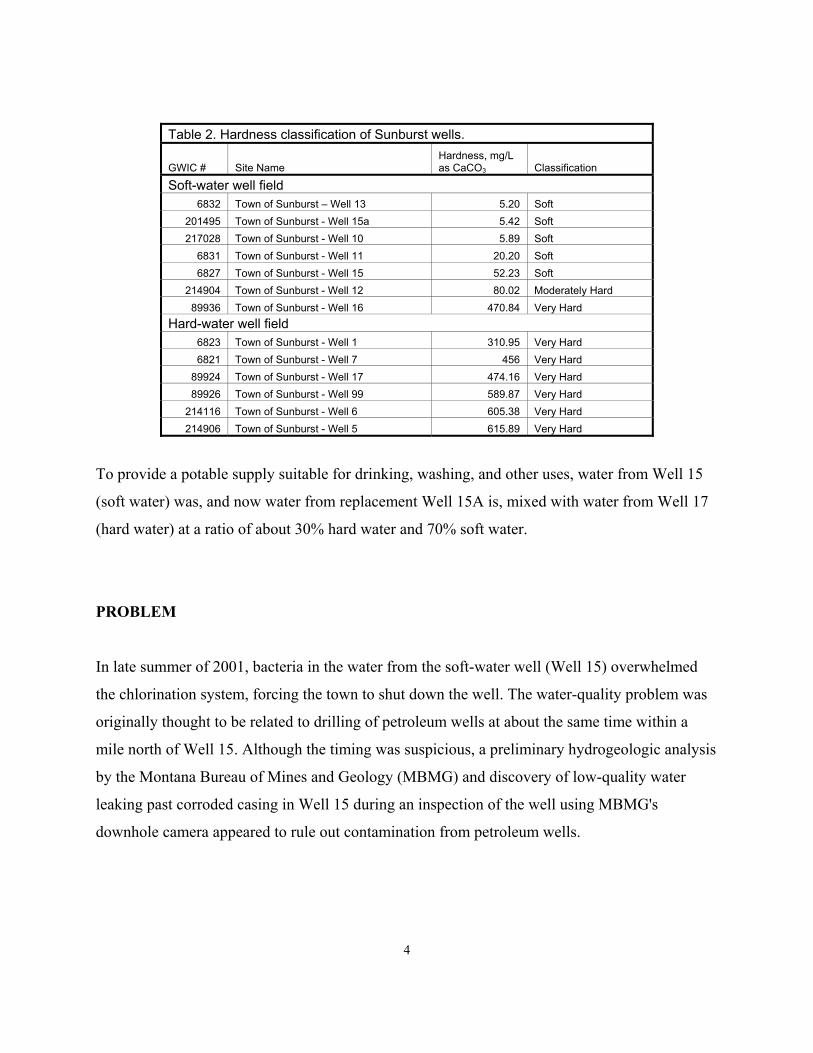
Table 2. Hardness classification of Sunburst wells.
GWIC # Site Name Hardness, mg/L as CaCO3 Classification
Soft-water well field 6832 Town of Sunburst – Well 13 5.20 Soft
201495 Town of Sunburst - Well 15a 5.42 Soft 217028 Town of Sunburst - Well 10 5.89 Soft
6831 Town of Sunburst - Well 11 20.20 Soft 6827 Town of Sunburst - Well 15 52.23 Soft
214904 Town of Sunburst - Well 12 80.02 Moderately Hard 89936 Town of Sunburst - Well 16 470.84 Very Hard
Hard-water well field 6823 Town of Sunburst - Well 1 310.95 Very Hard 6821 Town of Sunburst - Well 7 456 Very Hard
89924 Town of Sunburst - Well 17 474.16 Very Hard 89926 Town of Sunburst - Well 99 589.87 Very Hard
214116 Town of Sunburst - Well 6 605.38 Very Hard 214906 Town of Sunburst - Well 5 615.89 Very Hard
To provide a potable supply suitable for drinking, washing, and other uses, water from Well 15
(soft water) was, and now water from replacement Well 15A is, mixed with water from Well 17
(hard water) at a ratio of about 30% hard water and 70% soft water.
PROBLEM
In late summer of 2001, bacteria in the water from the soft-water well (Well 15) overwhelmed
the chlorination system, forcing the town to shut down the well. The water-quality problem was
originally thought to be related to drilling of petroleum wells at about the same time within a
mile north of Well 15. Although the timing was suspicious, a preliminary hydrogeologic analysis
by the Montana Bureau of Mines and Geology (MBMG) and discovery of low-quality water
leaking past corroded casing in Well 15 during an inspection of the well using MBMG's
downhole camera appeared to rule out contamination from petroleum wells.

5
A sample collected by the Montana Department of Environmental Quality was found to contain
large amounts of sulfur-reducing bacteria (SRB) (greater than 100 colony-forming units per
milliliter). Inspection of the casing using MBMG's downhole camera indicated that a likely
source for SRB was poor-quality water from shallow aquifers entering the well through holes
caused by corrosion of the steel casing below 80 ft (fig. 3). A sample from the top of the water
column in the well suggested contamination by sodium-sulfate water, perhaps derived from
dryland salinity associated with crop/fallow farming practices. The specific conductance of the
water (a measure of dissolved constituents) suggested that the sample contained over 3 times the
level of dissolved constituents as was found in a sample collected by MBMG staff in 1995.
Crop/fallow farming has been practiced for years up-gradient (east) from the soft-water wells.
Without the soft-water well, water supplied to the system was too hard for washing so an attempt
was made to cement an 8-in plastic liner from below the bottom of the steel casing to the surface.
The attempt was unsuccessful and Sunburst had to drill a replacement, Well 15A. Water quality
of the replacement well is similar to pre-2001 samples, which supports the theory that
contamination was from shallow zones through holes corroded in the casing.
Figure 3. Dark stains caused by water entering Well 15 through corroded casing.

6
Well 15 was drilled in 1945, and Sunburst has 11 other wells with steel casings that were drilled
between 1936 and 1951. The condition of the casings was unknown in 2001. Most of these wells
were open to potential contamination from surface sources, and some had oil, grease, and other
debris floating on the water. When the wells were turned over to Sunburst, the pumps (line shaft
turbine pumps driven from the surface) were pulled from 4 wells; an additional 3 wells likely
never had pumps. Secure caps or covers were not in place on Wells 6, 7, and 99. Uncapped wells
potentially provide pathways for contamination of the Virgelle Formation and allow animals to
fall into the well, or rocks or other objects to be introduced. A layer of grease found floating on
top of the water in some wells was a possible nutrient source for bacteria.
The well assessment indicated that plugging and abandonment of unneeded wells and renovation
of two backup wells was necessary to prevent the failure of additional well casings. Failure
would allow poor-quality water from shallow zones to contaminate the Virgelle aquifer and
possibly render the aquifer unusable in the vicinity of the Sunburst wells, with the result that
Sunburst would be forced to find a new water source.
Recognizing the vulnerability of the system to problems arising from contamination or system malfunctions, Sunburst applied for a Reclamation and Development Grants Program (RDGP) grant to protect the system from future problems by identifying the source of the contamination encountered, evaluating the condition of all the wells, and rehabilitating additional wells for use as backup supply wells. Plugging, abandonment, or renovation of these wells would close pathways for entry of
contaminants from the surface via uncapped casings or from poor-quality water from shallow
aquifers via corroded casing. SRB like the type that appeared in Well 15 in 2001 can be difficult
to control and impossible to remove from an aquifer such as the Virgelle Formation. This project
was meant to provide the town of Sunburst with assistance in renovating their wells and in
developing their ground-water resources in a manner that protects the environment and provides
a supply of safe drinking water. Protecting the Virgelle aquifer will protect the health, safety, and
welfare of residents of Glacier and Toole counties who rely on water from that source, as well as
the residents of Sunburst. Cleaning, plugging/abandoning, or renovating the Sunburst wells will
protect the integrity of the resource now and in the future.

7
HYDROGEOLOGIC EVALUATION
MBMG staff assembled available data on the Sunburst and nearby wells from the Ground-Water
Information Center (GWIC) database and other sources including Montana Salinity Control
Association (MSCA) sites (Brown and Holzer, pers. comm., 2006). Most wells in the area had
been inventoried and sampled during earlier studies published by MBMG (Norbeck and Miller,
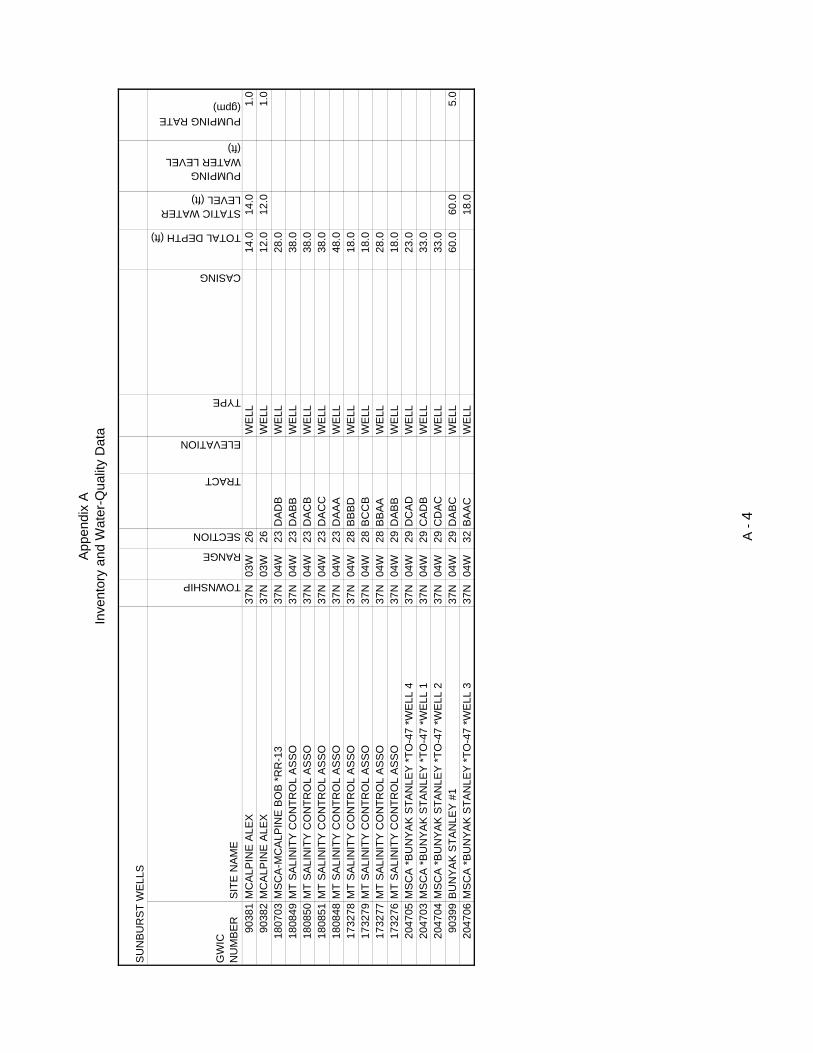
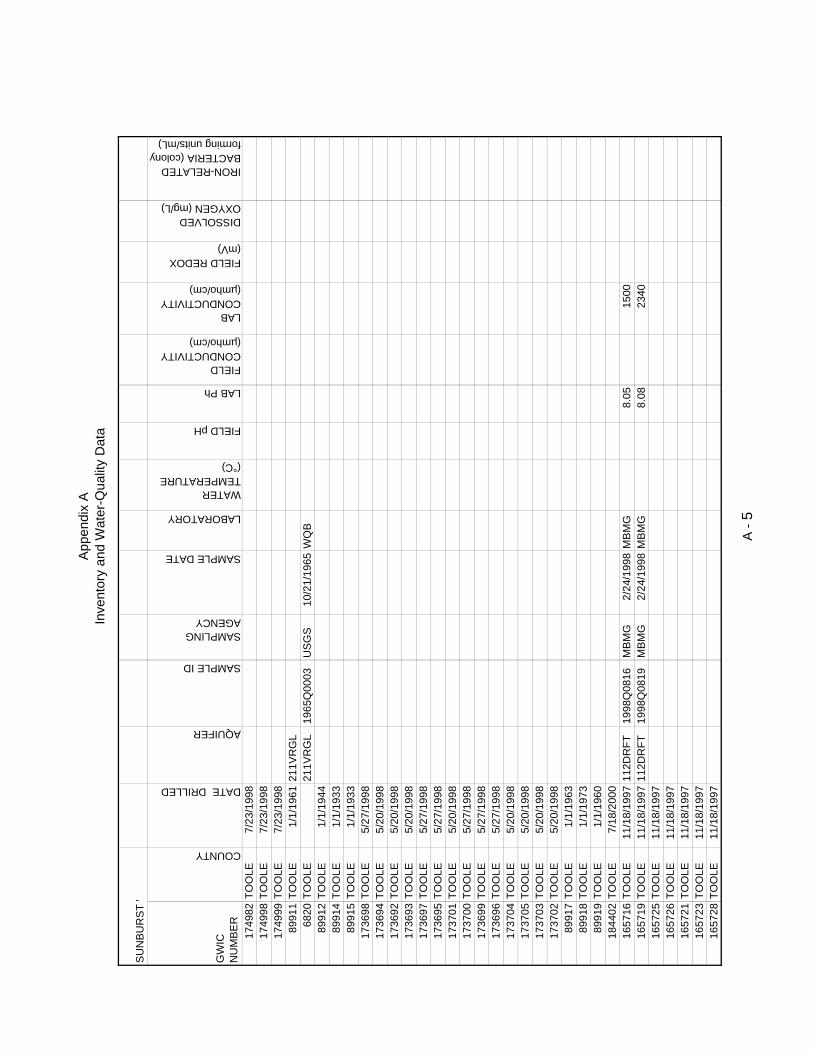
2000; Zimmerman, 1967). Appendix A presents the water-well inventory and water-quality data
used in this evaluation.
Physical Condition of Wells
Nine wells could not be measured, sampled, or inspected with a downhole camera. Five of these
had non-functional pumps, and 4 other wells had oil and grease or other debris floating on the
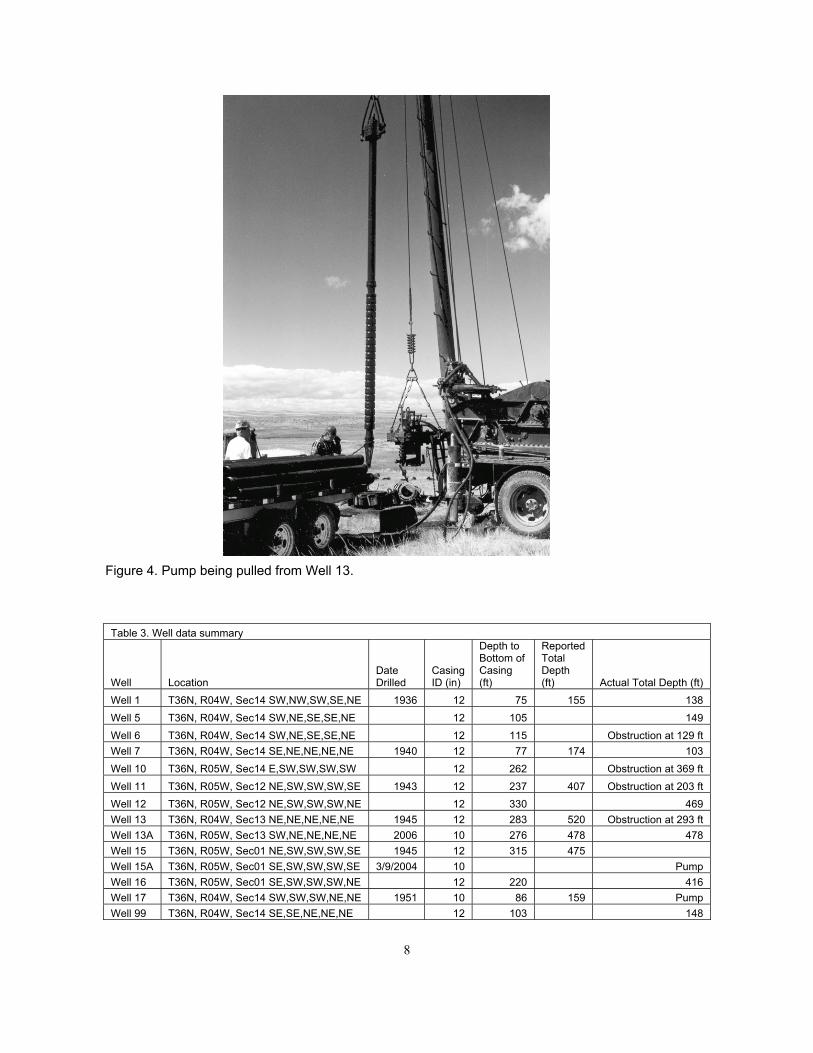
water. A drilling contractor was hired to pull the pumps and clean out the wells. Turbine pumps
were pulled from Wells 1, 11, and 13, and piston pumps were pulled from 12 and 16 (fig 4).
Wells 7 and 99 were cleaned of floating grease, and Wells 5 and 6 were cleaned of other debris
by bailing.
MBMG inspected the well bores and casing (table 3) using a downhole camera. Water in most of
the wells exhibited high levels of suspended sediment, making it difficult to obtain a clear picture
of the casing or borehole below the water table. Appendix B presents logs prepared from the
downhole camera tapes. Obstructions were found in some wells, such as wood in Well 6; a
turbine shaft and discharge pipe (presumably attached to a pump) in Well 99; and a ¼-in pipe in
Well 13. Well 11 had an obstruction at a depth of 203 ft that appeared to be the bottom of the
casing (the reported depth was 237 ft); the contractor was unable to remove or drill out the
obstruction.
Corroded casings that allowed water from shallow zones to enter wells were discovered in Wells
11, 12, and 16 (soft water). Available data for Sunburst wells suggested that casings were not
cemented, allowing corrosive waters from shallow zones to contact the casings.
8
Table 3. Well data summary
Well Location
Date Drilled
Casing ID (in)
Depth to Bottom of Casing (ft)
Reported Total Depth (ft) Actual Total Depth (ft)
Well 1 T36N, R04W, Sec14 SW,NW,SW,SE,NE 1936 12 75 155 138 Well 5 T36N, R04W, Sec14 SW,NE,SE,SE,NE 12 105 149 Well 6 T36N, R04W, Sec14 SW,NE,SE,SE,NE 12 115 Obstruction at 129 ft Well 7 T36N, R04W, Sec14 SE,NE,NE,NE,NE 1940 12 77 174 103 Well 10 T36N, R05W, Sec14 E,SW,SW,SW,SW 12 262 Obstruction at 369 ft Well 11 T36N, R05W, Sec12 NE,SW,SW,SW,SE 1943 12 237 407 Obstruction at 203 ft Well 12 T36N, R05W, Sec12 NE,SW,SW,SW,NE 12 330 469 Well 13 T36N, R04W, Sec13 NE,NE,NE,NE,NE 1945 12 283 520 Obstruction at 293 ft Well 13A T36N, R05W, Sec13 SW,NE,NE,NE,NE 2006 10 276 478 478 Well 15 T36N, R05W, Sec01 NE,SW,SW,SW,SE 1945 12 315 475 Well 15A T36N, R05W, Sec01 SE,SW,SW,SW,SE 3/9/2004 10 Pump Well 16 T36N, R05W, Sec01 SE,SW,SW,SW,NE 12 220 416 Well 17 T36N, R04W, Sec14 SW,SW,SW,NE,NE 1951 10 86 159 Pump Well 99 T36N, R04W, Sec14 SE,SE,NE,NE,NE 12 103 148
Figure 4. Pump being pulled from Well 13.

9
Hydrogeologic Properties
Aquifer tests were conducted while pumping the wells to obtain samples (table 4). Initial testing
and sampling was done using a 10 gallon-per-minute (gpm) pump. Wells 5, 6, 13, and 11 were
selected for additional testing based on data from initial tests, water quality, and proximity to the
existing delivery system. A 3-phase pump was used to test these wells further at discharge rates
ranging from 23 to 50 gpm for several hours. Wells 5 and 13 are adjacent to the Sunburst
pipeline and were found to be capable of supplying 175 gpm or more, so they were chosen for
rehabilitation.
Table 4. Aquifer test data
Site Test Date
Pumping Rate (gpm)
Pumping Rate (ft3/min)
Test Duration (min)
Trans-missivity (ft2/min)
Trans-missivity (gpd/ft)
Stor-ativity
Hard-water well field SB-1 10/06/04 11.5 1.54 124 17.27 186,019 1.2 × 10⁻⁹
SB-5 10/05/04 12.0 1.60 73 216.20 2,328,733 5.0 × 10⁻¹
SB-5 08/09/05 50.5 6.75 289 31.26 336,708 3.9 × 10⁻²
SB-6 10/04/04 11.3 1.51 46 2.17 23,400 1.1 × 10⁻⁶
SB-6 08/10/05 23.8 3.18 170 4.60 49,558 5.0 × 10⁻⁶
SB-7 10/05/04 12.0 1.60 135 1.50 16,146 SB-99 10/05/04 10.6 1.42 61 4.78 51,486 1.1 × 10⁻⁴
Soft-water well field SB-10 01/28/05 8.0 1.07 117 0.11 1,149 SB-11 10/06/04 12.7 1.69 96 0.96 10,302 1.6 × 10⁻²
SB-11 06/14/05 4.5 0.59 480 0.75 8,025 1.4 × 10⁻¹
SB-11 08/10/05 45.8 6.12 131 0.84 9,081 3.8 × 10⁻³
SB-12 10/07/04 5.0 0.66 28 0.02 167 2.2 × 10⁻²
SB-13 10/06/04 9.6 1.28 139 1.01 10,868 4.6 × 10⁻³
SB-13 01/27/05 4.3 0.57 101 1.83 19,711 3.1 × 10⁻⁶
SB-13 06/15/05 3.0 0.40 300 0.95 10,214 1.1 × 10⁻²
SB-13 08/11/05 31.6 4.23 317 1.18 12,710 1.4 × 10⁻⁵
SB-15A 03/09/04 200.0 26.74 75 0.96 10,312 SB-16 10/07/04 10.4 1.39 75 0.68 7,333 2.1 × 10⁻³
Analyzed using the Papadopoulus pumped well technique SB-15A 02/14/03 220 1440 0.36 3,860 1.0 × 10⁻⁵
SB-17 250 0.95 10,238 5.0 × 10⁻⁵
T (gpd/ft) estimated from specific capacity (gpm/ft of drawdown) times 2,000 Lognormal mean values for Wells 5 and 17 200,227 9.9 × 10⁻³
Lognormal mean values for Wells 15A and 13 10,171 1.2 × 10⁻⁴

10
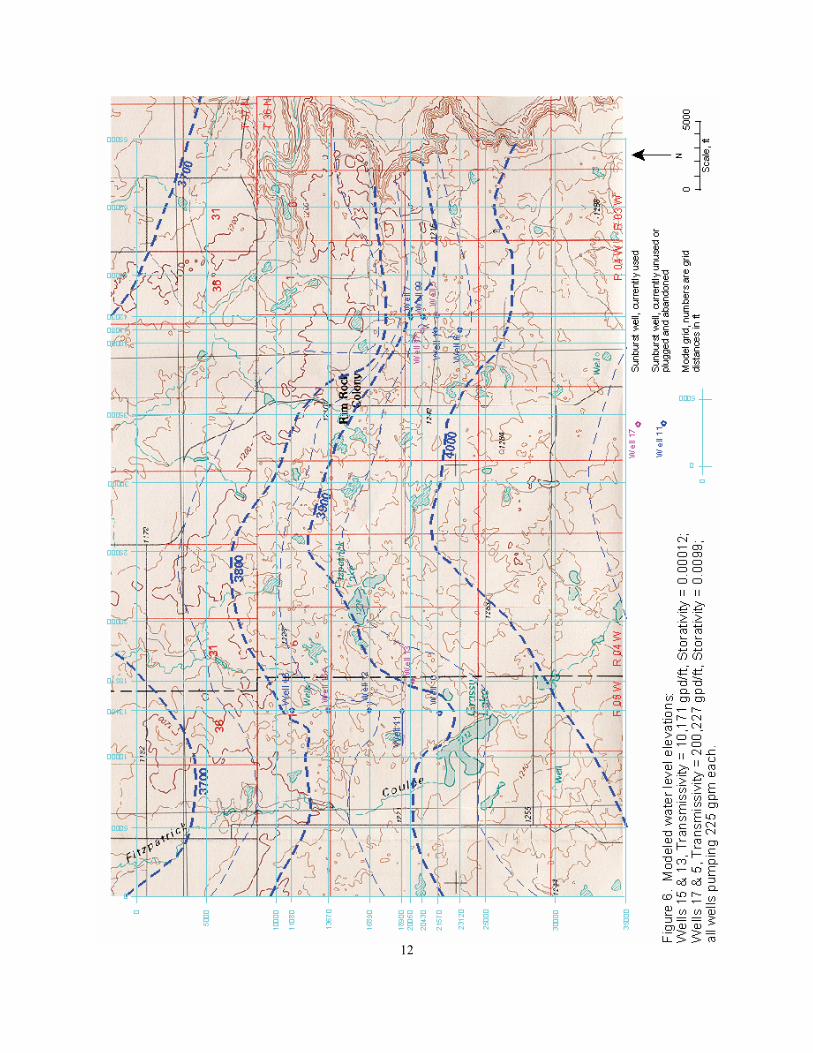
Aquifer properties from the pump tests were used in a numeric ground-water model (King, 1984)
to compare estimated drawdowns with Wells 15, 17, 5, and 13 pumping at discharge rates of 225
gpm per well to measured water levels with Wells 15A and 17 pumping. Values used in the
model runs were: for the hard-water wells, transmissivity, T = 200,227 gallons per day per foot
(gpd/ft) and storativity (unitless), S = 0.0099; and for the soft-water wells, T = 10,171 gpd/ft and
S = 0.00012. A 5,000-ft grid was laid out over the base map for figures 5 and 6, with additional
grid lines so that each well was on or near a grid intersection. Calibration runs were done with
Well 17 pumping 200 gpm (T = 200,227 gpd/ft and S = 0.0099), and with Well 15A pumping
175 gpm (T = 10,171 gpd/ft and S = 0.00012). The model estimated a drawdown of 46 ft for
Well 17, compared to 32 ft of drawdown based on a reported static water level of 49.2 ft and a
reported pumping water level of 81.3 ft from the GWIC database. The modeled drawdown for
Well 15A was 34 ft, compared to 20 to 40 ft of drawdown based on an estimated static water
level of 3,910 to 3,930 ft and a measured water level of 3,890 ft. The model was run first with
Wells 5 and 17 pumping 225 gpm each (T = 200,227 gpd/ft and S = 0.0099) and second with
Wells 15A and 13 pumping 225 gpm each (T = 10,171 gpd/ft and S = 0.00012). Estimated
drawdowns from both model runs were then summed, and the results were contoured in figure 6.
Contours in figure 5 are the measured water levels with Wells 15A and 17 pumping. The
additional drawdown estimated by the model with Wells 5 and 13 pumping is 100 ft at Well
15A, 60 ft at Well 13, 30 ft at Well 5, and 10 ft at Well 17 (fig. 6). Estimated water levels do not
fall below the top of the Virgelle Formation. Actual pumping rates will be less than the 225 gpm
per well used in the model.
Water Quality
Historical water-quality data are presented in figures 7, 8, and 9 and in Appendix A for the
glacial till, Two Medicine Formation, and Virgelle Formation. Analytical parameters included
major anions and cations, metals, total petroleum hydrocarbons, iron-related bacteria, and SRB.
Analytical data, summarized in table 5, are included in Appendix A.

11
12
��������
���������� �����������
��������
� ���
� �
� ���
� ���
� ���
� ���
� ���
� ���
� ��
� ��
� ���
� ��
������������� �������������������������� �������������� ����� ���!��������
�
�
�
�
�
�
�
�
�
�
����� �� ��
�� �
��
���
�� ��
����
�� �
����
����
����
��
� � �����
"�� ��#���������$���%����� ����&�������'��������()��*�
��������
���������� �����������
��������
� ���
� �
� ���
� ���
� ���
� ���
� ���
� ���
� ��
� ��
� ���
� ��
������������� �������������������������� �������������� ����� ���!��������
��
��
��
��
��
��
���
�
�
�
��
�
� � � �
������
��
���
�� ��
����
�����
�����
����
�����
�� �
� �����
�
�
��
�
�
��
�
��
��
��
��
��
��
"�� ��#���������$���%����� ����&�����'��(%�)���*����"��������+,��-�

��������
���������� �����������
��������
� ���
� �
� ���
� ���
� ���
� ���
� ���
� ���
� ��
� ��
� ���
� ��
������������� �������������������������� �������������� ����� ���!��������
������
������
��������
�
��
������
��
��
��
������ ��������
��
����������
����� �������� ����
��
��
��
���������
�����
��
�
� �
������
��
���
�� ��
����
�����
�����
����
�����
�� �
� �����
��
��
��
� �
�� �
� �� ��
�
��
��
��
��
�
��
��
�� ��
��
��
� � � �� ��
��
��
��
�� � ����
�� ��
�� ��
"�� ��#���������$���%����� ����&�����'��(������"��������)* �+�

Ta
ble
5. W
ell m
easu
rem
ents
and
wat
er-q
ualit
y su
mm
ary
Wel
l D
ate
Inve
ntor
ied
Sta
tic
Wat
er
Leve
l (ft)
Pum
ping
W
ater
Le
vel (
ft)
Pum
ping
R
ate
(gpm
) Te
mpe
r-at
ure
°C
Fiel
d P
h
Fiel
d S
C
(µm
hos/
cm
) E
h (m
illiv
olts
)
Dis
solv
ed
Oxy
gen
(mg/
L)
Tota
l D
isso
lved
S
olid
s (m
g/L)
IRB
(c
olon
y fo
rmin
g un
its p
er
mill
ilite
r)
SR
B (c
olon
y fo
rmin
g un
its p
er
mill
ilite
r)
Wel
l 1
10/6
/200
4 92
.70
94.1
5 11
.5
9.8
7.2
1463
-1
12.0
1.
9 15
13
5,00
0 1,
000
Wel
l 5
10/5
/200
4 11
6.50
11
6.55
12
.0
9.0
7.0
1414
-1
05.2
4.
5 12
53
48,0
00
1–10
Wel
l 5
8/9/
2005
11
6.23
11
7.00
50
.5
11.3
6.
3 20
19
-32.
3 6.
2 12
92
5,00
0 1–
10
Wel
l 6
9/24
/200
4 12
4.75
11.5
8.
7 7.
07
1259
.0
-60.
5 9
1,20
2
Wel
l 6
10/4
/200
4 12
4.07
12
5.84
11
.3
8.2
6.9
1280
-9
3.2
4.9
1308
5,
000
50,0
00
Wel
l 6
8/10
/200
5 12
4.50
13
2.90
23
.8
8.8
7.1
1398
-7
0.8
3.6
1309
5,
000
1–10
W
ell 7
10
/5/2
004
82.4
2 85
.81
11.7
10
.2
7.0
1212
-7
3.1
1.3
1207
48
,000
1,
000-
10,0
00
Wel
l 10
1/28
/200
5 11
5.2
132.
45
8.0
7.7
8.7
1541
-2
68.0
1.
5 11
80
100,
000
10-1
00
Wel
l 11
10/6
/200
4 71
.8
82.3
7 12
.7
8.9
8.4
1311
-1
99.3
1.
7 11
77
5,00
0 50
,000
Wel
l 11
6/14
/200
5 77
.72
126.
03
45.6
13
.1
8.5
1338
-2
95.0
1.
1 32
62
>10,
000
>5,0
00
Wel
l 12
10/7
/200
4 19
2.82
22
4.63
5.
0 10
.6
7.7
3920
-2
4.6
7.5
3671
50
,000
10
0,00
0
Wel
l 13
10/6
/200
4 20
8.83
21
8.68
9.
6 9.
9 8.
9 15
47
-304
.4
1.0
1099
10
0,00
0 10
0,00
0
Wel
l 13
1/27
/200
5 20
4.42
20
7.96
4.
3 7.
9 8.
9 12
31
-256
.0
2.5
1347
48
,000
1–
10
Wel
l 13
8/11
/200
5 24
0.17
27
0.10
31
.6
10.6
8.
6 16
26
-284
.0
1.1
1335
>1
0,00
0 >5
,000
W
ell 1
5 5/
7/20
02
158.
20
25
0.0
8.
2 45
90
4116
>1
00
W
ell 1
5A
3/9/
2004
15
4.53
27
7.50
20
0.0
8.8
8.9
1480
-2
08.7
3.
2 13
57
48,0
00
10–1
00
Wel
l 15A
1/
28/2
005
7.
4 7.
7 98
9 -2
58.8
2.
0 10
92
48,0
00
<1
Wel
l 16
10/7
/200
4 16
9 18
2.34
10
.4
9.2
7.4
5170
-7
8.8
2.8
4624
50
,000
50
,000
W
ell 1
7 3/
9/20
04
49.1
6 81
.25
250.
0 8.
0 6.
8 10
78
-121
.8
3.6
793
5,00
0 <1
W
ell 9
9 9/
2/20
04
104.
30
11
.7
8.6
7.1
1246
-2
5.4
2.6
984
5,00
0 1–
10
Wel
l 99
10/5
/200
4 10
3.55
10
6.60
10
.6
10.2
6.
9 12
53
-16.
0 3.
2 12
17
5,00
0 1–
10
16
17
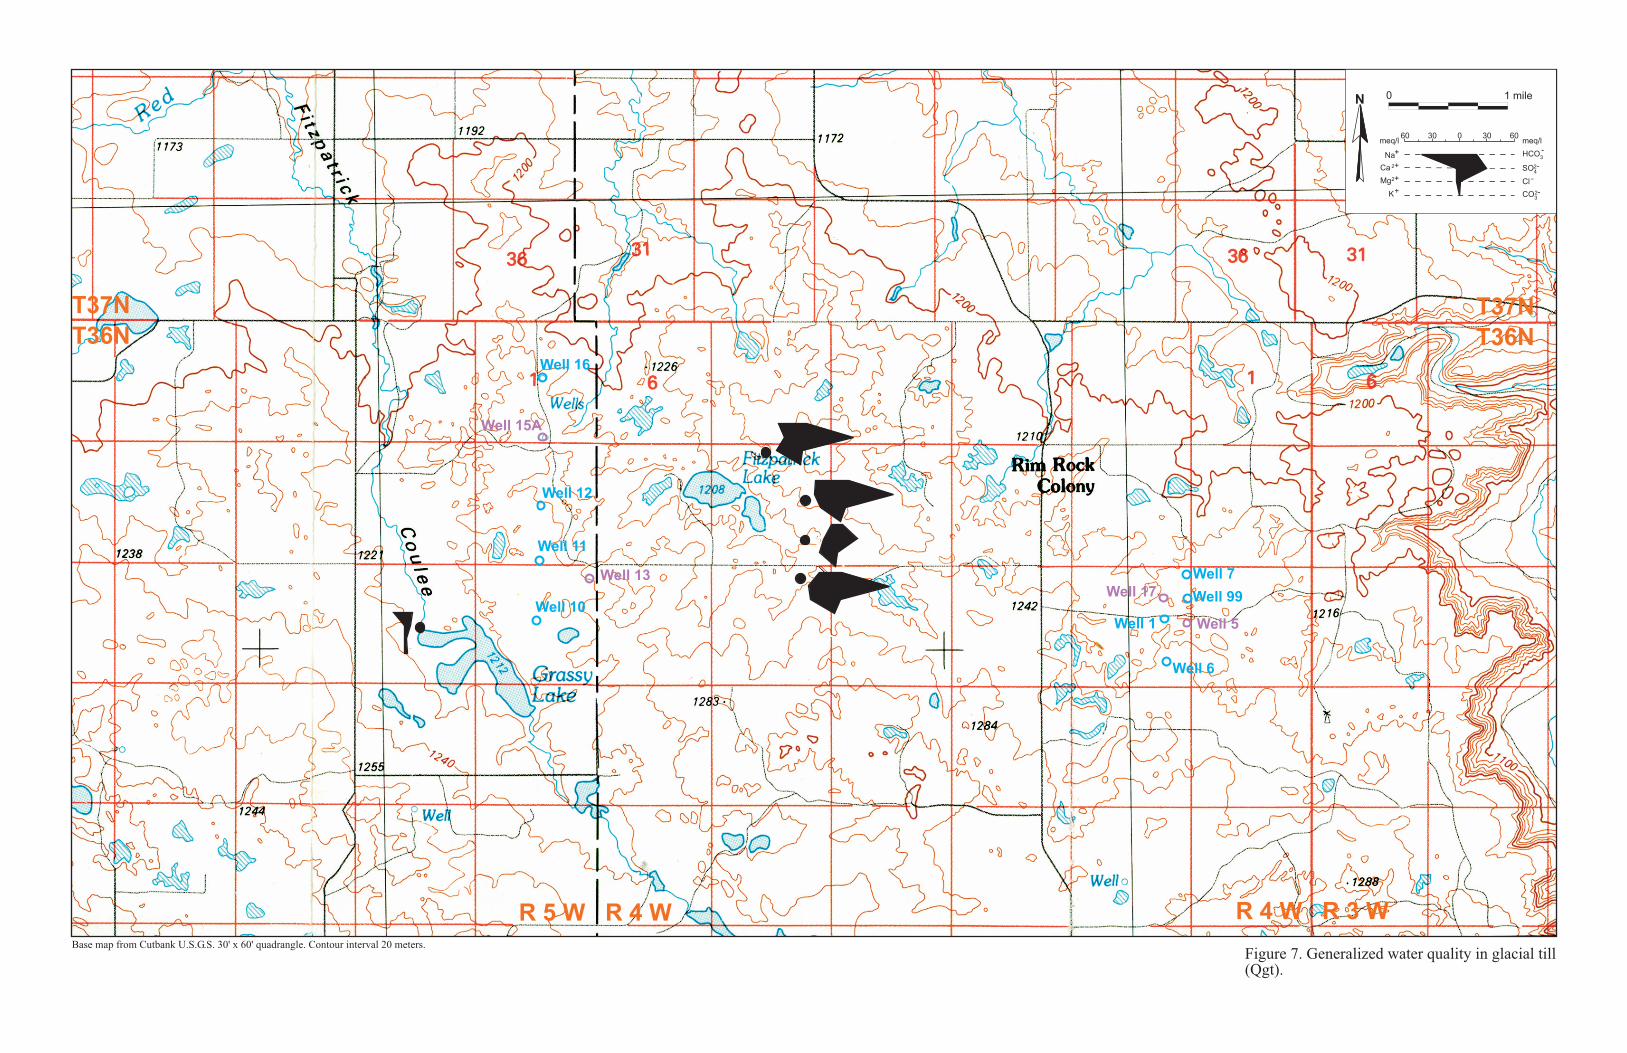
Most wells completed in the glacial till were constructed by the MSCA during their dryland
salinity studies (Brown and Holzer, pers. comm., 2006). Data from these and other wells suggest
that ground water within the till is dominated by sodium and bicarbonate, or calcium and sulfate,
and have total dissolved solids (TDS) concentrations of less than 2,000 milligrams per liter
(mg/L). Where water in the till is affected by dryland salinity, the TDS levels are greater than
4,000 mg/L, and the ionic constituents are dominantly sodium, calcium, magnesium, and sulfate
(fig. 7).
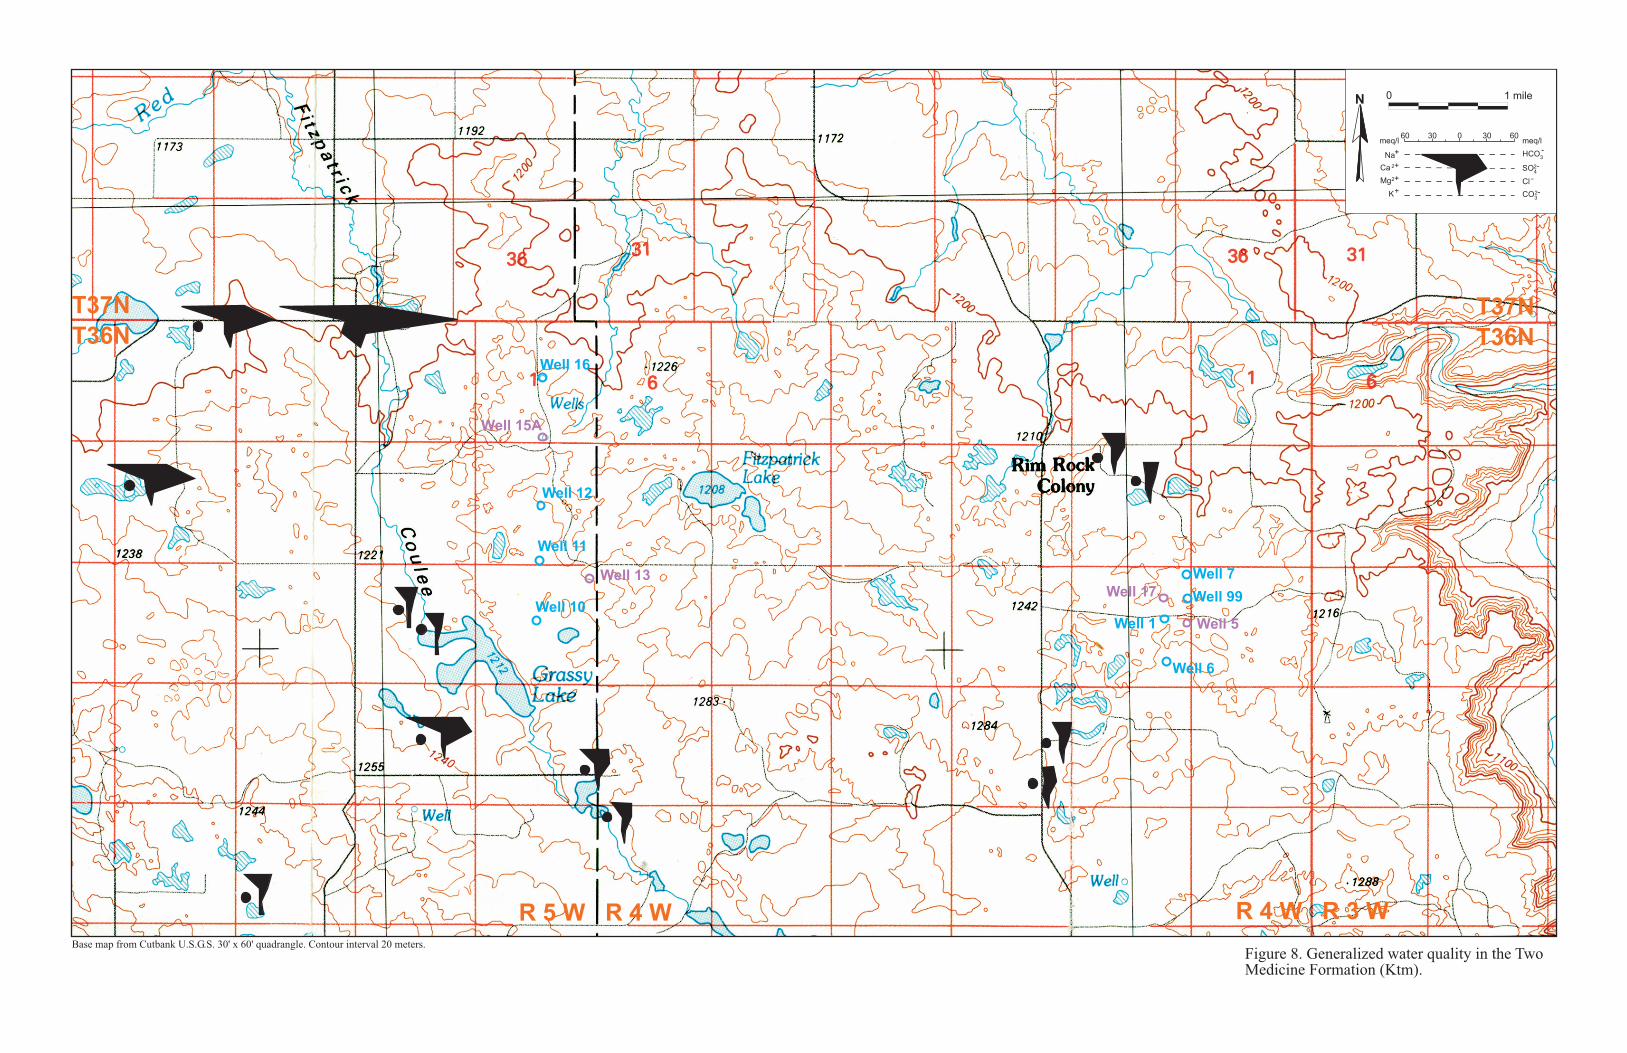
Wells completed in the Two Medicine Formation are dominated by sodium, sulfate, and
bicarbonate with TDS concentrations less than 2,200 mg/L (fig. 8). Where the Two Medicine is
thought to have been impacted by saline seep, the water is dominated by sodium and sulfate with
TDS levels greater than 3,500 mg/L.
Ground water found in the Virgelle Formation typically is dominated by sodium, sulfate, and
bicarbonate with TDS levels less than 2,000 mg/L (fig. 9). Samples collected from 3 of the
Sunburst wells during 2002 (Well 15) and 2004 (Wells 12 and 16) were found to be high in
sodium and sulfate, suggesting possible contamination from saline-seep-affected water.
WELL PLUGGING AND ABANDONMENT
Wells 1, 7, and 99 (hard water) and Wells 10, 11, and 12 (soft water) were plugged and
abandoned because yields were too low or obstructions were found in the well (Well 11). Well 1
was plugged and abandoned because it is too close to Well 17 and excessive drawdown was
predicted if both wells were pumped at the same time, and because past use of the well caused
stained fixtures. The wells were filled with bentonite chips (Kwik-Plug environmental hole
abandonment material), the casings were excavated to a depth of about 4 ft, cut off, and the sites
were backfilled to approximate original grade. Well 16, which yielded hard water although the
location is in the soft water field, was also sealed.
18
WELL RENOVATION OR REPLACEMENT
Based on sampling and aquifer testing, Well 5 (hard water) and Well 13 (soft water) were
selected for rehabilitation and use as backup supply wells and to supply additional water for
future demand growth.
Aquifer properties indicated that Well 13 (soft water) could yield 200 gpm without drawing
down to the top of the Virgelle. An 8-in casing is the minimum size necessary to allow
installation of a pump capable of 200 gpm. Well 13 was already cased with 10-in steel, making it
difficult or impossible to successfully cement in an 8-in liner. An attempt was made to pull the
10-in casing, but when the casing could not be pulled, a new well was drilled to a depth of 478 ft
and cased with 8-in steel at a site about 300 ft southwest of the original well.
Aquifer test data suggest that Well 5 was capable of yielding 300 gpm with less than 5 ft of
drawdown. The well was 146 ft deep with 12-in steel casing from the surface to a depth of 102
ft. Because the steel casing was probably not cemented and might be subject to corrosion by
shallow water, an 8-in casing was cemented from surface to 110 ft. When the well was cleaned
out after being relined the yield was found to be only 15 gpm, suggesting that the prolific
producing horizon may have been the glacial till, which may be subject to contamination from
saline seep caused by crop/fallow farming in the fields immediately upgradient. The additional
cost of replacing Well 13 precluded connecting the backup wells to the system.
SUMMARY
The town of Sunburst was given 12 water wells in 1961 after the Texas Oil Company shut down
their refinery. A hard-water well (Well 17) and a soft-water well (Well 15) have provided the
town with municipal water since that time. In 2001, corrosion in the steel casing in Well 15
allowed poor quality water from shallow horizons (about 80–85 ft) to enter the well. After an
unsuccessful attempt to save the well by cementing an 8-in liner from the surface to below the
bottom of the 12-in steel casing, the well was plugged and a replacement drilled. The likely

19
cause of water-quality problems is related to dryland salinity resulting from crop/fallow farming
practices upgradient of the soft-water wells.
Sunburst applied for an RDGP grant to plug and abandon unused wells and rehabilitate 2 wells
for use as backup wells. MBMG evaluated the wells, recommended wells to be rehabilitated
(Wells 5 and 13), and supervised abandonment and rehabilitation efforts. Seven wells were
sealed by filling with bentonite, cutting the casing off below ground, and backfilling to the
approximate original grade. In addition, Well 13 was sealed because it could not be rehabilitated,
so a replacement well was drilled. Well 5 was lined by cementing 8-in pipe from surface to
below the bottom of the existing casing, but in doing so, the yield of the well was reduced from
over 200 to about 15 gpm.
The additional cost of replacing Well 13 precluded connecting the backup wells to the system.
RECOMMENDATIONS
The replacement Well 13 should be connected to the Sunburst water system. Additional
sampling should be conducted for representative wells completed in the glacial till to: (1)
determine if the corrosive water encountered in some soft-water wells is caused by saline seep,
(2) determine if corrosive water poses a threat to the hard-water wells, and 3) determine the
source of the high yield originally seen in Well 5.
Because Well 5 is no longer capable of producing sufficient water for use as a supply well for the
town of Sunburst, further investigation may be warranted for Well 6. The well should be cleaned
out to the approximate original depth, the yield checked again, the well re-examined with the
downhole camera to facilitate installation of an 8-in liner, and if the well proves to be usable, a
liner should be cemented in place from the surface to just below the 12-in casing.
20
REFERENCES
Berg, R.B., 2002, Geologic map of the Cut Bank 30' x 60' quadrangle: Montana Bureau of Mines
and Geology Open-File Report 454, 10 p., 1 sheet(s), 1:100,000.
Brown, Scott and Holzer, Jane, 2006, Montana Salinity Control Association, Conrad, MT,
Personal communication.
Hem, John D., 1992, Study and interpretation of the chemical characteristics of natural water:
U.S. Geological Survey Water-Supply Paper 2254, Third Edition, 263 p.
King, James M., 1984, Computing Drawdown Distributions Using Microcomputers: Ground
Water, Vol. 22, No. 6, pp. 780-784.
Lopez, D.A., 2002, Geologic map of the Sweet Grass Hills 30' x 60' quadrangle, north-central
Montana: Montana Bureau of Mines and Geology Open-File Report 443, 4 p., 1 sheet(s),
1:100,000.
National Oceanic and Atmospheric Administration (NOAA) website, 2006,
http://www.wrh.noaa.gov/tfx/dx.php?wfo=tfx&type=clm&loc=products&fx=CLMGTF2
003 .
Norbeck, P.M., and Miller, K.J., 2000, Evaluation of non-point source pollution in the Red River
watershed, Glacier and Toole counties, Montana: Montana Bureau of Mines and Geology
Open-File Report 396, 176 p.
Zimmerman, E.A., 1967, Water resources of the Cut Bank area, Glacier and Toole counties,
Montana: Montana Bureau of Mines and Geology Bulletin 60, 37 p.
Appendix A
Water-Well Inventory and Water-Quality Data

App
endi
x A
Inve
ntor
y an
d W
ater
-Qua
lity
Dat
a
GW
IC
NU
MB
ER
S
ITE
NA
ME
TOWNSHIP
RANGE
SECTION
TRACT
ELEVATION
TYPE
CASING
TOTAL DEPTH (ft)
STATIC WATER LEVEL (ft)
PUMPING WATER LEVEL (ft)
PUMPING RATE (gpm)
SU
NB
UR
ST
WE
LLS
1749
82N
ICH
OLS
STE
VE
#1
36N
03W
18B
WE
LL14
.017
4998
NIC
HO
LS S
TEV
E #
236
N03
W18
BW
ELL
13.0
1749
99N
ICH
OLS
STE
VE
#3
36N
03W
18B
WE
LL13
.089
911
HE
ND
RIC
K J
AM
ES
36N
03W
19B
BD
BW
ELL
145.
040
.068
20G
ILLE
SP
IE E
AR
L *
4 M
I NE
MTN
VIE
W S
CH
OO
L36
N03
W19
CC
WE
LL15
0.0
114.
84.
089
912
GIL
LES
PIE
EA
RL
36N
03W
19C
CA
WE
LL15
0.0
60.0
4.0
8991
4G
OE
DD
ER
TZ A
.H. #
136
N03
W30
CB
CD
WE
LL18
3.0
2.0
8991
5G
OE
DD
ER
TZ A
.H. #
236
N03
W30
DD
AC
WE
LL18
3.0
2.0
1736
98M
T S
ALI
NIT
Y C
ON
TRO
L A
SS
OC
*R
R-0
8 #1
236
N04
W2
BD
AD
WE
LL18
.017
3694
MT
SA
LIN
ITY
CO
NTR
OL
AS
SO
C *
RR
-08
#636
N04
W2
AB
AB
WE
LL18
.017
3692
MT
SA
LIN
ITY
CO
NTR
OL
AS
SO
C *
RR
-08
#736
N04
W2
AA
BA
WE
LL18
.017
3693
MT
SA
LIN
ITY
CO
NTR
OL
AS
SO
C *
RR
-08
#836
N04
W2
AA
DB
WE
LL28
.017
3697
MT
SA
LIN
ITY
CO
NTR
OL
AS
SO
C *
RR
-08
#11
36N
04W
2A
AC
CW
ELL
28.0
1736
95M
T S
ALI
NIT
Y C
ON
TRO
L A
SS
OC
*RR
-08
#10
36N
04W
2A
CA
AW
ELL
28.0
1737
01M
T S
ALI
NIT
Y C
ON
TRO
L A
SS
OC
*R
R-0
8 #0
536
N04
W2
CA
CB
WE
LL38
.017
3700
MT
SA
LIN
ITY
CO
NTR
OL
AS
SO
C *
RR
-08
#14
36N
04W
2B
AA
DW
ELL
38.0
1736
99M
T S
ALI
NIT
Y C
ON
TRO
L A
SS
OC
*R
R-0
8 #1
336
N04
W2
AC
CC
WE
LL43
.017
3696
MT
SA
LIN
ITY
CO
NTR
OL
AS
SO
C *
RR
-08
#936
N04
W2
AC
AD
WE
LL58
.017
3704
MT
SA
LIN
ITY
CO
NTR
OL
AS
SO
C *
RR
-08
#136
N04
W3
DD
CC
WE
LL18
.017
3705
MT
SA
LIN
ITY
CO
NTR
OL
AS
SO
C*R
R-0
8 #2
36N
04W
3D
DD
CW
ELL
35.0
1737
03M
T S
ALI
NIT
Y C
ON
TRO
L A
SS
OC
*R
R-0
8 #4
36N
04W
3D
DA
AW
ELL
38.0
1737
02M
T S
ALI
NIT
Y C
ON
TRO
L A
SS
OC
*R
R-0
8 #3
36N
04W
3D
AD
CW
ELL
58.0
8991
7S
UTA
G. P
ETE
R36
N04
W4
AA
CW
ELL
255.
060
.02.
089
918
SU
TA G
. PE
TER
36N
04W
4A
DB
WE
LL25
2.0
192.
025
2.0
10.0
8991
9S
WE
NS
EN
RA
LPH
36N
04W
7A
CA
WE
LL17
8.0
30.0
15.0
1844
02R
IMR
OC
K C
OLO
NY
36N
04W
7C
CD
WE
LL11
5.0
-4.6
30.0
1657
16M
T S
ALI
NIT
Y C
ON
TRO
L A
SS
OC
RR
CO
L *
SP
RR
-04
#136
N04
W8
DD
AD
WE
LL18
.07.
316
5719
MT
SA
LIN
ITY
CO
NTR
OL
AS
SO
C R
RC
OL
* S
PR
R-0
4 #2
36N
04W
8D
DB
BW
ELL
18.0
13.0
1657
25M
T S
ALI
NIT
Y C
ON
TRO
L A
SS
OC
RR
CO
L *
SP
RR
-04
#836
N04
W8
AB
AD
WE
LL20
.0>1
816
5726
MT
SA
LIN
ITY
CO
NTR
OL
AS
SO
C R
RC
OL
* S
PR
R-0
4 #1
036
N04
W8
BA
AA
WE
LL23
.0>2
2.4
1657
21M
T S
ALI
NIT
Y C
ON
TRO
L A
SS
OC
RR
CO
L *
SP
RR
-04
#436
N04
W8
AC
AD
WE
LL30
.0>3
016
5723
MT
SA
LIN
ITY
CO
NTR
OL
AS
SO
C R
RC
OL
* S
PR
R-0
4 #6
36N
04W
8A
DA
AW
ELL
30.0
>29.
516
5728
MT
SA
LIN
ITY
CO
NTR
OL
AS
SO
C R
RC
OL
* S
PR
R-0
4 #1
236
N04
W8
AC
BC
WE
LL38
.0>1
8.6
A -
1

App
endi
x A
Inve
ntor
y an
d W
ater
-Qua
lity
Dat
a
GW
IC
NU
MB
ER
S
ITE
NA
ME
TOWNSHIP
RANGE
SECTION
TRACT
ELEVATION
TYPE
CASING
TOTAL DEPTH (ft)
STATIC WATER LEVEL (ft)
PUMPING WATER LEVEL (ft)
PUMPING RATE (gpm)
SU
NB
UR
ST
WE
LLS
1657
15M
T S
ALI
NIT
Y C
ON
TRO
L A
SS
OC
RR
CO
L *
SP
RR
-04
#336
N04
W8
AD
CC
WE
LL38
.028
.316
5724
MT
SA
LIN
ITY
CO
NTR
OL
AS
SO
C R
RC
OL
* S
PR
R-0
4 #7
36N
04W
8A
CA
DW
ELL
38.0
>39
1657
20M
T S
ALI
NIT
Y C
ON
TRO
L A
SS
OC
RR
CO
L *
SP
RR
-04
#936
N04
W8
BA
AD
WE
LL38
.018
.416
5727
MT
SA
LIN
ITY
CO
NTR
OL
AS
SO
C R
RC
OL
* S
PR
R-0
4 #1
136
N04
W8
AB
CC
WE
LL43
.0>4
318
0720
MS
CA
*SP
RR
-O4-
436
N04
W8
AA
BC
WE
LL45
.016
5722
MT
SA
LIN
ITY
CO
NTR
OL
AS
SO
C R
RC
OL
* S
PR
R-0
4 #5
36N
04W
8A
AB
CW
ELL
45.0
>44
MS
CA
site
, U01
? 36
N04
W9
CC
DD
C40
15W
ELL
17.3
12.8
MS
CA
site
, ??
36N
04W
9C
DD
AD
4035
WE
LL20
.07.
589
920
SU
TA P
ETE
R &
JO
HA
NN
A36
N04
W9
BB
BW
ELL
149.
014
9.0
10.0
1737
18M
T S
ALI
NIT
Y C
ON
TRO
L A
SS
OC
*S
PTO
-06
#136
N04
W11
AC
BB
WE
LL48
.089
921
RIM
RO
CK
CO
LON
Y36
N04
W11
BB
AD
CD
WE
LL22
3.0
200.
08.
018
7898
RIM
RO
CK
CO
LON
Y36
N04
W11
BB
DW
ELL
200.
016
0.0
25.0
1501
52R
IMR
OC
K C
OLO
NY
- w
as S
unbu
rst #
936
N04
W11
CA
AA
CA
3960
WE
LL12
" ST
142.
413
0.2
5.0
1737
21M
T S
ALI
NIT
Y C
ON
TRO
L A
SS
OC
* S
PR
R-0
4 #1
336
N04
W17
AB
DD
WE
LL38
.08.
816
5729
RIM
RO
CK
CO
LON
Y *
WE
LL #
1336
N04
W17
AB
DD
WE
LL38
.017
3719
MT
SA
LIN
ITY
CO
NTR
OL
AS
SO
C *
SP
RR
-04
#15
36N
04W
17A
AC
AW
ELL
38.0
4.7
1657
30R
IMR
OC
K C
OLO
NY
* W
ELL
#15
36N
04W
17A
AC
AW
ELL
38.0
1657
17M
T S
ALI
NIT
Y C
ON
TRO
L A
SS
OC
RR
CO
L *
SP
RR
-04
#14
36N
04W
17A
BA
CW
ELL
38.0
8.5
1737
20M
T S
ALI
NIT
Y C
ON
TRO
L A
SS
OC
*S
PP
R-0
4 #1
636
N04
W17
AA
CA
WE
LL58
.016
5730
RIM
RO
CK
CO
LON
Y *
WE
LL #
1536
N04
W17
AA
CA
WE
LL38
.016
5729
RIM
RO
CK
CO
LON
Y *
WE
LL #
1336
N04
W17
AB
DD
WE
LL38
.089
927
GE
RR
ISH
C.D
.36
N04
W21
WE
LL24
0.0
10.0
8992
8B
ALD
WIN
BE
RT
36N
04W
22A
DC
CC
BW
ELL
201.
019
0.0
10.0
6824
GIL
LES
PIE
EA
RL
36N
04W
22D
CA
WE
LL14
5.0
118.
44.
018
0855
MT
SA
LIN
ITY
CO
NTR
OL
AS
SO
36N
04W
23A
BC
BW
ELL
18.0
1808
54M
T S
ALI
NIT
Y C
ON
TRO
L A
SS
O36
N04
W23
AB
AC
WE
LL28
.018
0852
MT
SA
LIN
ITY
CO
NTR
OL
AS
SO
36N
04W
23A
AD
BW
ELL
38.0
1808
56M
T S
ALI
NIT
Y C
ON
TRO
L A
SS
O36
N04
W23
AC
AB
WE
LL38
.018
0853
MT
SA
LIN
ITY
CO
NTR
OL
AS
SO
36N
04W
23A
BC
AW
ELL
48.0
8993
0B
ALD
WIN
BE
RT
36N
04W
23D
BB
CD
DW
ELL
225.
021
5.0
10.0
8993
1W
EIS
T D
AN
/MU
DD
Y C
RK
36N
04W
26B
BA
WE
LL10
8.0
2.0
5.0
15.0
8993
2G
ILLE
SP
IE E
AR
L36
N04
W26
CA
AC
WE
LL16
0.0
60.0
4.0
8993
3G
LAC
IER
CO
LON
Y36
N04
W30
BB
BD
BW
ELL
105.
044
.5
A -
2

App
endi
x A
Inve
ntor
y an
d W
ater
-Qua
lity
Dat
a
GW
IC
NU
MB
ER
S
ITE
NA
ME
TOWNSHIP
RANGE
SECTION
TRACT
ELEVATION
TYPE
CASING
TOTAL DEPTH (ft)
STATIC WATER LEVEL (ft)
PUMPING WATER LEVEL (ft)
PUMPING RATE (gpm)
SU
NB
UR
ST
WE
LLS
8993
4G
LAC
IER
CO
LON
Y36
N04
W33
BB
BB
WE
LL15
7.0
5.0
6826
BIG
WE
ST
OIL
CO
* 2
MI N
E M
TN V
IEW
SC
HO
OL*
36N
04W
35A
BW
ELL
225.
012
5.0
1558
71E
NN
EB
ER
G G
AR
Y36
N04
W35
AD
AA
DA
WE
LL10
0.9
1808
57M
T S
ALI
NIT
Y C
ON
TRO
L A
SS
O36
N05
W3
BC
BA
WE
LL28
.018
0858
MT
SA
LIN
ITY
CO
NTR
OL
AS
SO
36N
05W
3C
BB
DW
ELL
28.0
1808
59M
T S
ALI
NIT
Y C
ON
TRO
L A
SS
O36
N05
W3
CC
CD
WE
LL38
.068
28D
AV
ID R
EIE
RS
GA
RD
36N
05W
4A
BA
BD
DW
ELL
137.
068
28D
AV
ID R
EIE
RS
GA
RD
36N
05W
4A
BA
BD
DW
ELL
137.
016
9376
DA
VID
RE
IER
SG
AR
D36
N05
W4
AB
AB
DD
WE
LL14
4.0
1693
76D
AV
ID R
EIE
RS
GA
RD
36N
05W
4A
BA
BD
DW
ELL
144.
018
0860
MT
SA
LIN
ITY
CO
NTR
OL
AS
SO
36N
05W
4A
AA
AW
ELL
28.0
1808
61M
T S
ALI
NIT
Y C
ON
TRO
L A
SS
O36
N05
W4
AD
BA
WE
LL28
.018
0862
MT
SA
LIN
ITY
CO
NTR
OL
AS
SO
36N
05W
4A
DC
DW
ELL
23.0
1808
63M
T S
ALI
NIT
Y C
ON
TRO
L A
SS
O36
N05
W4
DA
DC
WE
LL48
.018
0864
MT
SA
LIN
ITY
CO
NTR
OL
AS
SO
36N
05W
9A
AB
AW
ELL
23.0
6833
MC
ALP
INE
ALL
EN
36N
05W
14A
CD
DD
DW
ELL
450.
012
.15.
068
34G
JER
TSO
N G
EO
RG
E *
.25
MI N
W G
RA
SS
Y L
AK
E36
N05
W14
BD
WE
LL10
5.0
7.8
8994
6G
JER
TSO
N G
EO
RG
E36
N05
W14
CA
WE
LL12
0.0
20.0
3.0
1498
22M
CA
LPIN
E A
LLE
N36
N05
W14
DB
BB
DB
WE
LL44
.0-1
.014
9822
MC
ALP
INE
ALL
EN
36N
05W
14D
BB
BD
BW
ELL
44.0
-1.0
1737
23M
T S
ALI
NIT
Y C
ON
TRO
L A
SS
OC
*R
R-0
2 #4
36N
05W
19C
BA
DW
ELL
33.0
1737
24M
T S
ALI
NIT
Y C
ON
TRO
L A
SS
OC
*R
R-0
2 #1
36N
05W
19C
BC
CW
ELL
18.0
1737
25M
T S
ALI
NIT
Y C
ON
TRO
L A
SS
OC
*R
R-0
2 #2
36N
05W
19C
CA
CW
ELL
38.0
1737
26M
T S
ALI
NIT
Y C
ON
TRO
L A
SS
OC
*R
R-0
2 #3
36N
05W
19C
DB
BW
ELL
58.0
8994
7P
ETE
RS
ON
RA
Y36
N05
W23
AC
CB
DA
WE
LL11
0.0
40.0
85.0
1373
40G
LAC
IER
CO
LON
Y36
N05
W23
AA
BD
BW
ELL
450.
00.
027
.015
0.0
8956
73TE
XA
S C
O36
N05
W23
PE
TWE
LL89
948
PE
TER
SO
N R
AY
& L
ON
36N
05W
24D
AD
CA
AW
ELL
8994
9P
ETE
RS
ON
RA
Y36
N05
W27
AD
WE
LL85
.040
.085
.089
953
MIC
HA
ELS
PH
ILLI
P36
N05
W32
AD
AD
CB
WE
LL14
.06.
02.
016
6151
GLA
CIE
R C
OLO
NY
36N
05W
35D
DC
BW
ELL
18.0
1661
52G
LAC
IER
CO
LON
Y36
N05
W35
DD
BD
WE
LL18
.016
6153
GLA
CIE
R C
OLO
NY
36N
05W
35D
DB
CW
ELL
23.0
A -
3
App
endi
x A
Inve
ntor
y an
d W
ater
-Qua
lity
Dat
a
GW
IC
NU
MB
ER
S
ITE
NA
ME
TOWNSHIP
RANGE
SECTION
TRACT
ELEVATION
TYPE
CASING
TOTAL DEPTH (ft)
STATIC WATER LEVEL (ft)
PUMPING WATER LEVEL (ft)
PUMPING RATE (gpm)
SU
NB
UR
ST
WE
LLS
9038
1M
CA
LPIN
E A
LEX
37N
03W
26W
ELL
14.0
14.0
1.0
9038
2M
CA
LPIN
E A
LEX
37N
03W
26W
ELL
12.0
12.0
1.0
1807
03M
SC
A-M
CA
LPIN
E B
OB
*R
R-1
337
N04
W23
DA
DB
WE
LL28
.018
0849
MT
SA
LIN
ITY
CO
NTR
OL
AS
SO
37N
04W
23D
AB
BW
ELL
38.0
1808
50M
T S
ALI
NIT
Y C
ON
TRO
L A
SS
O37
N04
W23
DA
CB
WE
LL38
.018
0851
MT
SA
LIN
ITY
CO
NTR
OL
AS
SO
37N
04W
23D
AC
CW
ELL
38.0
1808
48M
T S
ALI
NIT
Y C
ON
TRO
L A
SS
O37
N04
W23
DA
AA
WE
LL48
.017
3278
MT
SA
LIN
ITY
CO
NTR
OL
AS
SO
37N
04W
28B
BB
DW
ELL
18.0
1732
79M
T S
ALI
NIT
Y C
ON
TRO
L A
SS
O37
N04
W28
BC
CB
WE
LL18
.017
3277
MT
SA
LIN
ITY
CO
NTR
OL
AS
SO
37N
04W
28B
BA
AW
ELL
28.0
1732
76M
T S
ALI
NIT
Y C
ON
TRO
L A
SS
O37
N04
W29
DA
BB
WE
LL18
.020
4705
MS
CA
*B
UN
YA
K S
TAN
LEY
*TO
-47
*WE
LL 4
37N
04W
29D
CA
DW
ELL
23.0
2047
03M
SC
A *
BU
NY
AK
STA
NLE
Y *
TO-4
7 *W
ELL
137
N04
W29
CA
DB
WE
LL33
.020
4704
MS
CA
*B
UN
YA
K S
TAN
LEY
*TO
-47
*WE
LL 2
37N
04W
29C
DA
CW
ELL
33.0
9039
9B
UN
YA
K S
TAN
LEY
#1
37N
04W
29D
AB
CW
ELL
60.0
60.0
5.0
2047
06M
SC
A *
BU
NY
AK
STA
NLE
Y *
TO-4
7 *W
ELL
337
N04
W32
BA
AC
WE
LL18
.0
A -
4
App
endi
x A
Inve
ntor
y an
d W
ater
-Qua
lity
Dat
a
GW
IC
NU
MB
ER
SU
NB
UR
ST
W
1749
8217
4998
1749
9989
911
6820
8991
289
914
8991
517
3698
1736
9417
3692
1736
9317
3697
1736
9517
3701
1737
0017
3699
1736
9617
3704
1737
0517
3703
1737
0289
917
8991
889
919
1844
0216
5716
1657
1916
5725
1657
2616
5721
1657
2316
5728
COUNTY
DATE DRILLED
AQUIFER
SAMPLE ID
SAMPLING AGENCY
SAMPLE DATE
LABORATORY
WATER TEMPERATURE (°C)
FIELD pH
LAB Ph
FIELD CONDUCTIVITY (µmho/cm)
LAB CONDUCTIVITY (µmho/cm)
FIELD REDOX (mV)
DISSOLVED OXYGEN (mg/L)
IRON-RELATED BACTERIA (colony forming units/mL)
TOO
LE7/
23/1
998
TOO
LE7/
23/1
998
TOO
LE7/
23/1
998
TOO
LE1/
1/19
6121
1VR
GL
TOO
LE21
1VR
GL
1965
Q00
03U
SG
S10
/21/
1965
WQ
BTO
OLE
1/1/
1944
TOO
LE1/
1/19
33TO
OLE
1/1/
1933
TOO
LE5/
27/1
998
TOO
LE5/
20/1
998
TOO
LE5/
20/1
998
TOO
LE5/
20/1
998
TOO
LE5/
27/1
998
TOO
LE5/
27/1
998
TOO
LE5/
20/1
998
TOO
LE5/
27/1
998
TOO
LE5/
27/1
998
TOO
LE5/
27/1
998
TOO
LE5/
20/1
998
TOO
LE5/
20/1
998
TOO
LE5/
20/1
998
TOO
LE5/
20/1
998
TOO
LE1/
1/19
63TO
OLE
1/1/
1973
TOO
LE1/
1/19
60TO
OLE
7/18
/200
0TO
OLE
11/1
8/19
9711
2DR
FT19
98Q
0816
MB
MG
2/24
/199
8M
BM
G8.
0515
00TO
OLE
11/1
8/19
9711
2DR
FT19
98Q
0819
MB
MG
2/24
/199
8M
BM
G8.
0823
40TO
OLE
11/1
8/19
97TO
OLE
11/1
8/19
97TO
OLE
11/1
8/19
97TO
OLE
11/1
8/19
97TO
OLE
11/1
8/19
97
A -
5

App
endi
x A
Inve
ntor
y an
d W
ater
-Qua
lity
Dat
a
GW
IC
NU
MB
ER
SU
NB
UR
ST
W
1657
1516
5724
1657
2016
5727
1807
2016
5722
8992
017
3718
8992
118
7898
1501
5217
3721
1657
2917
3719
1657
3016
5717
1737
2016
5730
1657
2989
927
8992
868
2418
0855
1808
5418
0852
1808
5618
0853
8993
089
931
8993
289
933
COUNTY
DATE DRILLED
AQUIFER
SAMPLE ID
SAMPLING AGENCY
SAMPLE DATE
LABORATORY
WATER TEMPERATURE (°C)
FIELD pH
LAB Ph
FIELD CONDUCTIVITY (µmho/cm)
LAB CONDUCTIVITY (µmho/cm)
FIELD REDOX (mV)
DISSOLVED OXYGEN (mg/L)
IRON-RELATED BACTERIA (colony forming units/mL)
TOO
LE11
/18/
1997
112D
RFT
1998
Q08
15M
BM
G6/
25/1
998
MB
MG
7.92
4390
TOO
LE11
/18/
1997
TOO
LE11
/18/
1997
1998
Q08
20M
BM
G2/
24/1
998
MB
MG
8.09
5150
TOO
LE11
/18/
1997
TOO
LETO
OLE
11/1
8/19
97
TOO
LE1/
1/19
6121
1TM
DC
TOO
LE4/
27/1
998
211T
MD
C19
96Q
0178
MB
MG
8/2/
1995
MB
MG
117.
28.
211
5111
83TO
OLE
11/1
/195
921
1VR
GL
1996
Q01
79M
BM
G8/
2/19
95M
BM
G8.
1916
69TO
OLE
10/1
2/20
00TO
OLE
5/3/
1964
211V
RG
L19
96Q
0178
MB
MG
8/2/
1995
MB
MG
8.2
1183
TOO
LE11
/20/
1997
TOO
LE11
/18/
1997
TOO
LE11
/20/
1997
TOO
LE11
/18/
1997
112T
ILL
TOO
LE11
/18/
1997
112D
RFT
1998
Q08
17M
BM
G6/
25/1
998
MB
MG
839
80TO
OLE
11/1
9/19
97TO
OLE
11/1
8/19
9711
2TIL
LTO
OLE
11/1
8/19
97TO
OLE
1/1/
1919
211T
MD
CTO
OLE
1/1/
1940
211T
MD
C19
96Q
0175
MB
MG
8/2/
1995
MB
MG
8.37
1431
TOO
LE1/
1/19
2021
1VR
GL
1965
Q00
23U
SG
S10
/20/
1965
WQ
BTO
OLE
4/8/
1999
TOO
LE4/
8/19
99TO
OLE
4/8/
1999
TOO
LE4/
8/19
99TO
OLE
4/8/
1999
TOO
LE1/
1/19
61TO
OLE
1/1/
1987
TOO
LE1/
1/19
3821
1TM
DC
TOO
LE1/
1/19
8619
96Q
0008
MB
MG
6/30
/199
5M
BM
G8.
1814
20
A -
6

App
endi
x A
Inve
ntor
y an
d W
ater
-Qua
lity
Dat
a
GW
IC
NU
MB
ER
SU
NB
UR
ST
W
8993
468
2615
5871
1808
5718
0858
1808
5968
2868
2816
9376
1693
7618
0860
1808
6118
0862
1808
6318
0864
6833
6834
8994
614
9822
1498
2217
3723
1737
2417
3725
1737
2689
947
1373
4089
5673
8994
889
949
8995
316
6151
1661
5216
6153
COUNTY
DATE DRILLED
AQUIFER
SAMPLE ID
SAMPLING AGENCY
SAMPLE DATE
LABORATORY
WATER TEMPERATURE (°C)
FIELD pH
LAB Ph
FIELD CONDUCTIVITY (µmho/cm)
LAB CONDUCTIVITY (µmho/cm)
FIELD REDOX (mV)
DISSOLVED OXYGEN (mg/L)
IRON-RELATED BACTERIA (colony forming units/mL)
TOO
LE7/
1/19
43TO
OLE
211V
RG
L19
65Q
0004
US
GS
9/24
/196
5W
QB
TOO
LE21
1TM
DC
1997
Q00
37M
BM
G7/
12/1
996
MB
MG
8.2
851
GLA
CIE
R6/
8/19
99G
LAC
IER
6/8/
1999
GLA
CIE
R6/
8/19
99G
LAC
IER
211V
RG
L19
65Q
0022
US
GS
10/1
5/19
65W
QB
4000
GLA
CIE
R21
1VR
GL
2000
Q01
97M
BM
G8/
20/1
999
MB
MG
7.9
8080
GLA
CIE
R21
1TM
DC
1966
Q00
14M
BM
G7/
1/19
95M
BM
G9
7.37
7.93
5350
4540
GLA
CIE
R21
1TM
DC
1999
Q50
01P
RIV
7/1/
1995
EN
GY
7.3
1020
0G
LAC
IER
6/8/
1999
GLA
CIE
R6/
8/19
99G
LAC
IER
6/8/
1999
GLA
CIE
R6/
8/19
99G
LAC
IER
6/8/
1999
1/1/
1942
211V
RG
L21
1TM
DC
1/1/
1924
110A
LVM
GLA
CIE
R21
1TM
DC
1996
Q01
06M
BM
G7/
17/1
995
MB
MG
9.19
1341
GLA
CIE
R4/
27/1
998
GLA
CIE
R4/
27/1
998
GLA
CIE
R4/
27/1
998
GLA
CIE
R4/
27/1
998
1/1/
1946
211T
MD
C8/
5/19
9321
1VR
GL
217C
BN
K1/
1/19
2421
1TM
DC
GLA
CIE
R1/
1/19
61G
LAC
IER
1/1/
1934
1996
Q00
19M
BM
G7/
1/19
95M
BM
G7.
9355
0G
LAC
IER
10/2
4/19
96G
LAC
IER
10/2
4/19
96G
LAC
IER
10/2
4/19
96
A -
7

App
endi
x A
Inve
ntor
y an
d W
ater
-Qua
lity
Dat
a
GW
IC
NU
MB
ER
SU
NB
UR
ST
W
9038
190
382
1807
0318
0849
1808
5018
0851
1808
4817
3278
1732
7917
3277
1732
7620
4705
2047
0320
4704
9039
920
4706
COUNTY
DATE DRILLED
AQUIFER
SAMPLE ID
SAMPLING AGENCY
SAMPLE DATE
LABORATORY
WATER TEMPERATURE (°C)
FIELD pH
LAB Ph
FIELD CONDUCTIVITY (µmho/cm)
LAB CONDUCTIVITY (µmho/cm)
FIELD REDOX (mV)
DISSOLVED OXYGEN (mg/L)
IRON-RELATED BACTERIA (colony forming units/mL)
TOO
LE1/
1/19
39TO
OLE
1/1/
1923
TOO
LE4/
9/19
99TO
OLE
4/9/
1999
TOO
LE4/
9/19
99TO
OLE
4/9/
1999
TOO
LE4/
9/19
99TO
OLE
5/27
/199
8TO
OLE
5/27
/199
8TO
OLE
5/27
/199
8TO
OLE
5/27
/199
8TO
OLE
2/27
/200
3TO
OLE
2/27
/200
3TO
OLE
2/27
/200
3TO
OLE
1/1/
1939
1996
Q02
41M
BM
G8/
9/19
95M
BM
G7.
9622
10TO
OLE
2/27
/200
3
A -
8

App
endi
x A
Inve
ntor
y an
d W
ater
-Qua
lity
Dat
a
GW
IC
NU
MB
ER
SU
NB
UR
ST
W
1749
8217
4998
1749
9989
911
6820
8991
289
914
8991
517
3698
1736
9417
3692
1736
9317
3697
1736
9517
3701
1737
0017
3699
1736
9617
3704
1737
0517
3703
1737
0289
917
8991
889
919
1844
0216
5716
1657
1916
5725
1657
2616
5721
1657
2316
5728
SULFUR-REDUCING BACTERIA (colony forming units/mL)
EXTRACTABLE PETROLEUM HYDROCARBONS (mg/L)
Ca (mg/L)
Mg (mg/L)
Na (mg/L)
K (mg/L)
Fe (mg/L)
Mn (mg/L)
SiO2 (mg/L)
HCO3 (mg/L)
CO3 (mg/L)
SO4 (mg/L)
Cl (mg/L)
NO3 as N (mg/L)
F (mg/L)
Ag (µg/L)
Al (µg/L)
As (µg/L)
B (µg/L)
2442
50 K
1929
312
697
2.25
90.
1
164.
386
.366
.45.
54<.
005
0.06
113
.538
9.2
060
4.5
109.
6<.
5<1
.<3
0.<1
.<8
0.24
7.9
199.
982
.610
.8<.
005
0.00
213
.538
3.1
010
8429
.213
.3<.
5<1
.<3
0.1.
254
<80.
A -
9

App
endi
x A
Inve
ntor
y an
d W
ater
-Qua
lity
Dat
a
GW
IC
NU
MB
ER
SU
NB
UR
ST
W
1657
1516
5724
1657
2016
5727
1807
2016
5722
8992
017
3718
8992
118
7898
1501
5217
3721
1657
2917
3719
1657
3016
5717
1737
2016
5730
1657
2989
927
8992
868
2418
0855
1808
5418
0852
1808
5618
0853
8993
089
931
8993
289
933
SULFUR-REDUCING BACTERIA (colony forming units/mL)
EXTRACTABLE PETROLEUM HYDROCARBONS (mg/L)
Ca (mg/L)
Mg (mg/L)
Na (mg/L)
K (mg/L)
Fe (mg/L)
Mn (mg/L)
SiO2 (mg/L)
HCO3 (mg/L)
CO3 (mg/L)
SO4 (mg/L)
Cl (mg/L)
NO3 as N (mg/L)
F (mg/L)
Ag (µg/L)
Al (µg/L)
As (µg/L)
B (µg/L)
544.
624
5.4
607
17.8
<.00
50.
118
17.1
247
5.8
026
89.4
163.
910
7.9
3.78
<1.
<30.
18.5
<80.
488.
247
8.9
811.
217
.54
<.00
50.
062
12.3
0660
3.9
041
00.7
139
54.9
4.8
<1.
<30.
15.5
337.
4
76.9
42.8
139.
73.
2<0
.003
0.11
69.
651
0.77
025
06.
50.
150.
19<1
.<3
0.<1
.31
954
.440
.129
4.1
2.8
0.00
7<.
002
6.7
605.
120
450
110.
90.
22<1
.<3
0.<1
.42
2
76.9
42.8
139.
73.
2<.
003
0.11
69.
651
0.77
025
06.
50.
150.
19<1
.<3
0.<1
.31
9
546.
130
4.4
385.
820
.04
<.00
50.
116
.353
444.
10
2768
.620
99.
763.
53<1
.<3
0.4.
2<8
0.
53.7
33.7
238.
82.
30.
007
<.00
26.
954
5.34
14.4
300
81
0.3
<1.
<30.
<1.
406
6862
138
K1.
3634
20
392
162.
395
0.4
24.6
11.4
289.
12.
20.
083
0.05
17.
846
6.9
035
012
0.05
0.5
<1.
<30.
<1.
431
A -
10

App
endi
x A
Inve
ntor
y an
d W
ater
-Qua
lity
Dat
a
GW
IC
NU
MB
ER
SU
NB
UR
ST
W
8993
468
2615
5871
1808
5718
0858
1808
5968
2868
2816
9376
1693
7618
0860
1808
6118
0862
1808
6318
0864
6833
6834
8994
614
9822
1498
2217
3723
1737
2417
3725
1737
2689
947
1373
4089
5673
8994
889
949
8995
316
6151
1661
5216
6153
SULFUR-REDUCING BACTERIA (colony forming units/mL)
EXTRACTABLE PETROLEUM HYDROCARBONS (mg/L)
Ca (mg/L)
Mg (mg/L)
Na (mg/L)
K (mg/L)
Fe (mg/L)
Mn (mg/L)
SiO2 (mg/L)
HCO3 (mg/L)
CO3 (mg/L)
SO4 (mg/L)
Cl (mg/L)
NO3 as N (mg/L)
F (mg/L)
Ag (µg/L)
Al (µg/L)
As (µg/L)
B (µg/L)
3237
151
K5.
7242
70
190
80
10.8
6.9
188.
51
0.03
0.01
36.
946
0.7
081
4.1
<.05
P<1
.<1
.76
.9<1
.44
5
1444
1130
063
045
1950
330.
521.
330
019
819
1012
.30.
203
0.24
75.
4882
2.3
045
87.4
59.2
282
.55.
3<1
.<3
0.5.
4781
610
4.2
58.3
1200
5.5
0.75
80.
113
6.9
855.
50
2250
4027
.50.
8<1
.<3
0.2.
283
830
624
421
0011
.20.
2266
30
5200
144
237
0.94
60.
399
276.
20.
662
<.05
<.00
25.
843
5.9
51.2
250
16<.
051.
24<1
.<3
0.<1
.49
0
63.5
23.6
13.8
8.2
<.00
3<.
002
12.8
335.
50
27.5
3.5
0.75
0.13
<1.
<30.
<1.
<30.
A -
11
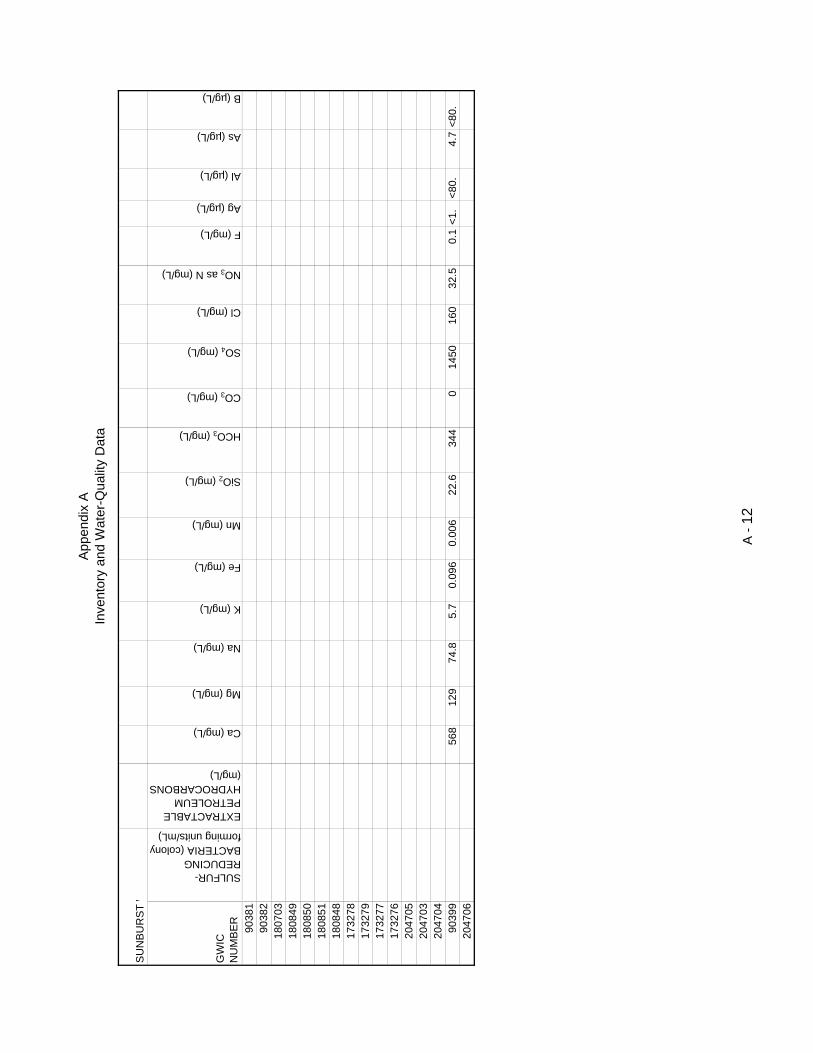
App
endi
x A
Inve
ntor
y an
d W
ater
-Qua
lity
Dat
a
GW
IC
NU
MB
ER
SU
NB
UR
ST
W
9038
190
382
1807
0318
0849
1808
5018
0851
1808
4817
3278
1732
7917
3277
1732
7620
4705
2047
0320
4704
9039
920
4706
SULFUR-REDUCING BACTERIA (colony forming units/mL)
EXTRACTABLE PETROLEUM HYDROCARBONS (mg/L)
Ca (mg/L)
Mg (mg/L)
Na (mg/L)
K (mg/L)
Fe (mg/L)
Mn (mg/L)
SiO2 (mg/L)
HCO3 (mg/L)
CO3 (mg/L)
SO4 (mg/L)
Cl (mg/L)
NO3 as N (mg/L)
F (mg/L)
Ag (µg/L)
Al (µg/L)
As (µg/L)
B (µg/L)
568
129
74.8
5.7
0.09
60.
006
22.6
344
014
5016
032
.50.
1<1
.<8
0.4.
7<8
0.
A -
12
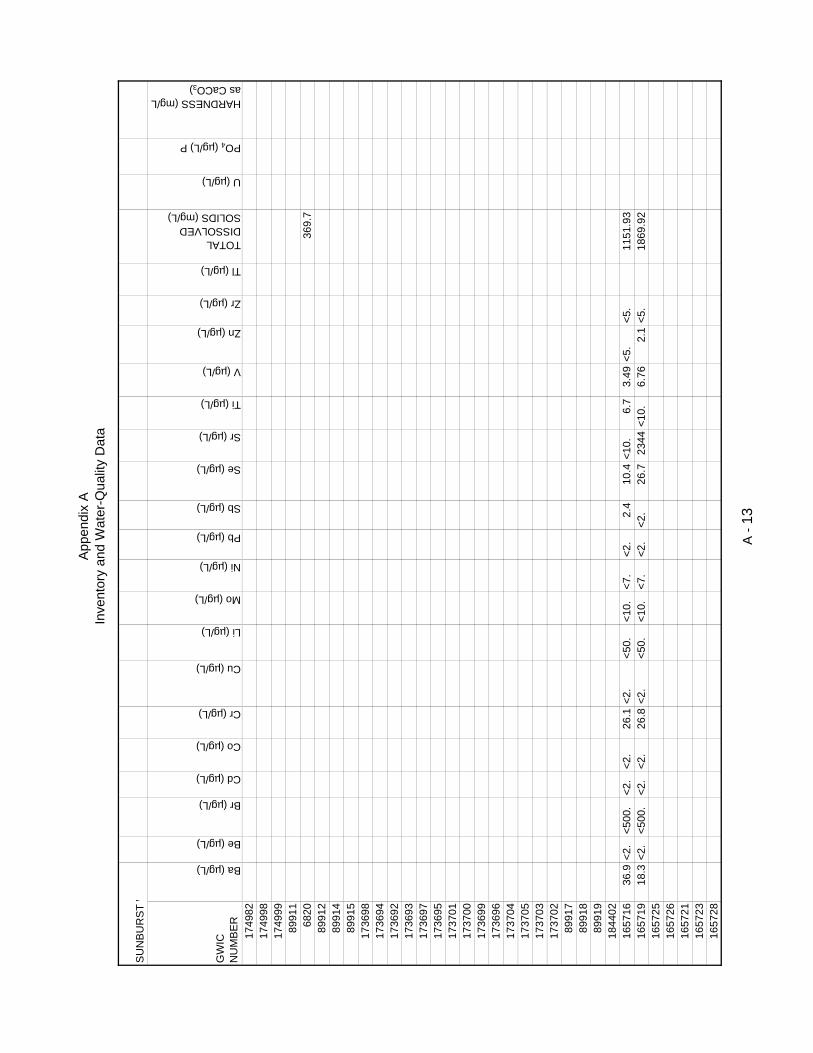
App
endi
x A
Inve
ntor
y an
d W
ater
-Qua
lity
Dat
a
GW
IC
NU
MB
ER
SU
NB
UR
ST
W
1749
8217
4998
1749
9989
911
6820
8991
289
914
8991
517
3698
1736
9417
3692
1736
9317
3697
1736
9517
3701
1737
0017
3699
1736
9617
3704
1737
0517
3703
1737
0289
917
8991
889
919
1844
0216
5716
1657
1916
5725
1657
2616
5721
1657
2316
5728
Ba (µg/L)
Be (µg/L)
Br (µg/L)
Cd (µg/L)
Co (µg/L)
Cr (µg/L)
Cu (µg/L)
Li (µg/L)
Mo (µg/L)
Ni (µg/L)
Pb (µg/L)
Sb (µg/L)
Se (µg/L)
Sr (µg/L)
Ti (µg/L)
V (µg/L)
Zn (µg/L)
Zr (µg/L)
Tl (µg/L)
TOTAL DISSOLVED SOLIDS (mg/L)
U (µg/L)
PO4 (µg/L) P
HARDNESS (mg/L as CaCO3)
369.
7
36.9
<2.
<500
.<2
.<2
.26
.1<2
.<5
0.<1
0.<7
.<2
.2.
410
.4<1
0.6.
73.
49<5
.<5
.11
51.9
318
.3<2
.<5
00.
<2.
<2.
26.8
<2.
<50.
<10.
<7.
<2.
<2.
26.7
2344
<10.
6.76
2.1
<5.
1869
.92
A -
13
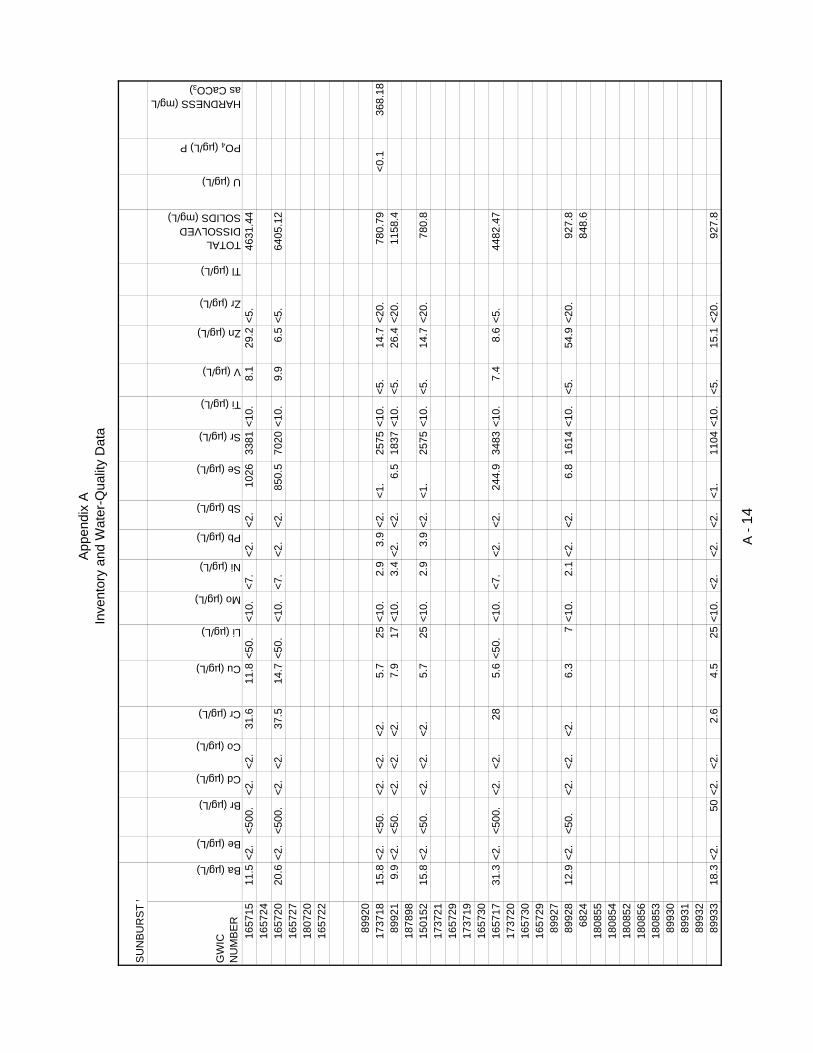
App
endi
x A
Inve
ntor
y an
d W
ater
-Qua
lity
Dat
a
GW
IC
NU
MB
ER
SU
NB
UR
ST
W
1657
1516
5724
1657
2016
5727
1807
2016
5722
8992
017
3718
8992
118
7898
1501
5217
3721
1657
2917
3719
1657
3016
5717
1737
2016
5730
1657
2989
927
8992
868
2418
0855
1808
5418
0852
1808
5618
0853
8993
089
931
8993
289
933
Ba (µg/L)
Be (µg/L)
Br (µg/L)
Cd (µg/L)
Co (µg/L)
Cr (µg/L)
Cu (µg/L)
Li (µg/L)
Mo (µg/L)
Ni (µg/L)
Pb (µg/L)
Sb (µg/L)
Se (µg/L)
Sr (µg/L)
Ti (µg/L)
V (µg/L)
Zn (µg/L)
Zr (µg/L)
Tl (µg/L)
TOTAL DISSOLVED SOLIDS (mg/L)
U (µg/L)
PO4 (µg/L) P
HARDNESS (mg/L as CaCO3)
11.5
<2.
<500
.<2
.<2
.31
.611
.8<5
0.<1
0.<7
.<2
.<2
.10
2633
81<1
0.8.
129
.2<5
.46
31.4
4
20.6
<2.
<500
.<2
.<2
.37
.514
.7<5
0.<1
0.<7
.<2
.<2
.85
0.5
7020
<10.
9.9
6.5
<5.
6405
.12
15.8
<2.
<50.
<2.
<2.
<2.
5.7
25<1
0.2.
93.
9<2
.<1
.25
75<1
0.<5
.14
.7<2
0.78
0.79
<0.1
368.
189.
9<2
.<5
0.<2
.<2
.<2
.7.
917
<10.
3.4
<2.
<2.
6.5
1837
<10.
<5.
26.4
<20.
1158
.4
15.8
<2.
<50.
<2.
<2.
<2.
5.7
25<1
0.2.
93.
9<2
.<1
.25
75<1
0.<5
.14
.7<2
0.78
0.8
31.3
<2.
<500
.<2
.<2
.28
5.6
<50.
<10.
<7.
<2.
<2.
244.
934
83<1
0.7.
48.
6<5
.44
82.4
7
12.9
<2.
<50.
<2.
<2.
<2.
6.3
7<1
0.2.
1<2
.<2
.6.
816
14<1
0.<5
.54
.9<2
0.92
7.8
848.
6
18.3
<2.
50<2
.<2
.2.
64.
525
<10.
<2.
<2.
<2.
<1.
1104
<10.
<5.
15.1
<20.
927.
8
A -
14

App
endi
x A
Inve
ntor
y an
d W
ater
-Qua
lity
Dat
a
GW
IC
NU
MB
ER
SU
NB
UR
ST
W
8993
468
2615
5871
1808
5718
0858
1808
5968
2868
2816
9376
1693
7618
0860
1808
6118
0862
1808
6318
0864
6833
6834
8994
614
9822
1498
2217
3723
1737
2417
3725
1737
2689
947
1373
4089
5673
8994
889
949
8995
316
6151
1661
5216
6153
Ba (µg/L)
Be (µg/L)
Br (µg/L)
Cd (µg/L)
Co (µg/L)
Cr (µg/L)
Cu (µg/L)
Li (µg/L)
Mo (µg/L)
Ni (µg/L)
Pb (µg/L)
Sb (µg/L)
Se (µg/L)
Sr (µg/L)
Ti (µg/L)
V (µg/L)
Zn (µg/L)
Zr (µg/L)
Tl (µg/L)
TOTAL DISSOLVED SOLIDS (mg/L)
U (µg/L)
PO4 (µg/L) P
HARDNESS (mg/L as CaCO3)
634.
180
<2.
<100
.<2
.<2
.13
.861
.327
<10.
2.3
2.2
<2.
<1.
380
<10.
<5.
195.
2<2
0.52
6.5
3528
.16
216.
069.
51<2
.<2
500
<2.
2.98
<2.
25.8
<500
13.5
26.2
<2.
<2.
233
8340
<100
<5.
8310
<50
<100
7574
.1<2
.515
64.0
75.
4<2
.50
0<2
.<2
.2.
612
.954
<10.
3.7
<2.
<2.
71.2
3608
<10.
<5.
97.2
<20.
4115
.61
<5.
500.
1585
68.8
217
68.3
9
15.9
<2.
<50.
<2.
<2.
<2.
3.8
21<1
0.<2
.<2
.<2
.2.
586
<10.
<5.
3.6
<20.
817.
18
360.
9<2
.<5
0.<2
.<2
.<2
.34
.912
<10.
<2.
<2.
<2.
1.2
204
<10.
<5.
75.5
<20.
319.
16
A -
15

App
endi
x A
Inve
ntor
y an
d W
ater
-Qua
lity
Dat
a
GW
IC
NU
MB
ER
SU
NB
UR
ST
W
9038
190
382
1807
0318
0849
1808
5018
0851
1808
4817
3278
1732
7917
3277
1732
7620
4705
2047
0320
4704
9039
920
4706
Ba (µg/L)
Be (µg/L)
Br (µg/L)
Cd (µg/L)
Co (µg/L)
Cr (µg/L)
Cu (µg/L)
Li (µg/L)
Mo (µg/L)
Ni (µg/L)
Pb (µg/L)
Sb (µg/L)
Se (µg/L)
Sr (µg/L)
Ti (µg/L)
V (µg/L)
Zn (µg/L)
Zr (µg/L)
Tl (µg/L)
TOTAL DISSOLVED SOLIDS (mg/L)
U (µg/L)
PO4 (µg/L) P
HARDNESS (mg/L as CaCO3)
74.2
N/A
.10
<2.
<2.
3.2
40<1
0.16
.3<2
.<2
.19
2.3
1279
<10.
<5.
2134
<20.
2614
.4
A -
16

App
endi
x A
Inve
ntor
y an
d W
ater
-Qua
lity
Dat
a
GW
IC
NU
MB
ER
SU
NB
UR
ST
W
1749
8217
4998
1749
9989
911
6820
8991
289
914
8991
517
3698
1736
9417
3692
1736
9317
3697
1736
9517
3701
1737
0017
3699
1736
9617
3704
1737
0517
3703
1737
0289
917
8991
889
919
1844
0216
5716
1657
1916
5725
1657
2616
5721
1657
2316
5728
ALKALINITY (mg/L as CaCO3)
RYZNAR STABILITY INDEX
SODIUM ADSORPTION RATIO
LANGLIER SATURATION INDEX
A -
17

App
endi
x A
Inve
ntor
y an
d W
ater
-Qua
lity
Dat
a
GW
IC
NU
MB
ER
SU
NB
UR
ST
W
1657
1516
5724
1657
2016
5727
1807
2016
5722
8992
017
3718
8992
118
7898
1501
5217
3721
1657
2917
3719
1657
3016
5717
1737
2016
5730
1657
2989
927
8992
868
2418
0855
1808
5418
0852
1808
5618
0853
8993
089
931
8993
289
933
ALKALINITY (mg/L as CaCO3)
RYZNAR STABILITY INDEX
SODIUM ADSORPTION RATIO
LANGLIER SATURATION INDEX
418.
925.
784
3.17
1.20
8
A -
18
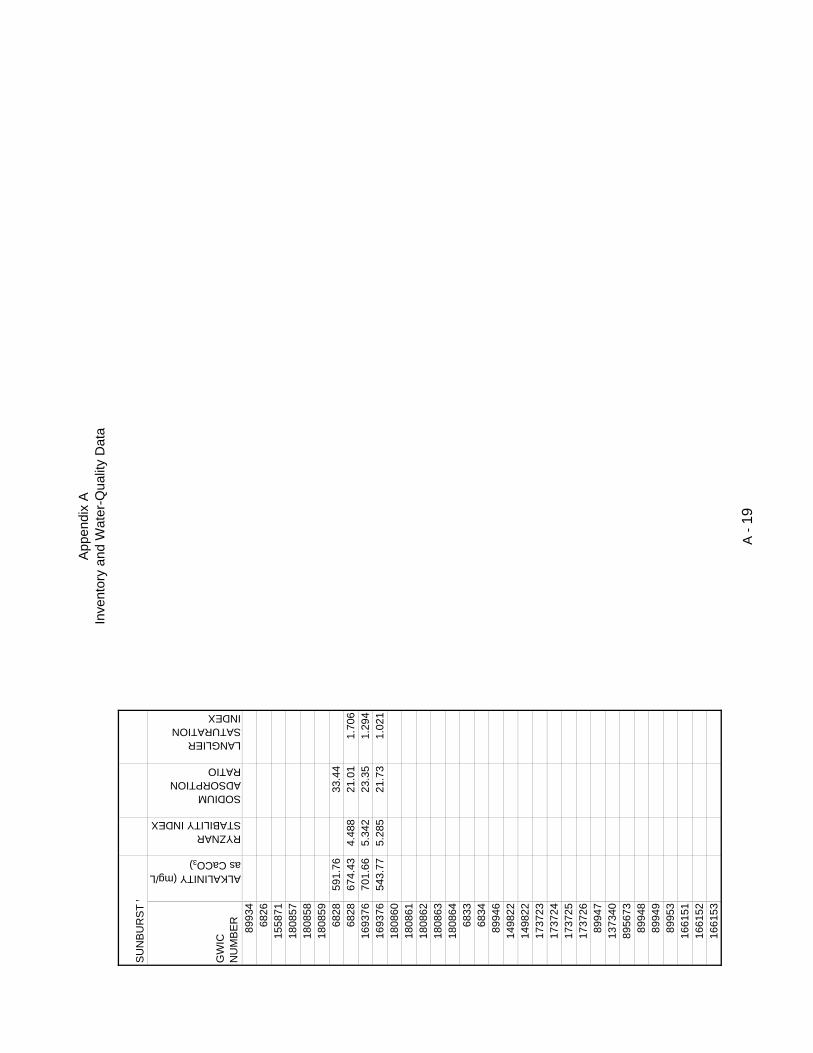
App
endi
x A
Inve
ntor
y an
d W
ater
-Qua
lity
Dat
a
GW
IC
NU
MB
ER
SU
NB
UR
ST
W
8993
468
2615
5871
1808
5718
0858
1808
5968
2868
2816
9376
1693
7618
0860
1808
6118
0862
1808
6318
0864
6833
6834
8994
614
9822
1498
2217
3723
1737
2417
3725
1737
2689
947
1373
4089
5673
8994
889
949
8995
316
6151
1661
5216
6153
ALKALINITY (mg/L as CaCO3)
RYZNAR STABILITY INDEX
SODIUM ADSORPTION RATIO
LANGLIER SATURATION INDEX
591.
7633
.44
674.
434.
488
21.0
11.
706
701.
665.
342
23.3
51.
294
543.
775.
285
21.7
31.
021
A -
19
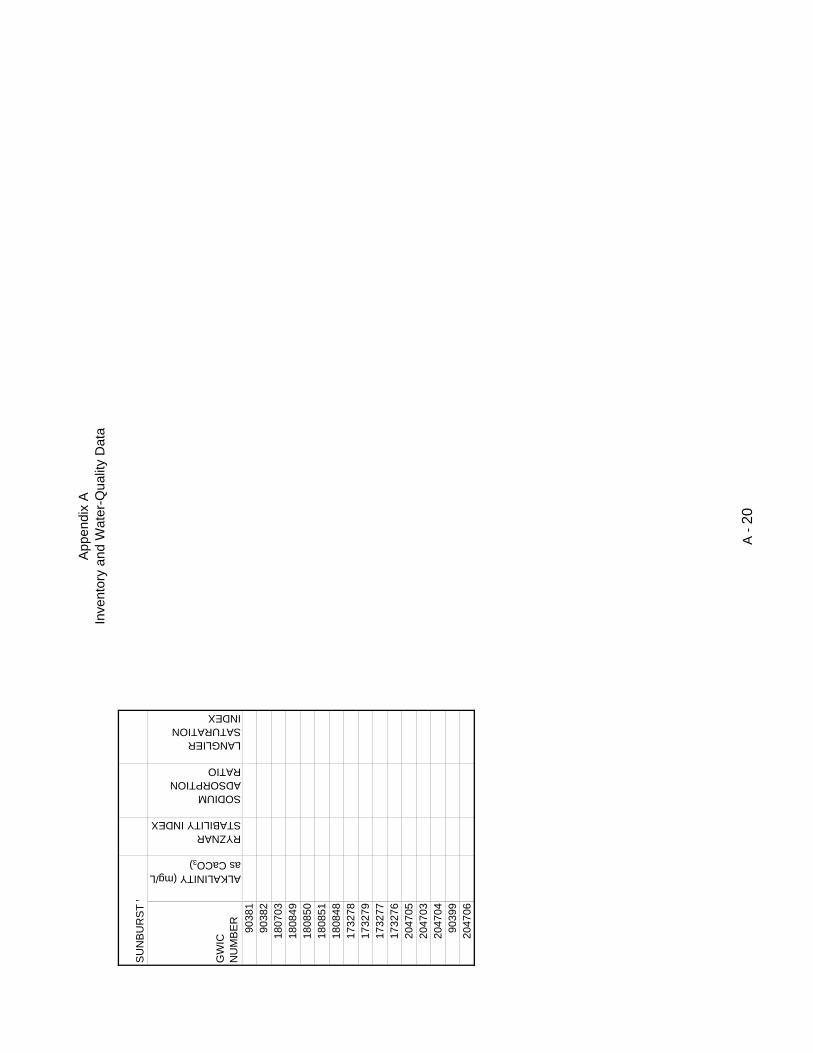
App
endi
x A
Inve
ntor
y an
d W
ater
-Qua
lity
Dat
a
GW
IC
NU
MB
ER
SU
NB
UR
ST
W
9038
190
382
1807
0318
0849
1808
5018
0851
1808
4817
3278
1732
7917
3277
1732
7620
4705
2047
0320
4704
9039
920
4706
ALKALINITY (mg/L as CaCO3)
RYZNAR STABILITY INDEX
SODIUM ADSORPTION RATIO
LANGLIER SATURATION INDEX
A -
20
Appendix B
Downhole Camera Logs

Appendix BDownhole Camera Logs
Sunburst #108/10/2004 08:20Camera angled about 45°, depth correctLocation, UTM m., NAD 83: 5414776 420424Location, T R S tract: 36N04W14ADCBCCompletion Date:Total Depth of Well (ft BTC): 138 , 155RScreened Interval: open holeCasing diameter & type: 12" steelStick Up (ft): 0Bottom of casing: 74.5 , 80RDepth to Water (ft BGS): 93.43
Depth (ft)From To
0 5 casing clean5 10 casing clean
10 15 casing clean15 17 casing clean
17 joint, threaded coupler17 25 casing clean25 30 casing clean, rust30 35 casing clean, rust35 37.5 casing clean, rust
37.5 joint37.5 45 casing clean, rust
45 50 casing clean, rust50 55 casing clean, rust55 58 casing clean, rust
58 joint, encrustation from seepage down one side of casing below joint58 65 scale on one side of casing65 70 scale70 74.5 scale
74.5 bottom of casing74.5 76 washouts
76 80 smooth bore80 85 smooth bore85 90 smooth bore90 93.5 smooth bore
93.5 water, floating debris93.5 ~98-100 smooth bore, suspended sediment
~98-100 105 rough bore, suspended sediment105 110 rough bore, suspended sediment110 115 rough bore, suspended sediment115 116.7 rough bore, suspended sediment, iron stain
116.7 120 rough bore, washouts120 125 very rough bore, washouts125 130 very rough bore, washouts130 131 very rough bore, washouts131 133 major washout133 135 smooth bore135 136 smooth bore136 138 rough bore
138 bottom (elev = 3930)
B - 1

Appendix BDownhole Camera Logs
Sunburst #508/31/04, 14:00Camera vertical, depth correct from top casingLocation, UTM m., NAD 83: 5414549 420736Location, T R S tract: 36N04W14ADDADBCompletion Date:Total Depth of Well (ft BTC): 145.7Screened Interval: open holeCasing diameter & type: 12" steelStick Up (ft): 0Bottom of casing:Depth to Water (ft BGS): 117.02
Depth (ft)From To
0 1 casing, clean, smooth1 welded joint
1 20 casing, clean, smooth20 threaded coupler
20 41 casing, clean, smooth41 threaded coupler
41 61.4 casing, clean, smooth61.4 threaded coupler
61.4 81.8 casing, clean, smooth81.8 threaded coupler
81.8 101.7 casing, clean, smooth101.7 bottom of casing
101.7 105 smooth bore105 117 smooth bore, slight roughness associated with bedding
117 water table117 130 smooth bore, slight roughness associated with bedding130 135 rough bore, washout along vertical joint, massive sandstone135 145.9 rough bore, large washouts along vertical joints
145.9 bottom, rubble
B - 2
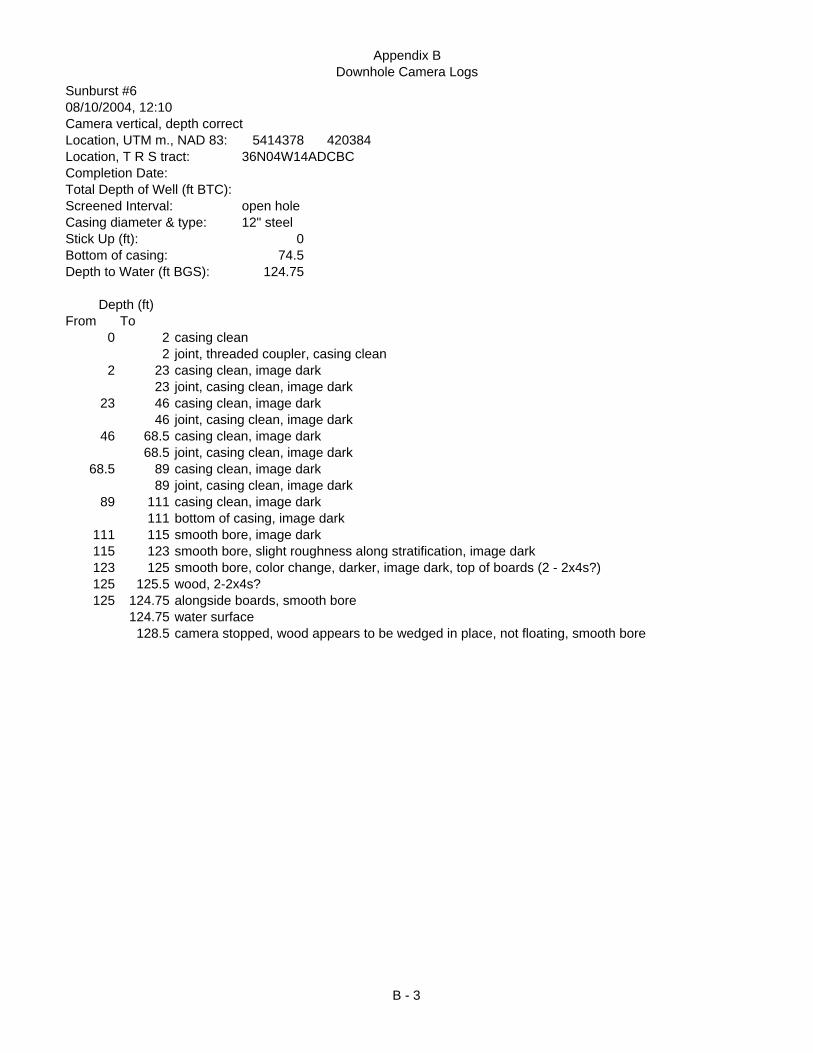
Appendix BDownhole Camera Logs
Sunburst #608/10/2004, 12:10Camera vertical, depth correctLocation, UTM m., NAD 83: 5414378 420384Location, T R S tract: 36N04W14ADCBCCompletion Date:Total Depth of Well (ft BTC):Screened Interval: open holeCasing diameter & type: 12" steelStick Up (ft): 0Bottom of casing: 74.5Depth to Water (ft BGS): 124.75
Depth (ft)From To
0 2 casing clean2 joint, threaded coupler, casing clean
2 23 casing clean, image dark23 joint, casing clean, image dark
23 46 casing clean, image dark46 joint, casing clean, image dark
46 68.5 casing clean, image dark68.5 joint, casing clean, image dark
68.5 89 casing clean, image dark89 joint, casing clean, image dark
89 111 casing clean, image dark111 bottom of casing, image dark
111 115 smooth bore, image dark115 123 smooth bore, slight roughness along stratification, image dark123 125 smooth bore, color change, darker, image dark, top of boards (2 - 2x4s?)125 125.5 wood, 2-2x4s?125 124.75 alongside boards, smooth bore
124.75 water surface128.5 camera stopped, wood appears to be wedged in place, not floating, smooth bore
B - 3

Appendix BDownhole Camera Logs
Sunburst #708/31/04, 16:10Camera vertical, depth correct from top casingLocation, UTM m., NAD 83: 5415101 420750Location, T R S tract: 36N04W14AAAADCompletion Date:Total Depth of Well (ft BTC): 102.7 , 174RScreened Interval: open holeCasing diameter & type: 12" steelStick Up (ft): 0Bottom of casing: , 77RDepth to Water (ft BGS): 83
Depth (ft)From To
0 5 casing clean, smooth5 10 casing clean, smooth, rust increasing with depth
10 13 rust scale build up on casing13 threaded coupler
13 35.5 rust scale build up on casing35.5 threaded coupler
35.5 55.3 rust scale build up on casing, condensation55.3 threaded coupler
55.3 77.3 rust scale build up on casing, condensation77.3 bottom of casing
77.3 83 smooth borehole, minor washouts along bedding83 water table
83 90 smooth borehole, minor washouts along bedding90 102.7 smooth borehole, washouts along bedding
102.7 bottom, rubble
B - 4

Appendix BDownhole Camera Logs
Sunburst #1001/26/2005, 10:30Camera vertical with mirror, depth correct from top casingLocation, UTM m., NAD 83: 5414610 412058Location, T R S tract: 36N05W13ACCCCCompletion Date:Total Depth of Well (ft BTC):Screened Interval: open holeCasing diameter & type: 12" steelStick Up (ft):Bottom of casing:Depth to Water (ft BGS): 115.85
Depth (ft)From To
0 17 12" steel, rust, no pitting or encrustation17 threaded coupler
17 39 12" steel, rust, no pitting or encrustation39 threaded coupler
39 59 12" steel, rust, no pitting or encrustation59 threaded coupler
59 79 12" steel, rust, no pitting or encrustation79 threaded coupler
79 96 12" steel, rust, no pitting or encrustation96 threaded coupler
96 112.3 12" steel, rust, no encrustation, some pitting112.3 Water surface
112.3 225 No visibility225 230 12" steel, appears smooth230 245 No visibility245 250 12" steel, appears smooth250 258 No visibility258 262 12" steel, appears smooth
262 Bottom casing262 265 No visibility265 270 Minor washouts270 305 No visibility
305 Top of 1/4" pipe305 310 Smooth bore310 315 No visibility315 320 2 pieces of 1/4" pipe320 340 No visibility340 368.5 Smooth bore
368.5 Camera hung up
B - 5
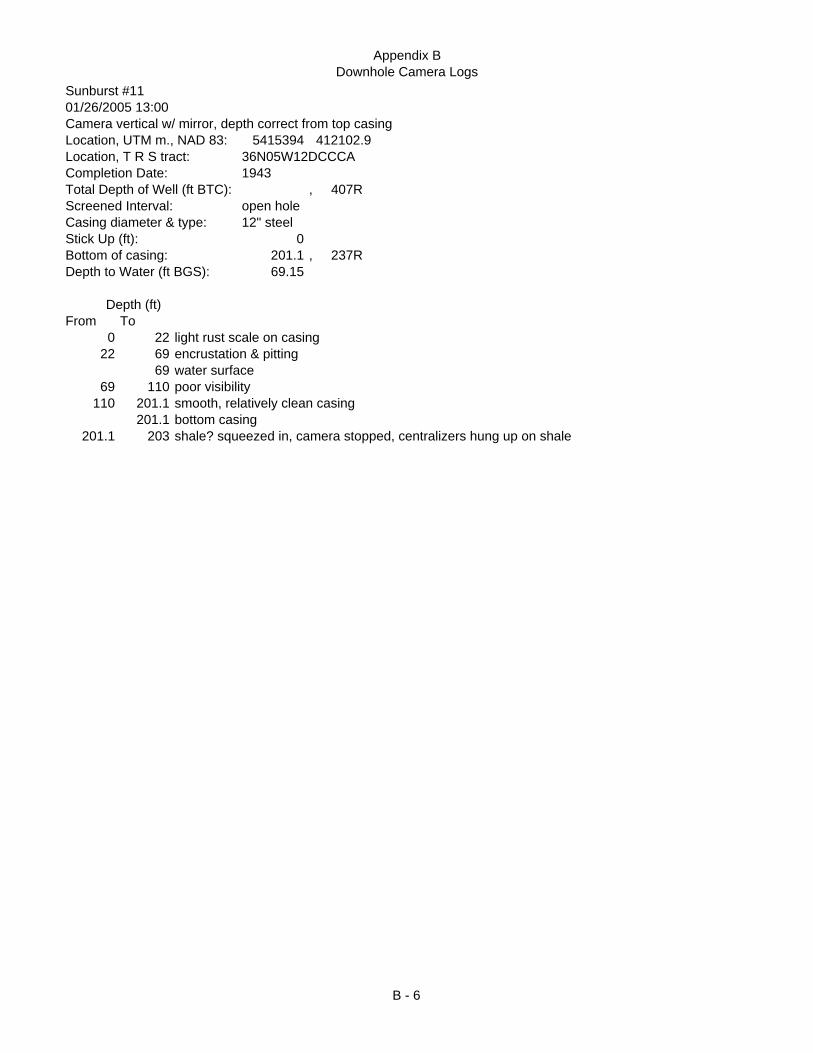
Appendix BDownhole Camera Logs
Sunburst #1101/26/2005 13:00Camera vertical w/ mirror, depth correct from top casingLocation, UTM m., NAD 83: 5415394 412102.9Location, T R S tract: 36N05W12DCCCACompletion Date: 1943Total Depth of Well (ft BTC): , 407RScreened Interval: open holeCasing diameter & type: 12" steelStick Up (ft): 0Bottom of casing: 201.1 , 237RDepth to Water (ft BGS): 69.15
Depth (ft)From To
0 22 light rust scale on casing22 69 encrustation & pitting
69 water surface69 110 poor visibility
110 201.1 smooth, relatively clean casing201.1 bottom casing
201.1 203 shale? squeezed in, camera stopped, centralizers hung up on shale
B - 6

Appendix BDownhole Camera Logs
Sunburst #1209/01/04 14:50Camera vertical, depth correct from top casingLocation, UTM m., NAD 83: 5417048 412088.9Location, T R S tract: 36N05W12ACCCACompletion Date:Total Depth of Well (ft BTC): 469Screened Interval: open holeCasing diameter & type: 12" steelStick Up (ft): 1.8Bottom of casing: 360Depth to Water (ft BGS): 208.4
Depth (ft)From To
0 21.7 light rust on casing21.7 threaded coupler
21.7 41.5 light rust on casing41.5 threaded coupler
41.5 61 light rust scale on casing61 threaded coupler
61 80.7 light rust scale on casing, corrosion pit & precipitate @ 72.5'80.7 threaded coupler
80.7 100.9 light rust scale on casing100.9 threaded coupler, may be leaking
100.9 116.5 light rust scale on casing116.5 threaded coupler
116.5 143 light rust scale on casing, water entering through corrosion pits starting at 132'143 threaded coupler
143 161 light rust scale on casing, water entering through corrosion pits to about 160'161 threaded coupler
161 179 light rust scale on casing, corrosion pits & precipitate 173-194'179 threaded coupler
179 198 rust scale on casing198 threaded coupler
198 208.4 rust scale on casing208.4 water surface
208.4 218 light rust scale on casing218 threaded coupler
218 239 light rust scale on casing, visibility decreasing239 threaded coupler
239 255 light rust scale on casing, poor to fair visibility255 threaded coupler
255 272 light rust scale on casing, poor to fair visibility272 threaded coupler
272 293 light rust scale on casing, poor to fair visibility293 threaded coupler
293 310.4 light rust scale on casing, poor to fair visibility310.4 threaded coupler??
310.4 323 relatively smooth casing323 333 scale? build-up on casing increasing333 341 no visiblity except floating particulates341 352 heavy scale build-up
352 threaded coupler
B - 7
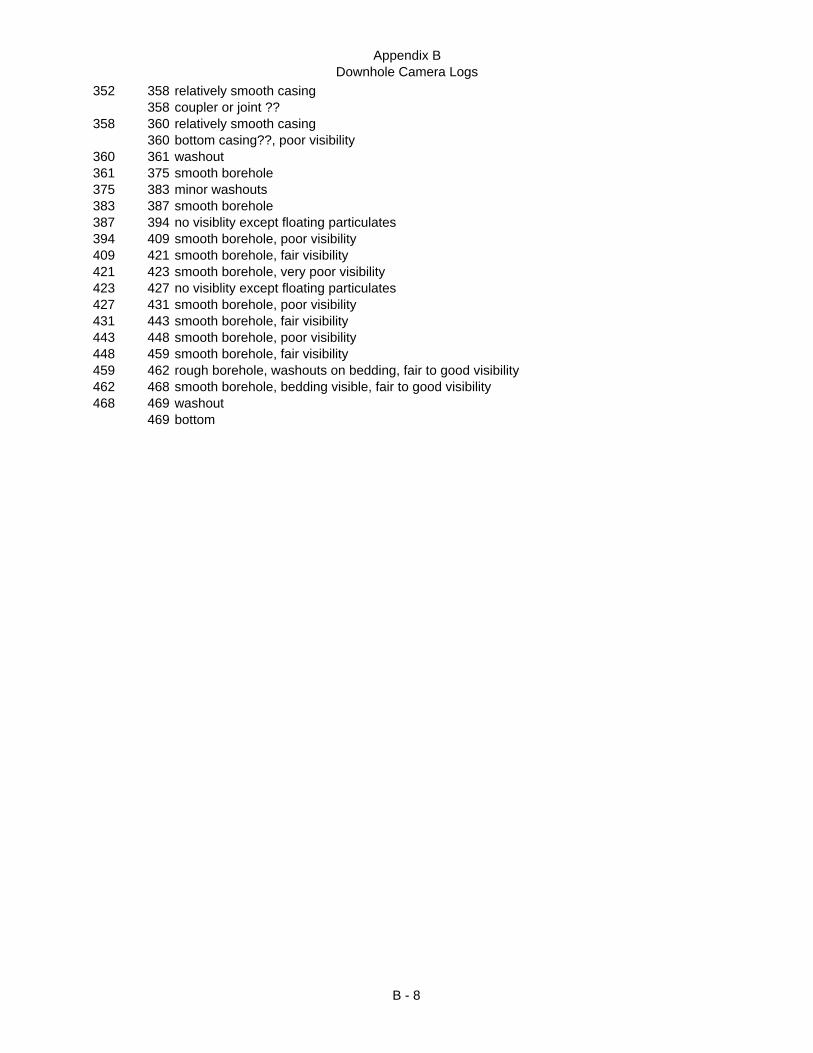
Appendix BDownhole Camera Logs
352 358 relatively smooth casing358 coupler or joint ??
358 360 relatively smooth casing360 bottom casing??, poor visibility
360 361 washout361 375 smooth borehole375 383 minor washouts383 387 smooth borehole387 394 no visiblity except floating particulates394 409 smooth borehole, poor visibility409 421 smooth borehole, fair visibility421 423 smooth borehole, very poor visibility423 427 no visiblity except floating particulates427 431 smooth borehole, poor visibility431 443 smooth borehole, fair visibility443 448 smooth borehole, poor visibility448 459 smooth borehole, fair visibility459 462 rough borehole, washouts on bedding, fair to good visibility462 468 smooth borehole, bedding visible, fair to good visibility468 469 washout
469 bottom
B - 8
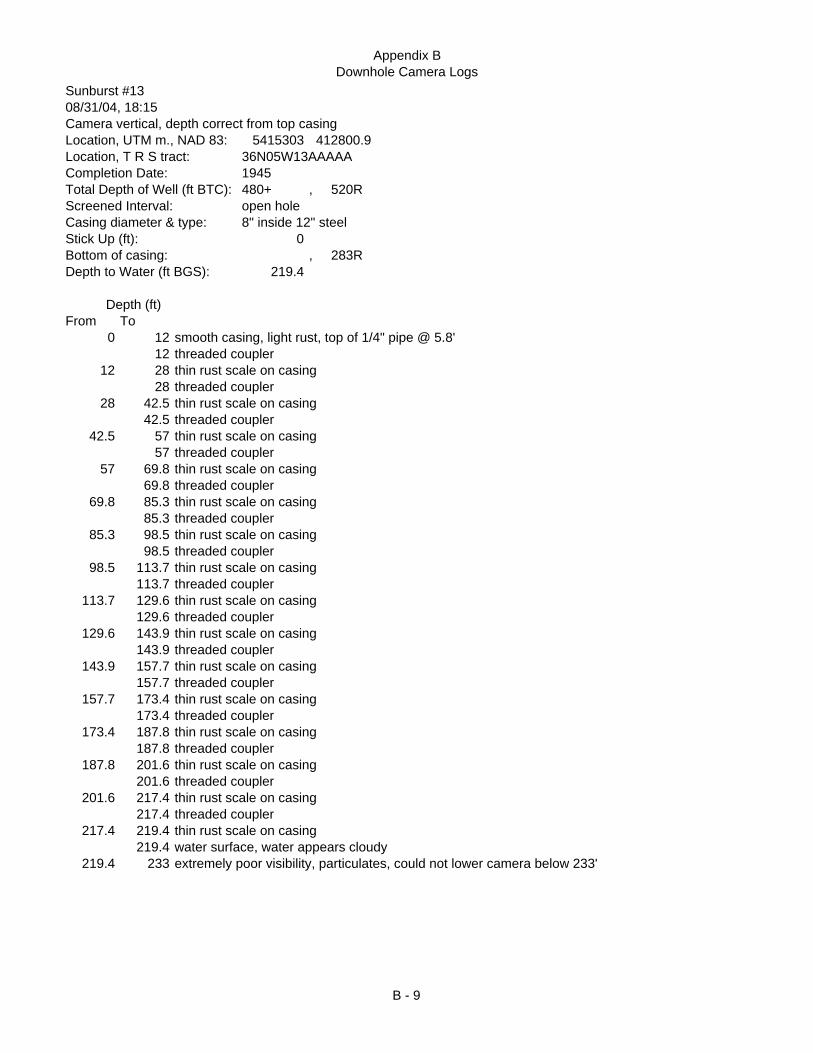
Appendix BDownhole Camera Logs
Sunburst #1308/31/04, 18:15Camera vertical, depth correct from top casingLocation, UTM m., NAD 83: 5415303 412800.9Location, T R S tract: 36N05W13AAAAACompletion Date: 1945Total Depth of Well (ft BTC): 480+ , 520RScreened Interval: open holeCasing diameter & type: 8" inside 12" steelStick Up (ft): 0Bottom of casing: , 283RDepth to Water (ft BGS): 219.4
Depth (ft)From To
0 12 smooth casing, light rust, top of 1/4" pipe @ 5.8'12 threaded coupler
12 28 thin rust scale on casing28 threaded coupler
28 42.5 thin rust scale on casing42.5 threaded coupler
42.5 57 thin rust scale on casing57 threaded coupler
57 69.8 thin rust scale on casing69.8 threaded coupler
69.8 85.3 thin rust scale on casing85.3 threaded coupler
85.3 98.5 thin rust scale on casing98.5 threaded coupler
98.5 113.7 thin rust scale on casing113.7 threaded coupler
113.7 129.6 thin rust scale on casing129.6 threaded coupler
129.6 143.9 thin rust scale on casing143.9 threaded coupler
143.9 157.7 thin rust scale on casing157.7 threaded coupler
157.7 173.4 thin rust scale on casing173.4 threaded coupler
173.4 187.8 thin rust scale on casing187.8 threaded coupler
187.8 201.6 thin rust scale on casing201.6 threaded coupler
201.6 217.4 thin rust scale on casing217.4 threaded coupler
217.4 219.4 thin rust scale on casing219.4 water surface, water appears cloudy
219.4 233 extremely poor visibility, particulates, could not lower camera below 233'
B - 9
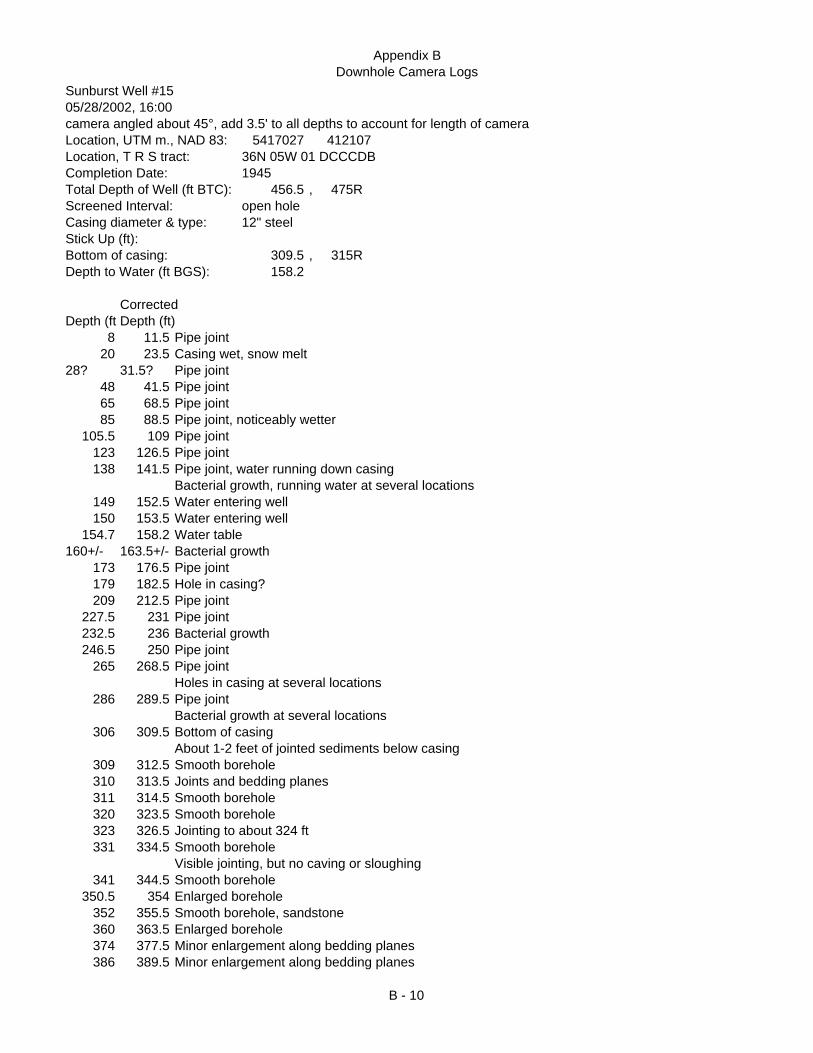
Appendix BDownhole Camera Logs
Sunburst Well #1505/28/2002, 16:00camera angled about 45°, add 3.5' to all depths to account for length of cameraLocation, UTM m., NAD 83: 5417027 412107Location, T R S tract: 36N 05W 01 DCCCDBCompletion Date: 1945Total Depth of Well (ft BTC): 456.5 , 475RScreened Interval: open holeCasing diameter & type: 12" steelStick Up (ft):Bottom of casing: 309.5 , 315RDepth to Water (ft BGS): 158.2
CorrectedDepth (ft Depth (ft)
8 11.5 Pipe joint20 23.5 Casing wet, snow melt
28? 31.5? Pipe joint48 41.5 Pipe joint65 68.5 Pipe joint85 88.5 Pipe joint, noticeably wetter
105.5 109 Pipe joint123 126.5 Pipe joint138 141.5 Pipe joint, water running down casing
Bacterial growth, running water at several locations149 152.5 Water entering well150 153.5 Water entering well
154.7 158.2 Water table160+/- 163.5+/- Bacterial growth
173 176.5 Pipe joint179 182.5 Hole in casing?209 212.5 Pipe joint
227.5 231 Pipe joint232.5 236 Bacterial growth246.5 250 Pipe joint
265 268.5 Pipe jointHoles in casing at several locations
286 289.5 Pipe jointBacterial growth at several locations
306 309.5 Bottom of casingAbout 1-2 feet of jointed sediments below casing
309 312.5 Smooth borehole310 313.5 Joints and bedding planes311 314.5 Smooth borehole320 323.5 Smooth borehole323 326.5 Jointing to about 324 ft331 334.5 Smooth borehole
Visible jointing, but no caving or sloughing341 344.5 Smooth borehole
350.5 354 Enlarged borehole352 355.5 Smooth borehole, sandstone360 363.5 Enlarged borehole374 377.5 Minor enlargement along bedding planes386 389.5 Minor enlargement along bedding planes
B - 10

Appendix BDownhole Camera Logs
395 398.5 Smooth borehole, sandstone400 403.5 Shale interbeds
Large voids, more shaley405 408.5 Shale
Sandstone414 417.5 Shale
Alternating sandstone and shale430 433.5 Sandstone
Shale435 438.5 Sandstone445 448.5 Alternating sandstone and shale450 453.5 Alternating sandstone and shale453 456.5 Bottom, loose silt and clay
B - 11

Appendix BDownhole Camera Logs
Sunburst #1609/01/04, 12:05Camera angled 45°, depth correct from top casingLocation, UTM m., NAD 83: 5417814 412118Location, T R S tract: 36N05W01ACCCDCompletion Date:Total Depth of Well (ft BTC): 416 , 525RScreened Interval: open holeCasing diameter & type: 12" steelStick Up (ft):Bottom of casing:Depth to Water (ft BGS): 184.6
Depth (ft)From To
0 13.1 clean casing, light rust13.1 threaded coupler
13.1 33 rust scale on casing, light33 threaded coupler
33 53.3 rust scale on casing, light53.3 threaded coupler
53.3 72 rust scale on casing, light72 threaded coupler
72 91.4 rust scale on casing, light91.4 threaded coupler
91.4 109 rust scale on casing, light109 threaded coupler
109 124.9 rust scale on casing, light124.9 threaded coupler
124.9 138.4 rust scale on casing, corrosion pits, water entering well starting ~ 136'138.4 threaded coupler
138.4 159.6 rust scale on casing, corrosion pits, water entering well159.6 threaded coupler
159.6 179.6 rust scale on casing, corrosion pits, water running down side of well179.6 threaded coupler
179.6 184.6 rust scale on casing, corrosion pits, water running down side of well184.6 water surface
184.6 199 rust scale on casing, corrosion pits, poor visibility, floating particulates199 threaded coupler
199 217.8 rust scale on casing, corrosion pits, poor visibility, floating particulates, barbed wire @ 206'217.8 threaded coupler
217.8 236.3 rust scale on casing, corrosion pits, poor visibility, floating particulates236.3 threaded coupler
236.3 250 rust scale on casing, corrosion pits, poor visibility, floating particulates250 416 lose visibility at about 250'
416 bottom, rubble
B - 12

Appendix BDownhole Camera Logs
08/31/04, 15:10Camera @ 45°, depth correct from top casingLocation, UTM m., NAD 83: 5414844 420749Location, T R S tract: 36N04W14AADDDCompletion Date:Total Depth of Well (ft BTC): , 171RScreened Interval: open holeCasing diameter & type: 12" steelStick Up (ft): 0Bottom of casing: , 78RDepth to Water (ft BGS): 104.3
Depth (ft)From To
0 10 casing clean, smooth10 15 casing clean, smooth, rusty15 17.7 casing clean, smooth, rust scale build up
17.7 threaded coupler17.7 20 casing clean, smooth, rust scale build up
20 30 thick rust scale build up, top pump shaft @ 30.7', shaft and bushing in 2", unthreaded30 39.5 rust on casing, appears damp
39.5 threaded coupler39.5 60 rust on casing, appears damp
60 61.1 casing wet, water appears to be entering well through corrosion pits61.1 threaded coupler
61.1 78.5 rust on casing, wet78.5 bottom of casing
78.5 85 smooth bore, water running down sides85 95 smooth bore, water running down sides, minor washouts at bedding95 104.3 smooth bore, water running down sides, minor washouts at bedding, rust build up on 2"
104.3 water table, floaters104.3 106 smooth bore, scum on sides
106 120 smooth bore, scum on sides, washouts at bedding119 top of 1/4" pipe
120 131.3 smooth bore, scum on sides, washouts at bedding131.3 top of pump or discharge pipe, covered with scum131.9 camera can't be lowered further
B - 13