Embed Size (px)
Citation preview
HELIA, 28, Nr. 43, p.p. 165-178, (2005) UDC 633.854.78:631.016
SUNFLOWER AREA AND PRODUCTION VARIABILITY IN PAKISTAN: OPPORTUNITIES AND CONSTRAINTS
Nisar Ali Shah, Hassnain Shah and Nadeem Akmal*
Social Science Institute, National Agricultural Research Center, Islamabad, Pakistan
Received: August 26, 2004Accepted: November 22, 2005
SUMMARY
The edible oil imports bill rising from Rs. 77 million in 1969-70 to Rs.3,900 million in 2002-03 has overburdened the economy of the country. Only30% of the total needs are met through local production, while 70% are pro-vided by import. Major share of the domestic production of edible oil comesfrom cottonseed and canola, 67 and 19.6%, respectively. The remaining 13.4%are contributed mainly by sunflower. Although it is a high oil, high yieldingcrop that gives high returns to the farmers, no serious effort has been made toincrease the local production of sunflower. Consequently, the sunflower acre-age declined from 144,191 ha in 1998-99 to 107,717 ha in 2002-03 and theproduction from 194,544 to 128,531 t during the same period. The 1998-99acreage was the maximum area under sunflower achieved. The big fluctuationsin sunflower acreage and production are due to its price on the market. In theperiod of last 15 years, the sunflower acreage in Pakistan expended from29,500 to 107,700 ha. The sunflower production rose at the annual rate of9.9%, comprised of a 9.7% expansion in acreage and a minor improvement inproductivity amounting to 0.16%. This increase was not sufficient to meet therequirements of the country. There is a big gap between the potential andactual yields of sunflowers. More than 70% of the potential have not beenachieved yet. For this purpose the R2 value was also calculated and, keeping inview the fluctuations in the time series data, second-degree equation was alsomeasured. Logarithmic and exponential functions were also tested but the var-iability in the data measured by the R2 value was best represented by second-degree polynomial function. When the data seem to depart more or less widelyfrom linearity in regression or time series analysis we must consider fittingsome other curve instead of the straight line. The R2 value was also improvedwith second-degree polynomial function for production from 43% to 58%showing a better fit of the trend line. The sum of the error terms was “0” forsecond-degree polynomial function but it gave a better fit due to a higher R2
value. The higher b value for production portrays an increase in the productiv-ity. The sum of squares for the estimated and observed values was 0. However,due to a low value of the coefficient of determination with linear trend and var-iation in the data, second-degree polynomial function (parabola) was estimatedwhich gave a higher value of the coefficient of determination. With the use of
* Corresponding author
166 HELIA, 28, Nr. 43, p.p. 165-178, (2005)
second-degree polynomial function the value of coefficient of determinationincreased from 50% to 60%.
Key words: sunflower, oilseed crops, trends in production, production tech-nology
INTRODUCTION
The total cultivated area of Pakistan is 20.69 million ha. Out of this cultivatedarea, 16.48 million ha or 79.65% of the total cultivated area are irrigated. In 1970-71, oilseeds occupied nearly 3% of the total cultivated area, which decreased to 2.5% by 2002-03. Due to a low oilseeds production, the edible oil needs are metthrough imports. The edible oil plays a vital role in the economy of the country.Pakistan is facing a severe deficit of edible oil and a large portion of the foreignexchange is spent for oil imports. The imports bill rose from Rs. 77 million in1969-70 to Rs. 3900 million in 2002-03 overburdening the economy of the country.Ahmad et al. (2002) concluded that the heavy burden of edible oil import on thecountry's foreign exchange exchequer necessitates an increase in the domestic pro-duction of edible oil crops to be effected by increasing the area under cultivationand adopting improved production technology. About 30% of the total needs aremet from local production, while 70% come from imports. The major share of thedomestic production of edible oil comes from cottonseed, contributing 67% of thelocal production. Canola contributes 19.6%. The remaining 13.4% are contributedmainly by sunflower cultivars with oil contents of 32-36%. Ashiq (2001) reportedthat instead of providing protection and institutional and financial support, empha-sis should be placed on enhancing per acre yields of sunflower and canola, the onlytwo promising crops for increasing domestic edible oil production and hence cut-ting back the edible oil import bill.
Sunflower is presently considered an important oilseed and a majority of thepeople in Pakistan prefers sunflower oil for cooking. Hamid et al. (1999) reportedthat two sizes of beef pieces were used for pickle preparation and later stored inthree commercial edible oils, i.e., canola oil, sunflower oil and soybean oil. Theresults showed that canola oil does not compete favorably with the other two oilswhich are claiming larger share in the oil market. Over the years sunflower hasbecome an important crop for both farmers and consumers in Pakistan. Sunfloweris a crop that fits well in the local cropping system and is considered the mostimportant cash crop in all parts of the country. In all parts of the country sunfloweris grown in two seasons, spring and summer. Although it is a high yielding, high oilcrop which gives high return to the farmers, no serious efforts have been made toincrease the local production of sunflower. Consequently, the sunflower acreagedeclined from 144,191 ha in 1998-99 to 107,717 ha in 2002-03 and productionfrom 194,544 to 128,531 t during the same period (GOP, 2003).
HELIA, 28, Nr. 43, p.p. 165-178, (2005) 167
The large fluctuations in sunflower area and production were due to theincreases and decreases of oilseeds price in the market. Although the governmenthas been assuring sunflower growers of guaranteed sale of their produce at a fairprice, it neither became a customer nor it came up with a support price. Public Sec-tor’s Pakistan Oilseed Development Board (PODB) announced that the crusherswould purchase the crop at Rs. 630 per 40 kg. However, the PODB has no controlover the industry and it does not affect the decision making when it comes to theprice of extraction units. The extraction industry has admittedly been supportive ofthe crop in the past but its positive response depends on numerous factors, most ofthem beyond its control. Consequently, the overall production of oilseeds could notmeet the increasing demand due to declining acreage and production. Due to highyields of sunflower, it has a potential to meet the future needs for oilseeds keepingin view the ever-increasing population pressure. Because of inept policies of govern-ment agencies, sunflower growers are shifting to other crops. Scientists and policymakers realize that cereals alone would not be able to sustain the rapidly growingpopulation.
The sunflower has been recognized as a crop with high potentials that can suc-cessfully meet future oil requirements. Pakistan should take full advantage of theirexperiences, especially in the light of increasing demographic pressure and techno-logical limitations, to further increase the sunflower production in new areas ratherthan in areas where sunflower and canola are already grown (Gootjes et al., 1997).Two crops of sunflower are grown in Pakistan, i.e., spring and summer. However,the national yield of about 1193.23 kg/ha (GOP, 2003) is low when compared withthe world standards. The main reasons for this low productivity are the lack ofquality seed, slow adoption of improved agro-technologies and absence of soundprice incentives for the farmers. Hussain and Khan (1998) noted that NPK applica-tion has significant effects on oil percentage, oil yield and production of sunflowers.Collaborative research endeavors are under way to overcome major production andmarketing constraints. The focus of research and development activities should beon selecting new suitable varieties and developing production technologies appro-priate for diverse environments. The objectives of this study were twofold: to exam-ine the trends in sunflower acreage, production and trade patterns, to determinesunflower potentials to increase the oilseeds production in the country and to iden-tify factors/constraints for fluctuation of sunflower acreage and production.
MATERIAL AND METHOD
It has been said that future belongs to those who plan for it best. Predictionsthat involve explaining the events which will occur at some future time are calledforecasts. Time series analysis is used to predict future values of variables fromtheir past values. Time series data of sunflower production and acreage for the last15 years were collected from secondary sources. To measure the developments in
168 HELIA, 28, Nr. 43, p.p. 165-178, (2005)
sunflower management during the study period, growth rate and percent change inacreage, production and productivity was calculated using the following formulae:
a) Compound growth rate
Yt= Yo (1+r) t where,
Yt = area/production in year tYo = base year area/production
r = compound growth rateForecasts for the future in the area and production was calculated as:
b) Forecast for next year
Yt +1 = Yt + (Yt*r)/100Least square method was used to fit the trend lines in the time series data (Fre-
und and Williams, 1977). First linear trend line and linear trend equation was cal-culated as:
Y= a + b XR2 value was also calculated and keeping in view the fluctuations in the time
series data second-degree equation was also measured. Logarithmic and exponen-tial functions were also tested but the variability in the data measured by the valueof R2 was best represented by second-degree polynomial function. When the dataseem to depart more or less widely from linearity in regression or time series anal-ysis we must consider fitting some other curve than a straight line. One of the mostuseful of these other curves is the parabola (Freund and Williams, 1977), whoseequation is:
Y = a + b X + c X2
where,Y = production or acreage
X = yeara = intercept
b = rate of change (slope) of Xc = rate of change (slope) of X2.
RESULTS
The main oilseeds crops are canola, groundnut, sunflower, soybean, safflower,lime seed and castor seed. In Pakistan, two types of oilseed crops are grown, tradi-tional (canola, groundnut and sesame) and non-traditional (sunflower, soybean,safflower). The acreages under these crops remain stable, with minor fluctuations.Canola ranks on top, sunflower is in the second and groundnut in the third place.There is a need to increase and sustain oilseeds availability for the future in light of
HELIA, 28, Nr. 43, p.p. 165-178, (2005) 169
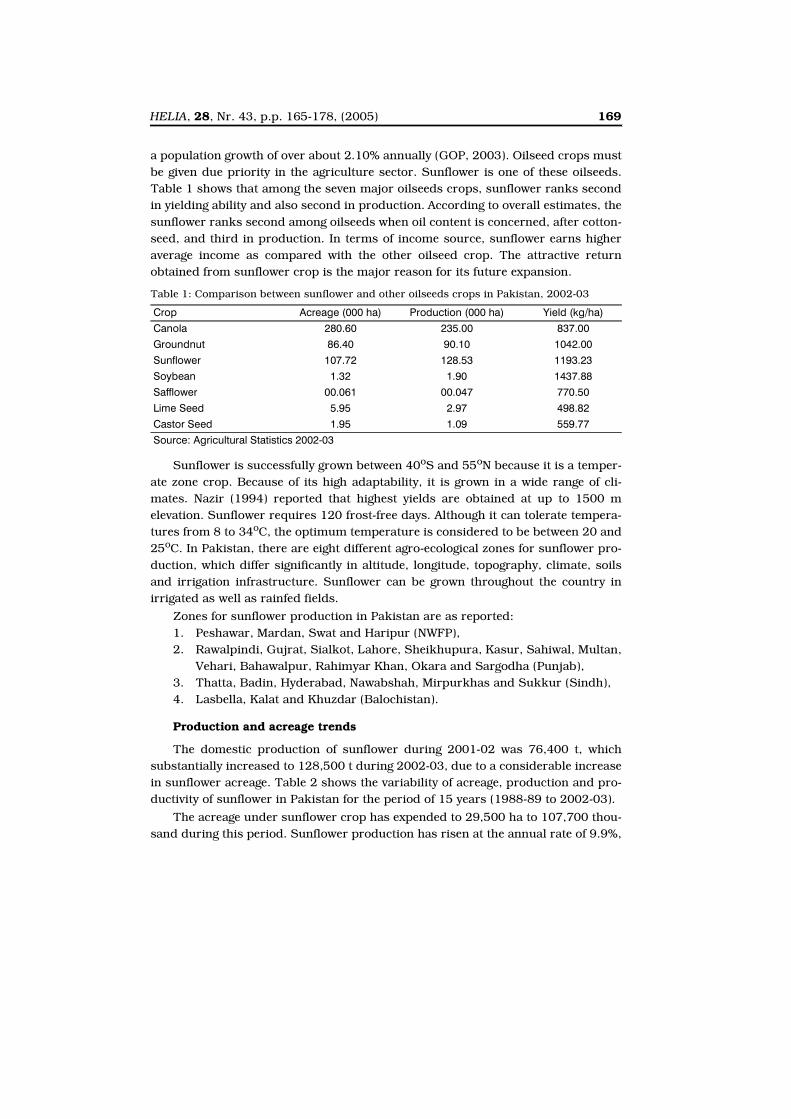
a population growth of over about 2.10% annually (GOP, 2003). Oilseed crops mustbe given due priority in the agriculture sector. Sunflower is one of these oilseeds.Table 1 shows that among the seven major oilseeds crops, sunflower ranks secondin yielding ability and also second in production. According to overall estimates, thesunflower ranks second among oilseeds when oil content is concerned, after cotton-seed, and third in production. In terms of income source, sunflower earns higheraverage income as compared with the other oilseed crop. The attractive returnobtained from sunflower crop is the major reason for its future expansion.
Sunflower is successfully grown between 40oS and 55oN because it is a temper-ate zone crop. Because of its high adaptability, it is grown in a wide range of cli-mates. Nazir (1994) reported that highest yields are obtained at up to 1500 melevation. Sunflower requires 120 frost-free days. Although it can tolerate tempera-tures from 8 to 34oC, the optimum temperature is considered to be between 20 and25oC. In Pakistan, there are eight different agro-ecological zones for sunflower pro-duction, which differ significantly in altitude, longitude, topography, climate, soilsand irrigation infrastructure. Sunflower can be grown throughout the country inirrigated as well as rainfed fields.
Zones for sunflower production in Pakistan are as reported:1. Peshawar, Mardan, Swat and Haripur (NWFP),2. Rawalpindi, Gujrat, Sialkot, Lahore, Sheikhupura, Kasur, Sahiwal, Multan,
Vehari, Bahawalpur, Rahimyar Khan, Okara and Sargodha (Punjab),3. Thatta, Badin, Hyderabad, Nawabshah, Mirpurkhas and Sukkur (Sindh),4. Lasbella, Kalat and Khuzdar (Balochistan).
Production and acreage trends
The domestic production of sunflower during 2001-02 was 76,400 t, whichsubstantially increased to 128,500 t during 2002-03, due to a considerable increasein sunflower acreage. Table 2 shows the variability of acreage, production and pro-ductivity of sunflower in Pakistan for the period of 15 years (1988-89 to 2002-03).
The acreage under sunflower crop has expended to 29,500 ha to 107,700 thou-sand during this period. Sunflower production has risen at the annual rate of 9.9%,
Table 1: Comparison between sunflower and other oilseeds crops in Pakistan, 2002-03
Crop Acreage (000 ha) Production (000 ha) Yield (kg/ha)
Canola 280.60 235.00 837.00
Groundnut 86.40 90.10 1042.00
Sunflower 107.72 128.53 1193.23
Soybean 1.32 1.90 1437.88
Safflower 00.061 00.047 770.50
Lime Seed 5.95 2.97 498.82
Castor Seed 1.95 1.09 559.77
Source: Agricultural Statistics 2002-03
170 HELIA, 28, Nr. 43, p.p. 165-178, (2005)
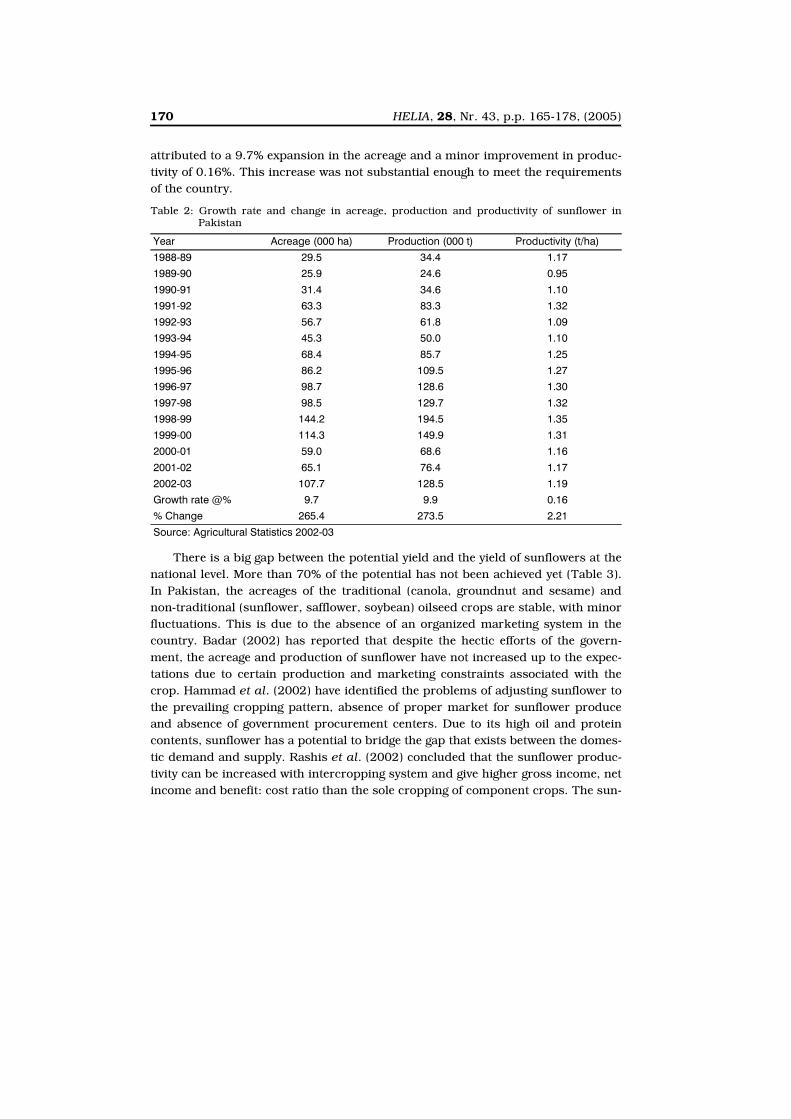
attributed to a 9.7% expansion in the acreage and a minor improvement in produc-tivity of 0.16%. This increase was not substantial enough to meet the requirementsof the country.
There is a big gap between the potential yield and the yield of sunflowers at thenational level. More than 70% of the potential has not been achieved yet (Table 3).In Pakistan, the acreages of the traditional (canola, groundnut and sesame) andnon-traditional (sunflower, safflower, soybean) oilseed crops are stable, with minorfluctuations. This is due to the absence of an organized marketing system in thecountry. Badar (2002) has reported that despite the hectic efforts of the govern-ment, the acreage and production of sunflower have not increased up to the expec-tations due to certain production and marketing constraints associated with thecrop. Hammad et al. (2002) have identified the problems of adjusting sunflower tothe prevailing cropping pattern, absence of proper market for sunflower produceand absence of government procurement centers. Due to its high oil and proteincontents, sunflower has a potential to bridge the gap that exists between the domes-tic demand and supply. Rashis et al. (2002) concluded that the sunflower produc-tivity can be increased with intercropping system and give higher gross income, netincome and benefit: cost ratio than the sole cropping of component crops. The sun-
Table 2: Growth rate and change in acreage, production and productivity of sunflower inPakistan
Year Acreage (000 ha) Production (000 t) Productivity (t/ha)
1988-89 29.5 34.4 1.17
1989-90 25.9 24.6 0.95
1990-91 31.4 34.6 1.10
1991-92 63.3 83.3 1.32
1992-93 56.7 61.8 1.09
1993-94 45.3 50.0 1.10
1994-95 68.4 85.7 1.25
1995-96 86.2 109.5 1.27
1996-97 98.7 128.6 1.30
1997-98 98.5 129.7 1.32
1998-99 144.2 194.5 1.35
1999-00 114.3 149.9 1.31
2000-01 59.0 68.6 1.16
2001-02 65.1 76.4 1.17
2002-03 107.7 128.5 1.19
Growth rate @% 9.7 9.9 0.16
% Change 265.4 273.5 2.21
Source: Agricultural Statistics 2002-03
HELIA, 28, Nr. 43, p.p. 165-178, (2005) 171
flower-mung bean intercropping gave the highest gross income per hectare (Rs.18431.04), net income (Rs. 10723.04) and benefit: cost ratio (2.39).
Trends in acreage and production of sunflower in Pakistan
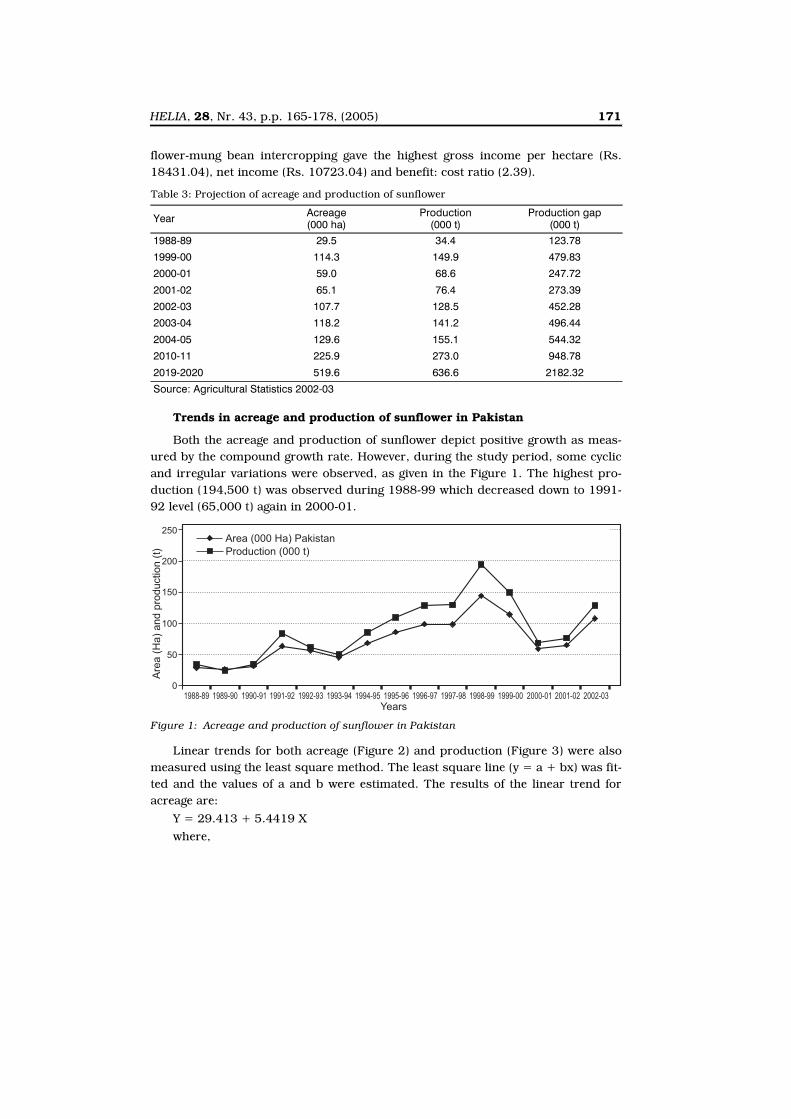
Both the acreage and production of sunflower depict positive growth as meas-ured by the compound growth rate. However, during the study period, some cyclicand irregular variations were observed, as given in the Figure 1. The highest pro-duction (194,500 t) was observed during 1988-99 which decreased down to 1991-92 level (65,000 t) again in 2000-01.
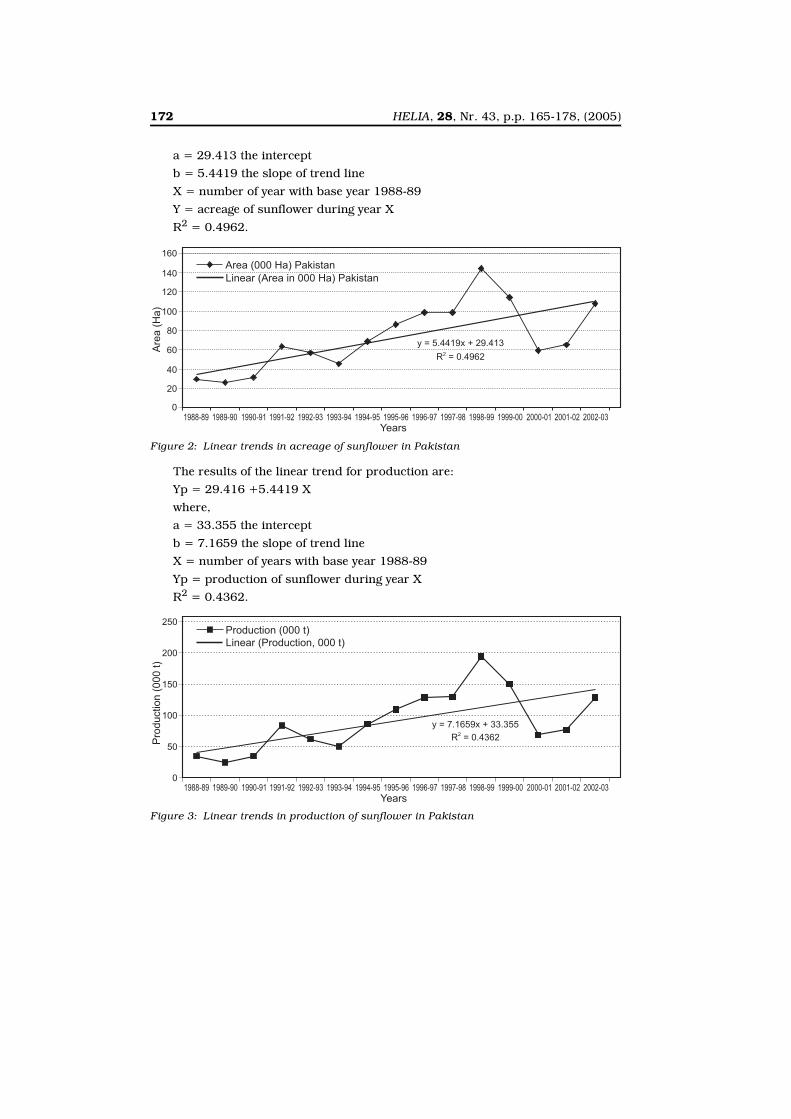
Linear trends for both acreage (Figure 2) and production (Figure 3) were alsomeasured using the least square method. The least square line (y = a + bx) was fit-ted and the values of a and b were estimated. The results of the linear trend foracreage are:
Y = 29.413 + 5.4419 X where,
Table 3: Projection of acreage and production of sunflower
Year Acreage (000 ha)
Production (000 t)
Production gap(000 t)
1988-89 29.5 34.4 123.78
1999-00 114.3 149.9 479.83
2000-01 59.0 68.6 247.72
2001-02 65.1 76.4 273.39
2002-03 107.7 128.5 452.28
2003-04 118.2 141.2 496.44
2004-05 129.6 155.1 544.32
2010-11 225.9 273.0 948.78
2019-2020 519.6 636.6 2182.32
Source: Agricultural Statistics 2002-03
Figure 1: Acreage and production of sunflower in Pakistan
172 HELIA, 28, Nr. 43, p.p. 165-178, (2005)
a = 29.413 the interceptb = 5.4419 the slope of trend line
X = number of year with base year 1988-89Y = acreage of sunflower during year X
R2 = 0.4962.
The results of the linear trend for production are:Yp = 29.416 +5.4419 X
where,a = 33.355 the intercept
b = 7.1659 the slope of trend lineX = number of years with base year 1988-89
Yp = production of sunflower during year XR2 = 0.4362.
Figure 2: Linear trends in acreage of sunflower in Pakistan
Figure 3: Linear trends in production of sunflower in Pakistan
HELIA, 28, Nr. 43, p.p. 165-178, (2005) 173
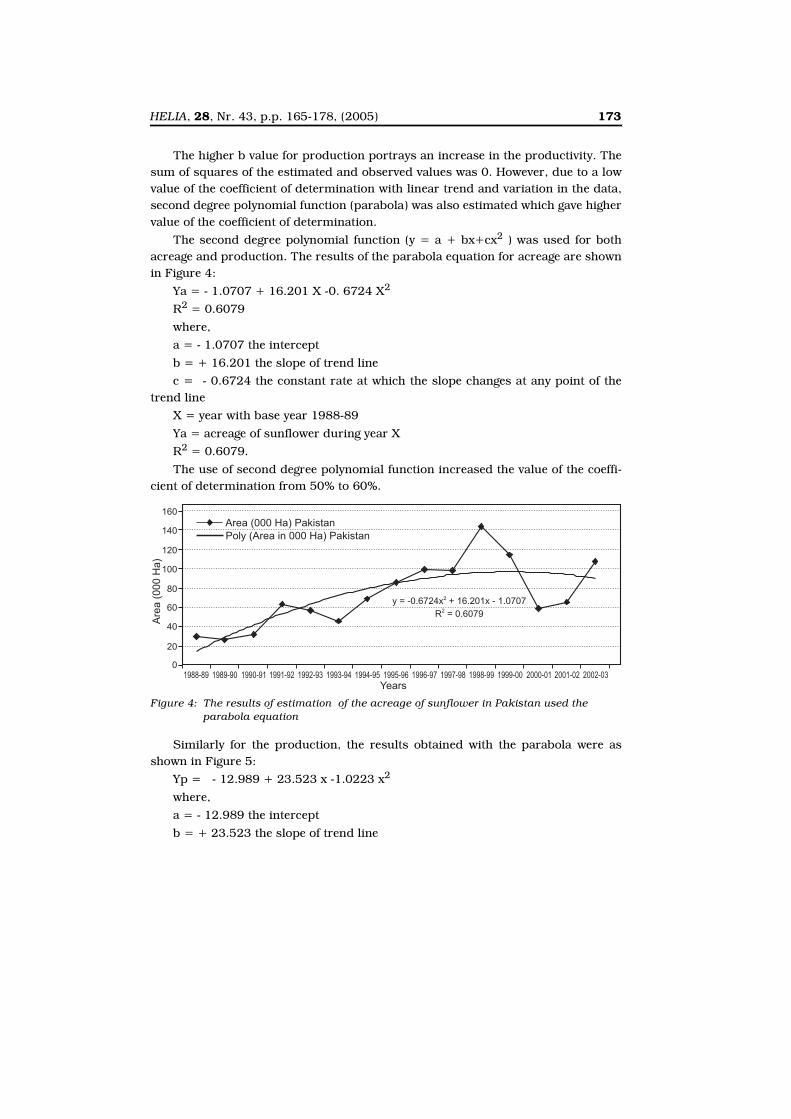
The higher b value for production portrays an increase in the productivity. Thesum of squares of the estimated and observed values was 0. However, due to a lowvalue of the coefficient of determination with linear trend and variation in the data,second degree polynomial function (parabola) was also estimated which gave highervalue of the coefficient of determination.
The second degree polynomial function (y = a + bx+cx2 ) was used for bothacreage and production. The results of the parabola equation for acreage are shownin Figure 4:
Ya = - 1.0707 + 16.201 X -0. 6724 X2
R2 = 0.6079
where,a = - 1.0707 the intercept
b = + 16.201 the slope of trend linec = - 0.6724 the constant rate at which the slope changes at any point of the
trend line X = year with base year 1988-89
Ya = acreage of sunflower during year XR2 = 0.6079.
The use of second degree polynomial function increased the value of the coeffi-cient of determination from 50% to 60%.
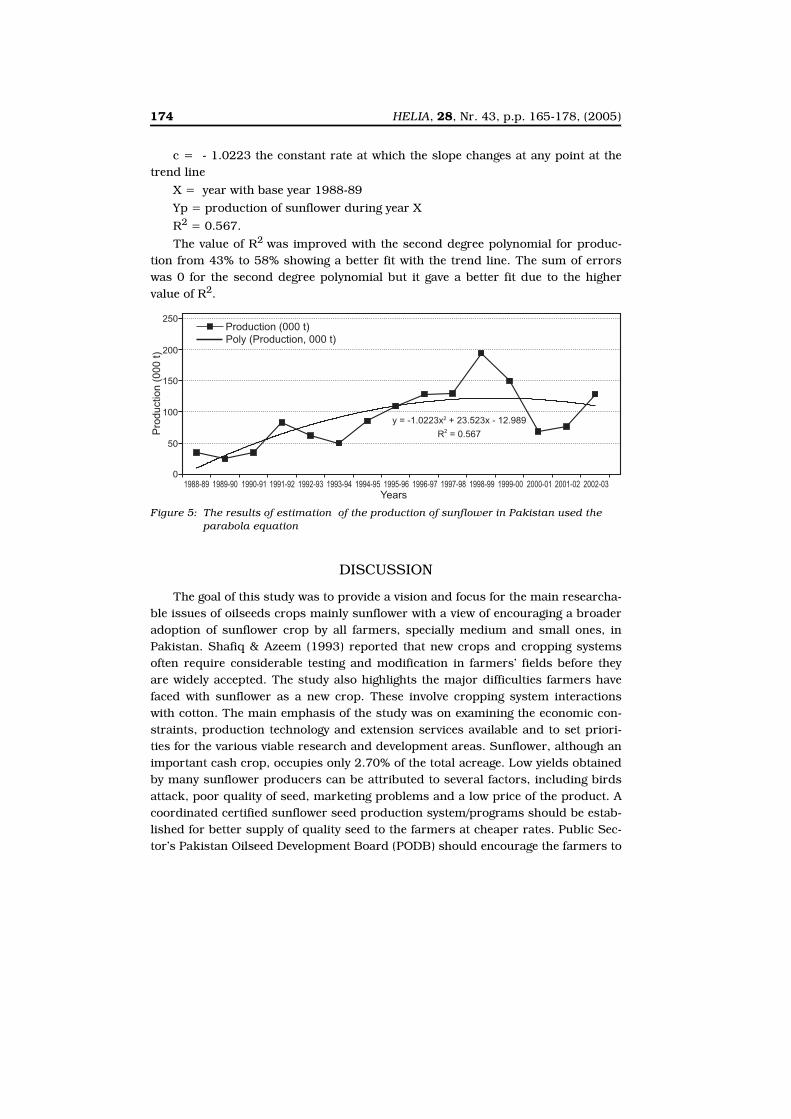
Similarly for the production, the results obtained with the parabola were asshown in Figure 5:
Yp = - 12.989 + 23.523 x -1.0223 x2
where, a = - 12.989 the intercept
b = + 23.523 the slope of trend line
Figure 4: The results of estimation of the acreage of sunflower in Pakistan used the parabola equation
174 HELIA, 28, Nr. 43, p.p. 165-178, (2005)
c = - 1.0223 the constant rate at which the slope changes at any point at thetrend line
X = year with base year 1988-89Yp = production of sunflower during year X
R2 = 0.567.The value of R2 was improved with the second degree polynomial for produc-
tion from 43% to 58% showing a better fit with the trend line. The sum of errorswas 0 for the second degree polynomial but it gave a better fit due to the highervalue of R2.
DISCUSSION
The goal of this study was to provide a vision and focus for the main researcha-ble issues of oilseeds crops mainly sunflower with a view of encouraging a broaderadoption of sunflower crop by all farmers, specially medium and small ones, inPakistan. Shafiq & Azeem (1993) reported that new crops and cropping systemsoften require considerable testing and modification in farmers’ fields before theyare widely accepted. The study also highlights the major difficulties farmers havefaced with sunflower as a new crop. These involve cropping system interactionswith cotton. The main emphasis of the study was on examining the economic con-straints, production technology and extension services available and to set priori-ties for the various viable research and development areas. Sunflower, although animportant cash crop, occupies only 2.70% of the total acreage. Low yields obtainedby many sunflower producers can be attributed to several factors, including birdsattack, poor quality of seed, marketing problems and a low price of the product. Acoordinated certified sunflower seed production system/programs should be estab-lished for better supply of quality seed to the farmers at cheaper rates. Public Sec-tor’s Pakistan Oilseed Development Board (PODB) should encourage the farmers to
Figure 5: The results of estimation of the production of sunflower in Pakistan used the parabola equation
HELIA, 28, Nr. 43, p.p. 165-178, (2005) 175
increase the local production of sunflower seed. Besides, the government shouldprotect the farmers against any loss coming from the cost of sunflower productionby ensuring a minimum support price. The private sector in the sphere of market-ing should be encouraged to stabilize the market prices. Research and demonstra-tion of improved cultivation techniques for increased productivity and reduced costof production should be organized to motivate more farmers for sunflower cultiva-tion. Agricultural Development Bank and other commercial banks should provideloans on good terms for development of sunflower industries in the country. Thereare no redundant intermediaries in the existing marketing structure. Instead, theiractivities need to be regulated more effectively and marketing services need to bemade more competitive by establishing and incorporating cooperative producersocieties or public sector organization into the marketing system. The sunflowercrop has a great potential and bright future in the country. The concerned institu-tions are to be geared to perform their responsibilities effectively and efficiently.
REFERENCES
Ahmad, S., Ali, M.I. and Ali, A., 2002. Profitability of Oilseed Crops in Rainfed Areas of thePunjab, Pakistan, V. 5(1), pp. 61-64.
Ashiq, R.M., 2001. Social Profitability of Wheat and Oilseed Production in Pakistan. PakistanJournal of Agricultural Economics, Pakistan, V. 4(1), pp. 34-49.
Badar, H., 2002. Production and Marketing Constraints Limiting Sunflower Production inPunjab, Pakistan. Journal of Rural Development and Administration, Pakistan, V. 34(1-4), pp. 119-133.
Freund, E.J. & Williams, J.F., 1977.“ Elementary Business Statistics, The Modern Approach,Third Edition”. Prentice Hall Inc., Englewood Cliffs, New Jersey, USA.
Government of Pakistan, 2002-2003. Pakistan Economic Survey, Economic Advisor’s Wing,Finance Division, Islamabad [Pakistan].
Government of Pakistan 2002-2003. Agricultural Statistics of Pakistan, Ministry of Food,Agriculture and Livestock, Economic Wing, Islamabad, Pakistan.
Gootjes, C.P., Bam, T.B., Shafiullah., Byamungu, D.A. and Iqbal, S., 1997. Production Problemsof Oilseed Growers in Punjab: An assessment of development and research needs forsmall and medium farmers. Working Document International Center for DevelopmentOriented Research in Agriculture. 1997, No. 63, x + 77 pp. 37 ref. Wageningen, theNetherlands.
Hussain, Z. & Khan, B., 1998. The Effect of NPK levels on the Oil Production of a Sunflowerhybrid. Sarhad Journal of Agriculture [Pakistan]. V. 14(4), p. 269-276.
Hamid, A., Choudhery, S.S. and Siddiqui, R.R., 1999. Meat Pickle in Common Edible Oils.Bangladesh Journal of Scientific and Industrial Research, 1999, 34(2): 254-260.
Hammad, B., Javed, M.S., Asghar, A. and Zahira, B., 2002. Production and MarketingConstraints Limiting Sunflower Production in Punjab, Pakistan. International Journal ofAgriculture and Biology 2002, 4(2): 267-271.
Rashid, I., Shahbaz, A., and Malik, M.A., 2002. Sunflower Summer Legumes IntercroppingSystem Under Rainfed Condition: Economic Analysis. Pakistan Journal of Scientific andIndustrial Research 2002, 45(6): 388-390.
Shafi Nazir, 1994. Crop Production. Elena Bashir and Robyn Bantel, eds., National BookFoundation, Islamabad, Pakistan. pp. 354-346.
Shafiq, M. and Azeem, M., 1993. Diagnosing Alternatives in Conventional Crop Rotations:Sunflowers as an Alternative to Wheat in the Cotton-Based Cropping Systems Pakistan’sPunjab. Agricultural Systems, 1993, 42(3): 245-264.
176 HELIA, 28, Nr. 43, p.p. 165-178, (2005)
SUPERFICIES Y VARIABILIDAD DE LA PRODUCCIÓN DE GIRASOL EN PAKISTÁN: POSIBILIDADES Y LIMITACIONES
RESUMEN
La cuenta para la importación del aceite comestible, que aumentó de 77millones de riales en el año 1969-70 a 3900 millones de riales en 2002-03, esun cargo muy pesado para la economía del país. Eso ocurre porque solamente30% de las necesidades totales de Pakistán, está garantizado desde la produc-ción nacional, y 70% se importa. La mayor parte de la producción nacional delaceite comestible, cubre el algodón, 67%, luego viene colza o canola, 19.6%, yel restante 13.4% corresponde, en mayor parte, al girasol. Aunque el girasol daaltos rendimientos, con el alto contenido de aceite que les garantiza buen ben-eficio a los productores, no se han hecho serios esfuerzos para aumentar laproducción local de girasol. Como resultado de ello, la superficie bajo el gira-sol, cayó de 144191 hectáreas en el año 1998-99 a 107717 hectáreas en el2002-03, y la producción se redujo de 194544 toneladas a 128531 toneladasen el mismo período. La superficie máxima fue lograda en el año 1998-99, y lamás baja en el año 2001-02. Grandes oscilaciones en superficies y producciónde girasol, son resultado de los precios mercantiles. La variabilidad de superfi-cies, producción y productividad de girasol en Pakistán, para el período de losúltimos 15 años, ha incrementado de 29.5 mil hectáreas a 107.7 mil. La conse-cuencia de ello es que la producción de girasol crecía por el pie anual de 9.9%,de los cuales 9.7% corresponde a la extensión de las superficies, y sólo 0.16 %corresponde al aumento de la producción. Eso no era suficiente para satisfacerlas necesidades del país. Existe una gran diferencia entre el rendimiento poten-cial y el rendimiento nacional de girasol. Con este fin fue calculado el valor R2,que está incluido en la fórmula de segundo grado, que tiene en cuenta tambiénla serie temporal. También fueron probadas las tablas logarítmicas y las fun-ciones exponenciales, pero la variabilidad de los datos calculados al valorbásico R2 fue presentada de la mejor forma con la función polinómica de seg-undo grado. Cuando parece que los datos desvían en mayor o menor medidade la regresión lineal o del análisis de la serie temporal, es imprescindible con-siderar la utilización de alguna otra curva aparte de la línea recta. El valor R2
también fue mejorado en la función polinómica de segundo grado para elparámetro de producción de 43% a 58% mostrando el mejor fitting con la líneade la tendencia. La suma de errores también ascendía a “0” para el polinomiode segundo grado, pero concordaba mejor por causa del mayor valor de R2. Elvalor b aumentado para la producción, también refleja el incremento de pro-ductividad. La suma del cuadrado del valor evaluado y el obtenido, fue 0. Pero,debido al bajo coeficiente de determinación con la tendencia lineal y las varia-ciones de los datos de la función polinómica de segundo grado, fue calculada(parábola), que dio el valor más alto del coeficiente de determinación. Utili-zando la función polinómica de segundo grado, el valor del coeficiente dedeterminación incrementó de 50% a 60%.
HELIA, 28, Nr. 43, p.p. 165-178, (2005) 177
RÉGION DE CULTURE DU TOURNESOL ET VARIABILITÉ DE LA PRODUCTION AU PAKISTAN : POSSIBILITÉS ET CONTRAINTES
RÉSUMÉ
Les frais d’importation d’huile comestible qui ont augmenté de 77 mil-lions de rials en 1969-70 à 3900 millions de rials en 2002-03 sont une chargetrop grande pour l’économie du pays. Trente pourcent des besoins totaux sontcomblés par la production locale et 70% par l’importation. La plus grandepartie de la production locale d’huile comestible est assurée par le coton 67%,puis par le colza ou le canola, 19,6% et les 13,4% restant par le tournesol.Bien que le tournesol soit très rentable, qu’il ait un important contenu d’huileet donne de grands bénéfices aux fermiers, aucun effort sérieux n’a été faitpour améliorer la production locale. Le résultat en est que la surface occupéepar le tournesol est passée de 144 191 hectares en 1998-99 à 107 717 hec-tares en 2002-03 et la production de 194 544 tonnes à 128 531 à la mêmepériode. La surface maximale a été atteinte en 1998-99 et minimale en 2001-02. Les importantes oscillations dans les surfaces et la production du tour-nesol sont le résultat des prix du marché. La variabilité de la surface, de laproduction et de la productivité du tournesol au Pakistan au cours des 15dernières années a augmenté de 29,5 mille hectares à 107,7 mille. La con-séquence en est que la production du tournesol a crû à un taux annuel de 9,9%dont 9,7% peuvent être attribués à l’augmentation de la surface et seulement0,16% à l’augmentation de la production. Ceci n’a pas suffi à combler lesbesoins du pays. Il existe une grande différence entre le rendement potentiel etle rendement national du tournesol. Plus de 70% du potentiel n’a pas étéatteint par cette culture. Ainsi, a-t-on calculé la valeur R2 qui est comprisedans la formule de deuxième degré qui tient compte de la série temporelle. Lesfonctions logarithmiques et exponentielles ont aussi été testées mais la varia-bilité des données calculées sur la base de la valeur R2 a le mieux représenté lafonction de polynôme de deuxième degré. Quand les données semblents’éloigner en plus ou moins grande mesure de la régression linéaire ou del’analyse de la série temporelle, il faut considérer l’utilisation d’une courbe enplus de la ligne droite. La valeur R2 s’est aussi améliorée sous la fonctionpolynôme de deuxième degré pour le paramètre de production de 43% à 58%montrant une meilleure conformité à la ligne de la tendance. La somme deserreurs était aussi de « 0 » pour le polynôme de deuxième degré mais con-cordait mieux à cause d’une plus grande valeur pour R2. La valeur b augmentépour la production était aussi de 0. Cependant, à cause du faible coefficient dedétermination avec la tendance linéaire et de la variation des données de lafonction polynôme de deuxième degré, la (parabole) a été calculée qui a donnéune valeur supérieure du coefficient de détermination. Au moyen de la fonc-tion polynôme de deuxième degré, la valeur du coefficient de détermination aaugmenté de 50 à 60%.

178 HELIA, 28, Nr. 43, p.p. 165-178, (2005)