Embed Size (px)
Citation preview

Asia Pacific Equity Research
24 May 2011
Top Stories Strategy, China Maximizing returns in an inflation stabilization period (Frank Li) MSCI China may continue to seesaw in the short term. We maintain a 3-6 month positive view &recommend investors take advantage of possible market volatility on growth fears to boost China exposure. We upgrade insurance stocks from UW to OW & downgrade cement & construction mach to N from OW in our Model Portfolio.
Quantitative Strategy, Asia/Global Emerging Markets Revisiting Country versus Sector in GEM (Steve Malin) We provide an update on our previous analysis of the relative importance of country effect and sector effect for stock returns in the emerging markets. We focus more closely on what we regard as the more interesting conclusion regarding the general increase in the relevance of sector (vs. country), and reconfirm this is still the case.
Axis Bank Ltd (OW), India Upgrade to OW, PT unchanged at Rs1525 (Seshadri K Sen, CFA) Our upgrade is due to the recent underperformance and our increased conviction that the balance sheet quality (liabilities) will improve. The recent weakness (down 18% in 1m) has taken valuations to below historical mean and, while the power sector exposure remains a worry, we think the key concerns are priced in.
Tata Steel Ltd (OW), India Revise PT to Rs785; buy in current weakness (Pinakin Parekh, CFA) We continue to believe that TATA’s investment case remains strong given the ~3MT India expansion by Dec-11, which even in the current state of oversupplied domestic markets should still have EBITDA/MT of $305. The recent share price weakness is more macro driven, and we do not see any risks to our investment thesis.
Strategy, Malaysia Updates from Invest Malaysia New York (Hoy Kit Mak) We recently co-hosted Invest Malaysia New York 2011, with a good turnout. Prime Minister Najib gave 10 reasons to invest in Malaysia. Speaking with US investors, we gather that many are still underweight Malaysia but believe that Malaysia is a defensive market and has little downside risk.
Link for full .pdf version
Sunil Garg (852) 2800-8518 [email protected] Send me your feedback! AM perspective Adrian Mowat, Chief Equity Strategist UW Korea
Source: Bloomberg, 24 May 2011. Rebased to 100.
The fundamental outlook justifies an UW in Korea. The EM strategy team is concerned about both domestic and external demand. Korean food inflation is 11%, compressing real income growth. Problems in the property market continue. The regulator asked private banks to fund a “W10 trillion bad bank” that will absorb non-performing real-estate project-financing loans from Korea’s troubled savings banks. Global growth is slowing, this is negative for exporters. For more, please see Key Trades and Risks, Mowat et al, 21 April 2011 Click below for the: J.P. Morgan Daily Valuations Latest Weekly AP Banks Analyzer (.xls) Daily Global Economic Briefing
Link to Other FTMs page Link to Morgan Markets page

Recommendation and Forecast Changes • Axis Bank Ltd (Overweight), India (Seshadri K Sen,
CFA) Valuations now reasonable, upgrade to OW
• Banpu Public (Overweight), TIP Markets (Sukit Chawalitakul) Clearer Down Under
• Franshion Properties (China) Ltd. (Overweight), China (Lucia Kwong, CFA) Gathering the momentum, building the brand; reiterate OW
• Hite Brewery (Overweight), South Korea (Jinah Lee) Pre-merger concerns causing unsettledness
• Kangwon Land (Neutral), South Korea (Jinah Lee) Visitor drop likely to continue
• Sino Biopharmaceutical (Overweight), China (Leon Chik, CFA) Lowering target price to HK$3.6 - Stronger sales growth but higher selling costs in 1Q
• Tata Steel Ltd (Overweight), India (Pinakin Parekh, CFA)
Investment Case Remains Strong; Would Be Buyers in Current Weakness
Strategy • Market Strategy, Asia Pacific (Adrian Mowat)
Asia Pacific Strategy Dashboards
• Market Strategy, Global (Adrian Mowat) Global Developed Markets Strategy Dashboards
• Market Strategy, TIP Markets (Gilbert Lopez) Philippines Market Strategy: 1Q11 earnings round-up: a clear deterioration
Economics • Economy, Asia Pacific (Sin Beng Ong)
Asia focus: food prices
• Economy, China (Grace Ng) Flash May Markit manufacturing PMI eased as expected
• Economy, Hong Kong (Grace Ng) April headline CPI continued to rise at an elevated 4.6%oya pace
• Economy, Singapore: (Matt Hildebrandt) Inflation continues its downward trend
• Economy, Taiwan (Grace Ng) Apr IP weakened notably, likely reflecting supply chain impact from Japan quake
• Economy, TIP Markets (Matt Hildebrandt) A hefty April surplus leaves fiscal consolidation on track
• Economy, TIP Markets (Matt Hildebrandt) Economy to cool after strong start to the year
• Economy, TIP Markets (Matt Hildebrandt) Philippines: Data Watch 05-20
Results and Company Views • Allgreen Properties (Neutral), Singapore (Christopher
Gee, CFA) General offer at S$1.60 per share
• Bharat Heavy Electricals (BHEL) (Overweight), India (Shilpa Krishnan) Audited numbers reveal profit composition was less rosy than reported earlier - ALERT
• Bharat Heavy Electricals (BHEL) (Overweight), India (Shilpa Krishnan) Remain positive post FY11 results and conference call
• Big C Supercenter Pcl (Overweight), TIP Markets (Maria Lapiz) Synergy could flow faster; potential upside risk to our estimates
• Crompton Greaves Limited (Overweight), India (Sumit Kishore) Emotron acquisition to boost Industrial systems growth
• Gas Authority of India Limited (Overweight), India (Pradeep Mirchandani, CFA) Higher subsidies hit 4Q
• Hon Hai Precision (Neutral), Taiwan (Gokul Hariharan)
Fire in Chengdu plant; Implications - ALERT
Sector Research • Banks, TIP Markets (Anne Jirajariyavech)
Thai banks: Government cheap loans: Knock-on impacts to banks - ALERT
• Internet, Asia Pacific (Dick Wei) Regional Internet Newsflow - Week Ending May 20: Tencent acquired 16% stake of eLong, Shanda Games launched open testing for "Legend of Immortals"
• Property, China (Ryan Li) China Property Weekly: Property sales for the week ending May 22, 2011
• Property, Hong Kong (Amy Luk, CFA) Hong Kong Property Update: Weekly primary sales: 111 units
• Semiconductors, Asia Pacific (JJ Park) Display Market Update: All panel sizes experience price increase; Accumulate selective panel makers - ALERT
• Telecom Services, Asia Pacific (James R. Sullivan, CFA)
JPM Asia Telco Back Testing Analysis: Investing our recommendations: 23rd May 2011
Analyst Trading/Focus list • Asia Analyst Focus List, TIP Markets (Liliana Bambang)
Remove Pair Trade: Agung Podomoro Land as Long and Lippo Karawaci Tbk as Short - ALERT

Markets at a glance
China Hong Kong India SHASHR Index 2,905.75 HSI Index 22,711.02 Sensex Index 17,993.33Chg from previous day -2.93% Chg from previous day -2.11% Chg from previous day -1.82%T/O value (CNYmn / US$MM) 111,455 / 17,129 T/O value (HK$ mn / US$MM) 57,764 / 7,428 T/O value (INR bn / US$MM) 628 / 13,872Chg from previous day 32.54% Chg from previous day 0.00% Chg from previous day -20.54%Exchange rate CNY6.5 / US$1 Exchange rate HKD7.78 / US$1 Exchange rate INR45.2 / US$1O/N interbank (%) 3.98 O/N interbank (%) 0.01 O/N interbank (%) 7.25Market cap (CNYBn) 18,114.7 Market cap (HK$Bn) 20,405.4 Market cap (US$Bn) 1435.9Market cap (US$ Bn) 2,784 Market cap (US$ Bn) 2,624 Market cap (INR Bn) 64,953FY1E Market P/E 13.4 FY1E Market P/E 13.2 FY1E Market P/E 19.5FY2E Market P/E 11.3 FY2E Market P/E 12.6 FY2E Market P/E 16.0
Indonesia Malaysia Philippines JCI Index 3,778.45 KLCI Index 1,528.98 PSE Index 4,263.19Chg from previous day -2.44% Chg from previous day -0.78% Chg from previous day -0.51%T/O value (Rp bn / US$MM) 5,038 / 586 T/O value (MYR MM / US$MM) - T/O value (Php MM / US$MM) 3,620 / 83Chg from previous day 37.97% Chg from previous day - Chg from previous day -21.95%Exchange rate Rp8,593 / US$1 Exchange rate MYR3.06 / US$1 Exchange rate Php43.41 / US$1O/N interbank (%) 6.90 O/N interbank (%) 2.99 O/N interbank (%) 4.50Market cap (US$Bn) 392.3 Market cap (US$ bn) 265.4 Market cap (US$ bn) 92.5Market cap (Rp bn) 3,371,277 Market cap (MYR bn) 813 Market cap (Php bn) 4,016FY1E Market P/E 16.5 FY1E Market P/E 15.8 FY1E Market P/E 15.6FY2E Market P/E 13.8 FY2E Market P/E 13.2 FY2E Market P/E 13.6
Singapore South Korea Taiwan STI Index 3,110.48 KOSPI Index 2,055.71 TWSE Index 8,747.51Chg from previous day -0.98% Chg from previous day -2.64% DoD Change -1.01%T/O value (SGD MM / US$MM) 1,200 / 961 T/O value (KRW bn / US$MM) 6,239 / 5,683 52-Week Range 9,207 / 7,032Chg from previous day -4.97% Chg from previous day 0.9% T/O value (NT$ mn / US$MM) 17,181 / 594Exchange rate SGD1.25 / US$1 Exchange rate KRW1097.80 / US$1 Chg from previous day -16.55%O/N interbank (%) 0.03 O/N interbank (%) 3.00 Exchange rate TWD28.9 / US$1Market cap (US$ bn) 564.1 Market cap (KRW Bn) 1,275 O/N interbank (%) 0.32Market cap (SGD bn) 704 Market cap (US$ Bn) 1,161 10 Year Gov Bond Yield (%) 1.43FY1E Market P/E 15.3 FY1E Market P/E 12.2 Market cap (NT$Bn) 23,166.0FY2E Market P/E 13.5 FY2E Market P/E 10.4 Market cap (US$ Bn) 918 FY1E Market P/E 16.8 FY2E Market P/E 13.1
Thailand SET Index 1,053.97 Chg from previous day -1.77% T/O value (Bt bn / US$MM) 28 / 913 Chg from previous day 7.61% Exchange rate Bt30.40 / US$1 O/N interbank (%) 2.37 Market cap (US$Bn) 295.0 Market cap (Bt bn) 8,967 FY1E Market P/E 15.3 FY2E Market P/E 13.4
Source: Bloomberg, J.P. Morgan estimates.

Asia Analyst Focus List OPEN TRADES (as of May 23, 2011 close) Long Trades – Relative1
Country/ Company Name
BBG Ticker Analyst Name Rating2 Add Date Add Price
Current Price
Price Target2
Trade Time Horizon
Abs. Perf Since Add
Date (%)
Return Relative to
Country Index (%)3
Australia National Australia Bank NAB AU Scott Manning OW 6-May-11 27.78 26.66 32.68 6-12 M -4.0 -3.6OneSteel Limited OST AU Benjamin Wilson OW 2-May-11 2.08 1.81 2.70 6-12 M -13.0 -10.6ASX Ltd ASX AU Russell Gill OW 6-Apr-11 33.75 31.60 38.80 6-12 M -6.4 -2.6Insurance Australia Group IAG AU Siddharth Parameswaran OW 18-Mar-11 3.36 3.47 4.40 6-12 M 3.3 1.2Suncorp Group Ltd SUN AU Siddharth Parameswaran OW 18-Mar-11 7.95 8.33 10.86 6-12 M 4.8 2.7Qantas Airways QAN AU Scott Carroll OW 2-Mar-11 2.28 2.11 2.86 6-12 M -7.5 -5.9Charter Hall Group CHC AU Rob Stanton OW 24-Feb-11 2.34 2.42 2.83 6-12 M 3.4 5.2Credit Corp Limited CCP AU Alexander Mees, ACA OW 15-Feb-11 4.90 5.33 6.17 6-12 M 8.9 13.0ING Office Fund IOF AU Michael Scott OW 7-Feb-11 0.60 0.62 0.70 6-12 M 3.4 6.2Mirvac Group MGR AU Richard Jones, CFA OW 4-Feb-11 1.24 1.27 1.50 6-12 M 2.0 4.7iiNet IIN AU Laurent Horrut OW 2-Aug-10 2.66 2.85 3.41 6-12 M 7.0 3.6Campbell Brothers Limited CPB AU Alexander Mees, ACA OW 9-Sep-09 22.13 45.60 39.18 6-12 M 106.0 102.2China (SHASHR) Skyworth Digital Holdings 751 HK Leon Chik, CFA OW 12-May-11 5.24 4.81 7.00 6-12 M -8.2 -9.0Lenovo Group Limited 992 HK Gokul Hariharan OW 21-Mar-11 4.18 4.22 5.80 6-12 M 1.0 5.6Noah Holdings Ltd NOAH US Samuel Chen OW 26-Feb-11 13.63 14.84 22.50 6-12 M 8.9 12.5China Agri-Industries 606 HK Ying-Jian Chan OW 25-Jan-11 7.81 8.55 10.60 6-12 M 9.5 5.8China Cosco Holdings, Ltd. 1919 HK Corrine Png OW 11-Jan-11 8.70 7.02 11.80 6-12 M -19.3 -18.3China Minsheng Banking - A 600016 CH Samuel Chen OW 27-Nov-10 5.13 5.90 8.20 6-12 M 15.0 18.4China Minsheng Banking - H 1988 HK Samuel Chen OW 27-Nov-10 6.90 7.10 10.00 6-12 M 2.9 6.3The United Laboratories 3933 HK Leon Chik, CFA OW 5-Nov-10 15.52 12.48 22.00 6-12 M -19.6 -8.2Shenzhen Expressway - H 548 HK Karen Li, CFA OW 8-Sep-10 3.77 5.13 9.10 6-12 M 36.0 33.1China Unicom H Share 762 HK Lucy Liu OW 2-Aug-10 10.72 16.26 18.60 6-12 M 51.7 48.0Focus Media FMCN US Dick Wei OW 3-Jun-10 15.87 32.98 33.00 6-12 M 107.8 99.3AAC Acoustic 2018 HK Alvin Kwock OW 8-Sep-08 4.69 18.42 22.00 6-12 M 292.5 263.3Industrial and Commercial Bank of China - A 601398 CH Samuel Chen OW 30-Oct-09 4.79 4.46 7.00 6-12 M -6.8 0.8Hong Kong Nine Dragons Paper Holdings Ltd 2689 HK Leon Chik, CFA OW 11-May-11 8.13 7.60 13.00 6-12 M -6.5 -6.1AIA Group Ltd 1299 HK Bao Ling Chan OW 18-Apr-11 25.70 26.00 28.00 6-12 M 1.2 4.0Pacific Basin Shipping 2343 HK Corrine Png OW 11-Jan-11 4.88 4.56 7.00 6-12 M -6.5 -1.8China Minsheng Banking - H 1988 HK Samuel Chen OW 27-Nov-10 6.90 7.10 10.00 6-12 M 2.9 6.3Wheelock & Company Ltd 20 HK Benjamin Lo, CFA OW 19-Nov-10 28.85 32.15 35.80 6-12 M 11.4 12.6HSBC Holdings plc 5 HK Sunil Garg OW 24-May-10 69.15 79.45 110.00 6-12 M 14.9 -15.0COSCO Pacific 1199 HK Karen Li, CFA OW 26-Aug-08 9.87 15.30 20.70 6-12 M 55.0 31.9India Sintex Industries Limited SINT IN Princy Singh OW 13-Jan-11 167.30 168.25 270.00 6-12 M 0.6 5.8IndusInd Bank IIB IN Seshadri K Sen, CFA OW 19-Nov-10 265.15 241.30 325.00 6-12 M -9.0 -1.3Ballarpur Industries Ltd. BILT IN Princy Singh OW 20-Oct-10 37.13 32.05 50.00 6-12 M -13.7 -3.8Apollo Hospitals Enterprise Ltd. APHS IN Princy Singh OW 5-Oct-10 463.15 479.85 590.00 6-12 M 3.6 15.6Indonesia Bank Rakyat Indonesia BBRI IJ Aditya Srinath, CFA OW 1-Apr-11 5850.00 6250.00 7300.00 6-12 M 6.8 4.9Japan Canon (7751) 7751 JT Hisashi Moriyama OW 14-Jan-11 4185 3660 5000 6-12 M -12.5 -1.3Nikon (7731) 7731 JT Hisashi Moriyama OW 4-Jan-11 1732 1793 2500 6-12 M 3.5 13.0Inpex Corporation 1605 JT Brynjar Eirik Bustnes OW 1-Sep-10 384334 532000 750000 6-12 M 38.4 36.3DAINIPPON SCREEN MFG. (7735) 7735 JT Hisashi Moriyama OW 22-Jun-10 489 656 1200 6-12 M 34.2 41.2FUJIFILM Holdings (4901) 4901 JT Hisashi Moriyama OW 26-Jan-10 2891 2328 3800 6-12 M -19.5 -9.3Honda Motor (7267) 7267 JT Kohei Takahashi OW 19-Jan-10 3229 3030 3900 6-12 M -6.2 7.2Hitachi (6501) 6501 JT Yoshiharu Izumi OW 29-Jul-09 302 452 590 6-12 M 49.7 60.0Malaysia IJM Land IJMLD MK Simone Yeoh OW 3-May-11 2.80 2.78 3.40 6-12 M -0.7 -1.3Dialog Group Bhd DLG MK Hoy Kit Mak OW 28-Apr-11 2.56 2.70 3.00 6-12 M 5.5 5.2RHB Capital RHBC MK Harsh Wardhan Modi OW 18-Nov-10 7.68 9.13 10.40 6-12 M 19.0 16.0Philippines Philippine Stock Exchange PSE PM Harsh Wardhan Modi OW 9-Oct-07 352.95 511.00 605.00 6-12 M 44.8 53.2International Container Terminal Services Inc ICT PM Jeanette G Yutan OW 8-Sep-10 35.15 51.05 60.00 6-12 M 45.2 44.7Singapore CapitaMalls Asia CMA SP Joy Wang OW 21-Jan-11 1.89 1.59 2.75 6-12 M -15.8 -13.7Singapore Airlines SIA SP Corrine Png OW 23-May-10 13.88 14.14 19.00 6-12 M 1.9 -12.9Noble Group Ltd NOBL SP Ajay Mirchandani OW 12-Nov-09 1.74 2.00 2.75 6-12 M 15.2 2.3Olam International Limited OLAM SP Ajay Mirchandani OW 2-Oct-08 1.64 2.83 3.70 6-12 M 72.8 46.1DBS Group Holdings DBS SP Harsh Wardhan Modi OW 8-Aug-08 14.19 14.50 24.00 6-12 M 2.2 -4.6South Korea

Nong Shim 004370 KS Jinah Lee OW 17-Mar-11 220500 248500 270000 6-12 M 12.7 5.8Samsung Engineering 028050 KS Jinmook Kim OW 6-Feb-11 206000 222500 250000 6-12 M 8.0 6.5LG Electronics 066570 KS JJ Park OW 15-Jan-11 114000 102500 140000 6-12 M -10.1 -10.0LG Chem Ltd 051910 KS Samuel Lee, CFA OW 14-Oct-10 323567 484500 491000 6-12 M 49.7 36.0LG Innotek 011070 KS Hyunjoon Roh OW 23-Mar-10 111111 101000 240000 6-12 M -9.1 -35.7LG Display 034220 KS JJ Park OW 15-Mar-10 35451 36500 50000 6-12 M 3.0 -26.6Taiwan Wistron Corporation 3231 TT Alvin Kwock OW 27-Apr-11 47.10 49.00 65.00 6-12 M 4.0 7.5Teco Electric & Machinery 1504 TT Nick Lai OW 16-Feb-11 17.65 20.45 24.00 6-12 M 15.9 15.1SPIL (Siliconware Precision Industries) 2325 TT Rick Hsu OW 15-Feb-11 40.45 37.30 46.00 6-12 M -7.8 -8.6TSMC 2330 TT Rick Hsu OW 19-Jan-11 78.00 75.10 88.00 6-12 M -3.7 1.4Novatek Microelectronics Corp. 3034 TT Cynthia Chou OW 3-Dec-10 98.50 87.90 120.00 6-12 M -10.8 -5.6Quanta Computer Inc. 2382 TT Alvin Kwock OW 13-Oct-10 48.15 60.20 62.00 6-12 M 25.0 30.2First Financial Holding Co Ltd 2892 TT Joseph Leung OW 3-Sep-10 18.85 24.90 33.00 6-12 M 32.1 37.2Powertech Technology Inc 6239 TT Cynthia Chou OW 2-Aug-10 101.50 102.00 130.00 6-12 M 0.5 5.6Unimicron Technology Corp. 3037 TT Christopher Ma OW 18-Apr-10 39.74 49.25 60.00 6-12 M 23.9 29.1Thailand Big C Supercenter Pcl BIGC TB Maria Lapiz OW 23-May-11 88.00 88.00 117.00 6-12 M 0.0 0.0Siam Makro MAKRO TB Maria Lapiz OW 9-May-11 172.50 192.00 193.00 6-12 M 11.3 12.0LPN Development LPN TB Anne Jirajariyavech OW 18-Jan-11 8.28 9.95 10.50 6-12 M 20.2 14.8Banpu Public BANPU TB Sukit Chawalitakul OW 15-Oct-10 713.26 718.00 923.00 6-12 M 0.7 -6.7PTT Public Company PTT TB Sukit Chawalitakul OW 23-Mar-10 248.77 352.00 437.00 6-12 M 41.5 8.9
Long Trades – Absolute1
Company Name BBG Ticker Analyst Name Rating2 Add DateAdd
VWAPCurrent
VWAPPrice
Target2 Trade Time
Horizon
Abs. Perf Since Add
Date (%)
Return Relative to
MSCI AsiaXJ (%)
China ZhengTong Auto Service Holding Limited 1728 HK Frank Li OW 4-Mar-11 7.48 8.64 8.80 < 3 M 15.68 3.27Powertech Technology Inc 6239 TT Cynthia Chou OW 4-Aug-10 100.96 101.48 130.00 < 6 M 10.62 15.66LG Electronics 066570 KS JJ Park OW 15-Sep-10 98365 102309 140000 < 3 M 9.76 11.93COSCO Pacific 1199 HK Karen Li, CFA OW 10-Mar-11 15.25 15.39 20.7 < 3 M 1.12 3.96Banpu Public BANPU TB Sukit Chawalitakul OW 25-Jan-11 750.71 718.52 888.0 < 6 M -2.40 1.66Asian Property Development AP TB Anne Jirajariyavech OW 4-Apr-11 5.23 4.92 7.5 < 6 M -6.45 -1.33
Short Trades – Relative1 or Absolute1
Country/ Company Name
BBG Ticker Analyst Name Rating2 Add Date
Add Price
Current Price
Price Target2
Trade Time Horizon
Abs. Perf Since Add
Date (%)
Return Relative to
Country Index (%)3
Australia Woodside Petroleum WPL AU Benjamin Wilson UW 7-Apr-11 46.95 45.23 45.15 6-12 M -3.7 0.1
Pair Trades – Absolute1
Company Name BBG Ticker Analyst Name Country
Long/ Short Rating2 Add Date
Add VWAP
Current VWAP
Price Target2
Trade Time Horizon
Abs. Perf Since Add
Date (%)
Return Relative to
MSCI AsiaXJ (%)
China Agri-Industries 606 HK Ying-Jian Chan China Long OW 26-Jan-11 8.12 8.57 10.60 < 3 M 8.18 0.85Wilmar International Limited WIL SP Ying-Jian Chan Singapore Short N 26-Jan-11 5.38 5.39 5.40 < 3 M -2.63 -0.84 Pair Trade 5.55 iShares MSCI Taiwan Index Fund EWT US Adrian Mowat Taiwan Long - 18-Feb-11 15.17 15.14 - < 6 M -0.23 3.74
iShares MSCI South Korea Index Fund EWY US Adrian Mowat South Korea Short - 18-Feb-11 60.38 62.32 - < 6 M -3.21 -3.61
Pair Trade -3.45 Techtronic Industries 669 HK Leon Chik, CFA China Long OW 16-Dec-10 10.24 9.70 14.00 < 6 M -5.19 4.62VTech Holdings 303 HK Leon Chik, CFA China Short N 16-Dec-10 87.22 90.88 77.00 < 6 M -4.20 -4.42 Pair Trade -9.39
1 - Relative indicates trades that are intended to generate returns relative to the relevant country index over the next 6-12 months. Absolute indicates trades that are intended to generate absolute returns in less than 6 months. 2 - Rating and price targets reflect J.P. Morgan's fundamental long-term views. 3 - Relative returns for relative trades are relative to MSCI country indices except for Shanghai listed A-Shares which are relative to the SHASHR. Source: Bloomberg, J.P. Morgan estimates. J.P. Morgan’s Asia Analyst Focus List (AFL) is a selection of instruments chosen by individual analysts/strategists as ‘Relative’ or ‘Absolute’ trades over a defined time horizon. The Relative trade list is a selection of stocks chosen by individual analysts that represent their top picks with the potential to provide an annualized total return in excess of +/-20% over the next 6-12 months - either Long or Short and relative to the relevant country index (which are MSCI country indices,

except for Shanghai listed A-shares which are relative to SHASHR). The Absolute trade list is a selection of stocks and/or indices, chosen by individual analysts and strategists, respectively, representing their trading ideas - either Long or Short, that are intended to generate absolute returns in the short term (< 6 months). The ideas may be expressed as single stocks or in pairs. A stock or index will be removed from this list if its absolute return (based on VWAP) falls below 10%. If a stock is placed under research restriction, J.P. Morgan may remove the stock from the AFL list pursuant to applicable law and/or J.P. Morgan policy without any further notice. Each trade is current only for the time horizon indicated. The short-term action expressed in the absolute trade list (Long or Short) may differ from J.P. Morgan's rating on the corresponding equities (Overweight, Neutral, or Underweight). For J.P. Morgan's long-term view on these names, including an analysis of valuation methodology and risk, please see the most recent company-specific research available at MorganMarkets http://www.morganmarkets.com or contact your J.P. Morgan representative. The Analyst Focus List is not intended to be viewed as model portfolios. Please refer to specific company research for the fundamental investment thesis for each stock included in this list as well as the analysts’ complete views. Important disclosures, including price charts for all companies under coverage for at least one year, are available through the search function on J.P. Morgan's website https://mm.jpmorgan.com/disclosures/company. Total returns exclude commissions. Past results are not indicative of future performance. Additional information available upon request. See the end pages of each individual note for analyst certification and important disclosures, including non-US analyst disclosures. J.P. Morgan does and seeks to do business with companies covered in its research reports. As a result, investors should be aware that the firm may have a conflict of interest that could affect the objectivity of this report. Investors should consider this report as only a single factor in making their investment decision.
Your feedback can help us to make the FTM better. Please take a moment to tell us what you think. Click here to send comments Click here for the Blackberry version Click here to unsubscribe

Asia Pacific Equity Research 24 May 2011
China Strategy
Maximizing returns in an inflation stabilization period; accumulate on weakness
China
Frank LiAC
(852) 2800-8511 [email protected]
Peng Chen (852) 2800-8507 [email protected]
Lan Deng
J.P. Morgan Securities (Asia Pacific) Limited
Relative index performance
Source: Bloomberg.
50
100
150
200
250
300
350
400
May-06 May-07 May-08 May-09 May-10 May-11
HSCEI Index SHCOMP IndexMSCI China
· MSCI China may continue to seesaw in the short term (1-3M): (1) our study of the previous tightening cycles shows that H-shares tend to seesaw or even decline during the inflation stabilization period i.e., the period from the peaking of CPI to the point of the negative real interest rate switching into positive territory. (2) The market may enter the inflation stabilization period in Jun-FY11. (3) Headwinds: (a) Tight monetary conditions. (b) Additional tightening measures. (c) The near-term economic slowdown, indicating earnings estimate reduction risk.
· We maintain a 3-6M positive view on MSCI-China and recommend investors take advantage of possible market volatility on growth fears to boost China exposure because: (1) H-shares tend to stage a big sustainable rally during the initial economic recovery period, i.e., the first year after the negative real interest rate switches into positive territory; (2) We expect the Chinese market to enter the initial economic recovery period in late 3Q11; and (3) tailwinds: (a) China is expected to engineer a soft landing; (b) the still-healthy economic growth in FY11, despite a possible slowdown in 2Q and 3Q; and (c) MSCI-China’s undemanding valuations.
· Key findings from previous cycles: (1) Consumer staples tends to outperform throughout the inflation stabilization period. (2) Consumer discretionary tends to underperform MSCI-China for four or five months before the peaking of CPI throughout the inflation stabilization period. (3) Materials tend to underperform MSCI-China for four months before the peaking of CPI throughout the inflation stabilization period. (4) Internet names tend to outperform MSCI-China until four months before a major pick-up in CPI. They tend to underperform MSCI-China for four months before the peaking of CPI until two months before the negative real interest rate switches into positive territory.
· Sector views: We maintain OW on: (1) consumer staples; (2) luxury consumption; (3) upstream energy, especially coal; (4) banks; (5) W-CDMA focused Unicom; (6) expressways, and (7) gas stocks. We maintain UW on: (1) consumer discretionary except for luxury consumption; (2) internet & IT; (3) downstream materials; (4) TD-SCDMA focused China Mobile; (5) solar; (6) railways; (7) cyclical industrials that are sensitive to the fixed asset investment growth, such as glass, heavy trucks, and power equipment. We upgrade insurance stocks from UW to OW, and downgrade cement and construction machinery from OW to neutral in our Model Portfolio.
Asia Pacific Equity Research 24 May 2011
Revisiting Country versus Sector in EM
Who Ya Gonna Call?
Asia/GEM Quantitative Strategy
Steve MalinAC
(852) 2800 8568 [email protected]
Robert Smith (852) 2800 8569 [email protected]
J.P. Morgan Securities (Asia Pacific) Limited
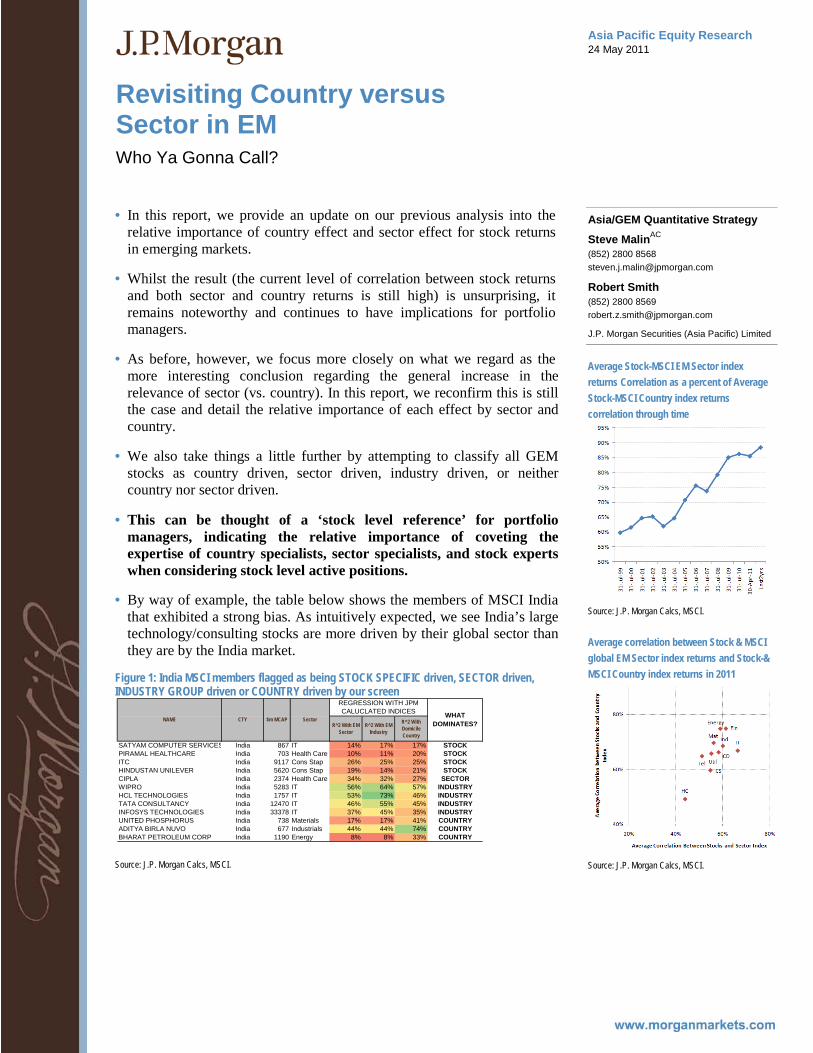
Average Stock-MSCI EM Sector index returns Correlation as a percent of Average Stock-MSCI Country index returns correlation through time
Source: J.P. Morgan Calcs, MSCI.
Average correlation between Stock & MSCI global EM Sector index returns and Stock-& MSCI Country index returns in 2011
Source: J.P. Morgan Calcs, MSCI.
· In this report, we provide an update on our previous analysis into the relative importance of country effect and sector effect for stock returns in emerging markets.
· Whilst the result (the current level of correlation between stock returns and both sector and country returns is still high) is unsurprising, it remains noteworthy and continues to have implications for portfolio managers.
· As before, however, we focus more closely on what we regard as the more interesting conclusion regarding the general increase in the relevance of sector (vs. country). In this report, we reconfirm this is still the case and detail the relative importance of each effect by sector and country.
· We also take things a little further by attempting to classify all GEM stocks as country driven, sector driven, industry driven, or neither country nor sector driven.
· This can be thought of a ‘stock level reference’ for portfolio managers, indicating the relative importance of coveting the expertise of country specialists, sector specialists, and stock experts when considering stock level active positions.
· By way of example, the table below shows the members of MSCI India that exhibited a strong bias. As intuitively expected, we see India’s large technology/consulting stocks are more driven by their global sector than they are by the India market.
Figure 1: India MSCI members flagged as being STOCK SPECIFIC driven, SECTOR driven, INDUSTRY GROUP driven or COUNTRY driven by our screen
Source: J.P. Morgan Calcs, MSCI.
R^2 With EM Sector
R^2 With EM Industry
R^2 With Domicile Country
SATYAM COMPUTER SERVICES India 867 IT 14% 17% 17% STOCKPIRAMAL HEALTHCARE India 703 Health Care 10% 11% 20% STOCKITC India 9117 Cons Stap 26% 25% 25% STOCKHINDUSTAN UNILEVER India 5620 Cons Stap 19% 14% 21% STOCKCIPLA India 2374 Health Care 34% 32% 27% SECTORWIPRO India 5283 IT 56% 64% 57% INDUSTRYHCL TECHNOLOGIES India 1757 IT 53% 73% 46% INDUSTRYTATA CONSULTANCY India 12470 IT 46% 55% 45% INDUSTRYINFOSYS TECHNOLOGIES India 33378 IT 37% 45% 35% INDUSTRYUNITED PHOSPHORUS India 738 Materials 17% 17% 41% COUNTRYADITYA BIRLA NUVO India 677 Industrials 44% 44% 74% COUNTRYBHARAT PETROLEUM CORP India 1190 Energy 8% 8% 33% COUNTRY
WHAT DOMINATES?
REGRESSION WITH JPM CALUCLATED INDICES
NAME CTY $m MCAP Sector

Asia Pacific Equity Research 24 May 2011
Axis Bank Ltd ▲ Overweight
Previous: Neutral
AXBK.BO, AXSB IN
Valuations now reasonable, upgrade to OW
Price: Rs1,188.00
Price Target: Rs1,525.00
India Banks
Seshadri K Sen, CFAAC
(91-22) 6157-3575 [email protected]
J.P. Morgan India Private Limited
Adarsh Parasrampuria (91-22) 6157-3576 [email protected]
J.P. Morgan India Private Limited
Sunil Garg (852) 2800-8518 [email protected]
J.P. Morgan Securities (Asia Pacific) Limited
YTD 1m 3m 12m Abs -12.0% -13.7% -5.3% -0.9% Rel 0.2% -5.4% -4.4% -9.9%
1,100
1,300
1,500
Rs
May-10 Aug-10 Nov-10 Feb-11 May-11
Pr ice Per fo rman ce
AXBK.BO share price (Rs)NIFTY (rebased)
Axis Bank Ltd (Reuters: AXBK.BO, Bloomberg: AXSB IN) Year-end Mar (Rs in mn) FY09A FY10A FY11A FY12E FY13E Operating Profit 34,355 44,992 60,563 70,893 87,509 Net Profit 18,129 24,789 33,882 38,873 47,397 Cash EPS (Rs) 50.50 61.18 82.54 91.58 111.66 Fully Diluted EPS (Rs) 45.29 49.81 76.76 86.14 104.67 DPS (Rs) 10.00 13.00 14.00 16.06 17.06 EPS growth (%) 68.7% 21.2% 34.9% 11.0% 21.9% ROE 19.1% 18.9% 19.3% 18.9% 19.7% P/E 23.5 19.4 14.4 13.0 10.6 BVPS (Rs) 284.00 395.99 462.82 520.72 612.42 P/BV 4.2 3.0 2.6 2.3 1.9 Div. Yield 0.8% 1.1% 1.2% 1.4% 1.4%
52-wk range (Rs) 1,608.50 - 1,146.60 Market cap (Rs mn) 488,160 Market cap ($ mn) 10,844 Shares outstanding (mn) 411 Fiscal Year End Mar Price (Rs) 1,188.00 Date Of Price 23 May 11 Avg daily value (Rs mn) 744.5 Avg daily value ($ mn) 16.5 Avg daily vol (mn) 1.1 NIFTY 5,387 Exchange Rate 45.02
Source: Company data, Bloomberg, J.P. Morgan estimates.
· We upgrade Axis Bank to OW from N on the back of recent underperformance and our increased conviction that the balance sheet quality (liabilities) will improve. Valuations are now below historical averages and, while the power sector exposure remains a worry, we think the key concerns are priced in.
· Deposit stresses easing: The surge in wholesale deposits in 4Q11 could ease in FY12 from lower loan growth and an improved CASA position. The tempering of loan growth is likely to be driven by a Rs 30bn run-off in short term loans and less aggression in the corporate vertical. CASA improvement is expected mainly from growth in savings balances, driven by the back-ended branch additions in FY12. We maintain FY12 NIM forecasts at 3.0%, down ~20bp yoy (flat vs 4Q11).
· Asset quality-power the only risk: Asset quality was robust in FY11, with incremental gross delinquency falling to 1.4% (down 80bps yoy) and credit costs falling to 90bps from 150bps in FY10. Risks remain in the IPP space though we think the PSUs are the more vulnerable. We do not see negative readthrough from SBI's numbers -Axis has consistently shown better underwriting skills than PSUs despite similar loan books.
· Annual report takeaways: There were no major alarms in the FY11 annual report. Key discussion points were a) the surge in off-balance sheet credits, b) strong growth in power exposure and c) a slight worsening in deposit concentration. Despite RWA growth of 39%, the next capital issuance is not expected before 2012 (not in our numbers yet). Detailed A/R analysis on pg 7/8.
· Upgrade to OW: Axis’s recent weakness (down 18% in 1m) has taken valuations to below historical mean. Management is addressing key concerns and we upgrade to OW, our Mar-12 PT staying unchanged at Rs1525. The key risk is that our FY12 EPS is 6% below consensus, mainly from loan growth. That may, however, be offset by improved earnings quality. Deregulation of savings rates is the other major risk.

Asia Pacific Equity Research 23 May 2011
Tata Steel Ltd
Overweight TISC.BO, TATA IN
Investment Case Remains Strong; Would Be Buyers in Current Weakness ▼
Price: Rs579.55
Price Target: Rs785.00 Previous: Rs820.00
India India Steel
Pinakin Parekh, CFAAC
(91-22) 6157-3588 [email protected]
Neha Manpuria (91-22) 6157-3589 [email protected]
J.P. Morgan India Private Limited
YTD 1m 3m 12m Abs -17.7% -7.2% -9.1% 14.1% Rel -6.8% -1.3% -8.5% 3.2%
450
600
750
Rs
May-10 Aug-10 Nov-10 Feb-11 May-11
Pr ice Per fo rman ce
TISC.BO share price (Rs)BSE30 (rebased)
Tata Steel Ltd (Reuters: TISC.BO, Bloomberg: TATA IN) Rs in mn, year-end Mar FY10A FY11E FY12E FY13E Net Sales (Rs bn) 1,024 1,059 1,154 1,240 Net Profit (Rs bn) -4.4 60.4 69.7 102.0 EPS (Rs) (4.61) 58.53 67.59 98.86 Net profit growth (%) -
104.9% -
1480.8% 15.5% 46.3% ROE -1.5% 18.4% 16.9% 21.0% P/E (x) -125.8 9.9 8.6 5.9 P/BV (x) 2.7 1.9 1.6 1.3 EV/EBITDA (x) 13.1 7.1 6.8 5.5
52-week Range (Rs) 737.00 - 448.65 Market cap (Rs mn) 555,913 Market cap ($ mn) 12,349 Price (Rs) 579.55 Date Of Price 20 May 11 3-mth trading volume (mn) 7.3 3-mth trading value ($ mn) 33.6 Shares O/S (mn) 959 BSE30 18,326
Source: Company data, Bloomberg, J.P. Morgan estimates. Note: EV/EBITDA not adjusted for CWIP
· Recent announcement in the UK highlights continued focus to lift profitability: TATA announced re-structuring of its long product business in the UK. As part of the process, at Scunthorpe (we estimate current steel making capacity at 4MT and utilization levels significantly below TATA’s European utilization levels of ~80%), it would mothball the Queen Bess BF and close the Bloom and Billet Mill as well as review the operations of the billet caster (which could reduce headcount by 1500 and cut capacity by 1MT). At the same time TATA announced plans to further invest £400mn over the next 5 years to move up the value chain. TATA attributed the move to structural steel demand in the UK being 2/3rds of 2007 level and likely not to recover within the next few years. The latest re-structuring would bring the European operating capacity to 17MT from peak of 22MT.
· Investment case remains strong, India operations set to see step up in earnings in ~3 quarters: We believe TATA’s European flat products are decently profitable, specially the Ijmuiden operations (which in our estimate account for the bulk of profitability in Europe). The UK has been hit by lower demand, historical under investment and inefficient layout. We believe UK flat products while not as profitable as Ijmuiden are not loss making as the longs are, and to that extent we are not surprised by TATA’s plans to further rationalize capacity/footprint in the UK longs segment. However given the mothballing/sell down of capacity, we would not be surprised at some point to see at least some amount of the GOODWILL on the balance sheet being written off (FY10 at Rs145bn). We continue to believe that TATA’s investment case remains strong given the ~3MT India expansion by Dec-11, which even in the current state of over supplied domestic markets should still have EBITDA/MT of $305/MT.
· Is the Capex surge a concern? No as long as iron ore remains above $150/MT: We remain confident of Europe EBITDA/MT improving to $75/MT in FY13E and more importantly the cash-cow India operations, to generate $305/MT over the next 2 years, giving healthy operating cash flows.
· Remain OW, Risk remains collapse in iron ore prices: We remain OW with a revised PT of Rs785 (as we build in higher net debt from higher working capital) and believe the current weakness is more macro driven.

Asia Pacific Equity Research 23 May 2011
Malaysia Strategy
Updates from Invest Malaysia New York
Malaysia
Hoy Kit MakAC
(60-3) 2270-4728 [email protected]
JPMorgan Securities (Malaysia) Sdn. Bhd. (18146-X)
Sriyan Pietersz (662) 684 2670 [email protected]
JPMorgan Securities (Thailand) Limited
Adrian Mowat (852) 2800-8599 [email protected]
J.P. Morgan Securities (Asia Pacific) Limited
Figure 2: FBMKLCI
Source: Bloomberg
1200
1300
1400
1500
1600
May-10 Sep-10 Jan-11 May-11
· We co-hosted Invest Malaysia New York 2011 with two other local brokers (CIMB and Maybank) and Bursa Malaysia on May 17-18. To recap, Invest Malaysia New York 2011 is a high level roadshow to connect top level government policy makers (including Prime Minister Dato’ Sri Najib), senior regulators and leading large cap corporates from Malaysia with equities investors in the US. The theme for Invest Malaysia 2011 is to provide investors with an update of the changes and progress under the M$1.4T Economic Transformation Programme (ETP). Good turnout, with 87 investors attending, via 1-on-1s, smaller group and large group meetings; and a lunch event attended by over 250 people from main street and Wall Street.
· PM Najib’s 10 reasons to invest in Malaysia. PM Najib gave 10 reasons why US investors should be investing in Malaysia:- 1) economic strength and diversity, 2) enterprising spirit, 3) capitalise on rich heritage, 4) liberalised key services, 5) making government serve businesses, 6) ETP underway, 7) record foreign investments in 2010, 8) increased foreign investment in capital markets, 9) gateway to ASEAN, and 10) US has been Malaysia’s largest investor over the past 30 years. We also could sense his commitment to the ETP, and that the various policy makers and senior regulators present (Securities Commission, MIDA, Khazanah, Bank Negara), and the 10 companies attending the event were all on the same page. One important message by PM Najib was that Malaysia is a gateway to ASEAN’s 600MM population, and US$2T GDP.
· Less skepticism from investors, but largely underweight. Speaking with US investors, we gather that many were still underweight Malaysia, but agree that Malaysia is a defensive market and has little downside risk. Most were encouraged by PM Najib's concrete plan to kick-start the private investment cycle, and many seem less skeptical on execution compared to the past.
· Among the 10 companies presenting in Invest Malaysia New York, we have OW ratings on Bursa Malaysia, CIMB, Genting, Petronas Chemicals, Axiata and Sime Darby. We are Neutral on Maybank, while we do not have ratings on SapuraCrest Petroleum, Kencana and AirAsia.
· Stay leveraged to ETP theme. As PM Najib candidly said, the ETP's success indeed does have a bearing on the next General Elections, so all the more he should strive towards success. We recommend investors stay leveraged to the ETP theme through the construction, oil & gas, banks and properties sector. Our top picks in those sectors are IJM Corporation (OW), RHB Capital (OW), IJM Land (OW), Dialog (OW) and Petronas Chemicals (OW).

Asia Pacific Equity Research 23 May 2011
Banpu Public
Overweight BANP.BK, BANPU TB
Clearer Down Under ▲
Price: Bt718.00
Price Target: Bt923.00 Previous: Bt888.00
Thailand Mining
Sukit ChawalitakulAC
(66-2) 684-2679 [email protected]
JPMorgan Securities (Thailand) Limited
YTD 1m 3m 12m Abs -14.3% -6.2% -6.0% 22.8% Rel -17.2% -3.1% -13.8% -21.4%
550
700
850
Bt
May-10 Aug-10 Nov-10 Feb-11 May-11
Pr ice Per fo rman ce
BANP.BK share price (Bt)SET (rebased)
Banpu Public (Reuters: BANP.BK, Bloomberg: BANPU TB) Bt in mn, year-end Dec FY10A FY11E FY12E FY13E Revenue 60,285 97,245 118,618 123,038 Net Profit 24,728.0 19,577.4 21,127.2 24,123.7 EPS (Bt) 91.00 72.04 77.75 88.77 DPS (Bt) 21.00 18.00 20.00 22.00 Revenue growth (%) 12.8% 57.1% 21.1% 3.8% EPS growth (%) 73.8% -20.8% 7.9% 14.2% ROCE 13.0% 16.9% 26.0% 28.2% ROE 45.2% 28.9% 25.6% 24.2% P/E (x) 7.9 10.0 9.3 8.1 P/BV (x) 3.2 2.6 2.2 1.8 EV/EBITDA (x) 15.2 8.0 5.1 4.2 Dividend Yield 2.9% 2.5% 2.8% 3.0% Adjusted EPS (Bt) 35.54 49.49 77.75 88.77 Adjusted P/E 20.20 14.51 9.24 8.09
Company Data Shares O/S (mn) 272 Market cap (Bt mn) 195,115 Market cap ($ mn) 6,442 Price (Bt) 718.00 Date Of Price 23 May 11 Free float (%) 50.0% 3mth Avg daily volume 2,102,366.00 3M - Average daily Value (Bt mn) 1,604.76 Average 3m Daily Turnover ($ mn) 52.98 SET 1,073 Exchange Rate 30.29 Fiscal Year End Dec
Source: Company data, Bloomberg, J.P. Morgan estimates.
· Australian coal output to hit 19.6MM tons by FY15E: BANPU’s newest Australian mine Airly should produce around 0.7MM tons this year, rising steadily to 1.9MM tons by FY15E. More importantly, the company plans to commission Newstan-Lochiel by FY14E and expects output to reach 3.7MM tons by FY15E. Management believes that these two new mines should help ensure output growth, even with prospective decline from older, existing mines.
· Longer term target: BANPU is conducting pre-feasibility/feasibility studies on three other mines (Inglenook, NE Angus and Neubecks), with target 6.0MM tons/year production (combined). If developed, these should underwrite the company’s LT growth, in our view.
· CAPEX well covered: BANPU indicates CAPEX of A$589MM for Australia over FY11E-FY15E—mainly earmarked for Newstan-Lochiel and NE Angus. While substantial, we believe the company is well-positioned to accommodate this CAPEX. We note that BANPU recently raised US$669MM from its divestment of the Daning mine in China.
· EPS and PT: We cut our core EPS estimates for FY11E by 6%. This is driven partly by upward adjustments to key cost items (operating and SG&A). However, it also reflects Bt480MM in one-time expenses booked during 1Q11 by BLCP (coal supply disruption) and Daning (non operations during the period). Our FY12E-FY13E core EPS estimates are kept relatively unchanged. We however raised our Dec-11 PT to Bt923/share. This is driven mainly by higher est. values of the Australian operations, underpinned by higher production outlook. Our PT is based on SOTP valuation that comprises estimated DCF values from BANPU’s key business divisions (please see p.2 pie chart breakdown). Key risks: (1) a sustained decline in coal prices, (2) a significant production disruption that reduces cash flows from a project and (3) regulatory risks such as resources taxes.

Asia Pacific Equity Research 23 May 2011
Franshion Properties (China) Ltd.
Overweight 0817.HK, 817 HK
Gathering the momentum, building the brand; re-iterate OW
Price: HK$2.34
Price Target: HK$2.90
China Property
Lucia Kwong, CFAAC
(852) 2800-8526 [email protected]
J.P. Morgan Securities (Asia Pacific) Limited
YTD 1m 3m 12m Abs 0.0% -4.1% 9.3% 6.4% Rel -0.5% 1.7% 3.5% -7.4%
2.0
2.3
2.6
HK$
May-10 Aug-10 Nov-10 Feb-11 May-11
Pr ice Per fo rman ce
0817.HK share price (HK$)R-CHIP (rebased)
Franshion Properties (China) Ltd. (Reuters: 0817.HK, Bloomberg: 817 HK) HK$ in mn, year-end Dec FY09A FY10A FY11E FY12E FY13E Revenue 6,456 6,432 9,700 15,163 20,503 Net Profit 1,048 1,069 1,204 2,340 3,729 Core Profit 937 972 1,204 2,340 3,729 EPS (HK$) 0.12 0.12 0.13 0.26 0.41 Core EPS (HK$) 0.11 0.11 0.13 0.26 0.41 Core EPS growth (%) -12.6% -3.0% 23.8% 94.3% 59.4% DPS (HK$) 0.03 0.02 0.03 0.06 0.10 ROE 6.8% 4.9% 5.1% 9.3% 13.6% P/E (Core) 21.4 22.0 17.8 9.2 5.7 P/BV (x) 1.2 0.9 0.9 0.8 0.7 BVPS (HK$) 1.92 2.52 2.67 2.85 3.14 RNAV/Share (HK$) 4.52 4.75 4.90 Dividend Yield 1.1% 1.1% 1.1% 2.5% 4.1% Adjusted EPS (HK$) 0.11 0.10 0.08 0.19 0.32
Company Data Shares O/S (mn) 9,161 Market cap (HK$ mn) 21,438 Market cap ($ mn) 2,758 Price (HK$) 2.34 Date Of Price 23 May 11 Free float (%) 37.1% 3M - Average daily volume (mn) 6.61 3M - Average daily Value (HK$ mn) 14.81 Average 3m Daily Turnover ($ mn) 1.90 R-CHIP 4,191 Exchange Rate (HK$/US$) 7.77 Fiscal Year End Dec
Source: Company data, Bloomberg, J.P. Morgan estimates.
· Residential launch proves execution: We maintain our positive view on Franshion Properties (Franshion) following Franshion’s successful launch of Jinmao Palace in Beijing CBD. Franshion is focused on office/hotel developments but has branched out to luxury-end residential developments. We believe Franshion can leverage its experience in hotel development and build the Jinmao brand to penetrate into the high-end residential segment.
· Strong growth momentum for all property segments: Franshion will launch Shanghai Jinmao Noble Manor (Chongming Island project) in June. Separately, it may make use of the strong office investment market and dispose of the remaining office properties at Cruise Terminal at an effective 3% market yield. Its recurring income stream (hotel and office leasing) is on a steady growth track. Its FY11E cashflow thus looks solid to us. Moreover, the presales could bring strong earnings growth starting from FY12. Franshion’s NAV discount is the widest among the state-owned developers due to its previous slow asset turnover and lack of proven track record in residential segment and land development. Upcoming project sales could thus be a key positive catalyst.
· A defensive play in the sector given cheap access to capital: Franshion is less exposed to policy risks and has low beta. Moreover, its cost of debt is lower than most private developers which is a definite advantage especially as the company is leveraged up to expand its project pipeline.
· PT at HK$2.9: We roll over our PT to Jun-12 and maintain it at HK$2.9, based on 40% discount to NAV. This is wider than the other mid-cap developers mainly due to the smaller development pipeline. Our PT also represents 1.1x 2011E book, which is in line with the long-term mean forward P/BV. Given the 24% potential share price upside, we maintain our OW rating. Risks are slippage of project launches.

Asia Pacific Equity Research 23 May 2011
Hite Brewery
Overweight 103150.KS, 103150 KS
Pre-merger concerns causing unsettledness ▼
Price: W114,000
Price Target: W120,000 Previous: W130,000
South Korea Beverages
Jinah LeeAC
(82-2) 758-5723 [email protected]
J.P. Morgan Securities (Far East) Ltd, Seoul Branch
YTD 1m 3m 12m Abs -5.4% 2.7% 9.6% -22.2% Rel -8.3% 5.4% 4.3% -54.2%
80,000
140,000
200,000
W
May-10 Aug-10 Nov-10 Feb-11 May-11
Pr ice Per fo rman ce
103150.KS share price (W )KOSPI (rebased)
Hite Brewery (Reuters: 103150.KS, Bloomberg: 103150 KS) Year-end Dec FY10A FY11E FY12E FY13E Revenue (W bn) 1,022 1,115 1,181 1,127 Operating Profit (W bn) 139 179 212 187 Operating Margin 13.6% 16.0% 17.9% 16.5% Net Profit (W bn) 67 94 123 130 EPS (W) 7,057 9,822 12,879 13,572 BVPS (W) 77,846 86,759 87,198 87,199 Revenue growth 0.5% 9.1% 5.9% -4.5% Operating growth -23.8% 28.5% 18.5% -11.9% EPS growth -32.0% 39.2% 31.1% 5.4% ROE 7.8% 11.1% 14.3% 13.6% P/E (x) 16.2 11.6 8.9 8.4 P/BV (x) 1.5 1.3 1.3 1.3
Company Data 52-week Range (W) 165,000 - 97,600 Market cap (W bn) 1,090 Market cap ($ mn) 1,007 Shares O/S (mn) 10 Fiscal Year End Dec Price (W) 114,000 Date Of Price 20 May 11 Free float (%) 51.2% 3M Avg daily value (W bn) 2.27 3M Avg daily value ($ mn) 2.10 3M Avg daily vol 22,936.00 KOSPI 2111.50 Exchange Rate 1,082.80
Source: Company data, Bloomberg, J.P. Morgan estimates.
Bloomberg JPMA JLEE <GO>
· Hite Brewery reported 1Q numbers that were significantly below our estimates due to weaker market share and higher advertising and promotion costs. Operating profit and net profit fell 8% and 14% respectively. Net profit came in at Won 7 bn, significantly below our Won 16 bn estimate and consensus’ W 14 bn. We are cutting our EPS by 8% and 6% for 2011 and 2012, respectively.
· Weakness in Seoul metropolitan area caused share to fall another 2% in the domestic market: Hite's sale volumes were up only 1% against our 3% volume growth assumption which was based on the Hite brand stopping its decline. While Max and new brands rose 29% it was not enough to offset Hite's decline, as Hite accounts for 75% of sales. We believe one of the key issues at hand is pre-merger disruption among the salesforce, as salesforce restructuring is anticipated as a result of the merger between Hite Brewery and Jinro.
· Company’s push on advertising and promotion caused double whammy effect: Market share continues to weaken and management is trying to make it up by spending more on advertising. Marketing and advertising costs increased 9%, causing operating profit to decline 8% Y/Y, resulting in the operating profit margin falling 110 b.p. to 11.1%.
· Waiting for the dust to settle: Even with lower earnings Hite Brewery is trading more than 30% below its five-year historical average PE of 18 times. We expect unsettlement could be prolonged into July this year until the merger decision is finalized in 3Q. We expect positive newsflow to occur in the second half spearheaded by a mid single-digit price hike as guided by management.
· Based on our lower earnings we cut our December 2011 target price to Won 120,000 to reflect lower earnings but same P/E multiple of 12x.

Asia Pacific Equity Research 23 May 2011
Kangwon Land ▼ Neutral
Previous: Overweight
035250.KS, 035250 KS
Visitor drop likely to continue ▼
Price: W27,350
Price Target: W25,000 Previous: W28,000
South Korea Gaming
Jinah LeeAC
(82-2) 758-5723 [email protected]
J.P. Morgan Securities (Far East) Ltd, Seoul Branch
YTD 1m 3m 12m Abs -2.1% 12.3% 9.4% 61.8% Rel -5.0% 15.0% 4.1% 29.8%
16,000
22,000
28,000W
May-10 Aug-10 Nov-10 Feb-11 May-11
Pr ice Per fo rman ce
035250.KS share price (W )KOSPI (rebased)
Kangwon Land (Reuters: 035250.KS, Bloomberg: 035250 KS) Year-end Dec FY10A FY11E FY12E FY13E Revenue (W bn) 1,314 1,280 1,468 1,713 Operating Profit (W bn) 571 556 564 679 Operating Margin 43.5% 43.4% 38.4% 39.6% Net Profit (W bn) 422 408 417 515 EPS (W) 1,971 1,906 1,948 2,405 BVPS (W) 9,821 10,809 11,836 13,303 Revenue growth 8.9% -2.5% 14.7% 16.7% Operating growth 22.8% -2.7% 1.5% 20.2% EPS growth 8.1% -3.3% 2.2% 23.5% ROE 21.1% 18.5% 17.2% 19.1% P/E (x) 13.9 14.3 14.0 11.4 P/BV (x) 2.8 2.5 2.3 2.1
Company Data 52-week Range (W) 31,400 - 16,000 Market cap (W bn) 5,851 Market cap ($ mn) 5,404 Shares O/S (mn) 214 Fiscal Year End Dec Price (W) 27,350 Date Of Price 20 May 11 Free float (%) 47.6% 3M Avg daily value (W bn) 11.99 3M Avg daily value ($ mn) 11.07 3M Avg daily vol 480,770.00 KOSPI 2111.50 Exchange Rate 1,082.80
Source: Company data, Bloomberg, J.P. Morgan estimates.
Bloomberg JPMA JLEE <GO>
· We are downgrading Kangwon Land to Neutral with a new target price of W25,000 based on 13 times 2011 earnings. Although we expect table expansion starting in 2Q12 to be a catalyst in one year’s time, we expect lower than expected visitors and significant drop in high rollers to put pressure on 2011 earnings over the next four quarters causing the stock to underperform. We cut our 2011 and 2012 EPS by 8% and 13%, respectively.
· First quarter NP disappointing, falling 10% due to 4.4% decline in visitors: Kangwon Land’s first quarter was disappointing with operating profit and net profit falling 8% and 11%, respectively. Net profit came in 10% below our estimate largely due to a 4.4% drop in the number of visitors to Kangwon Land.
· Visitor decline: in absence of table expansion we found meaningful correlation between the number of outbound tourists to visitors to Kangwon Land. Given the strong rebound in wage and employment coupled with stronger currency, we expect travelers to overseas casinos to continue for the remainder of the year.
· Loss of high rollers; decline in visitors was most noticeable for VIP customers. Revenue from VIP tables fell over 24% and accounted for only 15% from close to 40% few years ago. Due to falling VIP customers, drop size per visitor fell from W1.7 mn to below W1.5 mn over the last one year.
· Hold ratio levels off: Increase in hold ratio for slot machines from 16~17% to 19~20% drove the overall hold ratio to rise close to 3% in 2010; this was due to increased betting sizes of the machines. Increase in hold ratio expected in 2011 would not be able to offset the decline in visitors nor drop sizes.
· Our December 2011 target price is based on 13 times 2011 earnings. The key risk to our target price is weaker than expected Korean won on the upside and higher than expected drop in visitors on the downside.

Asia Pacific Equity Research 23 May 2011
Sino Biopharmaceutical
Overweight 1177.HK, 1177 HK
Lowering target price to HK$3.6 - Stronger sales growth but higher selling costs in 1Q ▼
Price: HK$2.80
Price Target: HK$3.60 Previous: HK$4.00
China Pharmaceuticals
Leon Chik, CFAAC
(852) 2800-8590 [email protected]
J.P. Morgan Securities (Asia Pacific) Limited
YTD 1m 3m 12m Abs -4.1% -1.1% 8.1% -17.4% Rel -4.6% 2.9% 6.5% -34.6%
2.0
3.0
4.0
HK$
May-10 Aug-10 Nov-10 Feb-11 May-11
Pr ice Per fo rman ce
1177.HK share price (HK$)HSCEI (rebased)
Sino Biopharmaceutical (Reuters: 1177.HK, Bloomberg: 1177 HK) HK$ in mn, year-end Dec FY09A FY10A FY11E FY12E FY13E Revenue 3,244 4,086 5,507 6,816 8,154 Net Profit 397.0 566.9 563.1 663.6 767.2 EPS (HK$) 0.09 0.12 0.11 0.13 0.15 DPS (HK$) 0.05 0.08 0.08 0.09 0.11 Revenue growth (%) 42.2% 26.0% 34.8% 23.8% 19.6% EPS growth (%) 33.3% 33.2% -2.7% 17.8% 15.6% ROCE 33.3% 34.9% 29.6% 33.1% 36.5% ROE 16.9% 18.5% 15.1% 16.9% 18.5% P/E (x) 31.9 24.0 24.6 20.9 18.1 P/BV (x) 5.1 3.8 3.6 3.4 3.2 EV/EBITDA (x) 12.2 8.5 8.2 7.2 6.3 Dividend Yield 1.7% 2.9% 2.8% 3.3% 3.8%
Company Data Shares O/S (mn) 4,957 Market cap (HK$ mn) 13,879 Market cap ($ mn) 1,785 Price (HK$) 2.80 Date Of Price 20 May 11 Free float (%) 45.2% 3mth Avg daily volume 7,876,638.00 3M - Average daily Value (HK$ mn) 22.00 Average 3m Daily Turnover ($ mn) 2.83 HSCEI 12,948 Exchange Rate 7.77 Fiscal Year End Dec
Source: Company data, Bloomberg, J.P. Morgan estimates.
· Net profit growth of 36% for 1Q11 beat expectations by 9%. Sino-Biopharmaceutical (SB) is one of the most research-driven Chinese pharmaceutical companies listed in Hong Kong. The company is transforming from a maker of generic hepatitis drugs to being a developer of patented and branded generic drugs in a number of key areas (hepatitis, cardio-cerebral, oncology and analgesics). We are lowering our earnings estimates for 2011 and 2012 and lower our target price by 10% to HK$3.60 – maintain Overweight
· New drugs driving growth. The new blockbuster hepatitis drug Runzhong (Entacavir) was launched in Mar-10 that is on track to generate HK$350-400MM annual sales for SB by 2012, nearly double what we expected when we initiated coverage in Sept10. As the government scrutinizes the prices of drugs in 2011, new products are the key to maintaining sales growth and sustaining high margins. SB plans to launch four new drugs each year and has over 60 new products in the pipeline at various stages of clinical trials.
· Lifting sales but lowering net profit estimates. We are adjusting our FY11E and FY12E sales up by 4.9% and 9.3%, respectively, to reflect the stronger than expected sales in 1Q11. However, we are lowering our NP estimates for 2011 and 2012 by 3.9% and 3.4% respectively to reflect the higher selling expenses required to promote new drugs. We are lowering our Dec-11 price target to HK$3.60 (previously HK$4.0) to reflect the longer term impact of higher selling costs and lower EBIT margins.
· SB trades at a 24.6x FY11E P/E, 20% higher than the average peer healthcare companies’ forward P/E of 20.4x. Our DCF-based price target (Dec-11 – WACC 10.2% and terminal growth of 6%) of HK$3.60 implies a CY12E P/E of 27x. The key risks to our PT and investment thesis include regulatory measures on pricing of pharmaceutical products and the timing of the approval of the new drugs.

Asia Pacific Equity Research 23 May 2011
Asia Pacific Strategy Dashboards
See page 20 for analyst certification and important disclosures, including non-US analyst disclosures. J.P. Morgan does and seeks to do business with companies covered in its research reports. As a result, investors should be aware that the firm may have a conflict of interest that could affect the objectivity of this report. Investors should consider this report as only a single factor in making their investment decision.
Asia Pacific Strategy Team Country Recommendation Adrian MowatAC Asian and Emerging Markets Equity Strategist [email protected] (852) 2800 - 8599 J.P. Morgan Securities (Asia Pacific ) Limited Overweight Steve Malin Quantitative Strategist [email protected] (852) 2800 - 8568 J.P. Morgan Securities (Asia Pacific ) Limited India and ASEAN David Fernandez Economic and Policy Research [email protected] (65) 6882 - 2461 JPMorgan Chase Bank, N.A., Singapore Branch Yen Ping Ho Asian Currency Strategist [email protected] (65) 6882 - 2216 JPMorgan Chase Bank, N.A., Singapore Branch Underweight Rajiv Batra Asian and Emerging Markets Equity Strategy [email protected] (91-22) 6157-3568 J.P. Morgan India Private Limited Korea and Australia
Key Changes Market performance to 20 May 2011 • Week: MSCI Asia Pacific ex Japan -0.3% outperformed MSCI World by 0.2% • Top three markets during the week: Indonesia 1.6%, Australia 0.3% and Philippines 0.2% • Bottom three markets during the week: Taiwan -1.8%, Thailand -1.6% and India -1.1% • YTD Performance: MSCI Asia Pacific ex Japan 2% underperformed MSCI World by 1.7% • YTD Top three markets in US$: Indonesia, Korea and Australia • YTD Bottom three markets in US$: India, Philippines and Hong Kong
Sector performance • Week: MSCI APxJ Consumer Staples 1.5% outperformed MSCI APxJ by 1.8% • Week: MSCI APxJ Information Technology -2.8% underperformed MSCI APxJ by 2.5% • Top three key sectors during the week in US$: Korea Consumer Staples 3.7%, Korea Consumer Discretionary 2.7% and Australia Consumer Staples 2.3% • Bottom three key sectors during the week in US$: India Energy -4.4%, Korea Information Technology -3.9% and Taiwan Information Technology -2.6% • YTD Top three key sectors in US$: Korea Consumer Discretionary 28.7%, Korea Materials 17% and Taiwan Materials 12.4% • YTD Bottom three key sectors in US$: India Financials -11.8%, India Information Technology -11.8% and India Energy -10.5%
Demand classification sector performance • YTD: Global Price Takers 4%, Domestic Demand 4%, Global Consumer 1.5% and Global Capex -2.6%
Headline inflation data published in the previous week • Malaysia April CPI 3.2% [J.P. Morgan and Consensus 3.1%] J.P. Morgan's revisions to 2011 Real GDP growth forecasts • Positive: Taiwan 5.9% [5.6%] • Negative: China 9.4% [9.5%]
J.P. Morgan's revisions to 2012 Real GDP growth forecasts • Positive: Asia ex Japan 7.6% [7.5%], China 9.1% [9.0%]
Table of Contents Page # Regional Summary 2
Market Performance 3
Liquidity Monitor 4
Monitoring Inflation 5
Market Drivers 6
Earnings Revisions 7,8
Cross-section Earnings Growth 9
Market Implied Growth Rates 10
Sector-Country PE Matrix 11
Valuation Distribution 12
Demand Classification 13
Currency Forecasts 14
Economic Momentum 15
Interest Rate Trend 16
Asia in Perspective 17
Asian Balance Sheets 18
Index Weightings 19
Please see Cyclical or Structural?: Perspectives and Portfolios - Lite,
Mowat et al, 13 May 2011, for our latest Asian equity strategy

Global Equity Research 23 May 2011
Global Developed Markets Strategy Dashboards
See page 24 for analyst certification and important disclosures, including non-US analyst disclosures. J.P. Morgan does and seeks to do business with companies covered in its research reports. As a result, investors should be aware that the firm may have a conflict of interest that could affect the objectivity of this report. Investors should consider this report as only a single factor in making their investment decision.
J.P. Morgan Equity Strategy Key Calls (see page 4 for details) Adrian MowatAC Global Emerging Markets and Asian Strategy [email protected] (852) 2800 - 8599 J.P.Morgan Securities (Asia Pacific ) Limited Regional Calls Thomas Lee US Equity Strategy [email protected] (1-212) 622 - 6505 J.P. Morgan Securities LLC OW Core EMU vs Periphery Mislav Matejka European Equity Strategy [email protected] (44-20) 7325 - 5242 J.P. Morgan Securities Ltd. Sector Calls Hajime Kitano Japan Equity Strategy [email protected] (81-3) 6736 - 8655 J.P. Morgan Securities Japan Co., Ltd.
UW Cyclicals vs Defensives Paul Brunker Australia Equity Strategy [email protected] (61-2) 9220 - 7841 J.P. Morgan Securities Australia Limited
Key Changes Market performance to May 20 2011
• YTD Performance: Developed World up 4.4%, outperforming EM by 5.4%.
• Regional Performance: EMU the best performing region (up 8.3% YTD ), Japan the worst performing region (down 8.5%).
• Sector Performance: Healthcare (up 12.3%) and Consumer Staples (up 8.0%) are the best performing sectors YTD, while Materials (down 1.6%) and Utilities (up 0.4% YTD) are the worst.
• Style Performance: Developed World Growth up 4.0%, Value up 4.9%.
• Developed World Mid Caps have Outperformed Small & Large Caps YTD.
J.P. Morgan's revisions to 2011 growth forecasts
• Negative: Global 3.2% [3.3%], Developed Markets 2.1% [2.2%], Japan -0.4% [0.5%],
J.P. Morgan's revisions to 2012 growth forecasts
• Positive: Japan 3.6% [3.5%]
Table of Contents Page #
Market Drivers 2
Index Targets 3
Key Calls 4
Earnings Revisions 5,6
Sector Revisions 7,8
Macro Earnings Growth Driver 9
Cross-sector Earnings Growth 10
Regional Valuation 11,12
Sector-Country Valuation Matrix 13
Policy Rates Forecast 14
Yield Curve & Liquidity 15
Regional Monetary Condition Index 16
Economic Momentum 17
Currency Forecasts 18
Performance: Equities relative to Bonds 19
Performance: Sector & Industry 20,21
Balance Sheets 22
Index Weightings 23

Asia Pacific Equity Research 23 May 2011
Philippines Market Strategy
1Q11 earnings round-up: a clear deterioration
Philippines
Gilbert LopezAC
(63-2) 878-1188 [email protected]
Jeanette Yutan (63-2) 878-1131 [email protected]
J.P. Morgan Securities Philippines, Inc.
· Negative surprises surge: 50% of J.P. Morgan Philippines coverage, or 11 companies out of a total coverage of 22 companies, posted negative surprises in their 1Q11 results. This overshadowed positive surprises numbering only 3, with another 8 meeting expectations. Note that against consensus estimates, the performance reflects a similar number of negative earnings surprises. This reflects a clear deterioration versus the 4Q10 profit results round-up, when positive surprises managed to still outnumber negative surprises by a slim 9 to 7 margin.
· Aggregate 1Q11 earnings merely flattish: Aggregate earnings in 1Q11 posted a flattish Y/Y performance, which was in line with the increase of negative earnings surprises; this marked a sharp deceleration from the 18% Y/Y earnings improvement achieved in 4Q10.
· Utilities have led the disappointments: Leading the surge in disappointments was the utilities sector, with all 4 turning in negative surprises. While we anticipated a Y/Y decline in 1Q11 due to the high base in 1Q10 characterized by the unusual record-high market prices, the quantum of decline was steeper than we expected. We believe that these are reflective of the macro weaknesses.
· Sustainability questionable for sectors holding up well: We have doubts about the sustainability of earnings growth for the property sector in 2011, which has been one of the few bright spots to date. While both earnings and even pre-sales are still posting growth as of end-1Q, we believe the sector would face pressure later in 2011 on a remittances slowdown and consumption weakness amid rising supply.
· Full year earnings growth forecast of 9.8% in peril. Based on the set of 1Q11 results, we believe that our market earnings growth forecast for 2011 of 9.8% faces risk of potential downgrade should remittances and private consumption weaken further.
· Revising our preferences, while keeping defensive stance: We revise our top picks in the Philippines amid retaining our defensive stance. We add Ayala Land, ICTSI, and Metro Pacific in addition to SM Prime and PLDT.
Table 1: J.P. Morgan Phils Top Picks Price Mkt cap PT 2011E 2012E 2011E 2012E 2011E 2012E 2011E 2012E (PhP) (US$m) (PhP) P/E (x) P/E(x) P/B
(x) P/B (x)
ROE (%)
ROE (%)
Yield (%) Yield (%)
SM Prime 11.98 3,872 15.00 18.7 16.4 2.6 2.4 14.7 15.5 2.5 2.9 PLDT 2,418 10,501 2,700 10.8 10.4 4.6 4.6 43.4 44.7 9.3 9.7 ICTSI 50.20 2,255 60.00 18.9 15.5 3.5 3.0 20.2 20.8 1.1 1.3 Ayala Land 16.28 4,998 23.50 29.9 24.1 3.1 2.9 11.8 13.4 1.1 1.5 Metro Pacific 3.42 1,592 4.15 18.4 16.2 0.9 0.9 7.2 7.2 0.4 0.4 Source: J.P. Morgan estimates Company data.

Asia Pacific Equity Research 24 May 2011
Allgreen Properties
Neutral AGRN.SI, AG SP
General offer at S$1.60 per share
Price: S$1.15
Price Target: S$1.20
Singapore Property
Christopher Gee, CFAAC
(65) 6882-2345 [email protected]
Joy Wang (65) 6882-2312 [email protected]
J.P. Morgan Securities Singapore Private Limited
YTD 1m 3m 12m Abs -2.5% 0.9% 8.5% 2.7% Rel -1.8% 0.8% 5.3% -12.4%
1.00
1.15
1.30
S$
May-10 Aug-10 Nov-10 Feb-11 May-11
Pr ice Per fo rman ce
AGRN.SI share price (S$)FTSTI (rebased)
Allgreen Properties Ltd. (Reuters: AGRN.SI, Bloomberg: AG SP) S$ in mn, year-end Dec FY10A FY11E FY12E FY13E Revenue 884 955 878 825 Net Profit 290.7 280.0 207.3 182.3 EPS (S$) 0.18 0.18 0.13 0.11 DPS (S$) 0.05 0.05 0.05 0.05 Revenue growth (%) 42.4% 8.0% -8.0% -6.0% EPS growth (%) 78.6% -3.7% -25.9% -12.0% ROCE 11.4% 11.4% 7.5% 6.0% ROE 11.8% 10.3% 7.0% 5.7% P/E (x) 6.3 6.5 8.8 10.0 P/BV (x) 0.7 0.6 0.6 0.6 EV/EBITDA (x) 6.0 5.0 5.9 6.5 Dividend Yield 4.3% 4.3% 4.3% 4.3%
Company Data Shares O/S (mn) 1,590 Market cap (S$ mn) 1,829 Market cap ($ mn) 1,477 Price (S$) 1.15 Date Of Price 20 May 11 Free float (%) 3mth Avg daily volume 2,084,081.00 3M - Average daily Value (S$ mn) 2.29 Average 3m Daily Turnover ($ mn) 1.85 FTSTI 3,110 Exchange Rate 1.24 Fiscal Year End Dec
Source: Company data, Bloomberg, J.P. Morgan estimates.
· Cash offer of S$1.60 per share: Kuok Group has offered a voluntary conditional cash offer of S$1.60 per share to Allgreen shareholders through Brookvale Investments Pte. Ltd. As of the announcement date, Kuok (Singapore) Ltd. and Kerry Group Ltd. together own about a 55.7% stake in Allgreen. Post acquisition, Kuok Group has said it intends to make Allgreen a private wholly owned subsidiary. The takeover would require the acquirer to receive acceptances for at least 75% of the voting rights.
· 39% premium over the last traded price: The cash offer of S$1.60 per share values Allgreen at S$2.54 billion ($2 billion). The offer price represents a 45% premium on the 3-month VWAP and 39% premium on the last traded share price. The offer is on par with Allgreen’s FY10 book value per share (S$1.62) and at 0.89x FY11E P/B ratio (historical mean P/B = 0.83x). The offer comes at a 29% discount to our FY11E RNAV estimate of S$2.26 for Allgreen, compared with historical average of 25% discount.
· Comes down to price: Allgreen has not in our view seen any meaningful benefit to its listing, with the stock having traded at below its book value and our RNAV estimates on a long-term, through-the-cycle basis. The pooling of opportunity and capital with the Kerry Group companies in a number of JVs in China have been largely discounted by the market ever since they have been entered into, in our view evidenced by the discount the stock has traded at to our RNAV estimate.
· Risks to our view and target price: clearly our end Dec 11 target price of S$1.20 is at risk from the announcement of this offer. Other key downside risks to our view include a significant drop in Singapore residential property prices and tight liquidity conditions resulting in a delay in repayment of the short-term debt.

Asia Pacific Equity Research 23 May 2011
Bharat Heavy Electricals (BHEL)
Overweight BHEL.BO, BHEL IN
Audited numbers reveal profit composition was less rosy than reported earlier - ALERT
Price: Rs2,078.00
20 May 2011
Engineering
Shilpa KrishnanAC
(65) 6882-2348 [email protected]
J.P. Morgan Securities Singapore Private Limited
Sumit Kishore (91-22) 6157-3581 [email protected]
J.P. Morgan India Private Limited
Deepika Belani (91-22) 6157-3582 [email protected]
J.P. Morgan India Private Limited
· BHEL reported PAT of Rs60.1B (up 38%) in FY11, in-line with the provisional number reported in the first week of April (Rs60.21B). Detailed break-ups, which have now been provided, reveal that accounting changes of Rs9.82B (pre-tax) led to this strong performance. Adjusted for these, FY11 PBT growth was 21.7% (vs reported growth of 37%).
· Accounting changes (pre-tax) include: a) policy for employee benefits (Rs2.4B), b) warranty provision (Rs6.95B) and c) treatment of depreciation (Rs468M) – of these, only b) had been revealed at the interim results.
· FY11 OPM (adjusted for these one-offs), at 20.2%, was below our estimate of 21.4%. Full-year EBITDA was 6.5% below our estimate.
· The stock is reacting negatively to this result. The stock split (5:1) and board approval of 5% divestment is not helping sentiment.
· Company is holding conference call at 3pm (dial-in no 91-22-66290311, Passcode: PLPL) where we hope to get better insights into the sustainable profits.
Table 2: BHEL: Mar-q and FY11 result details Rs. in millions, year-end March
YoY YoY 4QFY11R 4QFY10R %chg FY11R FY11E FY11Adj FY10 %chg Net Sales 179,214 135,591 32.2 415,788 391,502 388,060 328,803 18.0 Other op income 4,591 3,856 19.1 9,167 9,500 9,167 6,925 32.4 EBIDTA 42,936 28,728 49.5 89,627 85,812 80,265 62,583 28.3 Other income 1,634 2,080 (21.4) 6,418 6,941 6,418 8,239 (22.1) Interest (305) (178) 71.3 (547) (372) (547) (335) 63.4 Depreciation (1,384) (1,647) (15.9) (5,441) (6,362) (5,909) (4,580) 29.0 PBT 42,881 28,983 48.0 90,057 86,020 80,226 65,907 21.7 Tax (14,901) (9,887) 50.7 (29,945) (28,570) (26,701) (22,800) 17.1 PAT 27,980 19,096 46.5 60,112 57,450 53,526 43,107 24.2 EPS 57.2 39.0 46.5 122.8 117.4 109.3 88.1 24.2 Key ratios (%) Raw Material to Sales 50.0 59.2 (9.21) 54.2 58.1 58.1 58.7 (0.6) Staff Cost to sales 8.1 12.9 (4.7) 13.0 14.3 14.6 15.7 (1.1) Other exp to sales 20.5 9.6 10.9 13.4 8.1 9.0 8.7 0.3 EBIDTA margin 23.4 20.6 2.76 21.1 21.4 20.2 18.6 1.57 Effective tax rate 34.7 34.1 0.6 33.3 33.2 33.3 34.6 Order Backlog (Rs. billion) 1,641 1,438 14.1 1,641 1,688 1,641 1,438 14.1 Order Inflow (Rs. billion) 221 230 (3.8) 605 605 605 590 2.6 Revenue mix (%) Power 80.3 78.0 79.1 77.5 77.3 Industry 19.7 22.0 20.9 22.5 22.7 EBIT margin (%) Power 27.3 27.4 23.5 Industry 26.6 25.6 20.8
Source: J.P. Morgan estimates, Company data. Note: R = reported results.

Asia Pacific Equity Research 24 May 2011
Bharat Heavy Electricals (BHEL)
Overweight BHEL.BO, BHEL IN
Remain positive post FY11 results and conference call
Price: Rs1,931.75
Price Target: Rs2,400.00
India Engineering
Shilpa KrishnanAC
(65) 6882-2348 [email protected]
J.P. Morgan Securities Singapore Private Limited
Sumit Kishore (91-22) 6157-3581 [email protected]
J.P. Morgan India Private Limited
Deepika Belani (91-22) 6157-3582 [email protected]
J.P. Morgan India Private Limited
YTD 1m 3m 12m Abs -16.9% -6.9% -5.3% -16.1% Rel -4.7% 1.4% -4.4% -25.1%
1,800
2,400
3,000
Rs
May-10 Aug-10 Nov-10 Feb-11 May-11
Pr ice Per fo rman ce
BHEL.BO share price (Rs)NIFTY (rebased)
Bharat Heavy Electricals Ltd. (Reuters: BHEL.BO, Bloomberg: BHEL IN) Rs in mn, year-end Mar FY09A FY10A FY11A FY12E FY13E Revenue 262,123 328,614 415,788 469,803 547,553 Adjusted Profit 31,381 43,107 60,112 67,162 76,105 Adjusted EPS (Rs) 64.11 88.06 122.80 137.20 155.47 DPS (Rs) 17.00 23.30 35.46 37.04 41.98 Revenue growth (%) 35.8% 25.4% 26.5% 13.0% 16.5% Adjusted EPS growth (%) 9.7% 37.4% 39.4% 11.7% 13.3% ROCE 38.3% 26.9% 43.0% 37.5% 35.2% ROE 26.5% 29.9% 33.3% 29.6% 27.4% P/E (x) 30.1 21.9 15.7 14.1 12.4 P/BV (x) 7.3 5.9 4.7 3.8 3.1 EV/EBITDA (x) 18.0 20.4 10.7 9.1 7.5 Dividend Yield 0.9% 1.2% 1.8% 1.9% 2.2%
Company Data Shares O/S (mn) 490 Market cap (Rs mn) 945,630 Market cap ($ mn) 21,006 Price (Rs) 1,931.75 Date Of Price 23 May 11 Free float (%) 32.3% 3mth Avg daily volume 838,114.00 3M - Average daily Value (Rs mn) 1,726.72 Average 3m Daily Turnover ($ mn) 38.36 NIFTY 5,387 Exchange Rate 45.02 Fiscal Year End Mar
Source: Company data, Bloomberg, J.P. Morgan estimates.
· Management clarified that the move to streamline accounting policy with IFRS was the key reason for one-offs in FY11: Headline revenue and PAT growth of 26.5% and 39%, respectively, was strong and was aided by +Rs9.28bn (pre-tax) contribution from accounting changes. FY11 adjusted PBT growth was 21.7%. According to the CMD, the company is working toward Rs500bn gross revenue target (vs. our est. of Rs491bn) implied adjusted sales growth of ~23%. From management commentary we infer that FY12 margins are likely to remain stable at FY11 levels (~21.1%). We maintain our FY12/13 estimates.
· Management provides positive outlook on order flows for FY12: BHEL expects ~16-17GW of project orders to be finalized this fiscal year vs. ~15.1GW in FY11 (order inflows of Rs605bn, up 2.6% YoY). Management pegged the initial estimates on the 13th Plan generation target at 150GW.
· Allayed market concerns on competition from SEC-Alstom JV: Management clarified that under the current agreement filed with GoI, Alstom (and its JV) shall not compete with BHEL in supercritical boilers thru 2020. By then, the technology would have been absorbed completely.
· Balance sheet healthy: FY11 FCF was ~Rs9.4bn despite working capital pressures and the company had ~Rs95bn of net cash on it B/S as of Mar-11. We think BHEL offers the best risk-return and revenue visibility. We estimate FY12 FCF yield at ~3.8% and RoE of ~30%.
· Stock corrected 6.7% today post board approval for 5% divestment and one-off ridden FY11 results: In our view, the government is likely to be more supportive of policies benefiting domestic power equipment manufacturers (and BHEL) ahead of the disinvestment. We see stock declines led by FPO pricing concerns as an opportunity to buy. We maintain our OW and Mar-12 PT of Rs2400. Continued competitive pressures pose a risk to long-term margins and our PT.

Asia Pacific Equity Research 23 May 2011
Big C Supercenter Pcl
Overweight BIGC.BK, BIGC TB
Synergy could flow faster; potential upside risk to our estimates
Price: Bt88.25
Price Target: Bt117.00
Thailand Broadlines/Department Stores
Maria LapizAC
(66-2) 684-2683 [email protected]
JPMorgan Securities (Thailand) Limited
Ebru Sener Kurumlu (852) 2800-8521 [email protected]
J.P. Morgan Securities (Asia Pacific) Limited
YTD 1m 3m 12m Abs -1.4% -3.0% 11.0% 85.8% Rel -4.3% 0.1% 3.2% 41.6%
40
70
100
Bt
May-10 Aug-10 Nov-10 Feb-11 May-11
Pr ice Per fo rman ce
BIGC.BK share price (Bt)SET (rebased)
Big C Supercenter Pcl (Reuters: BIGC.BK, Bloomberg: BIGC TB) Bt in mn, year-end Dec FY09A FY10A FY11E FY12E FY13E Revenue 68,058 70,236 106,490 117,398 129,059 Net Profit 2,868.2 3,278.2 3,560.4 4,516.0 5,449.5 EPS (Bt) 3.58 4.09 4.44 5.64 6.80 DPS (Bt) 1.96 1.98 2.44 3.10 3.74 Revenue growth (%) 2.9% 4.1% 50.7% 9.3% 9.1% EPS growth (%) 0.6% 14.3% 8.6% 26.8% 20.7% ROCE 21.0% 22.1% 17.3% 14.9% 19.4% ROE 15.8% 16.7% 16.7% 19.2% 20.7% P/E (x) 24.7 21.6 19.9 15.7 13.0 P/BV (x) 3.7 3.5 3.2 2.8 2.5 EV/EBITDA (x) 8.5 7.9 9.0 7.1 5.6 Dividend Yield 2.2% 2.2% 2.8% 3.5% 4.2%
Company Data Shares O/S (mn) 801 Market cap (Bt mn) 70,722 Market cap ($ mn) 2,335 Price (Bt) 88.25 Date Of Price 20 May 11 Free float (%) 26.8% 3mth Avg daily volume 495,535.00 3M - Average daily Value (Bt mn) 40.51 Average 3m Daily Turnover ($ mn) 1.34 SET 1,073 Exchange Rate 30.29 Fiscal Year End Dec
Source: Company data, Reuters, J.P. Morgan estimates.
· Increasingly more upbeat about the merger: Nearly six months into the post merger integration of the 42 Carrefour stores, we are more confident especially following management’s guidance that synergy will likely begin to manifest in 2Q11 earnings, despite another ~Bt200mn one-time merger expense to be booked. We believe the development is positive and raises the possibility of upside risk to our estimates. We re-affirm OW with a Dec-11 price target of Bt117, DCF-based. We adding BIGC to the Asia Analysts Focus List.
· Very good progress: Fourteen of the 42 acquired stores have been converted and the results are positive with store sales uniformly improving under BIGC’s management despite very strong competition. In some stores, BIGC’s fine-tuning of merchandise led to stronger improvement as the stores become more suited to customers in catchment areas. In 1Q11, BIGC’s SSSG was 2.2% while that of the acquired stores was still lagging. We think the stores will catch up soon. BIGC targets store conversion to complete at end June.
· Base case upside: In our forecasts, we assume that the performance of the 42 acquired stores will be raised to BIGC's level in terms of sales, margins, rebates and other income. Inclusive of the one-time merger expenses we estimate 8.6% EPS growth in FY11, accelerating to 26.8% in FY12.
· Potential upside risks to earnings: As of 1Q11, BIGC has already delivered 8% net profit growth; the merger expenses offset by better operations. By mapping line-by-line the P&L components of the two chains and picking up the “best practice, best terms”, BIGC could create value not only of the 42 acquired stores but also for its own chain (71 branches). Our tracking KPI would be OPM, which we forecast to be 5.05% in FY11, 5.7% in 1Q11. Apart from eliminating redundant opex, BIGC is renegotiating trade terms with positive results that some suppliers would apply the "new" terms retroactive to 1Q11.

Asia Pacific Equity Research 24 May 2011
Crompton Greaves Limited
Overweight CROM.BO, CRG IN
Emotron acquisition to boost Industrial systems growth
Price: Rs247.80
Price Target: Rs300.00
India Engineering
Sumit KishoreAC
(91-22) 6157-3581 [email protected]
J.P. Morgan India Private Limited
Shilpa Krishnan (65) 6882-2348 [email protected]
J.P. Morgan Securities Singapore Private Limited
Deepika Belani (91-22) 6157-3582 [email protected]
J.P. Morgan India Private Limited
YTD 1m 3m 12m Abs -20.1% -11.9% -4.7% 6.3% Rel -7.8% -3.8% -3.7% -3.0%
220
280
340
Rs
May-10 Aug-10 Nov-10 Feb-11 May-11
Pr ice Per fo rman ce
CROM.BO share price (Rs)BSE30 (rebased)
Crompton Greaves Limited (Reuters: CROM.BO, Bloomberg: CRG IN) Rs in mn, year-end Mar FY09A FY10A FY11A FY12E FY13E Revenue 87,373 91,409 100,051 115,944 134,505 Net Profit 5,599.0 8,246.5 9,267.9 10,298.5 12,170.9 EPS (Rs) 8.73 12.85 14.45 16.05 18.97 DPS (Rs) 1.27 1.48 1.52 1.77 2.09 Revenue growth (%) 27.9% 4.6% 9.5% 15.9% 16.0% EPS growth (%) 37.7% 47.3% 12.4% 11.1% 18.2% ROCE 37.2% 40.4% 34.1% 31.4% 31.0% ROE 35.7% 38.0% 32.1% 27.6% 25.7% P/E (x) 28.4 19.3 17.2 15.4 13.1 P/BV (x) 8.7 6.3 4.9 3.8 3.0 EV/EBITDA (x) 13.2 10.1 9.8 8.4 6.7 Dividend Yield 0.5% 0.6% 0.6% 0.7% 0.8%
Company Data Shares O/S (mn) 641 Market cap (Rs mn) 158,961 Market cap ($ mn) 3,531 Price (Rs) 247.80 Date Of Price 23 May 11 Free float (%) 53.9% 3mth Avg daily volume 1,428,372.00 3M - Average daily Value (Rs mn) 372.90 Average 3m Daily Turnover ($ mn) 8.28 BSE30 17,993 Exchange Rate 45.02 Fiscal Year End Mar
Source: Company data, Bloomberg, J.P. Morgan estimates.
· Further details on Emotron post analyst meet: According to management, the acquisition was done to secure industrial drive technology and plug the last remaining gap in the Industrial systems product portfolio. The focus appears to be twofold: (A) Use CG’s network and resources in overseas markets to grow the previously PE owned firm. Management has set a target of more than doubling Emotron's revenues in the West European markets it serves from €37.3mn to €80mn (~Rs5bn) in two years; (B) Use Emotron’s VFD technology for domestic manufacturing and leverage on its strong reference list/experience of over 35 years, for competing in the industrial drives market in India. Also, the aim is to combine CG’s strong position in market for LT motors with entry into drives to offer small automation systems over the next year. See our Note, ‘Emotron acquisition improves addressable market for CG’ for details on the deal.
· Untapped growth opportunity for CG in India, and a large global market for drives: According to management, drives reduce electricity consumption in motors by up to 35%. In Europe, the drive penetration is ~30% vs. only 2-3% in India. Global market for VFD’s is ~US$10bn growing at a CAGR of 11-12%. ABB, Siemens, and Schneider have ~40% market share globally. Size of the domestic target market for CG in VFDs is ~US$375mn, growing at 18-20%. ABB and Siemens dominate with ~70% market share in India.
· More positive on Industrial systems growth: We incorporate acquisition capex of ~€58mn in FY12 and build in our estimate of revenue potential from industrial drives, leading to ~25% industry segment revenue CAGR over FY12-FY14. Our FY13 EPS estimate is up ~2% post revisions.
· CG is our top pick among T&D peers: As per management, the industry order inflow momentum is back to healthy pre-crisis levels (2008). We reiterate our OW (DCF-based Mar-12 PT of Rs300), valuations are attractive (13.1x FY13E P/E) and backed by our PAT growth estimate of 18.2%. Execution/order inflow disappointment in domestic power is the key risk to our view.
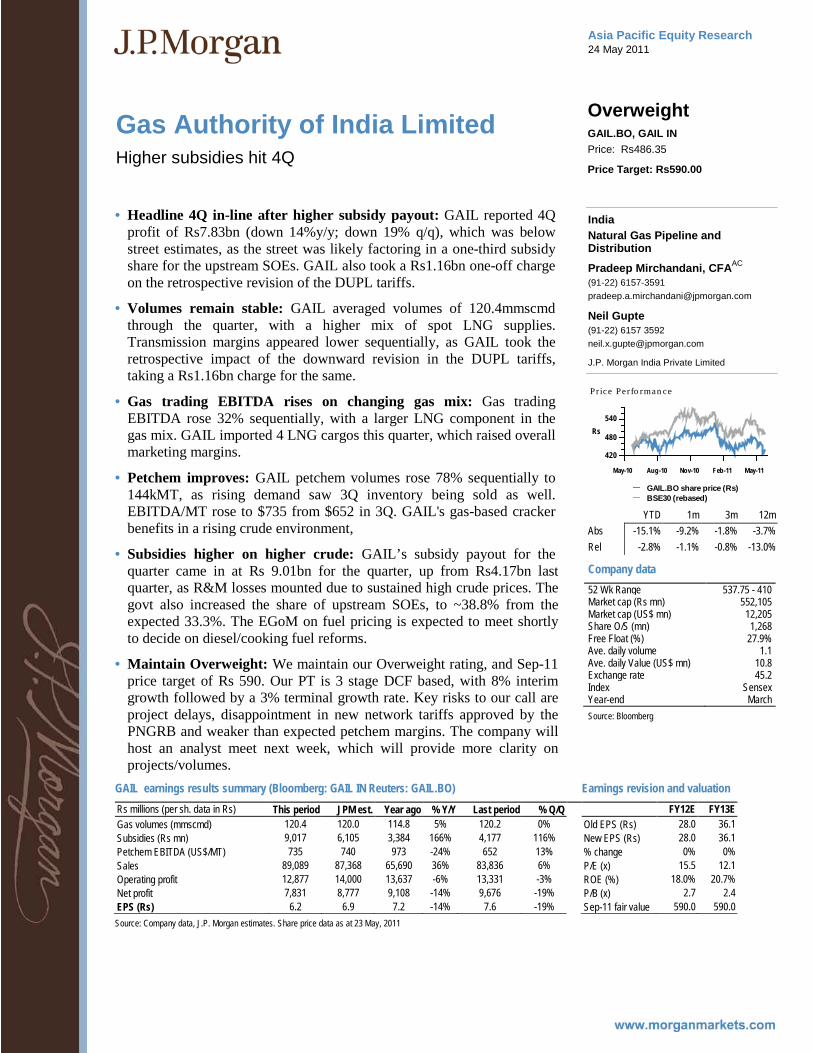
Asia Pacific Equity Research 24 May 2011
Gas Authority of India Limited
Overweight GAIL.BO, GAIL IN
Higher subsidies hit 4Q
Price: Rs486.35
Price Target: Rs590.00
India Natural Gas Pipeline and Distribution
Pradeep Mirchandani, CFAAC
(91-22) 6157-3591 [email protected]
Neil Gupte (91-22) 6157 3592 [email protected]
J.P. Morgan India Private Limited
YTD 1m 3m 12m Abs -15.1% -9.2% -1.8% -3.7% Rel -2.8% -1.1% -0.8% -13.0%
420
480
540Rs
May-10 Aug-10 Nov-10 Feb-11 May-11
Pr ice Per fo rman ce
GAIL.BO share price (Rs)BSE30 (rebased)
Company data 52 Wk Range 537.75 - 410 Market cap (Rs mn) 552,105 Market cap (US$ mn) 12,205 Share O/S (mn) 1,268 Free Float (%) 27.9% Ave. daily volume 1.1 Ave. daily Value (US$ mn) 10.8 Exchange rate 45.2 Index Sensex Year-end March Source: Bloomberg
· Headline 4Q in-line after higher subsidy payout: GAIL reported 4Q profit of Rs7.83bn (down 14%y/y; down 19% q/q), which was below street estimates, as the street was likely factoring in a one-third subsidy share for the upstream SOEs. GAIL also took a Rs1.16bn one-off charge on the retrospective revision of the DUPL tariffs.
· Volumes remain stable: GAIL averaged volumes of 120.4mmscmd through the quarter, with a higher mix of spot LNG supplies. Transmission margins appeared lower sequentially, as GAIL took the retrospective impact of the downward revision in the DUPL tariffs, taking a Rs1.16bn charge for the same.
· Gas trading EBITDA rises on changing gas mix: Gas trading EBITDA rose 32% sequentially, with a larger LNG component in the gas mix. GAIL imported 4 LNG cargos this quarter, which raised overall marketing margins.
· Petchem improves: GAIL petchem volumes rose 78% sequentially to 144kMT, as rising demand saw 3Q inventory being sold as well. EBITDA/MT rose to $735 from $652 in 3Q. GAIL's gas-based cracker benefits in a rising crude environment,
· Subsidies higher on higher crude: GAIL’s subsidy payout for the quarter came in at Rs 9.01bn for the quarter, up from Rs4.17bn last quarter, as R&M losses mounted due to sustained high crude prices. The govt also increased the share of upstream SOEs, to ~38.8% from the expected 33.3%. The EGoM on fuel pricing is expected to meet shortly to decide on diesel/cooking fuel reforms.
· Maintain Overweight: We maintain our Overweight rating, and Sep-11 price target of Rs 590. Our PT is 3 stage DCF based, with 8% interim growth followed by a 3% terminal growth rate. Key risks to our call are project delays, disappointment in new network tariffs approved by the PNGRB and weaker than expected petchem margins. The company will host an analyst meet next week, which will provide more clarity on projects/volumes.
GAIL earnings results summary (Bloomberg: GAIL IN Reuters: GAIL.BO) Earnings revision and valuation Rs millions (per sh. data in Rs) This period JPM est. Year ago % Y/Y Last period % Q/Q FY12E FY13E Gas volumes (mmscmd) 120.4 120.0 114.8 5% 120.2 0% Old EPS (Rs) 28.0 36.1 Subsidies (Rs mn) 9,017 6,105 3,384 166% 4,177 116% New EPS (Rs) 28.0 36.1 Petchem EBITDA (US$/MT) 735 740 973 -24% 652 13% % change 0% 0% Sales 89,089 87,368 65,690 36% 83,836 6% P/E (x) 15.5 12.1 Operating profit 12,877 14,000 13,637 -6% 13,331 -3% ROE (%) 18.0% 20.7% Net profit 7,831 8,777 9,108 -14% 9,676 -19% P/B (x) 2.7 2.4 EPS (Rs) 6.2 6.9 7.2 -14% 7.6 -19% Sep-11 fair value 590.0 590.0 Source: Company data, J.P. Morgan estimates. Share price data as at 23 May, 2011

Asia Pacific Equity Research 23 May 2011
Hon Hai Precision
Neutral 2317.TW, 2317 TT
Fire in Chengdu plant; Implications - ALERT
Price: NT$103.00
20 May 2011
Electronic Manufacturing Services
Gokul HariharanAC
(852) 2800-8564 [email protected]
Alvin Kwock (852) 2800-8533 [email protected]
J.P. Morgan Securities (Asia Pacific) Limited
Event: An explosion occurred in one workshop in Hon Hai's Chengdu factory on Friday evening, leaving 3 workers dead and 16 injured, Production is reportedly suspended currently. We believe this is one of the main polishing facilities for the casings of Apple iPad 2 in Chengdu. Bloomberg also reported that Hon Hai has suspended production at all facilities which carry out similar operations (polishing), pending investigation into the accident.
JPM View:
· Near-term disruption is significant; but could come back on line soon: From our checks, the Chengdu factory already accounts for 60-70% of iPad production (remaining 30% in Shenzhen) and is in a fast ramp up stage, as Hon Hai attempts to move most iPad production there. The affected factory is around 20% of supply for the specific process. The Shenzhen facility has some capacity for pilot production, but is already running close to peak capacity due to higher than expected run rate for iPad 2. Also, Hon Hai has supended production at other facilities doing polishing, pending safety clearance and investigation, which disrupts production further. As iPad 2 were already running low on supply and manufacturing yields were still poor, we feel that this should cause a meaningful near-term disruption in supply. Once safety issues are sorted out, we feel that the ramp up could be achieved quickly (1-2 months) since the process involves a high degree of manual labor and less specialized equipment. Hon Hai is already evaluating moving back to a three-shift operation in Shenzhen (from two shifts).
· Impact on Hon Hai and Foxconn Tech: For Hon Hai (JPM N), revenue downside in 2Q should be mild (around 2-3%) since supply could come back up fairly quickly. However margins are likely to be affected, as costs will escalate due to ramp up of shifts in Shenzhen, production disruption and bringing production back on line - which implies consensus expectation for meaningful margin uptick in 2Q is unlikely to be met. Since the plant involved is doing metal casing polishing, we expect negative impact on Foxconn Tech (JPM OW) as well (iPad is ~15% of light metal sales).
· Impact on Apple supply chain and other Tablet vendors: Supply of iPad2 has been running tight due to manufacturing yield issues and component shortages. This is likely to accentuate shortage in the near-term (at least in 2Q), especially due to the uncertainty regarding safety of the affected process. Once safety clearance is assured, the process could be ramped back up quickly. This is likely to weigh down on other Apple supply chain plays in the near-term. On the contrary, this could help other Tablet vendors (like Acer and ASUS), whose products have seen reasonable sell-in demand due to inadequate supply of iPad2.
Note Apple is covered by JPM analyst, Mark Moskowitz

Asia Pacific Equity Research 23 May 2011
Thai banks
Government cheap loans: Knock-on impacts to banks - ALERT
Banks
Anne JirajariyavechAC
(66-2) 684-2684 [email protected]
JPMorgan Securities (Thailand) Limited
Sunil Garg (852) 2800-8518 [email protected]
J.P. Morgan Securities (Asia Pacific) Limited
· Commercial banks are feeling the impact of government’s cheap loans programs. Ahead of election, the government has announced various populist policies. Among these policies, there are two cheap loan programs initiated by the government and target to support low-income group of people.
· Two-year 0% housing loans of total Bt25 billion to be provided by the Government Housing Bank (GHB). This is for the first home buyer with housing unit price of Bt3 million or below.
· Credit card refinancing loans at 10% of total Bt10 billion. Government Savings Bank (GSB) and Krung Thai Bank (KTB) are the two key lenders of this program.
· Commercial banks prepare to fight back. While state-owned banks are the key lenders of the programs, we are starting to see commercial banks come up with similar loan package and find ways to offer their clients with similar products and pricing. This is in order to secure their clients and loan growths. This will likely increase the NIM pressure which is already high. Last week, SCB and KBANK announced to provide 0% housing loans for the customers of Asian Property Development (AP TB), one of Thailand’s leading property developer.
· We remain cautious on NIM; believe market expectation is still too high. Deposit competition is already high among commercial banks. Degree of competition increase as state-owned banks jumped into the fray. Pressure from funding cost has led us to be cautious for NIM outlook. We earlier have lowered our NIM forecast by 10bp (given the concern on deposit cost). With additional pressure from lending yield from those cheap loan programs, we maintain our cautious view on NIM and earnings for the sector at least into the next two quarters. We believe the market is still bullish about NIM outlook and that needs to be adjusted.

Asia Pacific Equity Research 23 May 2011
Regional Internet Newsflow - Week Ending May 20
Tencent acquired 16% stake of eLong, Shanda Games launched open testing for "Legend of Immortals"
Head of Internet and New Media
Dick WeiAC
(852) 2800-8535 [email protected]
J.P. Morgan Securities (Asia Pacific) Limited
Japan Internet Hiroshi Kamide (81-3) 6736 8602 [email protected]
JPMorgan Securities Japan Co., Ltd.
Yusuke Maeda (81-3) 6736-8654 [email protected]
JPMorgan Securities Japan Co., Ltd.
Korea Internet Sungmin Chang, CFA (82-2) 758-5719 [email protected]
J.P. Morgan Securities (Far East) Ltd, Seoul Branch
Telecom, Internet, and New Media Strategist James R. Sullivan, CFA (65) 6882-2374 [email protected]
J.P. Morgan Securities Singapore Private Limited
· Tencent acquired a 16% stake of eLong (LONG, NR) with consideration of US$84.4M. Tencent also invested in 30% stake of 17u.cn, a private B2B travel site in January, according to Sina. We believe the acquisition will help Tencent broaden its services to users – expand stickiness of the users. eLong ranks 2nd with 7.5% vs. Ctrip 47.3% in 1Q11 in online travel market, according to iResearch.
· Baidu to launch Q&A service “Xinzhi” at xinzhi.baidu.com. The service is similar to Quora service in the US. Baidu continues to expand its social-related service offerings.
· Shanda Games’ “Legend of Immortals" received good response: it is the company’s first MMO game with SNS features. The registered accounts of the SNS of the game exceeded 3.5M at the first open test day of May 16. This should be positive to Shanda Games.
· The top three performers last week: Sina, Airmedia and Shanda Games. The top three decliners: CRIC, Neowiz Games and Kingsoft.
Table 3: Price Performance - China and Korea Internet Stocks Company Name Price (LC) Price Change 20-May-2011 1 Wk Chng 1 Mth Cng YTD Sina 47.75 8.5% -12.8% 68.5% AirMedia 115.97 4.6% -21.2% -44.0% Shanda Games 46.25 3.6% -2.1% 11.2% Baidu 3.86 2.6% -9.4% 39.5% Focus Media 220.20 2.4% -5.2% 50.4% Netease 13.38 1.6% -10.4% 27.9% Tencent 7.15 0.5% 0.3% 30.4% DangDang 100,900 0.5% -12.2% -22.2% Alibaba 83.09 0.5% -5.6% -4.0% Changyou 256,000 0.3% 5.9% 47.8% BitAuto 42.13 0.3% -27.9% -11.7% Perfect World 4.14 -0.3% -9.4% 1.4% Sohu 4.89 -0.3% -13.2% 30.9% Youku 134.69 -1.6% -24.0% 36.4% The9 32.98 -1.7% -1.5% -12.1% VisionChina 21.07 -1.9% -0.5% -10.8% Daum Communication 194,000 -2.3% -7.9% 30.7% NHN 23.98 -3.0% -6.5% -14.5% China Finance Online 4.98 -3.2% -9.6% -25.1% Globalsources 6.12 -3.6% -10.9% 13.9% Shanda Interactive 57.33 -3.7% -12.9% 8.0% Sofun 44.80 -4.7% -3.7% 22.7% NcSoft 44,850 -5.7% -11.0% 22.8% Ctrip 42.83 -5.7% -11.0% 10.8% 51job 21.93 -5.8% -5.0% 16.4% Mecox Lane 7.08 -6.0% -14.3% -32.8% Giant Interactive 10.84 -10.0% -7.3% 13.9% CRIC 8.11 -10.3% -18.8% -26.3% Neowiz Games 7.81 -11.2% -13.9% -2.4% Kingsoft 4.30 -19.9% -16.2% 11.1% Source: Bloomberg. 1 week close is based on May 13, 2011 closing price. 1 Month change is based on Apr 21, 2011 closing price.

Asia Pacific Equity Research 23 May 2011
China Property Weekly
Property sales for the week ending May 22, 2011
China Property
Ryan LiAC
(852) 2800-8529 [email protected]
Lucia Kwong, CFA (852) 2800-8526 [email protected]
J.P. Morgan Securities (Asia Pacific) Limited
China developer’s share price index 1994=100
Source: Bloomberg, J.P. Morgan.
0
50
100
150
200
250
300
350
400
Jan-04 Feb-05 Mar-06 Apr-07 May-08 Jun-09 Jul-10
· Primary sales volume further improved: Sales volume in the 8 key cities that we track was 1,953 units (daily average) for the week ending May 22, 2011, up 6% W/W and is 21% lower than 08-10 average. Volume performance is diversified among cities as they are mostly linked to the launch schedule of developers. In general we are seeing an increasing amount of launches (or available for sales units) in the market.
· Residential on commercial land grant disallowed in Beijing: On May 16, the Beijing Land Resources Bureau and four other administrative bodies of Beijing jointly released a notice (Notice), stating the further tightening of converting developments with commercial land grants to residential-alike developments: Effective June 1, no separated bathroom is allowed for individual units of developments with commercial land grant. The Notice also echoed the previously-announced restriction of disallowing the conversion of hotel properties into strata-title sales. However such restriction is not retrospective and those with presale or building plans approved are not subject to this. That said, no punishments were stated for violation of such Notice, which would mean that the level of execution would be rather loose in our view.
· April’s official prices data more stablized M/M: According to the 70-city property price index of the National Bureau of Statistics, housing prices in April were more stablized versus March. Among the 70 cities, 56 (vs 52 cities in March) recorded a M/M increase in primary housing prices and 42 (versus 45 cities in March) recorded M/M increase secondary transaction prices. Among the eight key cities, secondary housing prices in Beijing, Tianjin and Chongqing recorded the first M/M decline, while others’ rebouned 0.1% to 1.0% M/M; while in the primary market Chengdu prices slipped 0.2% M/M and the rest held stable (+0.1%-0.8% M/M). Luxury residential (those with unit size >144 sqm) continued underperforming the broader market but have mostly stopped the declining trend (with exception to Hangzhou of which prices were still down 1.1% M/M). We continue seeing developers increasing launches in May, and hence property price should more or less remain stable in near term in our view.
Table 4: Major new launches Project name City District ASP Rmb/sqm Developer(s) Date of launch Details 中海御景熙岸 Shanghai Pudong 21,000 COLI 22-May-11 Launched 200 units
CRLand Central Park Shanghai Jiading 25,000 CRLand 15-May-11 Sold ~400 units & fetched Rmb750m
Shimao Plaza Hangzhou Xiasha 5,000 Shimao 22-May-11 Launched 500 units Jinmao Noble Manor Shanghai Chongming 35,000 (villa) Franshion Early Jun
Sources: Soufun.

Asia Pacific Equity Research 23 May 2011
Hong Kong Property Update
Weekly primary sales: 111 units
Hong Kong Property
Amy Luk, CFAAC
(852) 2800 8524 [email protected]
Lucia Kwong, CFA (852) 2800-8526 [email protected]
Noel Chan (852) 2800- 8522 [email protected]
J.P. Morgan Securities (Asia Pacific) Limited
HK Developers’ share price index
Source: Bloomberg
1,500
2,500
3,500
4,500
5,500
6,500
Jan-05 Apr-06 Jul-07 Sep-08 Dec-09 Mar-11
HK Developers’ share price index
Source: Bloomberg
1,500
2,500
3,500
4,500
5,500
6,500
Jan-05 Apr-06 Jul-07 Sep-08 Dec-09 Mar-11
· Chinachem launched a small project over the weekend: We recorded 111 units sold in the primary market last week, compared with 106 units sold the week before. Chinachem launched a small project Residence 228 in Sham Shui Po over the weekend and sold 8 units. The project provides a total of 88 units with standard unit sizes ranging from 445 to 783 sq ft. Other sales of the week mainly came from Kerry’s Lions Rise (65 units) and Cheung Kong’s Uptown (18 units). Secondary prices stayed flat with Centaline index for the week ended 15 May stood at 97.44, down 0.01% W/W.
· i.UniQ Residence and Imperial Cullinan of SHKP in the pipeline: SHKP has issued a price list for its small scale project i.UniQ Residence in Shau Kei Wan. The asking ASP of the project is HK$13,525 psf, about 8% higher than the ASP of Emperor’s 18 Upper East at around HK$12,500 psf in the same district. The project is expected to launch this week. Imperial Cullinan is also in the pipeline for launch. SHKP is pending pre-sale consent for the project. The initial plan is to first launch the 4-bedroom units with indicative selling price of HK$20,000-25,000 psf.
· Apple Store to be opened in Hysan Place: According to the Hong Kong Economic Times, Apple has pre-leased around 15,000 sq ft in Hysan Place in Causeway Bay. The monthly rent is said to be HK$3.5 million or HK$233psf. Apple Store will take up space on G/F and 1/F. The mall is expected to open in 2Q12. The other major retail tenant of Hysan Place is DFS which will take up ~45,000 sq ft while KPMG is the largest office tenant so far, preleasing ~80,000 sq ft.
· Government considers feasibility of resuming HOS: The Chief Executive Donald Tsang said he is prepared to consider the feasibility of resuming the Home Ownership Scheme (HOS), according to The Standard. Land supply would be a key consideration as the sites for resuming HOS should be somewhere not marked for public rental or private housing. He is likely to address this issue in his next Policy Address in October.
Table 5: Weekly property sales/presales Developers Location Sold Achieved ASP
(HK$psf) Units Left Comparables'
ASP (HK$psf) Residence 228 Chinacham Sham Shui Po 8 7,500 - 9,800 88 80 5.800 - 7,800 Lions Rise Kerry Wong Tai Sin 65 9,500 - 18,000 968 662 7,600 - 12,500 Uptown Cheung Kong Yuen Long 18 3,900 - 7,300 734 180 4,300 - 6,000 Crown by the Sea Cheung Kong Tuen Mun 1 6,700 - 10,000 40 24 4,000 – 5,000 Shouson Peak SHKP Shouson Hill 1 46,000 31 29 26,000 - 29,000 Festival City Ph 2 Cheung Kong / MTRC Shatin 1 7,300 - 11,500 1,368 157 5,500 - 8,500 Azura Swire Pacific / Henderson Mid-Levels 1 21,000 - 24,000 126 67 14,600 - 42,000 Hermitage Sino / Chinese Estate / Nan Fung West Kowloon 2 8,500 - 17,500 961 30 7,000 - 15,000 Beverly Hills Henderson Land Tai Po 6 6,000 - 14,000 535 94 5,700 - 8,000 The Balmoral Sino Land Taipo 4 7,300 - 13,700 79 41 4,700 - 6,400 The Latitude SHKP San Po Kong 1 6,500 - 8,500 1,159 29 4,500 - 6,000 Serenade Hong Kong Land Tai Hang 3 19,000 94 51 9,000 - 12,000 Total 111 Source: Hong Kong Economic Journal, Hong Kong Economic Times, Sing Tao Daily, Mingpao.

Asia Pacific Equity Research 23 May 2011
Display Market Update
All panel sizes experience price increase; Accumulate selective panel makers - ALERT
Semiconductors
JJ ParkAC
(822) 758-5717 [email protected]
J.P. Morgan Securities (Far East) Ltd, Seoul Branch
Narci Chang (886-2) 2725-9899 [email protected]
J.P. Morgan Securities (Taiwan) Limited.
Hyunjoon Roh (82-2) 758 5712 [email protected]
J.P. Morgan Securities (Far East) Ltd, Seoul Branch
Justin J. Park (82-2) 758-5725 [email protected]
J.P. Morgan Securities (Far East) Ltd, Seoul Branch
LCD panel prices: Monthly change % (H/H)
Source: DisplaySearch, J.P. Morgan estimates.
4%3%2%1%0%1%2%
· All mainstream panel prices have increased: According to DisplaySearch (DS), despite weak end-demand, all large-size panels experienced a price increase in 2H-May on the back of disciplined supply across the board. Since most panel makers lost money in 1Q11, they need to adjust loading rate to raise panel prices. As a result, all major panel prices have increased as much as 3% H/H in 2H-May. We forecast the trend likely to continue into June as seasonal upticks in demand return.
· TV panel prices maintain upward price momentum: As we indicated in our latest Display Market update note on 10 May, 2011, LCD TV panel prices bottomed out in May and LCD TV supply and demand is reaching a balance point. Overall demand during China May holidays turned out to be robust with a Y/Y increase of 15 to 20%. This stimulates inventory replenishment in China TV brands. Also, global TV brands are going to roll out new models (especially 3D models) in 2H11 which results in tight supply for 3D panels and some LED panels.
· Weak IT demand but strong growth from tablet and smartphone: We foresee overall PC demand to remain weak which negatively impacts NBPC panels and LCD monitors to some extent. On the other hand, display for tablet PCs will show meaningful growth in 2011. Given higher panel price for tablet PC compared to normal IT panels, panel makers, who have higher exposure to tablet PCs, could fully offset potential shortfall in IT panel demand. On top of that, display for smartphone remains a lucrative business to major panel makers, in our view.
· Accumulate selective panel makers: Despite panel prices bottoming out and robust demand during May holiday, most panel makers' share prices remain depressed and they are trading below historic trough multiples. Hence, we recommend investors accumulate selective panel makers such as LGD and AUO while we would avoid LED names except Epistar due to ongoing margin pressure.
Flat panel price trend US$, %
Jan-11 Feb-11 Mar-11 Apr-11 1H-May 2H-May H/H change Mobile PC 13.3" LED 48 48 48 48 48 48 0 0%
14.0" LED 42 42 42 42 42 42 0 0% 15.6" LED 43 43 43 43 43 43 0 0% 17.3" LED 62 62 62 62 62 62 0 0%
Monitor 17" 57 57 57 57 57 58 1 2% 19" 60 60 60 61 61 62 1 2% 20" 60 60 62 63 63 64 1 2%
LCD TV 32" 149 148 147 147 149 151 2 1% 37" 196 194 192 190 192 193 1 1% 42" 240 237 234 232 235 237 2 1% 42" LED 330 327 322 317 317 320 3 1%
Source: DisplaySearch, J.P. Morgan.

Asia Pacific Equity Research 23 May 2011
JPM Asia Telco Back Testing Analysis
Investing our recommendations: 23rd May 2011
Alternative Carriers/Emerging Wireline, Broadband, Wireless Services, Wireline Services/Incumbents
James R. Sullivan, CFAAC
(65) 6882-2374 [email protected]
Vishesh Gupta (65) 6882 2367 [email protected]
J.P. Morgan Securities Singapore Private Limited
· This report updates current statistics for our JPM Asia Telco Back Testing Analysis. The analysis shows a YTD return of 20.65% vs. benchmark (FTSE Asia Telecoms Index, FTSETEL) of 6.26%; and 41.06% since inception (27th July 2010) vs. benchmark of 16.62%.
· The back-testing analysis: 1) Owns any stock rated OW, has no position in N stocks, and is short any UW stocks. 2) All positions are USD10mn, or 2x ADTO, whichever is smaller. 3) All trades are assumed executed on day of publication of the initiation / recommendation change. Current positions are shown in Table 1.
· We maintain an updated live version of this back testing analysis using Bloomberg's Portfolio tool - Please contact us if you would like access.
· This report contains analysis of risk statistics, VAR, Tracking error, among others. Please contact us to discuss in more detail.
JPM Asia Telco Analyst Back testing Analysis - Since inception
Source: Bloomberg.
JPM Asia Telco Analyst Back testing Analysis – YTD 2011
Source: Bloomberg.

Asia Pacific Equity Research 23 May 2011
Asia Analyst Focus List
Remove Pair Trade: Agung Podomoro Land as Long and Lippo Karawaci Tbk as Short - ALERT
Indonesia Property
Liliana BambangAC
(62-21) 5291-8572 [email protected]
PT J.P. Morgan Securities Indonesia
· Action: Remove Agung Podomoro Land as Long and Lippo Karawaci Tbk as Short
· Trade: Pair Trade - Absolute
· Time Horizon: < 6 months
· Rationale: We are closing our short LPKR - long APLN as some of the catalysts that we had expected have been playing out. We expected LPKR to underperform against the JCI index post the 1Q11 earnings announcement as LPKR’s 1Q11 earnings were merely in-line with expectation.
· We reiterate our rating of Overweight on Agung Podomoro Land and Lippo Karawaci Tbk.
J.P. Morgan’s Asia Analyst Focus List (AFL) is a selection of instruments chosen by individual analysts/strategists as ‘Relative’ or ‘Absolute’ trades over a defined time horizon.
The Relative trade list is a selection of stocks chosen by individual analysts that represent their top picks with the potential to provide an annualized total return in excess of +/-20% over the next 6-12 months - either Long or Short and relative to the relevant country index (which are MSCI country indices, except for Shanghai listed A-shares which are relative to SHASHR).
The Absolute trade list is a selection of stocks and/or indices, chosen by individual analysts and strategists, respectively, representing their trading ideas - either Long or Short, that are intended to generate absolute returns in the short term (< 6 months). The ideas may be expressed as single stocks or in pairs. A stock or index will be removed from this list if its absolute return (based on VWAP) falls below 10%.
If a stock is placed under research restriction, J.P. Morgan may remove the stock from the AFL list pursuant to applicable law and/or J.P. Morgan policy without any further notice.
Each trade is current only for the time horizon indicated. The short-term action expressed in the absolute trade list (Long or Short) may differ from J.P. Morgan's rating on the corresponding equities (Overweight, Neutral, or Underweight). For J.P. Morgan's long-term view on these names, including an analysis of valuation methodology and risk, please see the most recent company-specific research available at MorganMarkets http://www.morganmarkets.com or contact your J.P. Morgan representative.
The Analyst Focus List is not intended to be viewed as model portfolios. Please refer to specific company research for the fundamental investment thesis for each stock included in this list as well as the analysts’ complete views. Important disclosures, including price charts for all companies under coverage for at least one year, are available through the search function on J.P. Morgan's website https://mm.jpmorgan.com/disclosures/company. Total returns exclude commissions. Past results are not indicative of future performance. Additional information available upon request.
34
Asia Pacific Equity Research 24 May 2011
Sunil Garg (852) 2800-8518 [email protected]
Analyst Certification: The research analyst who is primarily responsible for this research and whose name is listed first on the front cover certifies (or in a case where multiple research analysts are primarily responsible for this research, the research analyst named first in each group on the front cover or named within the document individually certifies, with respect to each security or issuer that the research analyst covered in this research) that: (1) all of the views expressed in this research accurately reflect his or her personal views about any and all of the subject securities or issuers; and (2) no part of any of the research analyst’s compensation was, is, or will be directly or indirectly related to the specific recommendations or views expressed by the research analyst in this research.
Important Disclosures
· Market Maker: JPMS makes a market in the stock of Philippine Long Distance Telephone Company. · Lead or Co-manager: J.P. Morgan acted as lead or co-manager in a public offering of equity and/or debt securities for ABB Ltd,
Agung Podomoro Land, Astra International, Axis Bank Ltd, Franshion Properties (China) Ltd., Honda Motor (7267), Inpex Corporation, Petronas Chemicals Group Berhad, Sino Biopharmaceutical, Tata Steel Ltd, VanceInfo within the past 12 months.
· Analyst Position: The following analysts (and/or their associates or household members) own a long position in the shares of Axis Bank Ltd: Bijay Kumar. The following analysts (and/or their associates or household members) own a long position in the shares of Banpu Public: Sukit Chawalitakul.
· Beneficial Ownership (1% or more): J.P. Morgan beneficially owns 1% or more of a class of common equity securities of Bharat Heavy Electricals (BHEL), DAINIPPON SCREEN MFG. (7735).
· Client of the Firm: ABB Ltd is or was in the past 12 months a client of JPM; during the past 12 months, JPM provided to the company investment banking services. Agung Podomoro Land is or was in the past 12 months a client of JPM; during the past 12 months, JPM provided to the company investment banking services. Astra International is or was in the past 12 months a client of JPM; during the past 12 months, JPM provided to the company investment banking services, non-investment banking securities-related service and non-securities-related services. Axis Bank Ltd is or was in the past 12 months a client of JPM; during the past 12 months, JPM provided to the company investment banking services, non-investment banking securities-related service and non-securities-related services. Ayala Land is or was in the past 12 months a client of JPM. Banpu Public is or was in the past 12 months a client of JPM; during the past 12 months, JPM provided to the company investment banking services and non-investment banking securities-related service. Bharat Heavy Electricals (BHEL) is or was in the past 12 months a client of JPM. Canon (7751) is or was in the past 12 months a client of JPM; during the past 12 months, JPM provided to the company non-investment banking securities-related service and non-securities-related services. China Mobile Limited is or was in the past 12 months a client of JPM. China Telecom Corporation Limited is or was in the past 12 months a client of JPM. China Yurun Food Group is or was in the past 12 months a client of JPM. Crompton Greaves Limited is or was in the past 12 months a client of JPM. Dialog Group Bhd is or was in the past 12 months a client of JPM. Franshion Properties (China) Ltd. is or was in the past 12 months a client of JPM; during the past 12 months, JPM provided to the company investment banking services. FUJIFILM Holdings (4901) is or was in the past 12 months a client of JPM; during the past 12 months, JPM provided to the company non-investment banking securities-related service and non-securities-related services. Gas Authority of India Limited is or was in the past 12 months a client of JPM. Hitachi (6501) is or was in the past 12 months a client of JPM; during the past 12 months, JPM provided to the company non-investment banking securities-related service and non-securities-related services. Hon Hai Precision is or was in the past 12 months a client of JPM. Honda Motor (7267) is or was in the past 12 months a client of JPM; during the past 12 months, JPM provided to the company investment banking services, non-investment banking securities-related service and non-securities-related services. Huaneng Power Int'l - H is or was in the past 12 months a client of JPM. IJM Corporation is or was in the past 12 months a client of JPM. Inpex Corporation is or was in the past 12 months a client of JPM; during the past 12 months, JPM provided to the company investment banking services and non-investment banking securities-related service. International Container Terminal Services, Inc. is or was in the past 12 months a client of JPM; during the past 12 months, JPM provided to the company investment banking services and non-investment banking securities-related service. Lenovo Group Limited is or was in the past 12 months a client of JPM. LG Chem Ltd is or was in the past 12 months a client of JPM. LG Display is or was in the past 12 months a client of JPM; during the past 12 months, JPM provided to the company investment banking services and non-investment banking securities-related service. LG Electronics is or was in the past 12 months a client of JPM; during the past 12 months, JPM provided to the company investment banking services, non-investment banking securities-related service and non-securities-related services. Lippo Karawaci Tbk is or was in the past 12 months a client of JPM; during the past 12 months, JPM provided to the company non-investment banking securities-related service and non-securities-related services. Nikon (7731) is or was in the past 12 months a client of JPM; during the past 12 months, JPM provided to the company investment banking services and non-investment banking securities-related service. Petronas Chemicals Group Berhad is or was in the past 12 months a client of JPM; during the past 12 months, JPM provided to the company investment banking services. Petronet LNG Ltd. is or was in the past 12 months a client of JPM. Philippine Long Distance Telephone Company is or was in the past 12 months a client of JPM; during the past 12 months, JPM provided to the company non-investment banking securities-related service and non-securities-related services. RHB Capital is or was in the past 12 months a client of JPM; during the past 12 months, JPM provided to the company non-investment banking securities-related service and non-securities-related services. Samsung Engineering is or was in the past 12 months a client of JPM; during the past 12 months, JPM provided to the company non-investment banking securities-related service. Siemens India is or was in the past 12 months a client of JPM. Sino Biopharmaceutical is or was in the past 12 months a client of JPM; during the past 12 months, JPM provided to the company investment banking
35
Asia Pacific Equity Research 24 May 2011
Sunil Garg (852) 2800-8518 [email protected]
services. SM Prime Holdings, Inc. is or was in the past 12 months a client of JPM. Suntech Power Holdings Co., Ltd. is or was in the past 12 months a client of JPM. Tata Steel Ltd is or was in the past 12 months a client of JPM; during the past 12 months, JPM provided to the company investment banking services, non-investment banking securities-related service and non-securities-related services. VanceInfo is or was in the past 12 months a client of JPM; during the past 12 months, JPM provided to the company investment banking services.
· Investment Banking (past 12 months): J.P. Morgan received, in the past 12 months, compensation for investment banking services from ABB Ltd, Agung Podomoro Land, Astra International, Axis Bank Ltd, Banpu Public, Franshion Properties (China) Ltd., Honda Motor (7267), Inpex Corporation, International Container Terminal Services, Inc., LG Display, LG Electronics, Nikon (7731), Petronas Chemicals Group Berhad, Sino Biopharmaceutical, Tata Steel Ltd, VanceInfo.
· Investment Banking (next 3 months): J.P. Morgan expects to receive, or intends to seek, compensation for investment banking services in the next three months from ABB Ltd, Agung Podomoro Land, Astra International, Axis Bank Ltd, Banpu Public, Franshion Properties (China) Ltd., FUJIFILM Holdings (4901), Hitachi (6501), Honda Motor (7267), Inpex Corporation, International Container Terminal Services, Inc., Lenovo Group Limited, LG Chem Ltd, LG Display, LG Electronics, Nikon (7731), Petronas Chemicals Group Berhad, Philippine Long Distance Telephone Company, Siemens India, Sino Biopharmaceutical, Tata Steel Ltd, VanceInfo.
· Non-Investment Banking Compensation: JPMS has received compensation in the past 12 months for products or services other than investment banking from Astra International, Axis Bank Ltd, Banpu Public, Canon (7751), FUJIFILM Holdings (4901), Hitachi (6501), Honda Motor (7267), Inpex Corporation, International Container Terminal Services, Inc., LG Display, LG Electronics, Lippo Karawaci Tbk, Nikon (7731), Philippine Long Distance Telephone Company, RHB Capital, Samsung Engineering, Tata Steel Ltd. An affiliate of JPMS has received compensation in the past 12 months for products or services other than investment banking from ABB Ltd, Astra International, Axis Bank Ltd, Ayala Land, Banpu Public, Canon (7751), Dialog Group Bhd, Franshion Properties (China) Ltd., FUJIFILM Holdings (4901), Hitachi (6501), Hon Hai Precision, Honda Motor (7267), Inpex Corporation, International Container Terminal Services, Inc., Lenovo Group Limited, LG Chem Ltd, LG Display, LG Electronics, Nikon (7731), Philippine Long Distance Telephone Company, RHB Capital, Siemens India, SM Prime Holdings, Inc., Suntech Power Holdings Co., Ltd., VanceInfo.
· J.P. Morgan Securities (Far East) Ltd, Seoul branch is acting as a Market Maker (Liquidity Provider) for the Equity Linked Warrants of LG Chem Ltd and owns 16,843,990 as of 23-May-11.
· J.P. Morgan Securities (Far East) Ltd, Seoul branch is acting as a Market Maker (Liquidity Provider) for the Equity Linked Warrants of LG Display and owns 13,807,170 as of 23-May-11.
· J.P. Morgan Securities (Far East) Ltd, Seoul branch is acting as a Market Maker (Liquidity Provider) for the Equity Linked Warrants of LG Electronics and owns 15,711,050 as of 23-May-11.
· J.P. Morgan Securities (Far East) Ltd, Seoul branch is acting as a Market Maker (Liquidity Provider) for the Equity Linked Warrants of LG Innotek and owns 48,000 as of 20-May-11.
· J.P. Morgan Securities (Far East) Ltd, Seoul branch is acting as a Market Maker (Liquidity Provider) for the Equity Linked Warrants of Samsung Engineering Co. Ltd and owns 10,596,120 as of 23-May-11.
· MSCI: The MSCI sourced information is the exclusive property of Morgan Stanley Capital International Inc. (MSCI). Without prior written permission of MSCI, this information and any other MSCI intellectual property may not be reproduced, redisseminated or used to create any financial products, including any indices. This information is provided on an 'as is' basis. The user assumes the entire risk of any use made of this information. MSCI, its affiliates and any third party involved in, or related to, computing or compiling the information hereby expressly disclaim all warranties of originality, accuracy, completeness, merchantability or fitness for a particular purpose with respect to any of this information. Without limiting any of the foregoing, in no event shall MSCI, any of its affiliates or any third party involved in, or related to, computing or compiling the information have any liability for any damages of any kind. MSCI, Morgan Stanley Capital International and the MSCI indexes are services marks of MSCI and its affiliates.
Important Disclosures for Equity Research Compendium Reports: Important disclosures, including price charts for all companies under coverage for at least one year, are available through the search function on J.P. Morgan’s website https://mm.jpmorgan.com/disclosures/company or by calling this U.S. toll-free number (1-800-477-0406)
Explanation of Equity Research Ratings and Analyst(s) Coverage Universe: J.P. Morgan uses the following rating system: Overweight [Over the next six to twelve months, we expect this stock will outperform the average total return of the stocks in the analyst’s (or the analyst’s team’s) coverage universe.] Neutral [Over the next six to twelve months, we expect this stock will perform in line with the average total return of the stocks in the analyst’s (or the analyst’s team’s) coverage universe.] Underweight [Over the next six to twelve months, we expect this stock will underperform the average total return of the stocks in the analyst’s (or the analyst’s team’s) coverage universe.] J.P. Morgan Cazenove’s UK Small/Mid-Cap dedicated research analysts use the same rating categories; however, each stock’s expected total return is compared to the expected total return of the FTSE All Share Index, not to those analysts’ coverage universe. A list of these analysts is available on request. The analyst or analyst’s team’s coverage universe is the sector and/or country shown on the cover of each publication. See below for the specific stocks in the certifying analyst(s) coverage universe.

36
Asia Pacific Equity Research 24 May 2011
Sunil Garg (852) 2800-8518 [email protected]
J.P. Morgan Equity Research Ratings Distribution, as of March 31, 2011
Overweight (buy)
Neutral (hold)
Underweight (sell)
J.P. Morgan Global Equity Research Coverage 47% 42% 11% IB clients* 50% 45% 33% JPMS Equity Research Coverage 43% 49% 8% IB clients* 70% 62% 56%
*Percentage of investment banking clients in each rating category. For purposes only of FINRA/NYSE ratings distribution rules, our Overweight rating falls into a buy rating category; our Neutral rating falls into a hold rating category; and our Underweight rating falls into a sell rating category.
Valuation and Risks: Please see the most recent company-specific research report for an analysis of valuation methodology and risks on any securities recommended herein. Research is available at http://www.morganmarkets.com , or you can contact the analyst named on the front of this note or your J.P. Morgan representative.
Analysts’ Compensation: The equity research analysts responsible for the preparation of this report receive compensation based upon various factors, including the quality and accuracy of research, client feedback, competitive factors, and overall firm revenues, which include revenues from, among other business units, Institutional Equities and Investment Banking.
Registration of non-US Analysts: Unless otherwise noted, the non-US analysts listed on the front of this report are employees of non-US affiliates of JPMS, are not registered/qualified as research analysts under FINRA/NYSE rules, may not be associated persons of JPMS, and may not be subject to FINRA Rule 2711 and NYSE Rule 472 restrictions on communications with covered companies, public appearances, and trading securities held by a research analyst account.
Other Disclosures
J.P. Morgan ("JPM") is the global brand name for J.P. Morgan Securities LLC ("JPMS") and its affiliates worldwide. J.P. Morgan Cazenove is a marketing name for the U.K. investment banking businesses and EMEA cash equities and equity research businesses of JPMorgan Chase & Co. and its subsidiaries.
Options related research: If the information contained herein regards options related research, such information is available only to persons who have received the proper option risk disclosure documents. For a copy of the Option Clearing Corporation’s Characteristics and Risks of Standardized Options, please contact your J.P. Morgan Representative or visit the OCC’s website at http://www.optionsclearing.com/publications/risks/riskstoc.pdf.
Legal Entities Disclosures U.S.: JPMS is a member of NYSE, FINRA and SIPC. J.P. Morgan Futures Inc. is a member of the NFA. JPMorgan Chase Bank, N.A. is a member of FDIC and is authorized and regulated in the UK by the Financial Services Authority. U.K.: J.P. Morgan Securities Ltd. (JPMSL) is a member of the London Stock Exchange and is authorized and regulated by the Financial Services Authority. Registered in England & Wales No. 2711006. Registered Office 125 London Wall, London EC2Y 5AJ. South Africa: J.P. Morgan Equities Limited is a member of the Johannesburg Securities Exchange and is regulated by the FSB. Hong Kong: J.P. Morgan Securities (Asia Pacific) Limited (CE number AAJ321) is regulated by the Hong Kong Monetary Authority and the Securities and Futures Commission in Hong Kong. Korea: J.P. Morgan Securities (Far East) Ltd, Seoul Branch, is regulated by the Korea Financial Supervisory Service. Australia: J.P. Morgan Australia Limited (ABN 52 002 888 011/AFS Licence No: 238188) is regulated by ASIC and J.P. Morgan Securities Australia Limited (ABN 61 003 245 234/AFS Licence No: 238066) is a Market Participant with the ASX and regulated by ASIC. Taiwan: J.P.Morgan Securities (Taiwan) Limited is a participant of the Taiwan Stock Exchange (company-type) and regulated by the Taiwan Securities and Futures Bureau. India: J.P. Morgan India Private Limited, having its registered office at J.P. Morgan Tower, Off. C.S.T. Road, Kalina, Santacruz East, Mumbai - 400098, is a member of the National Stock Exchange of India Limited (SEBI Registration Number - INB 230675231/INF 230675231/INE 230675231) and Bombay Stock Exchange Limited (SEBI Registration Number - INB010675237/INB010675237) and is regulated by Securities and Exchange Board of India. Thailand: JPMorgan Securities (Thailand) Limited is a member of the Stock Exchange of Thailand and is regulated by the Ministry of Finance and the Securities and Exchange Commission. Indonesia: PT J.P. Morgan Securities Indonesia is a member of the Indonesia Stock Exchange and is regulated by the BAPEPAM LK. Philippines: J.P. Morgan Securities Philippines Inc. is a member of the Philippine Stock Exchange and is regulated by the Securities and Exchange Commission. Brazil: Banco J.P. Morgan S.A. is regulated by the Comissao de Valores Mobiliarios (CVM) and by the Central Bank of Brazil. Mexico: J.P. Morgan Casa de Bolsa, S.A. de C.V., J.P. Morgan Grupo Financiero is a member of the Mexican Stock Exchange and authorized to act as a broker dealer by the National Banking and Securities Exchange Commission. Singapore: This material is issued and distributed in Singapore by J.P. Morgan Securities Singapore Private Limited (JPMSS) [MICA (P) 025/01/2011 and Co. Reg. No.: 199405335R] which is a member of the Singapore Exchange Securities Trading Limited and is regulated by the Monetary Authority of Singapore (MAS) and/or JPMorgan Chase Bank, N.A., Singapore branch (JPMCB Singapore) which is regulated by the MAS. Malaysia: This material is issued and distributed in Malaysia by JPMorgan Securities (Malaysia) Sdn Bhd (18146-X) which is a Participating Organization of Bursa Malaysia Berhad and a holder of Capital Markets Services License issued by the Securities Commission in Malaysia. Pakistan: J. P. Morgan Pakistan Broking (Pvt.) Ltd is a member of the Karachi Stock Exchange and regulated by the Securities and Exchange Commission of Pakistan.

37
Asia Pacific Equity Research 24 May 2011
Sunil Garg (852) 2800-8518 [email protected]
Saudi Arabia: J.P. Morgan Saudi Arabia Ltd. is authorized by the Capital Market Authority of the Kingdom of Saudi Arabia (CMA) to carry out dealing as an agent, arranging, advising and custody, with respect to securities business under licence number 35-07079 and its registered address is at 8th Floor, Al-Faisaliyah Tower, King Fahad Road, P.O. Box 51907, Riyadh 11553, Kingdom of Saudi Arabia. Dubai: JPMorgan Chase Bank, N.A., Dubai Branch is regulated by the Dubai Financial Services Authority (DFSA) and its registered address is Dubai International Financial Centre - Building 3, Level 7, PO Box 506551, Dubai, UAE.
Country and Region Specific Disclosures U.K. and European Economic Area (EEA): Unless specified to the contrary, issued and approved for distribution in the U.K. and the EEA by JPMSL. Investment research issued by JPMSL has been prepared in accordance with JPMSL's policies for managing conflicts of interest arising as a result of publication and distribution of investment research. Many European regulators require a firm to establish, implement and maintain such a policy. This report has been issued in the U.K. only to persons of a kind described in Article 19 (5), 38, 47 and 49 of the Financial Services and Markets Act 2000 (Financial Promotion) Order 2005 (all such persons being referred to as "relevant persons"). This document must not be acted on or relied on by persons who are not relevant persons. Any investment or investment activity to which this document relates is only available to relevant persons and will be engaged in only with relevant persons. In other EEA countries, the report has been issued to persons regarded as professional investors (or equivalent) in their home jurisdiction. Australia: This material is issued and distributed by JPMSAL in Australia to “wholesale clients” only. JPMSAL does not issue or distribute this material to “retail clients.” The recipient of this material must not distribute it to any third party or outside Australia without the prior written consent of JPMSAL. For the purposes of this paragraph the terms “wholesale client” and “retail client” have the meanings given to them in section 761G of the Corporations Act 2001. Germany: This material is distributed in Germany by J.P. Morgan Securities Ltd., Frankfurt Branch and J.P.Morgan Chase Bank, N.A., Frankfurt Branch which are regulated by the Bundesanstalt für Finanzdienstleistungsaufsicht. Hong Kong: The 1% ownership disclosure as of the previous month end satisfies the requirements under Paragraph 16.5(a) of the Hong Kong Code of Conduct for Persons Licensed by or Registered with the Securities and Futures Commission. (For research published within the first ten days of the month, the disclosure may be based on the month end data from two months’ prior.) J.P. Morgan Broking (Hong Kong) Limited is the liquidity provider/market maker for derivative warrants, callable bull bear contracts and stock options listed on the Stock Exchange of Hong Kong Limited. An updated list can be found on HKEx website: http://www.hkex.com.hk. Japan: There is a risk that a loss may occur due to a change in the price of the shares in the case of share trading, and that a loss may occur due to the exchange rate in the case of foreign share trading. In the case of share trading, JPMorgan Securities Japan Co., Ltd., will be receiving a brokerage fee and consumption tax (shouhizei) calculated by multiplying the executed price by the commission rate which was individually agreed between JPMorgan Securities Japan Co., Ltd., and the customer in advance. Financial Instruments Firms: JPMorgan Securities Japan Co., Ltd., Kanto Local Finance Bureau (kinsho) No. 82 Participating Association / Japan Securities Dealers Association, The Financial Futures Association of Japan. Korea: This report may have been edited or contributed to from time to time by affiliates of J.P. Morgan Securities (Far East) Ltd, Seoul Branch. Singapore: JPMSS and/or its affiliates may have a holding in any of the securities discussed in this report; for securities where the holding is 1% or greater, the specific holding is disclosed in the Important Disclosures section above. India: For private circulation only, not for sale. Pakistan: For private circulation only, not for sale. New Zealand: This material is issued and distributed by JPMSAL in New Zealand only to persons whose principal business is the investment of money or who, in the course of and for the purposes of their business, habitually invest money. JPMSAL does not issue or distribute this material to members of "the public" as determined in accordance with section 3 of the Securities Act 1978. The recipient of this material must not distribute it to any third party or outside New Zealand without the prior written consent of JPMSAL. Canada: The information contained herein is not, and under no circumstances is to be construed as, a prospectus, an advertisement, a public offering, an offer to sell securities described herein, or solicitation of an offer to buy securities described herein, in Canada or any province or territory thereof. Any offer or sale of the securities described herein in Canada will be made only under an exemption from the requirements to file a prospectus with the relevant Canadian securities regulators and only by a dealer properly registered under applicable securities laws or, alternatively, pursuant to an exemption from the dealer registration requirement in the relevant province or territory of Canada in which such offer or sale is made. The information contained herein is under no circumstances to be construed as investment advice in any province or territory of Canada and is not tailored to the needs of the recipient. To the extent that the information contained herein references securities of an issuer incorporated, formed or created under the laws of Canada or a province or territory of Canada, any trades in such securities must be conducted through a dealer registered in Canada. No securities commission or similar regulatory authority in Canada has reviewed or in any way passed judgment upon these materials, the information contained herein or the merits of the securities described herein, and any representation to the contrary is an offence. Dubai: This report has been issued to persons regarded as professional clients as defined under the DFSA rules.
General: Additional information is available upon request. Information has been obtained from sources believed to be reliable but JPMorgan Chase & Co. or its affiliates and/or subsidiaries (collectively J.P. Morgan) do not warrant its completeness or accuracy except with respect to any disclosures relative to JPMS and/or its affiliates and the analyst’s involvement with the issuer that is the subject of the research. All pricing is as of the close of market for the securities discussed, unless otherwise stated. Opinions and estimates constitute our judgment as of the date of this material and are subject to change without notice. Past performance is not indicative of future results. This material is not intended as an offer or solicitation for the purchase or sale of any financial instrument. The opinions and recommendations herein do not take into account individual client circumstances, objectives, or needs and are not intended as recommendations of particular securities, financial instruments or strategies to particular clients. The recipient of this report must make its own independent decisions regarding any securities or financial instruments mentioned herein. JPMS distributes in the U.S. research published by non-U.S. affiliates and accepts responsibility for its contents. Periodic updates may be provided on companies/industries based on company specific developments or announcements, market conditions or any other publicly available information. Clients should contact analysts and execute transactions through a J.P. Morgan subsidiary or affiliate in their home jurisdiction unless governing law permits otherwise.
“Other Disclosures” last revised January 8, 2011.

38
Asia Pacific Equity Research 24 May 2011
Sunil Garg (852) 2800-8518 [email protected]
Copyright 2011 JPMorgan Chase & Co. All rights reserved. This report or any portion hereof may not be reprinted, sold or redistributed without the written consent of J.P. Morgan.#$J&098$#*P