Embed Size (px)
Citation preview
Super-resolution fluorescence imaging of organellesin live cells with photoswitchable membrane probesSang-Hee Shima,1, Chenglong Xiab,1, Guisheng Zhonga,c, Hazen P. Babcocka,d, Joshua C. Vaughana,c, Bo Huanga,2,Xun Wangb, Cheng Xub, Guo-Qiang Bib,3, and Xiaowei Zhuanga,c,d,e,3
aDepartment of Chemistry and Chemical Biology, cHoward Hughes Medical Institute, dCenter for Brain Science, and eDepartment of Physics, HarvardUniversity, Cambridge, MA 02138; and bHefei National Laboratory for Physical Sciences at the Microscale and School of Life Sciences, University ofScience and Technology of China, Hefei, Anhui 230026, China
Edited by Stefan W. Hell, Max Planck Institute for Biophys. Chemistry, Goettingen, Germany, and accepted by the Editorial Board July 7, 2012 (received forreview February 1, 2012)
Imaging membranes in live cells with nanometer-scale resolutionpromises to reveal ultrastructural dynamics of organelles thatare essential for cellular functions. In this work, we identifiedphotoswitchable membrane probes and obtained super-resolutionfluorescence images of cellular membranes. We demonstrated thephotoswitching capabilities of eight commonly used membraneprobes, each specific to the plasma membrane, mitochondria, theendoplasmic recticulum (ER) or lysosomes. These small-moleculeprobes readily label live cells with high probe densities. Using theseprobes, we achieved dynamic imaging of specific membrane struc-tures in living cells with 30–60 nm spatial resolution at temporalresolutions down to 1–2 s. Moreover, by using spectrally distin-guishable probes, we obtained two-color super-resolution imagesof mitochondria and the ER. We observed previously obscureddetails of morphological dynamics of mitochondrial fusion/fissionand ER remodeling, aswell as heterogeneousmembrane diffusivityon neuronal processes.
nanoscopy ∣ diffraction limit ∣ photoswitchable dye ∣ stochastic opticalreconstruction microscopy ∣ photoactivation localization microscopy
Membrane structures, such as the plasma membrane,endosomes, lysosomes, mitochondria, the Golgi, and the
endoplasmic recticulum (ER), perform a variety of functions ineukaryotic cells. To accommodate these functions, cellular mem-branes fold into various shapes, often with highly curved morp-hologies and nanometer-scale dimensions (1, 2). Examplesinclude the filopodia protruding from the plasma membrane, thecristae of mitochondria, the cisternae of the Golgi, and the mesh-work of the ER (1, 2). These intricate membrane structures oftenundergo rapid remodeling. Filopodia extend from and retractinto the cell via cytoskeletal assembly and disassembly (1). ERtubules are pulled out of membrane sheets by molecular motors orpolymerizing cytoskeletal filaments (2). Mitochondria constantlyfuse and divide while moving along microtubules (3). Such dy-namic processes play essential roles for maintaining the morphol-ogy and functions of these subcellular structures and organelles.
Ultrastructural characterization of membrane organelles hasmainly relied on electron microscopy (EM), which provides bothmembrane contrast and nanometer-scale resolution. However,EM cannot be used to image live specimens and hence does notprovide dynamic information directly. This difficulty may be over-come by the recently developed super-resolution fluorescencemicroscopy methods (4–7). Among these methods, stochastic op-tical reconstruction microscopy (STORM) (8) and (fluorescence)photoactivation localization microscopy [(F)PALM] (9, 10) takeadvantage of the use of photoswitchable probes and high-precision localization of single molecules to surpass the diffrac-tion limit. During the imaging process, only a sparse subset of theprobes are switched on at any time such that their positionscan be determined with high precision by finding the centroids oftheir images. After the coordinates of a sufficient number ofprobe molecules are accumulated, a super-resolution image can
be constructed from these molecular coordinates. It has beenfurther demonstrated that many conventional dyes can be usedfor super-resolution imaging based on photoswitching/bleachingand localization of single molecules (11–20). Using single-mole-cule-based super-resolution methods, 3D resolutions down toapproximately 10 nm have been demonstrated for fixed samples(21–26), and live-cell imaging has also been achieved with spatialresolutions of 20–60 nm at time resolutions ranging from 0.5 sto 1 min (27–32).
To date, super-resolution imaging has been demonstratedmostly on protein-based fluorescent labels such as proteinstagged with dyes or genetically encoded fluorescent proteins.However, membrane proteins are often not distributed uniformlyon the membrane, but instead form localized domains nonidealfor general membrane imaging. Moreover, since probe densityis a key determinant of the image resolution (27, 31), proteinlabels need to be expressed at high levels to achieve high resolu-tions, which can cause overexpression artifacts. An alternativeto protein labels is small-molecule probes that directly bind tomembrane structures, which have been widely used for specificlabeling of membrane organelles (33). The cell permeability,small size, and high affinity of these probes for specific membraneorganelles facilitate high-density labeling of live cells. Moreover,these small-molecule probes are commercially available and easyto use. However, it is unknown whether these probes are photo-switchable and suitable for super-resolution imaging.
In this work, we demonstrate super-resolution fluorescenceimaging of membranes in live cells by using photoswitchablemembrane probes. We identified the photoswitching capabilitiesof eight small-molecule probes, commonly used for labeling theplasma membrane, mitochondria, the ER, or lysosomes. Usingthese probes, we achieved 30–60 nm spatial resolution with tem-poral resolution down to 1–2 sec, and tens of independent snap-shots when imaging live cells. The different spectral properties ofthese probes also allowed two-color super-resolution imaging ofmitochondria and the ER. Utilizing these imaging capabilities,we captured ultrastructural dynamics of the plasma membrane,mitochondria, and the ER.
Author contributions: S.-H.S., J.C.V., B.H., G.-Q.B., and X.Z. designed research; S.-H.S. andC. Xia performed research; S.-H.S., C. Xia, G.Z., H.P.B., B.H., X.W., and C. Xu contributednew reagents/analytic tools; S.-H.S. and C. Xia analyzed data; and S.-H.S., G.-Q.B., andX.Z. wrote the paper.
The authors declare no conflict of interest.
This article is a PNAS Direct Submission. S.W.H. is a guest editor invited by the EditorialBoard.
Freely available online through the PNAS open access option.1S.-H.S. and C. Xia contributed equally to this work.2Present address: Department of Pharmaceutical Chemistry, University of California,San Francisco, CA 94158.
3To whom correspondence may be addressed. Email: [email protected] or [email protected].
This article contains supporting information online at www.pnas.org/lookup/suppl/doi:10.1073/pnas.1201882109/-/DCSupplemental.
13978–13983 ∣ PNAS ∣ August 28, 2012 ∣ vol. 109 ∣ no. 35 www.pnas.org/cgi/doi/10.1073/pnas.1201882109

ResultsImaging the Plasma Membrane with Lipophilic Cyanine Dyes. Carbo-cyanine dyes with long alkyl chains such as DiI, DiD, and DiRhave been widely used as labels for the plasma membrane (seeFig. S1A for chemical structures). Due to their lipophilic nature,incubating live cells with dye solutions for a few minutes issufficient to label the plasma membrane with high probe density(33). Interestingly, we found that DiI, DiD, and DiR exhibitedphotoswitching behaviors without an exogenous switching agent.Under 561-nm (for DiI), 657-nm (for DiD), or 752-nm (for DiR)illumination, these probes fluoresced and rapidly switched offto a dark state; the dark-state molecules could then be reactivatedto the fluorescent state by 405-nm illumination (Fig. 1A). Similarlaser excitation schemes have been used for switching other dyes(13, 17). This reversible photoswitching behavior were suitablefor STORM imaging of the plasma membrane (Fig. 2A andFig. S2 A and B).
We performed STORM imaging of the plasma membrane onlive hippocampal neurons using DiI (Fig. 2A). DiI-labeled neu-rons were imaged with 561-nm illumination at a 500-Hz cameraframe rate. A roughly constant number of activated DiI mole-cules per camera frame were maintained with ramping 405-nmillumination. The fast switching rates of DiI allowed us to collecta super-resolution image in 15 sec or less. Compared to the rawand deconvolved conventional images, substantial resolutionimprovement was observed in the STORM image (Fig. 2A andFig. S3A). The enhanced resolution allowed us to measure thewidths of the dendritic spine necks in live neurons (Fig. 2A).
During STORM imaging, individual DiI molecules wereswitched off in approximately two camera frames, emitting 720photons per frame on average. By measuring the spread of thelocalization distributions of individual fixable DiI molecules infixed cells, we determined the localization precision to be 17 nm,measured in SD, corresponding to an image resolution of 40 nmmeasured in full width at half maximum (Table S1). Another keyfactor affecting the final image resolution is the label or localiza-tion density within the structure. Because DiI molecules diffuseon the plasma membrane in live cells, a single probe molecule is
able to sample different locations on the membrane and contri-bute multiple independent localizations for mapping out theunderlying structure. Based on the Nyquist sampling criterion,which equates the resolution limit to twice the average distancebetween neighboring localizations, a Nyquist resolution limit canbe defined as 2∕ðlocalization densityÞ1∕2 for 2D images (27). Forthe live neuron images, we found the Nyquist resolution limit tobe approximately 40 nm for the 15-sec STORM snapshots (eightindependent snapshots) and approximately 70 nm for 5-sec snap-shots (24 independent snapshots).
Time-resolved STORM images of DiI captured extension andretraction of filopodia or dendritic spines (Fig. 3A). In addition tothe morphological dynamics of the plasma membrane, molecularmotion within the membrane can also be monitored by trackingindividual probe molecules. The use of photoswitchable probesallows a high density of molecular trajectories to be accumulatedover time (34). In Fig. 3B, we present a subset of the DiI trajec-tories that lasted for 15 frames or more, from which we calculatedthe local diffusion coefficients (See Fig. S4 for the full distribu-tion of the trace length). Diffusion of DiI was slower in thin den-dritic structures such as filopodia or spines, in comparison to themobility measured in the shaft (Fig. 3C), consistent with previousresults (35). Moreover, the high density of molecular tracesallowed us to determine the local distribution of diffusivity withinfilopodia or spines (Fig. 3D). The mobility of DiI decreased asthe molecules approached the tips of filopodia or spines (Fig. 3E),
Weak561 nm
Strong561 nm
405 nm
Weak561 nm
1x 1x
1x 1x
6x 6x
6x 6x
1x 1x 1x 1x
A B C D
Fig. 1. Photoswitching behavior of small-molecule probes for four mem-brane structures in live cells. BS-C-1 cells were labeled with (A) DiI for theplasma membrane, (B) MitoTracker Red for mitochondria, (C) ER-TrackerRed for the ER, (D) LysoTracker Red for lysosomes. Top row: Images takenwith weak 561-nm illumination to excite fluorescence from these probeswithout switching them off appreciably. Middle row: Images taken afterstrong 561-nm illumination (approximately 10 kW∕cm2), which turned theprobes off efficiently. Bottom row: Images taken with weak 561-nm lightafter 405-nm light was used to turn the probes on again. Image contrastsin the middle and bottom rows were either the same as the images in thetop row or increased by 6 times, as indicated. The incomplete recovery ofER- and LysoTrackers immediately after switching-off did not substantiallydegrade the STORM images due to the high labeling density. The recovery ofER- and LysoTrackers slowly increased and reached about 100% after 15 minof 405-nm illumination. Scale bars, 1 μm.
A
B
C
D
Fig. 2. STORM images of four membrane organelles/structures in live cells.Conventional (i) and STORM (ii) images of (A) the plasma membrane labeledwith DiI in a hippocampal neuron, (B) mitochondria labeled with MitoTrackerRed in a BS-C-1 cell, (C) the ER labeled with ER-Tracker Red in a BS-C-1 cell,and (D) lysosomes labeled with LysoTracker Red in a BS-C-1 cell. The conven-tional fluorescence images were taken immediately before STORM imagingwith a low excitation intensity to avoid switching off the dyes appreciably.The STORM images were acquired in 15 sec (A), 10 sec (B and C) and 1 sec (D).Arrowheads in A indicate spine necks along with their measured widths.Scale bars, 1 μm.
Shim et al. PNAS ∣ August 28, 2012 ∣ vol. 109 ∣ no. 35 ∣ 13979
BIOPH
YSICSAND
COMPU
TATIONALBIOLO
GY

possibly due to the higher local membrane curvature (36) and thedifferent composition of membrane proteins at these locations.
Imaging Mitochondria with Cationic Rosamine and CarbocyanineFluorophores. Mitochondria consist of two layers of membranes:the outer membrane forms a smooth tubular outline of the orga-nelle; the inner membrane forms deeply invaginated tubules andlamellae called cristae. Many mitochondrial probes are cell-per-meant cations that accumulate on the inner membrane of mito-chondria via electrostatic interactions (33). We identified threephotoswitchable mitochondrial probes that can be classified intotwo groups: (i) MitoTracker Orange and MitoTracker Red arecationic rosamine dyes; (ii) MitoTracker Deep Red is a cationiccarbocyanine (Fig. S1B). Similar to DiI, cells could be labeledwith these probes simply by incubating with dye solutions for afew minutes. They could be excited to fluoresce and turned offby 561-nm (for MitoTracker Orange/Red) or 657-nm (for Mito-Tracker Deep Red) illumination, and reactivated by 405-nm illu-mination (Fig. 1B). All three dyes could be used for STORMimaging of mitochondria (Fig. 2B and Fig. S2 C and D).
We obtained STORM images of mitochondria in live BS-C-1cells using MitoTracker Red with a procedure similar to that usedin DiI imaging at a 500-Hz frame rate (Fig. 2B). Per imagingframe, each dye molecule emitted on average 790 photons andwas localized with 13-nm localization precision, correspondingto 30-nm resolution (Table S1). Images acquired in 10 sec exhib-ited localization densities that correspond to a Nyquist resolutionlimit of approximately 30 nm with <15% variation among differ-ent cells and experiments. Such resolutions could be achievedfor up to 30 independent snapshots per movie. Compared to theraw and deconvolved conventional images, the STORM imagesshowed substantially improved resolution (Fig. 2B and Fig. S3B).
Because mitochondria tend to move fast in cells, we furtherimproved the time resolution by increasing the camera frame rateto 900 Hz and by activating a higher density of probes per framesuch that their images partially overlap. We analyzed the overlap-ping images of individual molecules by a multiemitter fittingalgorithm (37). Under these imaging conditions, we obtained aNyquist-based resolution of approximately 40 nm in 2 sec. Theimproved temporal resolution allowed us to capture mitochon-drial fission and fusion intermediates (Fig. 4).
Time-lapse STORM images revealed thin, extended tubularintermediates connecting neighboring mitochondria both priorto fission and after fusion (Fig. 4A and Movie S1). The averagewidth of these tubular structures was 104� 15 nm (SD, N ¼ 35)(Fig. 4B). Notably, such tubules tend to have uniform widths overan extended length of several hundred nanometers. Multiplefission and fusion events (Fig. 4C) were captured in the movie.
The tubular intermediates for the fusion and fission eventshad similar widths [Fig. 4B, 102� 16 nm (SD, N ¼ 24) priorto fission; 108� 12 nm (SD, N ¼ 11) after fusion]. These thintubular structures could persist for more than 10 sec. While
C E
A 0 s 10 s 20 s
D
D (
µm2 /
s)
Distance from the tip (µm)
D (µ
m2 /
s)D (µ m
2/s)
0
1
2
Spineorlopodia
Shaft
B6
4
2
0
0.8
0.6
0.4
0.2
0.00 1 2 3
Fig. 3. Plasma membrane dynamics in dendrites of a live hippocampal neuron at 37 °C. (A) Morphological changes of dendritic structures captured by a seriesof 10-sec STORM snapshots. Green arrowhead: A growing spine or filopodium. Blue arrowhead: An extending filopodium. Purple arrowhead: A retractingfilopodium. (B–E) High-density single-particle-tracking of DiI. (B) Molecular trajectories lasting at least 15 camera frames (2 ms per frame) colored by theirdiffusion coefficients, D, according to the color map on the Right. (C) Diffusion coefficients in different dendritic structures. Error bars indicate standard errors:N ¼ 613 traces for shaft; N ¼ 90 traces for spine/filopodia. (D) A zoom-in of the boxed region in B. (E) Local distribution of diffusion coefficients within thefilopodium in the dashed box in D. Error bars indicate standard errors (N ¼ 7–18). Scale bars, 1 μm.
60 80 100 12014002468
10
Width (nm)
Cou
nt
FissionFusion
AllA
C
B
Fig. 4. Mitochondrial dynamics in a live BS-C-1 cell. (A) A 6-sec STORM snap-shot shows thin tubes connecting neighboring mitochondria (indicated byyellow arrowheads). (B) Width distribution of inter-mitochondria tubulestaken from multiple cells. Black bars: All tubules. Green bars: Tubules priorto fission. Red bars: Tubules after fusion. (C) Fission (green arrowheads) andfusion (red arrowheads) events captured by a time-series of 2-sec STORMsnapshots (i) and corresponding conventional images (ii). While the imageswere acquired continuously (Movie S1), only every other 2-sec snapshot is dis-played here to save space. Scale bars, 500 nm.
13980 ∣ www.pnas.org/cgi/doi/10.1073/pnas.1201882109 Shim et al.

fission and fusion events could also be observed in the conven-tional fluorescence movies, the tubular intermediates were notclearly resolved in the diffraction-limited images (Fig. 4C, ii).
Given the extended length of the tubular intermediate witha relatively constant width, such membrane tube is likely con-stricted by a protein tubular structure. A potential candidate pro-tein is Drp1, a dynamin-family protein required for mitochondrialdivision in mammalian cells (3, 38). Indeed, in the in vitro assem-blies of liposome and Dnm1, the Drp1-homolog in yeast, Dnm1was found to assemble outside membrane tubes and constrict themto a lumenal diameter of approximately 90 nm (39), similar to thewidths of the fusion and fission intermediates measured here.
Imaging the ER and Lysosomes with BODIPY Dye-Conjugates. BOD-IPY dyes are neutral and nonpolar. Therefore, BODIPY conju-gates tend to be more cell permeant than charged or polar dyes,and are often used to label intracellular structures (33). We testedtwo BODIPY-conjugated probes: (i) ER-Tracker Red, a BODIPYTR conjugate of glibenclamide which binds to potassium chan-nels enriched in the ER; (ii) LysoTracker Red, a BODIPY 564/570 linked to a weak base that is highly selective for the acidicmembrane of lysosomes (Fig. S1 C and D) (33). Again, labelingprocedures for these probes are similar to that of DiI. We foundboth BODIPY TR and BODIPY 564/570 to photoswitch in livecells; they could be imaged and switched off by 561-nm illumina-tion and reactivated by 405-nm light (Fig. 1 C and D).
STORM imaging of the ER and lysosomes were conductedusing a procedure similar to that used for DiI or MitoTrackerRed (Fig. 2 C and D). At a 500-Hz frame rate, ER-Tracker Redand LysoTracker Red emitted an average of 820 photons perframe, providing a localization precision of 13–15 nm, corre-sponding to a resolution of 30–35 nm (Table S1). We obtainedSTORM images within 10 sec for the ER and 1 sec for lysosomeswith localization densities that correspond to a Nyquist resolutionlimit of 30–40 nm for 30–80 snapshots. STORM images of the ERshowed an intricate meshwork of tubules and sheets (Fig. 2C).While these structures were largely resolvable in conventionalimages, the width of the ER tubules were often below the diffrac-tion limit, but could be determined from STORM images(Fig. 2C). Likewise, lysosomes were often resolvable from eachother in conventional images, but their sizes and shapes were bet-ter determined in STORM images (Fig. 2D).
Dynamics of ER-remodeling were observed using ER-TrackerRed (Fig. 5). In a time-series of 10-sec snapshots (Fig. 5Aand Movie S2), we observed extending ER tubules (Fig. 5A).When multiple snapshots were collapsed into a single image witheach localization colored by the time of appearance (Fig. 5B),
extending tubules could be easily identified by color. The newlyextended tubules appeared thinner than older tubules (Fig. 5C);the average widths were 84� 15 nm (SD, N ¼ 22) for the newlyextended tubes and 127� 32 nm (SD, N ¼ 34) for tubules thatexisted for at least 2 min. When we increased the dye activationrate as in the case of mitochondrial imaging, we were able to in-crease the imaging speed to 2 sec per image without compromis-ing the spatial resolution (Fig. 5 D and E and Movie S3).
Two-Color Imaging of Mitochondria and the ER. The different spec-tral properties of the probes described above allow for multicolorimaging. For instance, the emission maxima of MitoTracker Redand ER-Tracker Red differ by 16 nm. They can be distinguishedusing a ratiometric method by splitting their emission into a short-and a long-wavelength channel; the probe identity can then bedetermined from the intensity ratio of these two channels (30,32, 40).
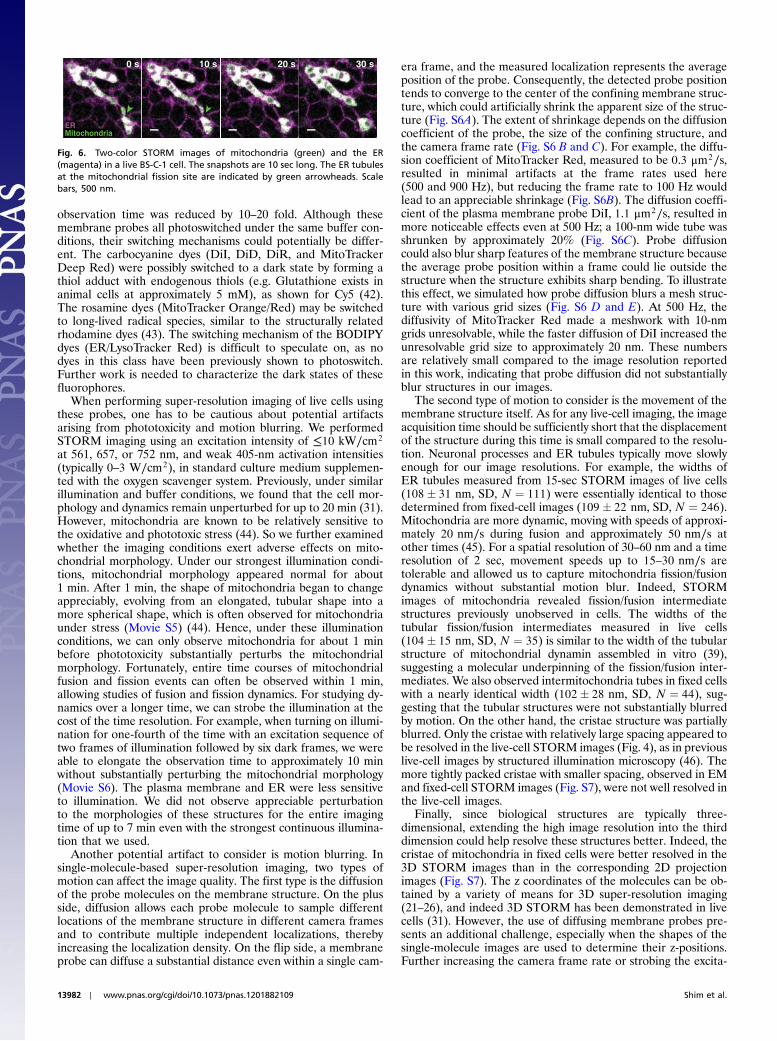
Using this approach, we obtained two-color STORM imagesof mitochondria and the ER in live cells (Fig. 6 and Movie S4).Although we achieved a comparable Nyquist resolution (25–35 nm) to that of the single-color images, the image quality wassomewhat degraded from single-color images due to the colorcross-talk (16% from ER to mitochondria, 28% from mitochon-dria to ER with the color assignment defined in Fig. S5).
Correlative dynamics of the two structures were observed fromthese images. ER tubules were often present at the sites ofmitochondrial contraction and fission (Fig. 6), suggesting that ERtubules are involved in constriction of mitochondria. This obser-vation is consistent with the previous hypothesis that ER-inducedmitochondrial constriction facilitates the recruitment of Drp1 atthe mitochondrial fission site (41).
DiscussionCell membranes often exhibit nanometer-scale morphologies andundergo dynamic remodeling. Super-resolution fluorescenceimaging can reveal previously unknown ultrastructural dynamicsof these structures. Here, we identified several photoswitchable,small-molecule membrane probes and demonstrated their utilityin super-resolution STORM imaging of the plasma membrane,mitochondria, the ER, and lysosomes in living cells. The imagesrevealed nanometer-scale morphological dynamics of neuronalprocesses, mitochondria, and the ER, as well as nonuniformmembrane diffusivity in neurons.
STORM imaging of these probes was performed in bufferedmedium supplemented with an oxygen scavenger system, but noexogenous chemical additives such as thiol reagents was added.Without the oxygen scavenger, the probes photoswitched simi-larly but bleached substantially faster, and therefore the overall
D E
246810
0
Tim
e (s)
20
10
30
40
50
0
Tim
e (s)
Cou
nt
0 s0 s 4 s4 s2 s2 s 6 s6 s 8 s8 s
C0 s0 s0 s 10 s10 s10 s 20 s20 s20 s 30 s30 s30 s 40 s40 s40 sA B
Width (nm)
0 s 4 s2 s 6 s 8 s
NewOld (>2min)
40 80 120 160 2000
4
8
12
16
Fig. 5. ER dynamics in live BS-C-1 cells. (A) A time-series of 10-sec STORM snapshots. Blue arrowheads: Tips of extending tubules. (B) A composite imagecontaining all snapshots in A with each localization colored by its time of appearance according to the color map on the Right. (C) Distribution of the widthsof ER tubules. Green bars: Newly extended tubules. Red bars: Old tubules that had already existed for at least 2min. (D) A time-series of 2-sec STORM snapshots.Blue arrowheads: Extending tubules. Purple arrowheads: Retracting tubules. Yellow arrowheads: Extending sheets. (E) A composite image containing allsnapshots in D with each localization colored by the time of its appearance. Scale bars, 500 nm.
Shim et al. PNAS ∣ August 28, 2012 ∣ vol. 109 ∣ no. 35 ∣ 13981
BIOPH
YSICSAND
COMPU
TATIONALBIOLO
GY
observation time was reduced by 10–20 fold. Although thesemembrane probes all photoswitched under the same buffer con-ditions, their switching mechanisms could potentially be differ-ent. The carbocyanine dyes (DiI, DiD, DiR, and MitoTrackerDeep Red) were possibly switched to a dark state by forming athiol adduct with endogenous thiols (e.g. Glutathione exists inanimal cells at approximately 5 mM), as shown for Cy5 (42).The rosamine dyes (MitoTracker Orange/Red) may be switchedto long-lived radical species, similar to the structurally relatedrhodamine dyes (43). The switching mechanism of the BODIPYdyes (ER/LysoTracker Red) is difficult to speculate on, as nodyes in this class have been previously shown to photoswitch.Further work is needed to characterize the dark states of thesefluorophores.
When performing super-resolution imaging of live cells usingthese probes, one has to be cautious about potential artifactsarising from phototoxicity and motion blurring. We performedSTORM imaging using an excitation intensity of ≤10 kW∕cm2
at 561, 657, or 752 nm, and weak 405-nm activation intensities(typically 0–3 W∕cm2), in standard culture medium supplemen-ted with the oxygen scavenger system. Previously, under similarillumination and buffer conditions, we found that the cell mor-phology and dynamics remain unperturbed for up to 20 min (31).However, mitochondria are known to be relatively sensitive tothe oxidative and phototoxic stress (44). So we further examinedwhether the imaging conditions exert adverse effects on mito-chondrial morphology. Under our strongest illumination condi-tions, mitochondrial morphology appeared normal for about1 min. After 1 min, the shape of mitochondria began to changeappreciably, evolving from an elongated, tubular shape into amore spherical shape, which is often observed for mitochondriaunder stress (Movie S5) (44). Hence, under these illuminationconditions, we can only observe mitochondria for about 1 minbefore phototoxicity substantially perturbs the mitochondrialmorphology. Fortunately, entire time courses of mitochondrialfusion and fission events can often be observed within 1 min,allowing studies of fusion and fission dynamics. For studying dy-namics over a longer time, we can strobe the illumination at thecost of the time resolution. For example, when turning on illumi-nation for one-fourth of the time with an excitation sequence oftwo frames of illumination followed by six dark frames, we wereable to elongate the observation time to approximately 10 minwithout substantially perturbing the mitochondrial morphology(Movie S6). The plasma membrane and ER were less sensitiveto illumination. We did not observe appreciable perturbationto the morphologies of these structures for the entire imagingtime of up to 7 min even with the strongest continuous illumina-tion that we used.
Another potential artifact to consider is motion blurring. Insingle-molecule-based super-resolution imaging, two types ofmotion can affect the image quality. The first type is the diffusionof the probe molecules on the membrane structure. On the plusside, diffusion allows each probe molecule to sample differentlocations of the membrane structure in different camera framesand to contribute multiple independent localizations, therebyincreasing the localization density. On the flip side, a membraneprobe can diffuse a substantial distance even within a single cam-
era frame, and the measured localization represents the averageposition of the probe. Consequently, the detected probe positiontends to converge to the center of the confining membrane struc-ture, which could artificially shrink the apparent size of the struc-ture (Fig. S6A). The extent of shrinkage depends on the diffusioncoefficient of the probe, the size of the confining structure, andthe camera frame rate (Fig. S6 B and C). For example, the diffu-sion coefficient of MitoTracker Red, measured to be 0.3 μm2∕s,resulted in minimal artifacts at the frame rates used here(500 and 900 Hz), but reducing the frame rate to 100 Hz wouldlead to an appreciable shrinkage (Fig. S6B). The diffusion coeffi-cient of the plasma membrane probe DiI, 1.1 μm2∕s, resulted inmore noticeable effects even at 500 Hz; a 100-nm wide tube wasshrunken by approximately 20% (Fig. S6C). Probe diffusioncould also blur sharp features of the membrane structure becausethe average probe position within a frame could lie outside thestructure when the structure exhibits sharp bending. To illustratethis effect, we simulated how probe diffusion blurs a mesh struc-ture with various grid sizes (Fig. S6 D and E). At 500 Hz, thediffusivity of MitoTracker Red made a meshwork with 10-nmgrids unresolvable, while the faster diffusion of DiI increased theunresolvable grid size to approximately 20 nm. These numbersare relatively small compared to the image resolution reportedin this work, indicating that probe diffusion did not substantiallyblur structures in our images.
The second type of motion to consider is the movement of themembrane structure itself. As for any live-cell imaging, the imageacquisition time should be sufficiently short that the displacementof the structure during this time is small compared to the resolu-tion. Neuronal processes and ER tubules typically move slowlyenough for our image resolutions. For example, the widths ofER tubules measured from 15-sec STORM images of live cells(108� 31 nm, SD, N ¼ 111) were essentially identical to thosedetermined from fixed-cell images (109� 22 nm, SD, N ¼ 246).Mitochondria are more dynamic, moving with speeds of approxi-mately 20 nm∕s during fusion and approximately 50 nm∕s atother times (45). For a spatial resolution of 30–60 nm and a timeresolution of 2 sec, movement speeds up to 15–30 nm∕s aretolerable and allowed us to capture mitochondria fission/fusiondynamics without substantial motion blur. Indeed, STORMimages of mitochondria revealed fission/fusion intermediatestructures previously unobserved in cells. The widths of thetubular fission/fusion intermediates measured in live cells(104� 15 nm, SD, N ¼ 35) is similar to the width of the tubularstructure of mitochondrial dynamin assembled in vitro (39),suggesting a molecular underpinning of the fission/fusion inter-mediates. We also observed intermitochondria tubes in fixed cellswith a nearly identical width (102� 28 nm, SD, N ¼ 44), sug-gesting that the tubular structures were not substantially blurredby motion. On the other hand, the cristae structure was partiallyblurred. Only the cristae with relatively large spacing appeared tobe resolved in the live-cell STORM images (Fig. 4), as in previouslive-cell images by structured illumination microscopy (46). Themore tightly packed cristae with smaller spacing, observed in EMand fixed-cell STORM images (Fig. S7), were not well resolved inthe live-cell images.
Finally, since biological structures are typically three-dimensional, extending the high image resolution into the thirddimension could help resolve these structures better. Indeed, thecristae of mitochondria in fixed cells were better resolved in the3D STORM images than in the corresponding 2D projectionimages (Fig. S7). The z coordinates of the molecules can be ob-tained by a variety of means for 3D super-resolution imaging(21–26), and indeed 3D STORM has been demonstrated in livecells (31). However, the use of diffusing membrane probes pre-sents an additional challenge, especially when the shapes of thesingle-molecule images are used to determine their z-positions.Further increasing the camera frame rate or strobing the excita-
0 s 10 s 20 s 30 s
ERMitochondria
Fig. 6. Two-color STORM images of mitochondria (green) and the ER(magenta) in a live BS-C-1 cell. The snapshots are 10 sec long. The ER tubulesat the mitochondrial fission site are indicated by green arrowheads. Scalebars, 500 nm.
13982 ∣ www.pnas.org/cgi/doi/10.1073/pnas.1201882109 Shim et al.

tion laser should help overcome this problem and allow 3D super-resolution imaging of membrane organelles in living cells.
Materials and MethodsSample Preparation. Immediately before imaging, BS-C-1 cells and hippocam-pal neurons were labeled by incubating live cells with culture mediumcontaining one of the membrane probes for 0.5–3 min. For two-colorimaging, cells were labeled sequentially with MitoTracker Red and thenER-Tracker Red.
Image Acquisition and Analysis. Labeled cells were imaged with continuousillumination at 561, 657, or 752 nm for imaging and 405 nm for probe activa-tion in an oblique-incidence geometry on an Olympus IX-71 inverted micro-scope. The single-molecule images were recorded at 500–900 Hz frame rates
on an EMCCD camera (iXon 860; Andor). For ratiometric two-color imaging,the fluorescence was split by a 624-nm longpass dichroic mirror into twochannels and imaged on two halves of the same camera. The movies wereanalyzed by custom-written STORM analysis software as we previously de-scribed (31), or using the DAOSTORM (37) or a similar multiemitter fittingsoftware (47). See SI Materials and Methods for details.
ACKNOWLEDGMENTS. This work is supported in part by the US National Insti-tutes of Health and the Collaborative Innovation Award of Howard HughesMedical Institute (X.Z.), and National Natural Science Foundation of Chinaand National Basic Research Program of China (G.-Q.B). X.Z. is a HowardHughes Medical Institute investigator. S.-H.S is in part supported by the MaryFieser fellowship. J.C.V. is supported in part by a Burroughs-Wellcome CareerAward at the Scientific Interface.
1. McMahon HT, Gallop JL (2005) Membrane curvature and mechanisms of dynamic cellmembrane remodelling. Nature 438:590–596.
2. Shibata Y, Hu J, Kozlov MM, Rapoport TA (2009) Mechanisms shaping the membranesof cellular organelles. Annu Rev Cell Dev Biol 25:329–354.
3. Detmer SA, Chan DC (2007) Functions and dysfunctions of mitochondrial dynamics.Nat Rev Mol Cell Biol 8:870–879.
4. Hell SW (2009) Microscopy and its focal switch. Nat Methods 6:24–32.5. Heintzmann R, Gustafsson MGL (2009) Subdiffraction resolution in continuous
samples. Nat Photonics 3:362–364.6. Patterson G, Davidson M, Manley S, Lippincott-Schwartz J (2010) Superresolution
imaging using single-molecule localization. Annu Rev Phys Chem 61:345–367.7. Huang B, Babcock H, Zhuang X (2010) Breaking the diffraction barrier: Super-
resolution imaging of cells. Cell 143:1047–1058.8. Rust MJ, Bates M, Zhuang X (2006) Sub-diffraction-limit imaging by stochastic optical
reconstruction microscopy (STORM). Nat Methods 3:793–795.9. Betzig E, et al. (2006) Imaging intracellular fluorescent proteins at nanometer resolu-
tion. Science 313:1642–1645.10. Hess ST, Girirajan TP, Mason MD (2006) Ultra-high resolution imaging by fluorescence
photoactivation localization microscopy. Biophys J 91:4258–4272.11. Bock H, et al. (2007) Two-color far-field fluorescence nanoscopy based on photoswitch-
able emitters. Appl Phys B 88:161–165.12. Heilemann M, et al. (2008) Subdiffraction-resolution fluorescence imaging with
conventional fluorescent probes. Angew Chem Int Ed Engl 47:6172–6176.13. Folling J, et al. (2008) Fluorescence nanoscopy by ground-state depletion and single-
molecule return. Nat Methods 5:943–945.14. Steinhauer C, Forthmann C, Vogelsang J, Tinnefeld P (2008) Superresolution micro-
scopy on the basis of engineered dark states. J Am Chem Soc 130:16840–16841.15. Baddeley D, Jayasinghe ID, Cremer C, Cannell MB, Soeller C (2009) Light-induced dark
states of organic fluochromes enable 30 nm resolution imaging in standard media.Biophys J 96:L22–L24.
16. Zhuang XW (2009) Nano-imaging with STORM. Nat Photonics 3:365–367.17. Dempsey GT, Vaughan JC, Chen KH, Bates M, Zhuang XW (2011) Evaluation of fluor-
ophores for optimal performance in localization-based super-resolution imaging. NatMethods 8:1027–1036.
18. Burnette DT, Sengupta P, Dai YH, Lippincott-Schwartz J, Kachar B (2011) Bleaching/blinking assisted localization microscopy for superresolution imaging using standardfluorescent molecules. Proc Natl Acad Sci USA 108:21081–21086.
19. Simonson PD, Rothenberg E, Selvin PR (2011) Single-molecule-based super-resolutionimages in the presence of multiple fluorophores. Nano Lett 11:5090–5096.
20. Cox S, et al. (2012) Bayesian localization microscopy reveals nanoscale podosomedynamics. Nat Methods 9:195–200.
21. Huang B, Wang W, Bates M, Zhuang X (2008) Three-dimensional super-resolutionimaging by stochastic optical reconstruction microscopy. Science 319:810–813.
22. Juette MF, et al. (2008) Three-dimensional sub-100 nm resolution fluorescencemicroscopy of thick samples. Nat Methods 5:527–529.
23. Pavani SRP, et al. (2009) Three-dimensional, single-molecule fluorescence imagingbeyond the diffraction limit by using a double-helix point spread function. Proc NatlAcad Sci USA 106:2995–2999.
24. Shtengel G, et al. (2009) Interferometric fluorescent super-resolution microscopyresolves 3D cellular ultrastructure. Proc Natl Acad Sci USA 106:3125–3130.
25. Aquino D, et al. (2011) Two-color nanoscopy of three-dimensional volumes by4Pi detection of stochastically switched fluorophores. Nat Methods 8:353–359.
26. Xu K, Babcock HP, Zhuang X (2012) Dual-objective STORM reveals three-dimensionalfilament organization in the actin cytoskeleton. Nat Methods 9:185–188.
27. Shroff H, Galbraith CG, Galbraith JA, Betzig E (2008) Live-cell photoactivated localiza-tion microscopy of nanoscale adhesion dynamics. Nat Methods 5:417–423.
28. Biteen JS, et al. (2008) Super-resolution imaging in live Caulobacter crescentus cellsusing photoswitchable EYFP. Nat Methods 5:947–949.
29. Wombacher R, et al. (2010) Live-cell super-resolution imaging with trimethoprimconjugates. Nat Methods 7:717–719.
30. Testa I, et al. (2010) Multicolor fluorescence nanoscopy in fixed and living cells by ex-citing conventional fluorophores with a single wavelength. Biophys J 99:2686–2694.
31. Jones SA, Shim SH, He J, Zhuang X (2011) Fast, three-dimensional super-resolutionimaging of live cells. Nat Methods 8:499–508.
32. Gunewardene MS, et al. (2011) Superresolution imaging of multiple fluorescent pro-teins with highly overlapping emission spectra in living cells. Biophys J 101:1522–1528.
33. Johnson I, Spence MTZ (2010) Molecular Probes Handbook: A Guide to FluorescentProbes and Labeling Technologies (Life Technologies, Carlsbad, CA), 11th Ed..
34. Manley S, et al. (2008) High-density mapping of single-molecule trajectories withphotoactivated localization microscopy. Nat Methods 5:155–157.
35. Ashby MC, Maier SR, Nishimune A, Henley JM (2006) Lateral diffusion drives consti-tutive exchange of AMPA receptors at dendritic spines and is regulated by spinemorphology. J Neurosci 26:7046–7055.
36. Domanov YA, et al. (2011) Mobility in geometrically confined membranes. Proc NatlAcad Sci USA 108:12605–12610.
37. Holden SJ, Uphoff S, Kapanidis AN (2011) DAOSTORM: An algorithm for high-densitysuper-resolution microscopy. Nat Methods 8:279–280.
38. Ferguson SM, De Camilli P (2012) Dynamin, a membrane-remodelling GTPase. Nat RevMol Cell Biol 13:75–88.
39. Mears JA, et al. (2011) Conformational changes in Dnm1 support a contractile mechan-ism for mitochondrial fission. Nat Struct Mol Biol 18:20–26.
40. Bossi M, et al. (2008) Multicolor far-field fluorescence nanoscopy through isolateddetection of distinct molecular species. Nano Lett 8:2463–2468.
41. Friedman JR, et al. (2011) ER Tubules Mark Sites of Mitochondrial Division. Science334:358–362.
42. Dempsey GT, et al. (2009) Photoswitching mechanism of cyanine dyes. J Am Chem Soc131:18192–18193.
43. van de Linde S, et al. (2011) Photoinduced formation of reversible dye radicals andtheir impact on super-resolution imaging. Photochem Photobiol Sci 10:499–506.
44. Bereiter-Hahn J, Jendrach M (2010) Mitochondrial dynamics. Int Rev Cell Mol Biol284:1–65.
45. Liu X, Weaver D, Shirihai O, Hajnoczky G (2009) Mitochondrial ‘kiss-and-run’: Interplaybetween mitochondrial motility and fusion-fission dynamics. Embo J 28:3074–3089.
46. Shao L, Kner P, Rego EH, GustafssonMGL (2011) Super-resolution 3Dmicroscopy of livewhole cells using structured illumination. Nat Methods 8:1044–1046.
47. Babcock H, Sigal YM, Zhuang X (2012) A high-density 3D localization algorithm forstochastic optical reconstruction microscopy. Optical Nanoscopy 1:6.
Shim et al. PNAS ∣ August 28, 2012 ∣ vol. 109 ∣ no. 35 ∣ 13983
BIOPH
YSICSAND
COMPU
TATIONALBIOLO
GY