Embed Size (px)
Citation preview

SUPER TUESDAY BIKE COUNT
Tennant Creek
2019

Super Tuesday Bike Count Report 2019 Page iii
About the count
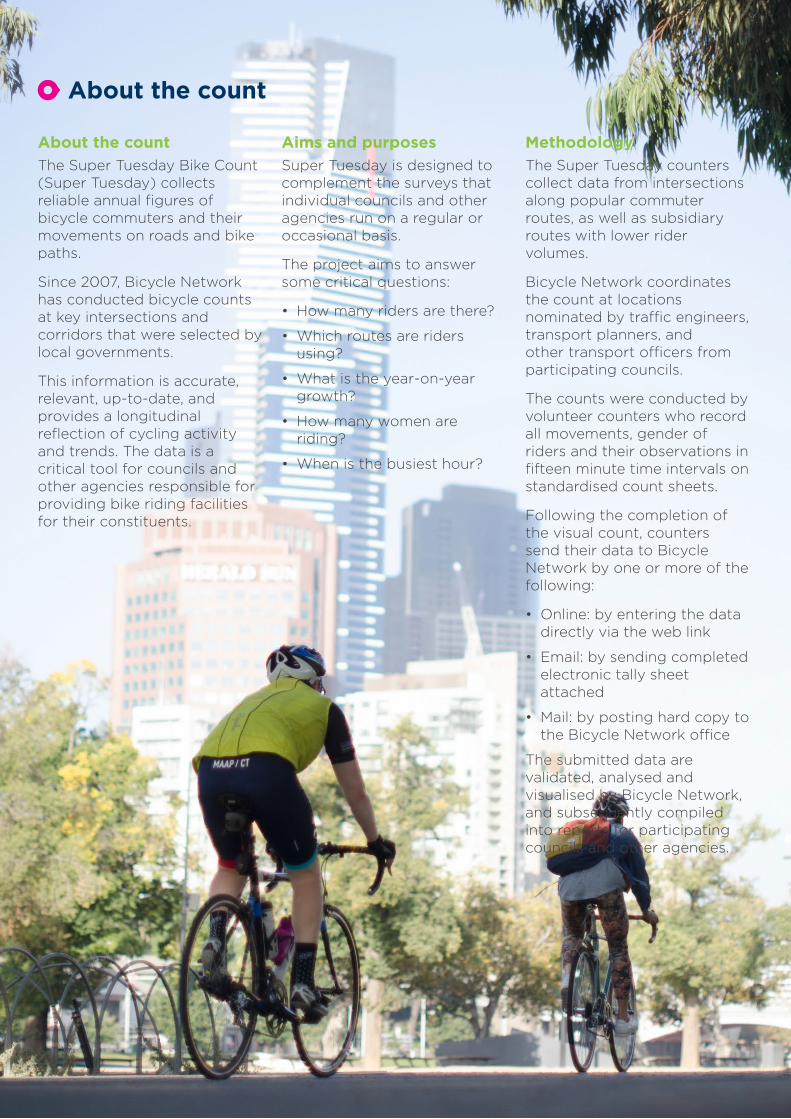
About the count
The Super Tuesday Bike Count (Super Tuesday) collects reliable annual fgures of bicycle commuters and their movements on roads and bike paths.
Since 2007, Bicycle Network has conducted bicycle counts at key intersections and corridors that were selected by local governments.
This information is accurate, relevant, up-to-date, and provides a longitudinal refection of cycling activity and trends. The data is a critical tool for councils and other agencies responsible for providing bike riding facilities for their constituents.
Aims and purposes
Super Tuesday is designed to complement the surveys that individual councils and other agencies run on a regular or occasional basis.
The project aims to answer some critical questions:
• How many riders are there?
• Which routes are riders using?
• What is the year-on-year growth?
• How many women are riding?
• When is the busiest hour?
Methodology
The Super Tuesday counters collect data from intersections along popular commuter routes, as well as subsidiary routes with lower rider volumes.
Bicycle Network coordinates the count at locations nominated by trafc engineers, transport planners, and other transport ofcers from participating councils.
The counts were conducted by volunteer counters who record all movements, gender of riders and their observations in ffteen minute time intervals on standardised count sheets.
Following the completion of the visual count, counters send their data to Bicycle Network by one or more of the following:
• Online: by entering the data directly via the web link
• Email: by sending completed electronic tally sheet attached
• Mail: by posting hard copy to the Bicycle Network ofce
The submitted data are validated, analysed and visualised by Bicycle Network, and subsequently compiled into reports for participating councils and other agencies.

Count Summary in Tennant Creek
1 LOCATION
3 SEPTEMBER
2019
6.30AM-8.30AM
5 MOVEMENTS
COUNT IN 2019 COUNT SITES TRAFFIC FLOW
The Super Tuesday Bike Count was conducted on Tuesday 3 September 2019 for two hours from 6:30am to 8:30am.
It was fne in Tennant Creek on the day of the count, with moderate easterly winds reaching 22km/h, and a maximum temperature of 22.6 degrees at 9am.
By participating in the count, volunteer counters can choose a local community group to receive a donation of $60, which goes back to the local community through donations to nominated groups.
A single site (7251) was A total of 5 movements surveyed in Tennant Creek. was counted at all selected
intersections across the council area during the two-hour survey.

Female 40%
Male 60%
8.15
8.00 7.00
2019 2018
5725%
Pe
ak H
ou
r
6.45
7.1.45
GROWTH GENDER RATIO PEAK HOUR
6.3
07.
30
Overall, usage has increased by 25% (5 movements) compared to 2018 (4 movements).
Female represented 40% of bike riders across the municipality.
This is higher than the average female ridership across Northern Territory (30%), and the Australia-wide average of surveyed areas in 2019 (25%).
COUNT RESULTS p. 8
The summary data table and analysis on each site are included in this chapter.
Data table in Excel spreadsheet is supplied with this report.
The busiest hour was between 7:30 - 8:30am during the survey.
The average volume in 15 minute time intervals is as follows.
• 6:30-6:45am: 0 movements
• 6:45-7:00am: 1 movements
• 7:00-7:15am: 0 movements
• 7:15-7:30am: 0 movements
• 7:00-7:15am: 0 movements
• 7:15-7:30am: 0 movements
• 7:30-7:45am: 0 movements
• 7:45-8:00am: 1 movements
• 8:00-8:15am: 1 movements
• 8:15-8:30am: 2 movements

Super Tuesday Bike Count Report 2019 Page 1
Super Tuesday in 2019
THE COUNT
Bicycle Network’s Super Tuesday Bike Count is the world’s biggest and longest running visual bike count, where volunteers measure bike commuter fows in the morning peak across the country. The count provides quantitative surveys with fgures on the movements of bike users, helping councils provide and improve infrastructure and facilities for people riding bikes.
The Super Tuesday Bike Count was conducted on Tuesday 3 September 2019 between 7:00am and 9:00am (6:30am and 8:30am in the Northern Territory). Where necessary, a recount was conducted on Tuesday 24 September.
In the 2019 count, 1050 sites were surveyed across 48 councils. This year we welcomed Brisbane and Noosa to the Counts program, and created 168 new count sites across Australia.
Just under 150K movements were recorded nationally during the two hour count. The national site results reveals a 9% increase when compared to the same locations in 2018.
Volunteer participants were thanked with a donation of $60 from Bicycle Network to a community group of their choice. The total donation value was over $58K.
The 2019 Super Tuesday Bike Count suggests females comprise 25% of bike riders across Australia. This is a slight increase of 1% when compared to the 2018 Super Tuesday count.
The peak hour across all sites was between 7:45am and 8:45am, with over 80K movements recorded across the states during this time.
RESULTS BY STATES
Tasmania
The overall number of riders in Tasmania has decreased by 5% compared to the same sites as 2018. Females comprised 26% of all riders.
Victoria
In Victoria, the number of riders increased by 6% when compared to the same sites counted in 2018. Female riders comprised 26% of the total proportion of riders counted across the state, slightly higher than the national average.
New South Wales
In New South Wales, the number of riders increased by a signifcant 49% when compared to the same sites counted in 2018. This is due to an exceptional increase in bike rider volumes in Lake Macquarie. However, female riders comprised 19% of the total proportion of riders counted, which the lowest proportion across the states. Weather conditions were generally fne across NSW, with a warm temperature of 25.4 degrees in Sydney at 9am.
Western Australia
In Western Australia, the total number of riders increased by 10% when compared to the same sites counted in 2018. Female riders comprised 20% of the total proportion of
riders counted across the state, 5% lower than the national average.
Queensland
Council participation increased in Queensland this year, with the inclusion of Brisbane and Noosa; and the return of Cairns, who last participated in 2015.
Over 8000 movements were recorded across the 168 Queensland sites, an increase of 6%. The weather was fne during both the frst and second counts. Female participation was 24%, just under the national average.
Northern Territory
Just under 4000 movements were recorded across 75 sites in Northern Territory, a minor decrease compared to 2018. However, the state leads the country in female participation (31%), which is 6% higher than the national average. Amazing!

Super Tuesday Bike Count Report 2019 Page 2

Super Tuesday Bike Count Report 2019 Page 3

Super Tuesday Bike Count Report 2019 Page 4

Super Tuesday Bike Count Report 2019 Page 5

Super Tuesday Bike Count Report 2019 Page 6

Results
Total Count Volume in 15 Minute Intervals
Sit
eID S
tre
et
nam
es
Fe
male
Male
No
t K
no
wn
20
19
20
18
% G
row
th
6:3
0-6
:45
6:4
5-7
:00
7:0
0-7
:15
7:1
5-7
:30
7:3
0-7
:45
7:4
5-8
:00
8:0
0-8
:15
8:1
5-8
:30
7251 Northbound (school side) [N], Southbound (shop side) [NE], Southbound (shop side) [S], Northbound (school side) [SW]
2 3 0 5 4 25% 0 1 0 0 0 1 1 2
Super Tuesday Bike Count Report 2019 Page 7

Super Tuesday Bike Count Report 2019 Page 8
Site 7251
Northbound (school side) [N], Southbound (shop side) [NE], Southbound (shop side) [S], Northbound (school side) [SW]
5 bicycle riders were recorded during the 2 hour survey. This is an increase of 25% compared to 4 in 2018. The peak period was 08:15-08:30 with 2 riders. Female riders comprised 40% of the total.
The most active thoroughfare in site 7251 was from Southbound (shop side) [NE] to Southbound (shop side) [S] between 07:45 AM - 08:00 AM, with 1 total riders counted during this period. There is not enough linear trend data to calculate the growth and decline of this site over time.
North
boun
d (s
choo
l sid
11 So
uthb
ound
(sho
psid
e)
22
outh
boun
d (s
hop
side)
33 No
rthbo
und
(sch
ool s
ide)
44
Traffic Volume by Time Gender Ratio
Cycling Trend Traffic Flow
↗ 3 ↙ 1
2 Southbound (shop side) [NE]
3 Southbound (shop side) [S]
Raw Data
Enter 1 Northbound (school side) [N]
↙ 1 ↓ 1 ↑ 4
4 Northbound (school side) [SW]
Exit 2 3 4 1 3 4 1 2 4 1 2 3 Total Female 0 0 0 0 0 0 0 1 1 0 0 0 2
Male 0 0 0 0 1 0 0 2 0 0 0 0 3
Not known 0 0 0 0 0 0 0 0 0 0 0 0 0
Total 0 0 0 0 1 0 0 3 1 0 0 0 5

Contributions
National contributions The Super Tuesday Bike Count is powered by local volunteers, who collect data at council-nominated locations across Australia. In return, volunteers nominate a non-proft or charity to receive a donation of $60, or place this contribution toward a
Bicycle Network membership.
The 2019 Super Tuesday count raised $58,440 in donations nationally, strengthening local communities and building better active transport outcomes.
With nearly 50,000 members, Bicycle Network is the largest member-based bike riding organisation in Australia. At Bicycle Network, we campaign for better conditions, infrastructure and policies that make it easier and more accessible for people of all ages and abilities to ride
a bike. We work closely with all levels of government to improve conditions for all people who ride.
Did you know that at Bicycle network we also do:
RIDE2SCHOOL
Our Ride2School team work collaboratively
with schools, students and councils to
help young people overcome the barriers
preventing them from riding to school and
getting active. Schools engaged in the year-
long program report an active travel rate of
45 per cent, nearly double the national average.
Other Ride2School initiatives include:
MIND.BODY.PEDAL – a one-day program
aimed at empowering and inspiring secondary
school aged females. It is designed to
address the unique barriers holding teenage
females back from being physically active.
ACTIVE PATHS – is a collaborative way-finding
initiative, designed to make the journey to and
from school as clear, fun and easy as possible!
Find out more by visiting ride2school.com.au or
contacting [email protected].
ADVOCACY AND CAMPAIGNS
We work directly with councils to help provide
expert advice on transport plans, coordinating
action between all levels of government, and
targeting riders in specific regions to assist in
consultation and community engagement efforts.
If you want our help on a bike riding issue
or active transport plan in your LGA,
reach out to our Public Affairs team at
BIKE PARKING
Bicycle Network are the bike parking experts –
we design, quote, construct and install a wide
range of bike parking and end-of-trip facilities
for Council’s and private developments.
For more information,
visit bicyclenetwork.com.au/bike-parking-experts or email [email protected] (1300 727 563)
PARKITEER BIKE CAGES – we manage 24/7
secure bike parking cages at major transport
hubs on behalf of government departments.
Learn more at parkiteer.com.au or by contacting
RIDES AND EVENTS
We run some of Australia’s biggest bike
rides including The Great Vic Bike Ride
(3,000+ riders), Around the Bay (10,000+
riders), the Great Outback Escape (NT), the
Newcrest Orange Classic (NSW), and many
more. We also coordinate regular social
bike rides to help encourage riding and
discuss the concerns of the riding public.
To organise events and social rides in you LGA,
visit bicyclenetwork.com.au/rides-and-events
GET IN TOUCH - If your council would like
to explore opportunities to collaborate
with Bicycle Network or our members in
the future, please get in touch with via