Embed Size (px)
Citation preview
1
DOE Generation IV Energy Conversion
Supercritical CO2 Cycle Development
Paul Pickard (SNL)Technical Director – Gen IV Energy Conversion
MIT S-CO2 SymposiaMarch 6, 2007

2
Generation IV Energy Conversion
• Electrical generation - Gen IV Energy Conversion Program
• Hydrogen production - Nuclear Hydrogen Initiative (NHI)
300 400 500 600 700 800 900 1000 1100Temp C
VHTRGFR
SFRSCWR
High Temp Elect
He Brayton
MSRTemperature Ranges
300 400 500 600 700 800 900 1000 1100Temp C
VHTRGFR
LFRSFR
SCWR
Sulfur Cycles
He BraytonS-CO2 Brayton
MSR
Alt Cycles Hydrogen Production Temperature RangesHydrogen Production
Methods
Electrical Conversion TechnologiesRankine
Gen IV Reactor Output

3
Gen IV Energy Conversion Objectives: Optimize performance and cost effectiveness of Gen IV reactors
Generator
CompressorStages
Turbine Stages
Heat Sink
Blower
Interstage Cooling
Interstage Heating
Gen IV RX
Motor
Generator
CompressorStages
Turbine Stages
Heat Sink
Blower
Interstage Cooling
Interstage Heating
Gen IV RX
Motor200
400
600
800
1000
1200
19 20 21 22 23 24 25 26 27 28entropy (j/g*K)
Tem
pera
ture
(K)
Interstage Heated, Cooled - He Cycle
Cycle Efficiencies vs Source Temperature for fixed component efficiencies and system effectiveness
0%
10%
20%
30%
40%
50%
60%
200 300 400 500 600 700 800 900 1000
Source Temperature (°C)
Cyc
le E
ffici
ency
(%)
1t/1c rec He BraytonSCSF CO2 Brayton3t/6c IH&C He Brayton
Figure 13: T-s diagram for split flow recuperated Brayton cycle using CO2 bew een 7.5 and 22.5 MPa w ith 29% of the flow diverted by the interm ediate com pressor
(eff=49%)
250
300
350
400
450
500
550
600
650
700
750
800
850
900
950
1000
1.5 1.7 1.9 2.1 2.3 2.5 2.7 2.9 3.1
entropy (J/g*K)
tem
pera
ture
(K)
phase dome
low er comp
LT HP rec
HT HP rec
Qin
turbine
HT LP rec
LT LP rec
Qrej
interm comp
Reactor
Generator
Motor
Main Compressor
Turbine Stages
Heat Sink
Motor
Motor
RecompressorLow Temp
Recuperator
High Temp Recuperator
Split Flow S-CO2 Brayton Cycle
Brayton Cycle Options for Gen IV Reactors
Figure 11: T-s plot for simple Brayton cycle using Helium flow at 6.9 and 23 MPa w ith SC steam bottoming cycle w ith mass flow ratio of 1.241 w ater/helium
(eff=48%)
300.00
400.00
500.00
600.00
700.00
800.00
900.00
1000.00
15.0 16.0 17.0 18.0 19.0 20.0 21.0 22.0 23.0 24.0
entropy (kJ/kg(helium)*K)
Tem
pera
ture
(K)
Q transfered
comp
Q in Brayton
turbine
steam dome
steam dome
Rankine pump
Q transfered
Q in Rankine
Steam Turbine
Q rejection
T-s diagram for single stage Recuperated Helium Brayton cycle between 5 and 10 MPa
200
400
600
800
1000
1200
19 20 21 22 23 24 25 26 27 28entropy (j/g*K)
Tem
pera
ture
(K)
Rankine Bottoming Cycle Recuperated He Cycle

4
FY07 Gen IV Power Conversion
S-CO2 - intermediate temperature reactors (500-700 C)• High efficiencies in intermediate temperature ranges• Relatively compact, little additional complexity • Potential for reduced capital costs• Key issues – compression near critical point, control strategy
for split flow
1
2
6
Compressor
T=305 K
P= 20 MPa
Alternator/Motor 1000 rpm
Waste Heat Cooler
T=331 K
2.82 kg/s
= 90kW
502 kW
90 kW
P= 7.5 MPa
P= 7.5 MPa
= 90kW
Flow Orifice Inst.
FY07 Task Areas1. S-CO2 system design (MIT)2. S-CO2 control analysis (ANL, MIT) 3. PCHE heat transfer experiments (ANL)4. S-CO2 materials testing (MIT, LANL)5. Initiate construction of small scale S-
CO2 compression exps and (~ MW) class split flow Brayton cycle system (SNL, Industry)
0-60 VAC5000 A
440 VAC, 770 A
TT
PRESSURIZER
P
EXHAUST
CO2
LEVELDETECTOR
COLDLEG
HOTLEG
POWER SUPPLY
F TTW WTT WTT WTT FT
FT FT FT
FT
PP
TF
WT
= ABSOLUTE PRESSURE
= DIFFERENTIAL PRESSURE
= FLUID TEMPERATURE
= WALL TEMPERATURE
P
CO2GEARPUMP
HEATRIC HX
CORIOLISFLOWMETER
FILTER
FT
DIELECTRICUNION
= RELIEF VALVE
P
P FILTER
COLDLEGHOT
LEG FTFT

5
Supercritical CO2 Cycle ActivitiesPower Conversion System Studies (MIT)
• FY06 studies developed layouts for PCS ratings ranging from 20 to 1200MWe
• “3rd generation” concepts evolved from earlier MIT studies, addressed impact of ductwork pressure drop on thermodynamic efficiency;
• Radial compressors used for main compressor (1 stage ~0.85) and recompressor (3 stages ~0.89)
• Modular approach to extend power range
• Reference version - 300MWe two-train recuperator configuration using parallel clusters of commercial HEATRICTM PCHE
• FY07 activities at MIT focus on control simulations
2nd Generation SCO2 300Mwe PCS
2nd Generation S- CO2 300Mwe PCS
3rd Generation
Net efficiency = 0.47 @650 C versus 0.45 for 2nd generation PCS
Pre cooler
LTR
HTR
T
RC
6
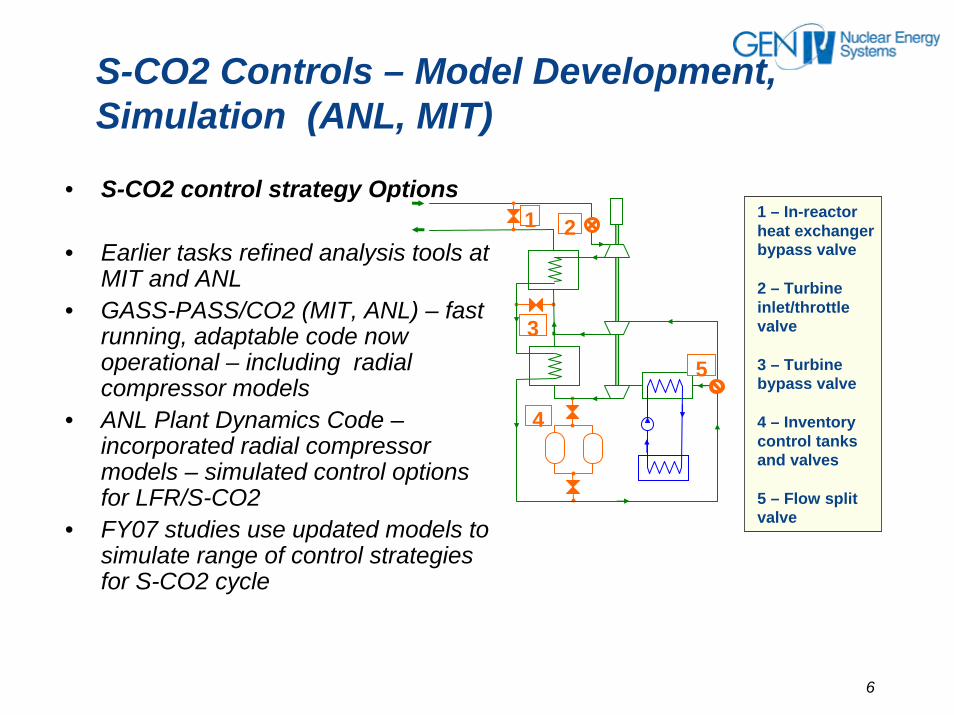
S-CO2 Controls – Model Development, Simulation (ANL, MIT)
• S-CO2 control strategy Options
• Earlier tasks refined analysis tools at MIT and ANL
• GASS-PASS/CO2 (MIT, ANL) – fast running, adaptable code now operational – including radial compressor models
• ANL Plant Dynamics Code –incorporated radial compressor models – simulated control options for LFR/S-CO2
• FY07 studies use updated models to simulate range of control strategies for S-CO2 cycle
3
4
1
5
21 – In-reactor heat exchanger bypass valve
2 – Turbine inlet/throttle valve
3 – Turbine bypass valve
4 – Inventory control tanks and valves
5 – Flow split valve

7
Closed Brayton Cycle Testing
SNL CBC Testing For Gen IV Pure Gases Gas Mixtures
Test Date1/11/2006 10/17/2006 3/16/2006 5/25/2006 1/11/2006 3/16/2005 3/16/2005 3/23/2006
Gas Type Description N2 Ar CO2 He 90N2-10Ar 90Ar-10He 80Ar-20He 70N2-30HeCp J/kg*K 1026 518 844 5378 941.4 571 634 1221k(300K) mW/m*K 26 18 16 154 26 24 33.1 46k(1000K) mW/m*K 60 42 54 336 59 56 72 105Ro (J/kg*K) 297 208 188.9 2079 284 229 254 399MW (gm/mole) 28 39.9 44.01 4 29 36.4 32.7 21Gamma 1.407 1.66 1.316 1.66 1.433 1.66 1.66 1.486
SS Inventory Test x x Mix xSS Temperature Increase x x x Mix xSS Flow and RPM Op-Curves x x Mix x x xSS Operating Pwr Curve x x Mix x x xSS Operating Pressure Ratio x x Mix x x xTransient RPM Step Decrease (5000 rpm) x Mix x x xTransient RPM Step Increase (1000 rpm) x x x Mix x x xTransient Startup x x x Mix xTransient Shutdown x x Mix x xSS MW Increase xSS MW Decrease x x
CBC operational data for model comparisons
•Transient, steady state operations
•Working fluids -- N2, He, Ar, CO2, mixtures
• Operational data for --Inventory, temperature changes, startup, shutdown, power changes

8
Comparison of Measurements and Predictions
SNL 30 kWe CBC Measurements Dynamic Model Predictions
Startup InventoryReductions
TIT Increase 650 K,700 K,750K
RPM Increase Shutdown
10 kPa Argon Addition
dP =10 kPa5 Steps
RPM/5000
Power (kW)
100% N2
Heater Power (%)
Gas Coolant Temps (K)
Startup InventoryReductions
TIT Increase 650 K,700 K,750K
RPM Increase Shutdown
10 kPa Argon Addition
dP =10 kPa5 Steps
RPM/5000
Power (kW)
100% N2
Heater Power (%)
Gas Coolant Temps (K)
Startup InventoryReductions
TIT Increase 650 K,700 K,750K
RPM Increase Shutdown
10 kPa Argon Fill
dP =10 kPa
100% N2
Heater Power (%)
Gas Coolant Temps (K)
10 kPa Bleed
Startup InventoryReductions
TIT Increase 650 K,700 K,750K
RPM Increase Shutdown
10 kPa Argon Fill
dP =10 kPa
100% N2
Heater Power (%)
Gas Coolant Temps (K)
10 kPa Bleed
Startup InventoryReductions
TIT Increase 650 K,700 K,750K
RPM Increase Shutdown
10 kPa Argon Addition
dP =10 kPa5 Steps
RPM/5000
Power (kW)
100% N2
Heater Power (%)
Gas Coolant Temps (K)
Startup InventoryReductions
TIT Increase 650 K,700 K,750K
RPM Increase Shutdown
10 kPa Argon Addition
dP =10 kPa5 Steps
RPM/5000
Power (kW)
100% N2
Heater Power (%)
Gas Coolant Temps (K)
Startup InventoryReductions
TIT Increase 650 K,700 K,750K
RPM Increase Shutdown
10 kPa Argon Fill
dP =10 kPa
100% N2
Heater Power (%)
Gas Coolant Temps (K)
10 kPa Bleed
Startup InventoryReductions
TIT Increase 650 K,700 K,750K
RPM Increase Shutdown
10 kPa Argon Fill
dP =10 kPa
100% N2
Heater Power (%)
Gas Coolant Temps (K)
10 kPa Bleed
Temperatures
Pressure
Power
Rpm and flow

9
S-CO2 PCHE Heat Transfer Testing Facility -- ANL
0-60 VAC5000 A
440 VAC, 770 A
TT
PRESSURIZER
P
EXHAUST
CO2
LEVELDETECTOR
COLDLEG
HOTLEG
POWER SUPPLY
F TTW WTT WTT WTT FT
FT FT FT
FT
PP
TF
WT
= ABSOLUTE PRESSURE
= DIFFERENTIAL PRESSURE
= FLUID TEMPERATURE
= WALL TEMPERATURE
P
CO2GEARPUMP
HEATRIC HX
CORIOLISFLOWMETER
FILTER
FT
DIELECTRICUNION
= RELIEF VALVE
P
P FILTER
COLDLEGHOT
LEG FTFT
• Initial configuration - CO2-to-water heat exchange tests• 17.5 KW heat duty PCHE represents section of cooler for S-CO2
Brayton cycle• FY07 upgrade to CO2 to CO2 configuration (started in FY06).
(low temperature recuperator).
• Conducted initial series of CO2-to-water steady state under prototypical conditions.
• Determined average heat transfer coefficients on the water and CO2 sides. Compared ANL PCHE modeling with test data
• Good agreement is obtained for the heat exchange rate, Q, or CO2 and H2O outlet temperatures. CO2 side pressure drop is overpredicted
10
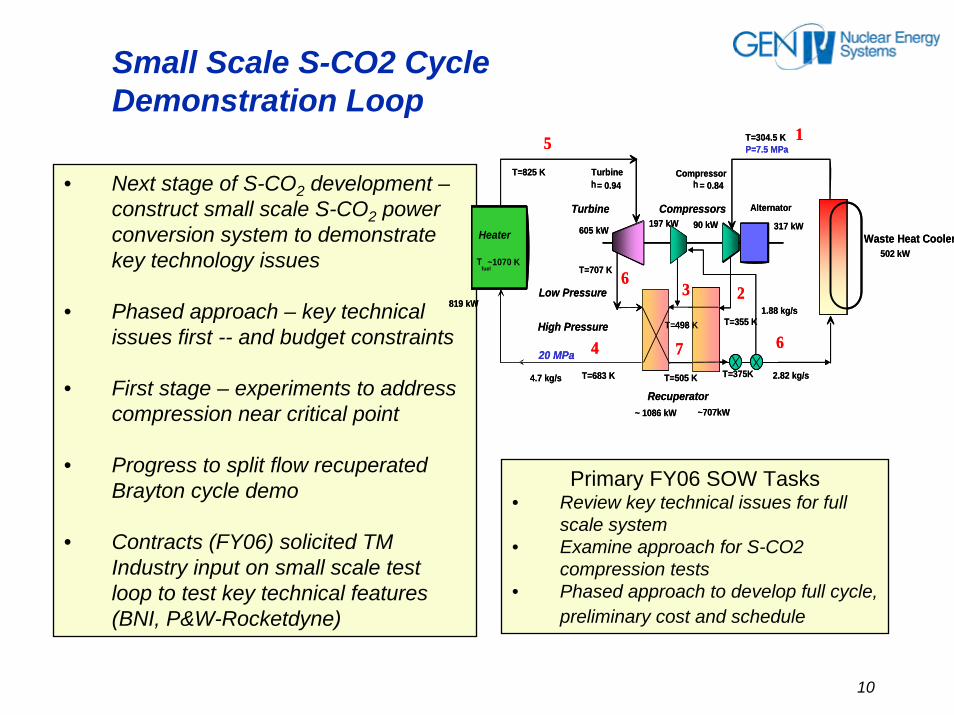
Small Scale S-CO2 Cycle Demonstration Loop
• Next stage of S-CO2 development –construct small scale S-CO2 power conversion system to demonstrate key technology issues
• Phased approach – key technical issues first -- and budget constraints
• First stage – experiments to address compression near critical point
• Progress to split flow recuperated Brayton cycle demo
• Contracts (FY06) solicited TM Industry input on small scale test loop to test key technical features (BNI, P&W-Rocketdyne)
1
23
5
6
6
T=825 K
Heater
Compressors
Turbineh = 0.94
Compressorh = 0.84
T=304.5 KP=7.5 MPa
Alternator
Waste Heat Cooler
Tfuel
~1070 K
Turbine
Recuperator
Low Pressure
High Pressure T=355 KT=498 K
20 MPa
T=683 K
4 7
T=707 K
T=505 K T=375K4.7 kg/s
1.88 kg/s819 kW
502 kW
~ 1086 kW ~707kW
317 kW197 kW605 kW 90 kW
2.82 kg/s
Primary FY06 SOW Tasks • Review key technical issues for full
scale system • Examine approach for S-CO2
compression tests • Phased approach to develop full cycle,
preliminary cost and schedule

11
Key Technology for S-CO2 DevelopmentSNL LDRD -- S-CO2 other working fluids
S-CO2 Main Compressor TestElectric Motor Driven Option
Motor Comp
Liftoff Gas Seal
Ball BearingsGimbal MountTo Measure Torque
TurbineExpander
Major Technology IssuesGas Liftoff SealsEfficiency of CompressionThermal Input ControlBearings and Thrust LoadsOff-Normal behavior (wet)
Turbo Assisted Motor/ CompressorReduces motor power requirementsAllow modification – wheels, housings could be replaced with different designs.
1
23m
6
Compressor
CO2
h
η= 0.72
T=335 KP=19.99 MPa
Motor Alternatorη = 0.95
Waste HeatGas Chiller
Turbine
Recuperator
T=305 KP=7.69 MPa
T=306.2KP=7.84 MPa
3 kg/s
47 kW 75.5 kW28.4 kW28.4 kW
η= 0.85
Heater
1
23m
6
Compressor
CO2
h
η= 0.72
T=335 KP=19.99 MPa
Motor Alternatorη = 0.95
Waste HeatGas Chiller
Turbine
Recuperator
T=305 KP=7.69 MPa
T=306.2KP=7.84 MPa
3 kg/s
47 kW 75.5 kW28.4 kW28.4 kW
η= 0.85
Heater
Phase 1-LS: Turbo Assisted Main Compressor Study SC-CO2 Flow Compression (3 kg/s)

12
Gen IV S-CO2(1 MWth => 300 kWe with Split Flow)
Compressors Alternator
Waste Heat Cooler
TurbineAssist
Low PwrRecuperator
Low Pressure
High Pressure
T=355 KT=498 K
20 MPa
5 kg/s
2 kg/s
3kg/s
7 MPa
Compressors Alternator
Waste Heat Cooler
TurbineAssist
Low PwrRecuperator
Low Pressure
High Pressure
T=355 KT=498 K
20 MPa
5 kg/s
2 kg/s
3kg/s
7 MPa
Compressors Alternator
Waste Heat Cooler
TurbineAssist
Low PwrRecuperator
Low Pressure
High Pressure
T=355 KT=498 K
20 MPa
5 kg/s
2 kg/s
3kg/s
7 MPa
Heater
1 MWcapability
Compressors Alternator
Waste Heat Cooler
TurbineAssist
Low PwrRecuperator
Low Pressure
High Pressure
T=355 KT=498 K
20 MPa
5 kg/s
2 kg/s
3kg/s
7 MPa
Heater
1 MWcapability
1
23
5
6
6
T=825 K
Heater
Compressors
Turbineh = 0.94
Compressorh = 0.84
T=304.5 KP=7.5 MPa
Alternator
Waste Heat Cooler
Tfuel
~1070 K
Turbine
Recuperator
Low Pressure
High Pressure T=355 KT=498 K
20 MPa
T=683 K
4 7
T=707 K
T=505 K T=375K4.7 kg/s
1.88 kg/s819 kW
502 kW
~ 1086 kW ~707kW
317 kW197 kW605 kW 90 kW
2.82 kg/s
Phase 1 - Split flow (Main and Recompressor) Study
Phase 2 - Non-recuperated Braytonsplit flow
Phase 3 – Recuperated split flow S-CO2 cycle
No Heater ~ 40 kWe MotorConsumes Electricity
Up to 1 MW Heater ~ 40 kWe Alternator PwrProduces Electricity
~1 MW Heater & ~40 kWe Motor/Alternator+ 300 kW Dynometer or 300 kWe Alt. is an OptionProduces Electricity
Phase 2
Phase 3
Phase 1

13
Gen IV Energy ConversionFY07 S-CO2 Summary
Develop experimental capability to address key technical issues– Main compressor operation, – System control strategies – Heat transfer experiments
Approach: phased design, construction – Address main compressor exps first– Split flow compression as first stage of small scale system – Optimize construction sequence to provide early results and
leverage previous phase
Planning Schedule for Gen IV scope– Gen IV funding - ~ 4 year schedule– Other SC fluids work on supercritical compression studies– GNEP – other program involvement

14
Gen IV Energy Conversion S-CO2 cycle phases, proposed schedule
SustainableSystem Selection
Dev Phase
S-CO2 Cycle Development
Components
Small Scale
Pilot Scale
Adv Cycle Eval. Key Technology Exps Pilot Scale Demo2005 2007 2009 2011 2013 20142012201020082006
S-CO2 Design / Eval
Main Comp, PCHE Exps
Split flow comp exps Non- recup
Brayton
Recup Brayton
Pilot Scale S-CO2 system design and technology demonstration
MW S-CO2 split flow devel.

15
Extra VGs
16
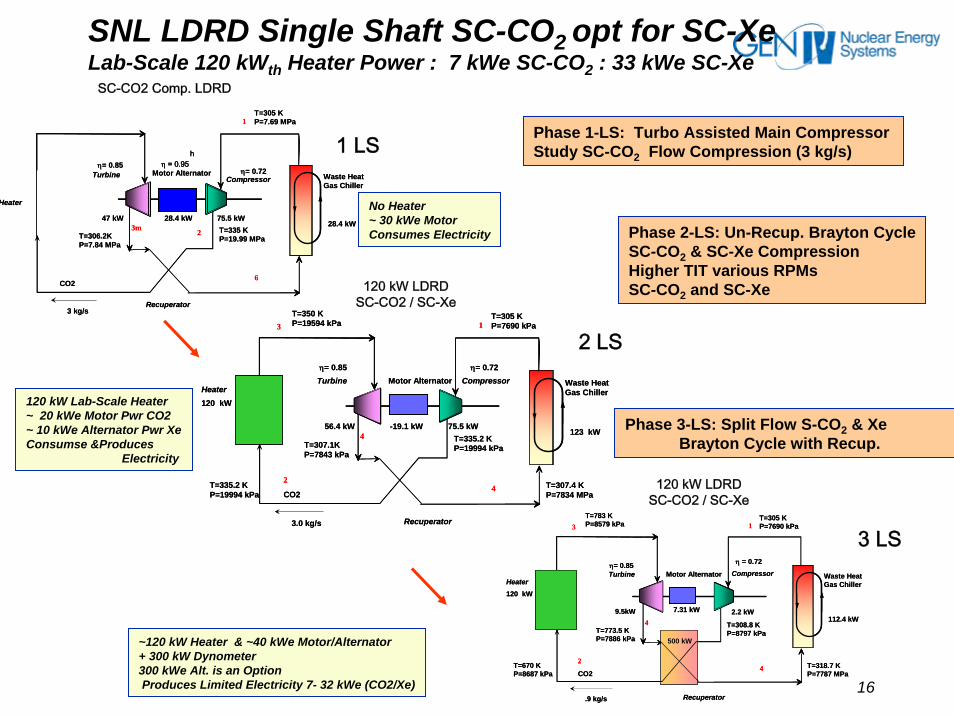
SNL LDRD Single Shaft SC-CO2 opt for SC-XeLab-Scale 120 kWth Heater Power : 7 kWe SC-CO2 : 33 kWe SC-Xe
1
23m
6
Compressor
CO2
h
η= 0.72
T=335 KP=19.99 MPa
Motor Alternatorη = 0.95
Waste HeatGas Chiller
Turbine
Recuperator
T=305 KP=7.69 MPa
T=306.2KP=7.84 MPa
3 kg/s
47 kW 75.5 kW28.4 kW28.4 kW
η= 0.85
Heater
1
23m
6
Compressor
CO2
h
η= 0.72
T=335 KP=19.99 MPa
Motor Alternatorη = 0.95
Waste HeatGas Chiller
Turbine
Recuperator
T=305 KP=7.69 MPa
T=306.2KP=7.84 MPa
3 kg/s
47 kW 75.5 kW28.4 kW28.4 kW
η= 0.85
Heater
Heater
1
2
4
4
Compressor
CO2
η= 0.85 η= 0.72
T=335.2 KP=19994 kPa
Motor Alternator Waste HeatGas Chiller
Turbine
Recuperator
T=305 KP=7690 kPa
T=307.1KP=7843 kPa
3.0 kg/s
56.4 kW 75.5 kW-19.1 kW123 kW
3T=350 KP=19594 kPa
T=335.2 KP=19994 kPa
T=307.4 KP=7834 MPa
120 kWHeater
1
2
4
4
Compressor
CO2
η= 0.85 η= 0.72
T=335.2 KP=19994 kPa
Motor Alternator Waste HeatGas Chiller
Turbine
Recuperator
T=305 KP=7690 kPa
T=307.1KP=7843 kPa
3.0 kg/s
56.4 kW 75.5 kW-19.1 kW123 kW
3T=350 KP=19594 kPa
T=335.2 KP=19994 kPa
T=307.4 KP=7834 MPa
120 kW
1
2
4
4
HeaterCompressor
CO2
η= 0.85 η = 0.72
T=308.8 KP=8797 kPa
Motor Alternator Waste HeatGas Chiller
Turbine
Recuperator
T=305 KP=7690 kPa
T=773.5 KP=7886 kPa
.9 kg/s
9.5kW 7.31 kW 2.2 kW112.4 kW
3T=783 KP=8579 kPa
T=670 KP=8687 kPa
T=318.7 KP=7787 MPa
120 kW
500 kW
1
2
4
4
HeaterCompressor
CO2
η= 0.85 η = 0.72
T=308.8 KP=8797 kPa
Motor Alternator Waste HeatGas Chiller
Turbine
Recuperator
T=305 KP=7690 kPa
T=773.5 KP=7886 kPa
.9 kg/s
9.5kW 7.31 kW 2.2 kW112.4 kW
3T=783 KP=8579 kPa
T=670 KP=8687 kPa
T=318.7 KP=7787 MPa
120 kW
500 kW
120 kW LDRDSC-CO2 / SC-Xe
120 kW LDRDSC-CO2 / SC-Xe
1 LS
2 LS
3 LS
SC-CO2 Comp. LDRD
Phase 1-LS: Turbo Assisted Main Compressor Study SC-CO2 Flow Compression (3 kg/s)
Phase 2-LS: Un-Recup. Brayton CycleSC-CO2 & SC-Xe Compression Higher TIT various RPMsSC-CO2 and SC-Xe
Phase 3-LS: Split Flow S-CO2 & XeBrayton Cycle with Recup.
No Heater ~ 30 kWe MotorConsumes Electricity
120 kW Lab-Scale Heater ~ 20 kWe Motor Pwr CO2~ 10 kWe Alternator Pwr XeConsumse &Produces
Electricity
~120 kW Heater & ~40 kWe Motor/Alternator+ 300 kW Dynometer300 kWe Alt. is an OptionProduces Limited Electricity 7- 32 kWe (CO2/Xe)

17
Small Scale S-CO2 Demo UnitConceptual Approach
Phase 1 - Main compressor and/or Recompressorwith/without split flow
Phase 2 – Non-recuperated BraytonSplit flow
Compressors Alternator
Waste Heat Cooler
TurbineAssist
Low PwrRecuperator
Low Pressure
High Pressure
T=355 KT=498 K
20 MPa
5 kg/s
2 kg/s
3kg/s
7 MPa
Compressors Alternator
Waste Heat Cooler
TurbineAssist
Low PwrRecuperator
Low Pressure
High Pressure
T=355 KT=498 K
20 MPa
5 kg/s
2 kg/s
3kg/s
7 MPa
Compressors Alternator
Waste Heat Cooler
TurbineAssist
Low PwrRecuperator
Low Pressure
High Pressure
T=355 KT=498 K
20 MPa
5 kg/s
2 kg/s
3kg/s
7 MPa
Heater
1 MWcapability
Compressors Alternator
Waste Heat Cooler
TurbineAssist
Low PwrRecuperator
Low Pressure
High Pressure
T=355 KT=498 K
20 MPa
5 kg/s
2 kg/s
3kg/s
7 MPa
Heater
1 MWcapability
1
23
5
6
6
T=825 K
Heater
Compressors
Turbineh = 0.94
Compressorh = 0.84
T=304.5 KP=7.5 MPa
Alternator
Waste Heat Cooler
Tfuel
~1070 K
Turbine
Recuperator
Low Pressure
High Pressure T=355 KT=498 K
20 MPa
T=683 K
4 7
T=707 K
T=505 K T=375K4.7 kg/s
1.88 kg/s819 kW
502 kW
~ 1086 kW ~707kW
317 kW197 kW605 kW 90 kW
2.82 kg/s
No Heater & ~40 kWe Motor
Up to 1 MW Heater & ~40 kWe Motor/AlternatorProduces Electricity
~1 MW Heater & ~40 kWe Motor/Alternator+ 300 kW Dynamometer Produces Limited Electricity
Phase 3 – Split Flow S-CO2 Brayton

18
• Expected interaction mode in PCHE –small cracks – form oxides or carbonates – could lead to plugging if not removed, E release not primary concern.
• Does not appear to be major issue for current Na outlet temperatures – but need to confirm
• Significantly less of a concern than water – Na reaction
• ABR program – constructing a small facility to investigate plugging issue (ANL)
• ABR will investigate Na CO2 interactions,
• Gen IV focus on cycle development
Gen IV Energy ConversionS-CO2 Interactions
• CO2 reaction with Na at higher temperatures • Japanese observed slow reactions below ~ 550 C, increasing
reaction rates above 550 C• Korean data (CO2 bubbled into Na Column) suggest some
reaction below ~ 550 C
Sodium-CO2 reaction (Japanese results)

19
CO2 / H2O Heat Exchanger
0-60 VAC5000 A
440 VAC, 770 A
TT
RELIEF
EXHAUST
PRESSURIZER
TO 25 kW CHILLER
DRAWING: CO2 LOOPSCHEMATIC # 3DRAWING NO.: CO2L79DRAWN BY: D. KILSDONKDATE: 10/7/04FILE: CO2L_LS3.DWG(AC70)
P
RELIEFEXHAUST
He
CO2
2 m
1 m
LEVELDETECTOR COLD
LEGHOTLEG
POWER SUPPLY
P
F TTW WTT WTT WTT FT
FT FT FT
FTTF
PP
TF
WT
= ABSOLUTE PRESSURE
= DIFFERENTIAL PRESSURE
= FLUID TEMPERATURE
= WALL TEMPERATURE
P
He CO2
PUMP
HEATRIC HX
FLOWMETER
0-60 VAC5000 A
440 VAC, 770 A
TT
RELIEF
EXHAUST
PRESSURIZER
DRAWING: CO2 LOOPSCHEMATIC # 4DRAWING NO.: CO2L80DRAWN BY: D. KILSDONKDATE: 10/7/04FILE: CO2L_LS4.DWG(AC70)
P RELIEF
EXHAUSTHe
CO2
1 m
LEVELDETECTOR
COLDLEG
HOTLEG
POWER SUPPLY
P
F TTW WTT WTT WTT FT
FT FT FT
FTTF
PP
TF
WT
= ABSOLUTE PRESSURE
= DIFFERENTIAL PRESSURE
= FLUID TEMPERATURE
= WALL TEMPERATURE
P
PUMP
HEATRIC HX
CO2 He
TT
RELIEF
EXHAUST
P
P
F FT
FTTF
25 kW CHILLER
COLDLEG
HOTLEG
PUMP
FLOWMETER
FLOWMETER
CO2 / CO2 Heat Exchanger Design
ANL S-CO2 Heat Transfer Loop

20
Gen IV Energy Conversion Objectives: Optimize performance and cost effectiveness of Gen IV reactors
Generator
CompressorStages
Turbine Stages
Heat Sink
Blower
Interstage Cooling
Interstage Heating
Gen IV RX
Motor
Generator
CompressorStages
Turbine Stages
Heat Sink
Blower
Interstage Cooling
Interstage Heating
Gen IV RX
Motor200
400
600
800
1000
1200
19 20 21 22 23 24 25 26 27 28entropy (j/g*K)
Tem
pera
ture
(K)
Rankine Bottoming CycleMulti Reheat - Interstage cooled Brayton Cycle
Cycle Efficiencies vs Source Temperature for fixed component efficiencies and system effectiveness
0%
10%
20%
30%
40%
50%
60%
200 300 400 500 600 700 800 900 1000
Source Temperature (°C)
Cyc
le E
ffici
ency
(%)
1t/1c rec He BraytonSCSF CO2 Brayton3t/6c IH&C He Brayton
Figure 13: T-s diagram for split flow recuperated Brayton cycle using CO2 bew een 7.5 and 22.5 MPa w ith 29% of the flow diverted by the intermediate com pressor
(eff=49%)
250
300
350
400
450
500
550
600
650
700
750
800
850
900
950
1000
1.5 1.7 1.9 2.1 2.3 2.5 2.7 2.9 3.1
entropy (J/g*K)
tem
pera
ture
(K)
phase dome
low er comp
LT HP rec
HT HP rec
Qin
turbine
HT LP rec
LT LP rec
Qrej
interm comp
Reactor
Generator
Motor
Main Compressor
Turbine Stages
Heat Sink
Motor
MotorRecompre
ssorLow Temp Recuperator
High Temp Recuperator
Split Flow S-CO2 Brayton Cycle
Brayton Cycle Options for Gen IV Reactors
Reactor
Generator
Motor
Compressor
Turbine
Generator
Motor
To Heat Sink
From heat sink
SteamTurbine
Pumping Stages
Circ
Steam DryerBypass
Circ
Figure 11: T-s plot for simple Brayton cycle using Helium flow at 6.9 and 23 MPa w ith SC steam bottoming cycle w ith mass flow ratio of 1.241 w ater/helium
(eff=48%)
300.00
400.00
500.00
600.00
700.00
800.00
900.00
1000.00
15.0 16.0 17.0 18.0 19.0 20.0 21.0 22.0 23.0 24.0
entropy (kJ/kg(helium)*K)
Tem
pera
ture
(K)
Q transfered
comp
Q in Brayton
turbine
steam dome
steam dome
Rankine pump
Q transfered
Q in Rankine
Steam Turbine
Q rejection