Embed Size (px)
Citation preview
MIDF RESEARCH is a unit of MIDF AMANAH INVESTMENT BANK
Kindly refer to the last page of this publication for important disclosures
22 November 2016 | Initiate Coverage
Superlon Holdings Berhad Initiate with BUY
Growth not cooling down Target Price (TP): RM2.89
INVESTMENT HIGHLIGHTS
• Market dominance in synthetic rubber insulation
• New warehouse to increase capacity by 30%
• Expect double-digit earnings growth in FY17F and FY18F
• Continuous improvement in processes and products
• We initiate coverage with a BUY call and TP of RM2.89
Business Overview:
Superlon manufactures synthetic rubber insulators mainly for heating,
ventilation and air-conditioning (HVAC) and refrigeration, which are
important components of high-rise buildings and industrial usage. The
company specialises in the usage of nitrile-butadiene rubber (NBR) to
produce sheets and tubes for thermal insulation.
Investment theses:
1. Market dominance in synthetic rubber insulation
Superlon is a market leader in Malaysia with an estimated market
share of 50% to 60%. It also exports to more than 50 countries
and is ranked top five in the world in terms of market presence.
2. New warehouse to boost capacity by 30%
The construction of its new warehouse is on track and that will
further optimise the production layout of its plant. We are
expecting increased production capacity by 30% in FY18.
3. Double-digit earnings growth in FY17F and FY18F
We expect earnings growth of 15% in FY17 and 12% in FY18
underpinned by export sales growth. Its main export countries,
Vietnam and India, are still growing strongly.
4. Decent dividend yield of 3.71% in FY17
We are expecting 9.5 sen dividend in FY17 translating into 3.71%
yield. Our estimation is backed by RM24.53m of Operating Cash
Flow and net cash of RM39.13m. Our assumption of 40% payout is
conservative as it is at the lower range of 40% to 50% in the past
3 years.
Valuation:
We initiate coverage on Superlon with a BUY recommendation and TP
of RM2.89 based on 12x price-to-earnings of its FY17F EPS estimated
at 24 sen. The valuation is premised on its 4-year mean PER.
RETURN STATS
Price (21 Nov 2016) RM2.56
Fair Value RM2.89
Expected Share Price
Return 12.7%
Expected Dividend Yield 3.7%
Expected Total Return +16.4%
STOCK INFO
KLCI 1,627.28
Bursa / Bloomberg 7235/ SLON MK
Board / Sector Main /
Industrial Products
Syariah Compliant Yes
Issued shares (m) 79.4
Par Value (RM) 0.50
Market cap. (RM’m) 203.26
Price over NA 2.17x
52-wk price Range RM1.69- RM2.60
Beta (against KLCI) 0.58x
3-mth Avg Daily Vol 0.3m
3-mth Avg Daily Value RM0.70m
Major Shareholders (%)
Hsiu-Lin Liu Lee 22.58
Transgrow Corp Sdn Bhd 5.71
Chan Keng Chung 5.53
Man-Tien Liu 5.50

MIDF RESEARCH Tuesday, 22 November 2016
2
INVESTMENT STATISTICS
FYE Apr FY13 FY14 FY15 FY16 FY17F
Revenue (RM’m) 58.88 61.79 74.51 90.41 100.18
Pretax Profit (RM’m) 3.90 7.47 12.55 21.36 25.12
Net Profit (RM’m) 4.27 5.85 9.38 16.66 19.09
EPS (sen) 5.04 7.37 11.82 20.98 24.05
EPS growth (%) - 46.25% 60.32% 77.58% 14.60%
PER (x) 50.80 34.73 21.66 12.20 10.65
Net Dividend (sen) 1.00 3.25 6.00 8.50 9.50
Dividend yield (%) 0.39% 1.27% 2.34% 3.32% 3.71%
Core EBIT margin (%) 7.80% 13.33% 15.65% 23.20% 23.62%
Source: Company, MIDF Research
Source: Bloomberg
DAILY PRICE CHART
Syed Muhammed Kifni Ng Bei Shan
[email protected] 03-2173 8461

MIDF RESEARCH Tuesday, 22 November 2016
3
A. KEY INVESTMENT THESES
Market dominance in Malaysia with 50% to 60% market share. Besides taking a leading position in the
synthetic rubber insulator market in Malaysia, Superlon exports to more than 50 countries globally. The diversification
of its markets provides a cushion for any softening in one particular region. It sells to distributors, sales agents,
project managers in these countries under its own brand. Top markets are Asia and Malaysia, making up ~88% of its
yearly turnover for the past three years. Due to the higher sales growth from other Asian countries, the percentage
contribution from Malaysia to its annual sales appeared to be on a down trend. In actuality, however, sales in
Malaysia ranged steadily from RM19.6m to RM20.4m for the past three years. We reckon that there is still room for
Superlon to increase its grip in strategic markets. It can also further expand its footprint in the future as its bigger
peers export to more than 100 countries.
Figure 1: Superlon’s annual sales based on regions
Source: Company, MIDF Research
Well positioned to capitalise on high growth markets. Asia is a high growth market for Superlon, with India
and Vietnam contributing the most. According to IMF, 2017 GDP growth forecast for India is 7.6% and Vietnam 6.2%.
Management is positive on the growth from these two countries as well as other Southeast Asian countries. The
economic growth, which spurs development in these two countries, will provide sales opportunities for Superlon. The
company has a geographical advantage as due to its close proximity to these high growth markets. It can price its
products competitively as it save on logistics cost to transport its products, which can be bulky, to the sales
destinations.
Dynamic sales strategies to meet demands from different markets. Superlon continues to expand into new
markets including some countries in the African continent. It targets to enter two new countries every year. Sales to
Africa surged by 91% from RM1.86m in FY15 to RM3.56m in FY16. America, which contributes ~5% to Superlon’s
annual income, saw a jump in sales by 27% from RM3.43m in FY15 to RM4.34m in FY16. We like management’s
proactive marketing strategy in penetrating new markets albeit with a focus on the high-growth region. It also adopts
2014 2015 2016
Africa 4% 2% 4%
America 5% 5% 5%
Asia 55% 62% 66%
Europe 2% 1% 1%
Malaysia 32% 27% 22%
Oceania 3% 2% 1%
0%
10%
20%
30%
40%
50%
60%
70%
Percentage of annual sales
Geographical Sales

MIDF RESEARCH Tuesday, 22 November 2016
4
sales strategies that meet specific market needs. It will be hard to replicate the export experience and the network
Superlon has built in more than two decades.
New warehouse to boost production capacity by 30% in FY18. The construction of the new warehouse near
its existing plant is on track for completion by year-end. Upon commencement of the facility, the bottleneck issue
should be eased and the higher production capacity will be able to support its sales orders. We expect Superlon’s core
EBIT margin to improve further due to layout optimisation that will lead to better work processes. More importantly,
the new warehouse is expected to shorten lead time and response time to its clients thus, improving sales. The
RM12m project is funded through a combination of internally-generated fund and bank loan but the management has
yet to drawdown its approved loan. Full-year earnings impact from the new facility is expected in FY18.
Core EBIT margin almost tripled from FY13 to FY16 due to higher volume, average selling prices, strong USD
and better efficiencies. The core EBIT margins exclude other losses and gains, which are largely attributed to forex
gains and/or losses. Its core EBIT margin jumped from 7.8% in FY13 to 23.2% in FY16. In 1QFY17, its core EBIT
margin improved to a record 27.53% even though USD/MYR rate has stabilised during that period. We also note that
Superlon’s core EBIT margin has grown faster than USD strength in the past few years. Going forward, we expect its
core EBIT margin to stay above 20%, ranging from 22% to 25%, as the company managed to improve the
formulation of its product, bring down rejection rate and increase production efficiencies. As Superlon catches up in its
sales volume in the future, it could benefit from economies of scale and possibly bring its costs even lower.
Figure 2: Superlon’s core EBIT margins in comparison with average USD/MYR exchange rates
Source: Bloomberg, MIDFR
Not just a USD play. Superlon is indeed a net beneficiary of a strong USD play but it has proven that, a stronger
greenback is only one of the many growth factors for its profitability. Superlon can benefit from a strong USD in two
ways: i) export sales in USD, which will be translated into higher sales in ringgit, ii) forex gain due to hedging as a
course of its normal business activities. Based on the gross profit margin and EBITDA margin charts, we can see that
Superlon is getting increasingly profitable from FY13 to FY16. There are four main factors that contribute to its
improving performance and these factors may cushion one another if one of the factors weakens. For example, if
sales volume is low, it may be offset by higher ASP as it sells high value products in smaller quantity.
MIDF RESEARCH Tuesday, 22 November 2016
5
Its improving earnings are attributable to:
1. Higher volume
• Achieved through higher demand from existing and new customers
• Boosted by the increasing number of construction projects
• FY13-FY16 volume CAGR was 13.6%. Volume increased by 12.8%yoy to 6,658 tonnes in FY16
2. Higher average selling price
• ASP is determined by the product type and specifications as well as supply and demand
• The company thrives on R&D to produce higher value products such as acoustic products
3. Strong USD/MYR exchange rates
• Superlon is a net beneficiary of strong USD/MYR rates as ~70% of its sales are in USD while 45%-
50% of its costs are denominated by the greenback.
4. Better cost efficiencies
• The improvement of product formulation and work processes will result in better cost efficiencies and
higher profit margins for the company. Its cost of sales has improved from 77.9% in FY13 to 61% in
FY16, marking a cut of 16.9 percentage points.
Hands-on management. Superlon was founded by Jessica Liu, who has been in the rubber thermal insulation
industry for 33 years. Prior to setting up Superlon in Malaysia, she co-founded TransAsia Rubber Industrial Co Ltd in
Taiwan. Her son, Liu Han-Chao (34 of age), is an executive director in the company focusing on sales and marketing.
He has more than 11 years of sales and marketing experience with Superlon. Collectively, the Lius own ~33% in
Superlon. Superlon’s board also consist of professional directors with experience in accounting, corporate finance and
legal matters. (Refer to appendix Part III for details)
B. FINANCIAL HIGHLIGHTS
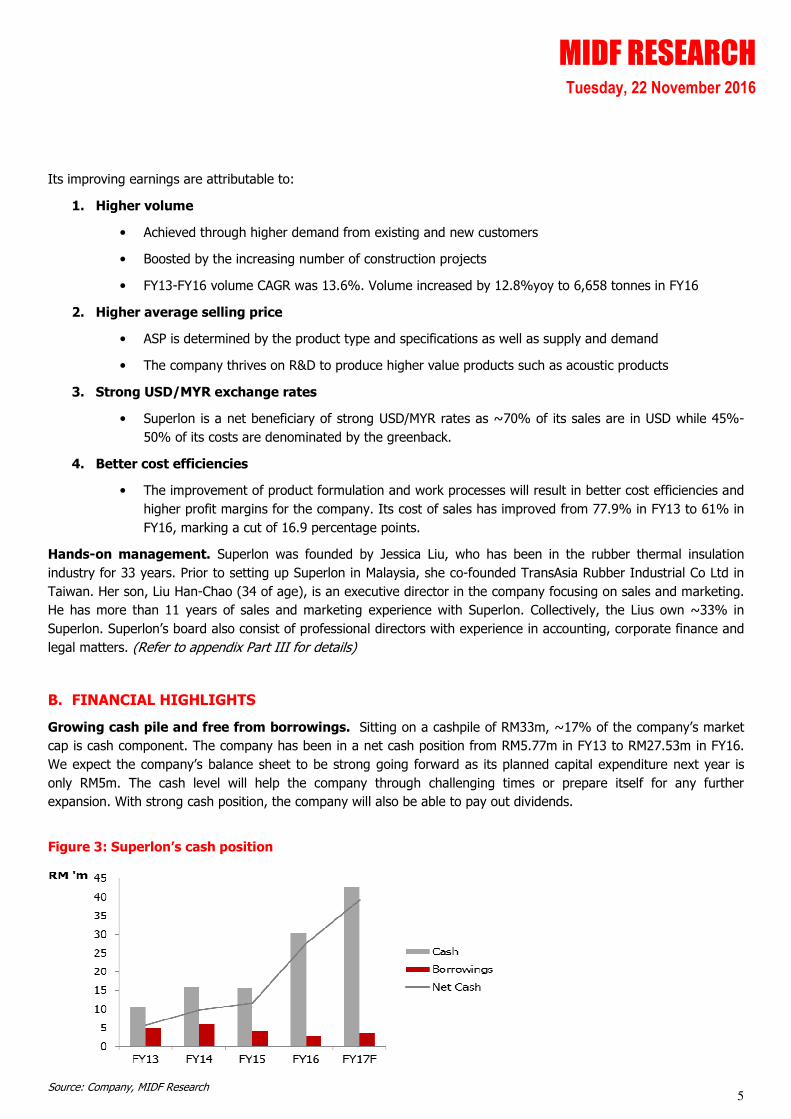
Growing cash pile and free from borrowings. Sitting on a cashpile of RM33m, ~17% of the company’s market
cap is cash component. The company has been in a net cash position from RM5.77m in FY13 to RM27.53m in FY16.
We expect the company’s balance sheet to be strong going forward as its planned capital expenditure next year is
only RM5m. The cash level will help the company through challenging times or prepare itself for any further
expansion. With strong cash position, the company will also be able to pay out dividends.
Figure 3: Superlon’s cash position
Source: Company, MIDF Research

MIDF RESEARCH Tuesday, 22 November 2016
6
Steadily rising dividend. Although the company has not set a fixed dividend policy, it has been paying out
generous dividends to its shareholders. Its payout ratio from FY13 to FY16 ranges from 20% to 51%. We expect a
payout ratio of ~40%. This will be supported by its strong balance sheet and operating cashflow. The dividend yield is
expected to range around 4% going forward, which is decent for a growth company.
Figure 4: Superlon’s DPS and dividend yield
Source: Company, MIDF Research
Stable sales growth and improving net profit margins. Superlon has achieved an impressive FY13-FY16 sales
CAGR of 15%. Its net profit CAGR during the same period was even more remarkable at 57%. The jump in its
revenue and net profits are primed on higher volume, ASP, stronger USD, favourable raw material costs and increased
efficiencies. Going forward, we may see a more normalised growth rate but still expect an ascend in the company’s
growth due to sustainable demand in Asia and better work processes after the completion of its new warehouse.
Figure 5: Superlon’s revenue, profits and profit margin
Source: Company, MIDF Research

MIDF RESEARCH Tuesday, 22 November 2016
7
C. PEER COMPARISON
Top 5 players globally. There are many synthetic rubber insulator manufacturers globally in the rather fragmented
market. In the high-quality synthetic rubber insulator segment, Armacell, KFlex and Aeroflex are among the top
players. Superlon is also one of the top 5 players in terms of market presence. Each of them has their strengths and
dominance in certain markets. Stacking up against these companies, Superlon is small in size but displays high
potential especially in terms of profitability with its ROA increasing from 6% in FY13 to 16% in FY16. A quick
comparison also shows that the bigger companies are still growing well in sales and profits, suggesting that the
industry outlook is promising.
Figure 6: Snapshot of the top players
Superlon Armacell KFlex Aeroflex
Sales RM61.79m in FY14 RM2.05b (~EUR452m)
in 2014
RM1.23b (~EUR270m)
in 2013
RM252.12m (THB2.12b)
in FY14
Sales
CAGR*
FY12-FY15
10%
2012-2015
8%
2010-2013
7.6%
FY14-FY16
11%
Main products Insulation materials (~94% of sales)
Insulation (77% of sales), engineered
foams (23% of sales)
Thermal insulation, acoustic insulation, fire
protection
Thermal insulator
Manufacturing sites
1 in Klang, Malaysia 23 sites in 16 counties (China, Thailand, India,
Brazil, Saudi Arabia, South Korea, Turkey,
Canada, Russia etc.)
9 sites in 8 countries (Italy, China, West
India etc.)
7 sites in Thailand, US, Germany, China
(Shanghai and Jiangsu), Switzerland, India
Workforce ~160 2,800 >2,000 N/A
Main markets by sales
Asia 62%, Malaysia 27%, America 5%
EMEA 40%, Americas 39%,
APAC 21%
Europe, Asia, America Thailand, US, Asia
Establishment 1992 (24 years) 1954 (62 years) and was known as Armstrong
World Industries before
a management buyout in 2000.
1989 (27 years) 1978 (38 years) under Eastern Polymer
Industry Co Ltd. Aeroflex
is one of Eastern Polymer Group’s (EPG)
three main businesses.
Headquarter Malaysia Germany Italy Thailand
Sources: Company websites, annual reports, Bloomberg, MIDFR
*Based on latest available comparable data

MIDF RESEARCH Tuesday, 22 November 2016
8
D. INDUSTRY OVERVIEW
Industry expansion still on an upward trajectory. The HVAC insulation market is still at its high-growth phase
especially in Asia. Demand comes mainly from new insulation required as opposed to the replacement market. This is
due to the long product life of the high quality NBR that can last up to ten years or more. Due to the better quality,
Superlon was able to position itself in the premium segment and hence its pricing power. Compared to its bigger
peers, Superlon’s gross profit margins and EBITDA margins have shown exceptional growth in the past few years.
Notably, its gross profit margin has exceeded Aeroflex’s in FY16 while its EBITDA margin has outperformed Armacell’s
in 2015. Looking at Superlon’s track record, it is possible to grow bigger as it expands its market share. The company
is considerably younger (24 years) compared to its bigger rivals (27 to 62 years). In our opinion, Superlon’s growth
rate could match its bigger peers’, if not exceeding theirs.
Figure 7: Superlon and Aeroflex’s GP margins Figure 8: Superlon and Armacell’s EBITDA margins
Sources: Company reports, Bloomberg, MIDFR *Superlon’s financial year ends in April and EPG’s (Aeroflex’s parent company) financial year ends in March. **The period (axis-x) is illustrated for comparison purposes. Superlon’s EBITDA margins are charted based on its FY13-FY16 figures.
NBR insulator is widely used in HVAC insulation due to its favourable properties. The common types of
building thermal insulation include fibre glass, mineral wool and synthetic rubber. They are used specifically based on
their unique properties and the end users’ budget. Synthetic rubber is widely used due to its versatile characteristics
and ease of installation. Among the many variations of synthetic rubber, nitrile butadiene rubber (NBR) is one of the
most popular choices partly as it has been proven as an effective material for thermal insulation long time ago. This is
the main compound of Superlon’s products. The quality of NBR rubber lies in its formulation, which in turn results in
its technical properties. Coupled with after sales service and technical training, the superior quality of Superlon’s
products helps it secure the leading position in the local market.
New NBR products like acoustic products are fruits of tireless research. On top of being recognised as a
high-quality thermal insulator brand, Superlon aims to be innovative in the application of elastomeric acrylonitrile
butadiene rubber across other industries. The versatility of nitrile rubber makes it suitable in various sectors ranging
from HVAC, heating and plumbing, construction, refrigeration, fire stopping, oil and gas, solar, automotive as well as
sports and leisure. For instance, it is used in sports equipment as grips or exercise mats. Besides producing its bread
and butter products, Superlon innovates continuously and has introduced new acoustic products that insulate sound
recently. As the product is still new, it will take time to see its reception. We are positive on this development as it
shows that the company does not rest its laurels on research and product innovation. We believe that this will lead to
a wider range of product introduction in the long-term. Management also plans to apply for more certifications so that
the usage of its products can be broadened further.

MIDF RESEARCH Tuesday, 22 November 2016
9
Figure 9: Example of Superlon’s NBR insulator and its properties
Properties of Superlon’s NBR insulator
1. Fire resistant: Class 1, Class O, UL94, FM approved
2. Service temperature of -50°C to 105°C
3. High tensile strength: 200-280 kPa high elasticity, hence better resistance to tear and abrasion
4. Low water vapour permeability and absorption with moisture resistance factor of 7,000 to 10,000.
5. Low thermal conductivity
6. Good resistance to oil, water and solvents
7. Excellent compression set which reduce chances of deformation
8. Low allergen as it is dust and fiber free
9. Environmental friendly properties like zero ozone depleting potential, zero global warming potential and low volatile organic compounds.
Sheet type products
Tube type products
Source: Company, MIDF Research
Growing demand for thermal insulation. The global insulation market size recorded and estimated USD44.46b in
2015, according to market researcher Grand View Research. It expected the market to grow at a CAGR of 8.5%
between 2016 and 2024 as energy conservation measures are expected to drive growth. According to another market
research, Markets and Markets, the market size for building thermal insulation was reported at USD22.7b. The
independent market researcher expects the building thermal insulation CAGR from 2016 to 2021 to be 3.5%. Higher
environmental awareness, the increasing need to control energy costs and stricter energy-saving rules drive demand
for thermal insulation. The industry rides on the increasing emphasis of energy efficiency and urbanisation.
Higher standards in construction expedite growth. The usage of thermal insulation is strongly correlated with
the growth of construction industry especially in the high-rise and industrial segments. As the income per capita of a
country improves, the requirements usually follow suit to match the higher standards of living with better quality
thermal insulator. The usage of thermal insulation is underpinned by the growth in the construction sector and the
growing demand for heating, ventilation and air-conditioning systems. Substitution of backdated materials that could
be hazardous to safety and health issues had led to the increase in the market share of other insulators. One example
is the restricted usage of asbestos after it was found to be carcinogenic. About 60 countries have banned the usage of
asbestos in whole or in part. They include: Australia, Italy, France, Japan, South Korea and the United Kingdom.

MIDF RESEARCH Tuesday, 22 November 2016
10
Developing nations are huge markets for thermal insulation. Asia is projected with the highest growth in the
next decade compared to other regions. The global construction industry is estimated to grow by an annual average
of 3.2% from 2015 to 2024 led by Asia, according to Business Monitor International. This is followed by North
America and Western Europe while the other regions will come from a low base. Synthetic rubber insulators are also
bulky and that will increase the cost of transportation. Having facilities close to the target markets will enable savings
of logistics cost. Superlon will have the geographical advantage due to its proximity to its main markets like India,
Vietnam, Malaysia and other Southeast Asian countries.
Figure 10: Global nominal construction industry value forecast in USD billion
Source: Business Monitor International, MIDFR
E. VALUATIONS
We derive a fair value of RM2.89 based 12x FY17F PER. The 12x PER pegged is premised on its 4-year average
PE. We believe that our 4-year period selection is justified as it reflects the current business structure as the company
has sold off its then loss making steel unit in FY12. On its dividend, we expect the company to reward the shareholder
with 9.5 sen per share in FY17, assuming a payout ratio of 40%. The company’s payout ratio has ranged from 44%
in FY14, 51% in FY15 and and 40.5% in FY16.
Figure 11: Key assumptions affecting earnings
USD/MYR exchange rate for FY17 4.1
Volume of insulation materials sold (tonnes) 6906
Source: MIDF Research
0
500
1000
1500
2000
2500
3000
Asia North
America,
Western
Europe
Latin America Middle East,
North Africa
Central
Eastern
Europe
Sub-Saharan
Africa
Nom
inal
constr
uction in
dustr
y valu
e (U
SD
'b)
Global nominal construction industry value forecast
2015
2024
MIDF RESEARCH Tuesday, 22 November 2016
11
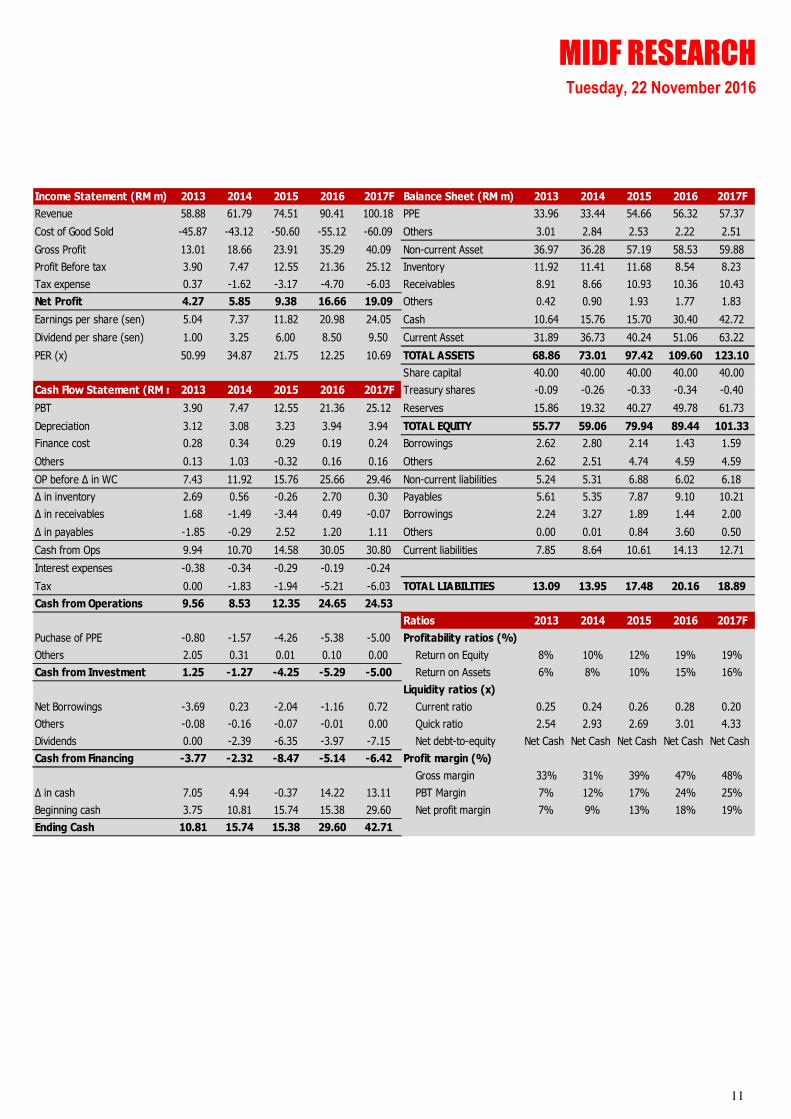
Income Statement (RM m) 2013 2014 2015 2016 2017F Balance Sheet (RM m) 2013 2014 2015 2016 2017F
Revenue 58.88 61.79 74.51 90.41 100.18 PPE 33.96 33.44 54.66 56.32 57.37
Cost of Good Sold -45.87 -43.12 -50.60 -55.12 -60.09 Others 3.01 2.84 2.53 2.22 2.51
Gross Profit 13.01 18.66 23.91 35.29 40.09 Non-current Asset 36.97 36.28 57.19 58.53 59.88
Profit Before tax 3.90 7.47 12.55 21.36 25.12 Inventory 11.92 11.41 11.68 8.54 8.23
Tax expense 0.37 -1.62 -3.17 -4.70 -6.03 Receivables 8.91 8.66 10.93 10.36 10.43
Net Profit 4.27 5.85 9.38 16.66 19.09 Others 0.42 0.90 1.93 1.77 1.83
Earnings per share (sen) 5.04 7.37 11.82 20.98 24.05 Cash 10.64 15.76 15.70 30.40 42.72
Dividend per share (sen) 1.00 3.25 6.00 8.50 9.50 Current Asset 31.89 36.73 40.24 51.06 63.22
PER (x) 50.99 34.87 21.75 12.25 10.69 TOTAL ASSETS 68.86 73.01 97.42 109.60 123.10
Share capital 40.00 40.00 40.00 40.00 40.00
Cash Flow Statement (RM m)2013 2014 2015 2016 2017F Treasury shares -0.09 -0.26 -0.33 -0.34 -0.40
PBT 3.90 7.47 12.55 21.36 25.12 Reserves 15.86 19.32 40.27 49.78 61.73
Depreciation 3.12 3.08 3.23 3.94 3.94 TOTAL EQUITY 55.77 59.06 79.94 89.44 101.33
Finance cost 0.28 0.34 0.29 0.19 0.24 Borrowings 2.62 2.80 2.14 1.43 1.59
Others 0.13 1.03 -0.32 0.16 0.16 Others 2.62 2.51 4.74 4.59 4.59
OP before ∆ in WC 7.43 11.92 15.76 25.66 29.46 Non-current liabilities 5.24 5.31 6.88 6.02 6.18
∆ in inventory 2.69 0.56 -0.26 2.70 0.30 Payables 5.61 5.35 7.87 9.10 10.21
∆ in receivables 1.68 -1.49 -3.44 0.49 -0.07 Borrowings 2.24 3.27 1.89 1.44 2.00
∆ in payables -1.85 -0.29 2.52 1.20 1.11 Others 0.00 0.01 0.84 3.60 0.50
Cash from Ops 9.94 10.70 14.58 30.05 30.80 Current liabilities 7.85 8.64 10.61 14.13 12.71
Interest expenses -0.38 -0.34 -0.29 -0.19 -0.24
Tax 0.00 -1.83 -1.94 -5.21 -6.03 TOTAL LIABILITIES 13.09 13.95 17.48 20.16 18.89
Cash from Operations 9.56 8.53 12.35 24.65 24.53
Ratios 2013 2014 2015 2016 2017F
Puchase of PPE -0.80 -1.57 -4.26 -5.38 -5.00 Profitability ratios (%)
Others 2.05 0.31 0.01 0.10 0.00 Return on Equity 8% 10% 12% 19% 19%
Cash from Investment 1.25 -1.27 -4.25 -5.29 -5.00 Return on Assets 6% 8% 10% 15% 16%
Liquidity ratios (x)
Net Borrowings -3.69 0.23 -2.04 -1.16 0.72 Current ratio 0.25 0.24 0.26 0.28 0.20
Others -0.08 -0.16 -0.07 -0.01 0.00 Quick ratio 2.54 2.93 2.69 3.01 4.33
Dividends 0.00 -2.39 -6.35 -3.97 -7.15 Net debt-to-equity Net Cash Net Cash Net Cash Net Cash Net Cash
Cash from Financing -3.77 -2.32 -8.47 -5.14 -6.42 Profit margin (%)
Gross margin 33% 31% 39% 47% 48%
∆ in cash 7.05 4.94 -0.37 14.22 13.11 PBT Margin 7% 12% 17% 24% 25%
Beginning cash 3.75 10.81 15.74 15.38 29.60 Net profit margin 7% 9% 13% 18% 19%
Ending Cash 10.81 15.74 15.38 29.60 42.71

MIDF RESEARCH Tuesday, 22 November 2016
12
F. INVESTMENT RISKS
Hike in raw material prices. Raw material makes up ~70% of Superlon’s cost. The main material used is NBR,
which is made up of acrylonitrile and butadiene. Price trends of these two materials are positively correlated to crude
oil prices. However, we do not expect a sharp hike in crude oil prices as our house forecast for Brent crude averages
at USD50 per barrel in 2017. Premised on this assumption, we do not expect escalating costs due to high raw material
prices. We expect FY17F costs to be similar to FY16 due to the improved formulation, less wastage as a result of
efficiencies and improved economies of scale as a result of higher production capacity.
Global recession. A global recession will slow down development activities around the world and that will reduce the
demand for Superlon’s thermal insulation products. That will adversely affect its sales volume and ASP. Nonetheless,
we reckon that its high margins able to cushion risks. In the event if a slowdown in the market, Superlon will still have
the room to be able to maintain its competitiveness without compromising its profitability.
Weakening of USD. A weaker USD may translate into a normalised profit margin for Superlon as it is a net
beneficiary of a strong USD. On the flipside, the lower sales will be offset by lower input cost as ~70% of its raw
materials are imported. Note that that even when USD/MYR rate was trading between 3.00 and 3.40, Superlon was
able to record core EBIT margins of 8% to 16%. We expect USD/MYR exchange rate to average at 4.10 in 2017.
Emergence of a better and cheaper thermal insulator. A new product that can replace NBR as a preferred
thermal insulator could risk the demand for Superlon’s products. That said, NBR has been used as a thermal insulator
for a long period of time and was proven to be a reliable and long-lasting material so it will take time for the new
product to prove itself.
MIDF RESEARCH Tuesday, 22 November 2016
13
APPENDIX
I. Company background
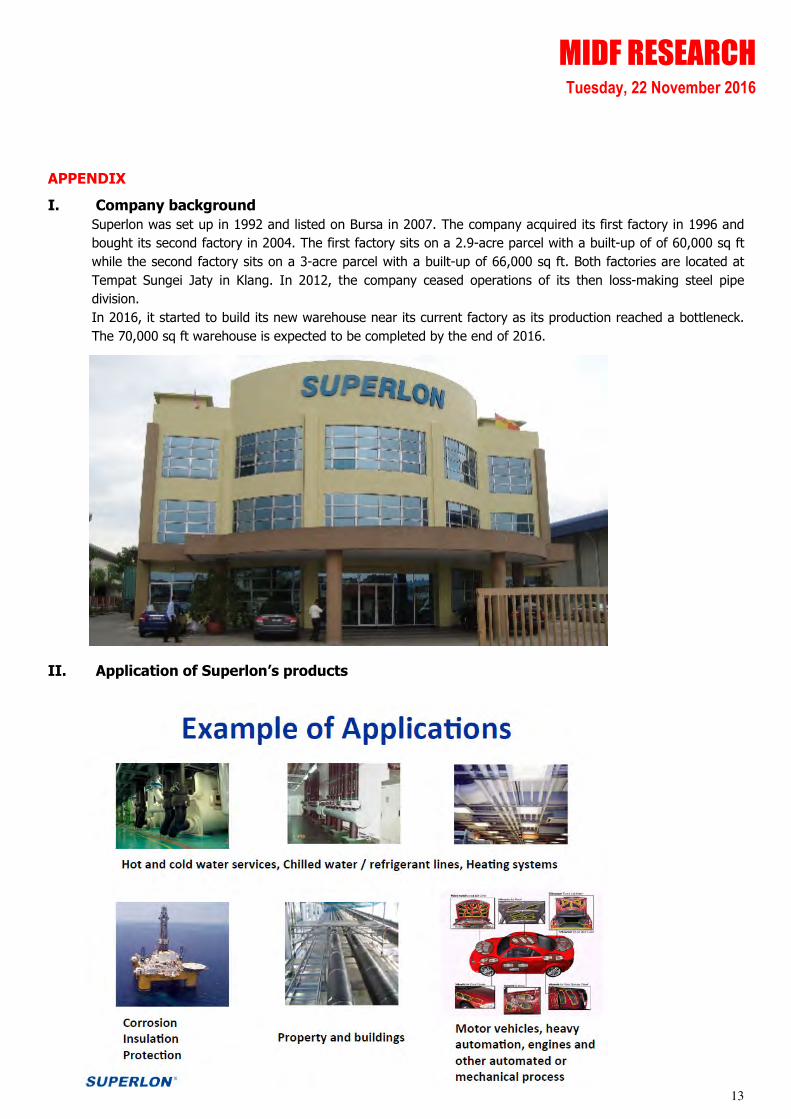
Superlon was set up in 1992 and listed on Bursa in 2007. The company acquired its first factory in 1996 and
bought its second factory in 2004. The first factory sits on a 2.9-acre parcel with a built-up of of 60,000 sq ft
while the second factory sits on a 3-acre parcel with a built-up of 66,000 sq ft. Both factories are located at
Tempat Sungei Jaty in Klang. In 2012, the company ceased operations of its then loss-making steel pipe
division.
In 2016, it started to build its new warehouse near its current factory as its production reached a bottleneck.
The 70,000 sq ft warehouse is expected to be completed by the end of 2016.
II. Application of Superlon’s products

MIDF RESEARCH Tuesday, 22 November 2016
14
III. Directors and Key Management
Lim E @ Lim Hoon Nam
Independent Non-
Executive Chairman Malaysian
Male Aged 72
Lim Hoon Nam was appointed to the Board on 31 January 2007. He holds a Bachelor’s degree in Accountancy from National Chengchi University, Taiwan
and Bachelor degree in Commerce from Otago University, New Zealand. He is a
member of the Malaysian Institute of Accountants, Malaysian Institute of Certified Public Accountants and Chartered Accountants of Australia and New
Zealand. He has been practising as an accountant since 1977 under his own audit firm, Lim Hoon Nam & Co.
Liu Lee, Hsiu-Lin @
Jessica H. Liu Managing Director and
Chief Executive Officer Taiwanese & Australian
Female
Aged 59
Jessica Liu was appointed to the Board on 31 January 2007. She graduated
from Ming Chuan Commercial and Management College, a local college in Taiwan with a Secretarial Science and Management degree qualification in
1978. In 1983, she co-founded TransAsia Rubber Industrial Co Ltd, a Taiwanese
company principally involved in the manufacturing of rubber thermal insulation
products and she was a Director and shareholder of the company from 1983 to 1997. In 1992, she founded Villa Mutiara Sdn Bhd manufacturing rubber
insulation and the company’s name was subsequently changed to Superlon Worldwide Sdn Bhd.
Jessica H. Liu has more than 33 years’ working experience in the rubber
thermal insulation industry and has to-date accumulated in-depth knowledge in management skills and the business of the thermal insulation industry.
She does not hold any directorships in any other public companies. Apart from her son, Liu Han-Chao, who is also an Executive Director of the Company, she
does not have any family relationship with any of the Directors of the Company.
She is a major shareholder of the Company.
Liu Han-Chao Executive Director
Australian
Male Aged 34
Liu Han-Chao was appointed to the Board on 6 November 2007. He graduated with a Diploma in Business major in marketing and a Bachelor of Business
degree with double major in Management and Marketing from Queensland
University of Technology, Australia in 2005. He joined the Superlon group in November 2005 as Sales and Marketing Manager of Superlon Worldwide Sdn
Bhd. He was subsequently appointed to the position of Senior Manager in January 2007.
Currently, Liu Han-Chao is the head of the Marketing Department where he is
responsible for formulating marketing and business strategies for new markets, implementing marketing and business strategies and developing marketing
programmes to measure and forecast market demand within the Superlon group.
Apart from his mother, Liu Lee, Hsiu-Lin @ Jessica H. Liu who is also the Managing Director and a major shareholder of the Company, he does not have
any family relationship with any of the Directors of the Company.
Ongi Cheng San Executive Director
Malaysian
Male Aged 45
Ongi Cheng San was appointed to the Board on 25 March 2010. He is a member of the Association of Chartered Certified Accountants, UK and a
Chartered Accountant registered with the Malaysian Institute of Accountants.
Ongi Cheng San has over 23 years of working experience in finance and accounting. He was appointed as Accountant in Superlon Worldwide Sdn Bhd in
June 2003 and prior to his appointment as Executive Director, he was the Chief Accountant who is responsible for corporate, finance, accounting, secretarial,
taxation and audit matters of the Group. Prior to joining the Group, he has been working for listed and unlisted companies involved in automotive parts,
securities trading and construction.
Chun Kwong Pong Non-Independent
Non-Executive
Director Malaysian
Chun Kwong Pong was appointed to the Board on 24 October 2007. He graduated from Monash University, Australia in 1993 with a Bachelor of
Business (Accounting) and is a Chartered Accountant registered with the
Malaysian Institute of Accountants and a Certified Practising Accountant under CPA Australia. He is currently a Director of cfSolutions Sdn Bhd, a corporate

MIDF RESEARCH Tuesday, 22 November 2016
15
Male Aged 44
finance advisory company licensed under the Capital Market and Services Act, 2007.
He was formerly with a property development company listed on the Main Market of Bursa Malaysia Securities Berhad from 2000 to 2005 and last held the
position of General Manager, Corporate Planning. From 1997 to 2000, he worked with AmInvestment Bank Berhad’s Corporate Finance Department
where he handled flotations, restructurings, fund raising as well as mergers
and acquisitions. Prior to that, he was with Ernst & Young where he has audited companies from a spectrum of industries.
Chun Kwong Pong is serving as an Independent Non-Executive Director on the Board of Fusionex International PLC, a software company listed on the London
Stock Exchange’s Alternative Investment Market.
Lim Wee Keong Independent Non-
Executive Director Malaysian
Male
Aged 43
Lim Wee Keong was appointed to the Board on 27 March 2008. He graduated from University of Sheffield, UK in 1996 with B. A. (Hons) in Accounting and
Financial Management. He has more than 18 years’ experience in business development, production and engineering operations, accounting and
management. He started work with the banking industry for 3 years where he
held a position as Credit and Marketing Executive. His main job scope included credit management, business analysis, evaluation and presentation of credit
proposal. Subsequently, he worked with Villa Mutiara Sdn Bhd as Finance Manager from 1999 to 2002 where his main scope of responsibility was
overseeing the financial planning and accounting operations, production and
engineering operations of its group of companies. Currently, Lim Wee Keong is the Technical Operations Director for Bacfree-Trident Water group of
companies, a medium-sized water treatment equipment provider with business operations in Malaysia, Singapore and the United Kingdom. His main functions
include the management of production and engineering operations, management system design, process engineering, strategic planning and
implementation and research and development.
Yee Wei Meng Non-Independent
Non-Executive
Director Malaysian
Male Aged 38
Yee Wei Meng was appointed to the Board on 1 January 2013. He holds a Master degree in Business Admin from Charles Sturt University, Australia, CLP
Malaysia and LL.B (Hons) from University of Leicester, England.
Yee Wei Meng is a qualified lawyer in Malaysia. Prior to 2004, he worked as legal assistant in various advocates and solicitors firms where he was
responsible for conveyancing, corporate finance and litigation matters for two years.
He has served on the Board of Fontern International group of companies
involving in all kinds of business such as steel & hardware trading, oil palm & rubber plantations, plantations development, property & share investment,
business investment acquisition, property development and hotel industry and assured the role as the Group Managing Director since 2004. He is also in
charge of daily business operations, accounts, legal matters, marketing and business expansion.
Yee Wei Meng is an Executive Director of Malaysia Pacific Corporation Berhad,
a company listed on Bursa Malaysia Securities Berhad. Yee Wei Meng is an indirect substantial shareholder of Superlon by virtue of his
direct and indirect interests in Transgrow Corporation Sdn Bhd, Fontern Capital Sdn Bhd and Fontern Holdings (M) Sdn Bhd.
Joanna, Chuang Pi Ju Executive Assistant to
Managing Director Taiwanese
Female
Aged 38
Joanna Chuang Pi Ju is the Executive Assistant to Managing Director for Superlon Worldwide Sdn Bhd. She obtained a Master in Business Administration
from University of Central Oklahoma in 2004. Joanna worked in the ASE group for three years until 2008 as Senior Financial Executive. She joined the
Superlon Group as Logistics and Shipping Executive in February 2009. She was
promoted to Marketing Manager to handle sales and export matters and maintaining customer relationship. Since January 2015, she was appointed as
the Executive Assistant to Managing Director. She now assists the Managing Director in overseeing the operations and handling human resources and

MIDF RESEARCH Tuesday, 22 November 2016
16
administrative matters.
Fu Shih-Kang
Production Manager Taiwanese
Male
Aged 36
Fu Shih-Kang is Production Manager for Superlon Worldwide Sdn Bhd. He holds
a Bachelor’s degree from Yuanpei University of Medical Technology. Fu, Shih-Kang worked in a chemical manufacturing company in Taiwan for three years
until 2010 as Chemical Engineer & Formulation Manager. He joined the
Superlon as Assistant Research & Development Manager. He was promoted to R&D Manager to oversee the production development and product research
and development. Since January 2015, he was appointed as Production Manager. He now oversees the factory management, production development
as well as product research and development.
Source: Company
MIDF RESEARCH Tuesday, 22 November 2016
17
MIDF RESEARCH is part of MIDF Amanah Investment Bank Berhad (23878 - X).
(Bank Pelaburan)
(A Participating Organisation of Bursa Malaysia Securities Berhad)
DISCLOSURES AND DISCLAIMER
This report has been prepared by MIDF AMANAH INVESTMENT BANK BERHAD (23878-X). It is for
distribution only under such circumstances as may be permitted by applicable law.
Readers should be fully aware that this report is for information purposes only. The opinions contained
in this report are based on information obtained or derived from sources that we believe are reliable.
MIDF AMANAH INVESTMENT BANK BERHAD makes no representation or warranty, expressed or
implied, as to the accuracy, completeness or reliability of the information contained therein and it
should not be relied upon as such.
This report is not, and should not be construed as, an offer to buy or sell any securities or other
financial instruments. The analysis contained herein is based on numerous assumptions. Different
assumptions could result in materially different results. All opinions and estimates are subject to
change without notice. The research analysts will initiate, update and cease coverage solely at the
discretion of MIDF AMANAH INVESTMENT BANK BERHAD.
The directors, employees and representatives of MIDF AMANAH INVESTMENT BANK BERHAD may
have interest in any of the securities mentioned and may benefit from the information herein.
Members of the MIDF Group and their affiliates may provide services to any company and affiliates of
such companies whose securities are mentioned herein This document may not be reproduced,
distributed or published in any form or for any purpose.
MIDF AMANAH INVESTMENT BANK : GUIDE TO RECOMMENDATIONS
STOCK RECOMMENDATIONS
BUY Total return is expected to be >15% over the next 12 months.
TRADING BUY Stock price is expected to rise by >15% within 3-months after a Trading Buy rating has been
assigned due to positive newsflow.
NEUTRAL Total return is expected to be between -15% and +15% over the next 12 months.
SELL Total return is expected to be <-15% over the next 12 months.
TRADING SELL Stock price is expected to fall by >15% within 3-months after a Trading Sell rating has been
assigned due to negative newsflow.
SECTOR RECOMMENDATIONS
POSITIVE The sector is expected to outperform the overall market over the next 12 months.
NEUTRAL The sector is to perform in line with the overall market over the next 12 months.
NEGATIVE The sector is expected to underperform the overall market over the next 12 months.


![Head of Middle East/ South Asia Markets ICIS · PDF fileHead of Middle East/ South Asia Markets ICIS Singapore ... Head of Middle East, South Asia Markets. ... [Pata] GAIL HDPE/LLDPE](https://img.pdfslide.net/doc/110x75/5aa1714f7f8b9a84398ba14c/head-of-middle-east-south-asia-markets-icis-of-middle-east-south-asia-markets.jpg)