Embed Size (px)
Citation preview

Supervisory Stress Testing at the Federal
Reserve
1
The views expressed here are those of the author and do not represent the views of the Board of Governors of the Federal Reserve System.
October 19, 2016

History and Purpose
2

Stress Testing at the Federal Reserve
3
• The financial crisis highlighted the importance of forward-looking capital adequacy assessment, rather than a point in time assessment.
• First use of stress testing as a supervisory tool began with 2009 Supervisory Capital Assessment Program (SCAP).
• Dodd-Frank Act (DFA) enacted in 2010 requires both supervisory and company-run stress tests.
– DFA supervisory stress testing applies to banks with assets greater than $50billion.
– Company-run stress testing applies to banks with assets greater than $10billion.

Stress Testing and Capital Planning for Large BHCs
4
• Comprehensive Capital Analysis and Review (CCAR) applies only to banks with assets $50 billion or greater.
– The capital plan rule that governs CCAR does not apply to banks with assets less than $50 billion.
• CCAR includes qualitative review of capital planning process and aquantitative component (post-stress capital analysis).
– BHCs submit internal stress test results and capital plans
– Federal Reserve supervisors review the capital planning process. Expectations vary by size and complexity.
– Federal Reserve runs DFA supervisory stress test with BHCs’ planned capital actions. BHCs must meet all applicable minimum capital ratios.
• Federal Reserve can object to a BHC ’s capital plan and capital distributions for qualitative reasons, quantitative reason, or both.

Purpose of CCAR and DFAST
5
• To promote resiliency under stress across the largest BHCs
• To provide for a comprehensive supervisory assessment of capital adequacy
• To conduct an ex ante assessment of firms’ capital distribution plans
• To require large BHCs to build strong practices to support capital planning and to consider severely adverse outcomes when internally assessing their capital needs

CCAR Qualitative Assessment
6
• For each capital plan, the Federal Reserve evaluated:
– The extent to which the underlying analysis captured and addressed potential risks.
– The robustness of the capital planning process, including supporting riskidentification, measurement and management.
– The reasonableness of underlying assumptions and analysis.
– Corporate governance and internal controls over the capital planning process.
• Expectations differ for BHCs of different, sizes, scopes of operations, activities, and systemic importance.
– See SR 15-18 and SR 15-19

CCAR Quantitative Component
7
• Post-stress capital ratios required to be at or above minimum required levels– All applicable regulatory ratios must be maintained
• Supervisory post-stress ratios in CCAR calculated using
– Supervisory scenarios
– Portfolio balances and risk characteristics before projection period
– Federal Reserve models of the balance sheet and net income
– Banks’ planned capital distributions
• The supervisory stress test used in the CCAR quantitative component is the focus of remainder of presentation

Guiding Principals of Supervisory Stress Testing
8
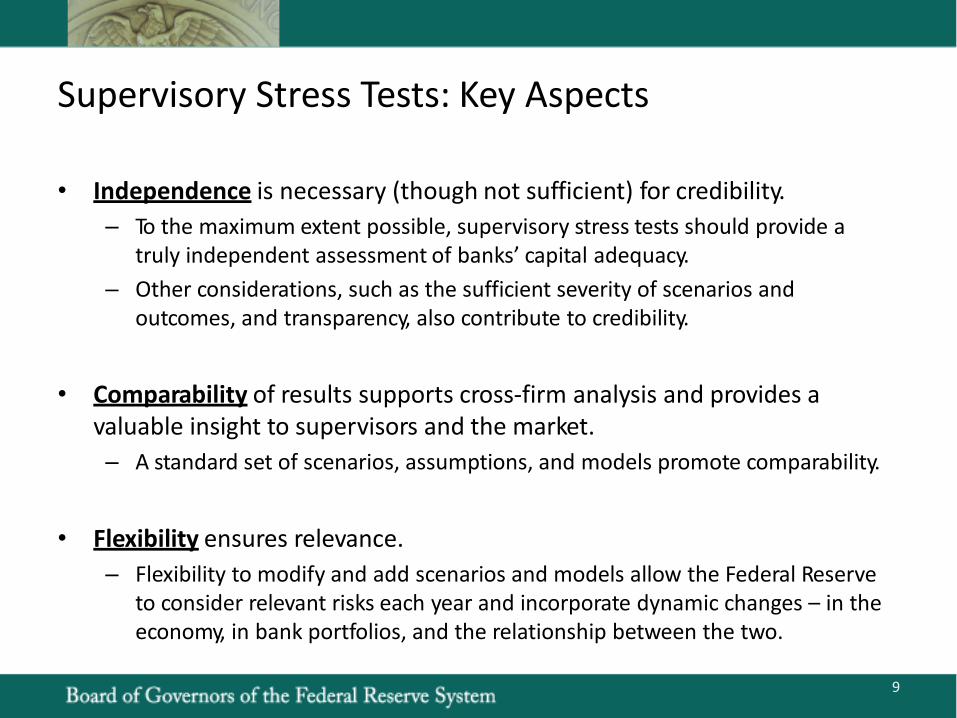
Supervisory Stress Tests: Key Aspects
9
• Independence is necessary (though not sufficient) for credibility.
– To the maximum extent possible, supervisory stress tests should provide a truly independent assessment of banks’ capital adequacy.
– Other considerations, such as the sufficient severity of scenarios and outcomes, and transparency, also contribute to credibility.
• Comparability of results supports cross-firm analysis and provides a valuable insight to supervisors and the market.
– A standard set of scenarios, assumptions, and models promote comparability.
• Flexibility ensures relevance.
– Flexibility to modify and add scenarios and models allow the Federal Reserveto consider relevant risks each year and incorporate dynamic changes – in the economy, in bank portfolios, and the relationship between the two.

Model Independence
10
• Have increasingly moved toward independent modeling since SCAP.
• The Federal Reserve has independently estimated
– most components of losses for several years.
– most components of net income beginning with DFAST 2013.
– BHC balance sheets and risk-weighted assets beginning with DFAST 2014.
• Greater emphasis on input validation where banks’ model results are used as an input (e.g., trading and counterparty risk)

Comparability of Results
11
• Use a standard set of scenarios, assumptions, and models for all banks, using data reported by banks
– Loan or segmentation-level data enhance the ability to account for differences in underwriting quality, and portfolio risk characteristics
• Treat all banks equally and generally do not make firm-specific adjustments to supervisory estimates.
– Use firm fixed effects only for a limited number of instances to address data limitations
– Differences in portfolio composition (e.g., credit score, LTV, products) account fordifferences in results.
– Little weight is given to the potential for management action in response to scenariooutcomes.
• Apply any “management overlay” consistently across banks, based on quantitativeevidence
– For example, used matched first and second-lien data to identify current second-lienloans behind delinquent first loans and adjusted the loss rate on the second-lien loans.

Flexibility in Stress Testing Framework
12
• Supervisory scenarios will likely evolve over time to incorporate particular risks that emerge (“salient” risks).
– Prior examples include heightened stress among European sovereign and financial institutions
– Additional scenario components may be applied to a subset of banks (e.g., global market shock, counterparty default component)
• Models will also likely evolve over time, as new data become available, new products introduce new risks, and estimation techniques advance further.
– Update or re-estimate models each year as the relationship between macroeconomic variables and revenues or losses shifts
– Incorporate research in key risk areas and new products
– Do not rely on history as the best indicator of the future, and make appropriatechanges to assumptions

Supervisory Stress Test Program
13

Governance
14
• Implemented a process that closely follows supervisory expectations for banks’ model risk management (SR 11-7)
• Oversight of the process by a small group of senior staff from across the Federal Reserve System (Model Oversight Group)
– Oversees all model development and implementation
– Evaluates the reasonableness of assumptions and results and engages in extensivevetting of results with modelers, using a variety of benchmarks
– Supported by the Model Coordination and Advisory Team (MCAT), which helps in the day-to-day oversight and development of models
• Independent review and validation of model soundness and controls by a separate group (Model Validation Unit)
– Ensures, together with the MOG, that identified weaknesses are remedied prior to usingthe model
– Promotes internal transparency of model status and results
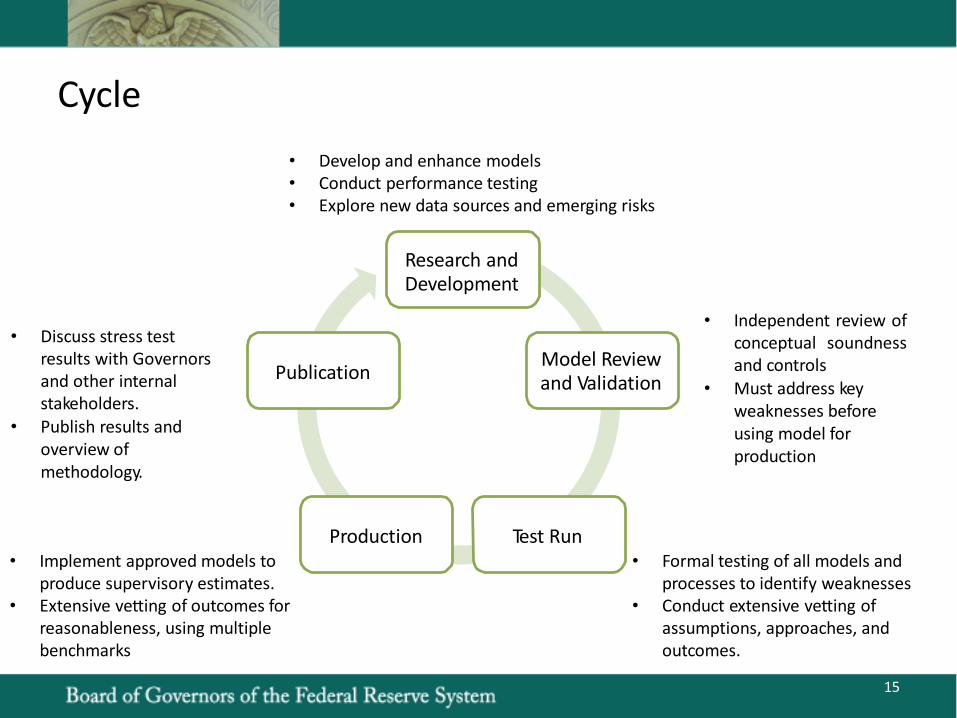
Cycle
Test RunProduction
• Develop and enhance models• Conduct performance testing• Explore new data sources and emerging risks
Research and Development
15
Model Reviewand Validation
Publication
• Independent review ofconceptual soundnessand controls
• Must address key weaknesses before using model for production
• Formal testing of all models and processes to identify weaknesses
• Conduct extensive vetting of assumptions, approaches, and outcomes.
• Implement approved models to produce supervisory estimates.
• Extensive vetting of outcomes for reasonableness, using multiple benchmarks
• Discuss stress test results with Governors and other internal stakeholders.
• Publish results and overview of methodology.
Stress Scenario Design
16
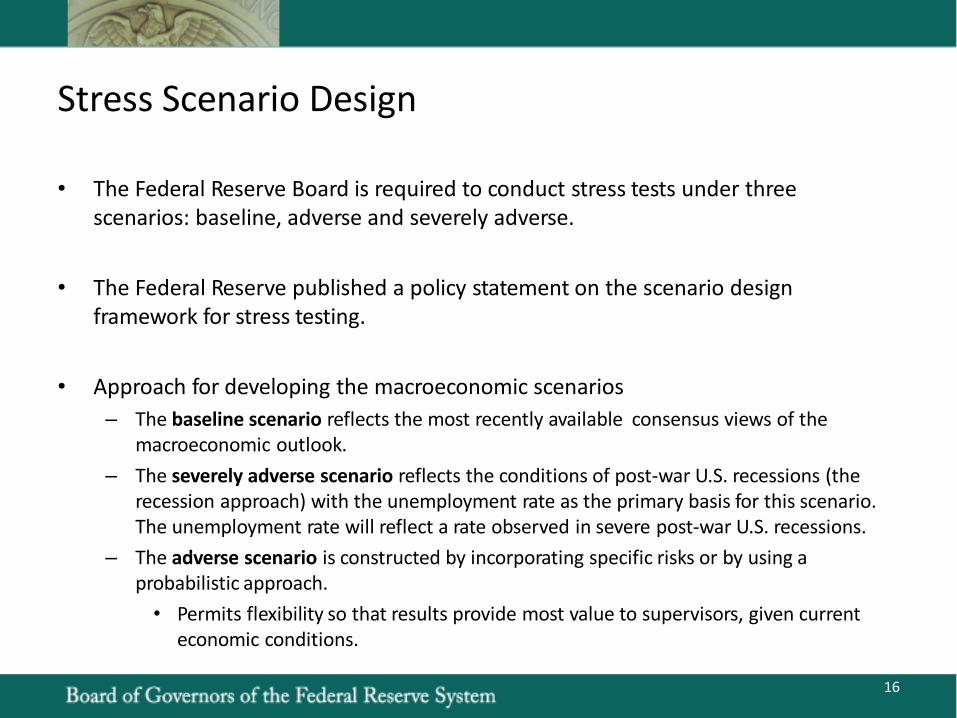
• The Federal Reserve Board is required to conduct stress tests under threescenarios: baseline, adverse and severely adverse.
• The Federal Reserve published a policy statement on the scenario design framework for stress testing.
• Approach for developing the macroeconomic scenarios
– The baseline scenario reflects the most recently available consensus views of themacroeconomic outlook.
– The severely adverse scenario reflects the conditions of post-war U.S. recessions (therecession approach) with the unemployment rate as the primary basis for this scenario.The unemployment rate will reflect a rate observed in severe post-war U.S. recessions.
– The adverse scenario is constructed by incorporating specific risks or by using a probabilistic approach.
• Permits flexibility so that results provide most value to supervisors, given currenteconomic conditions.
Stress Scenario Design (cont.)
17
– Approach for developing the market shock components.
• Market shock component is not included in the baseline.
• To enhance consistency and comparability, the Board provided thousands of specific risk factor shocks.
• The challenge of this level of comprehensiveness is in creating shocks that arecoherent and internally consistent.
• Based on a combination of historical episodes and hypothetical events
Example: 2016 Supervisory Scenarios
18
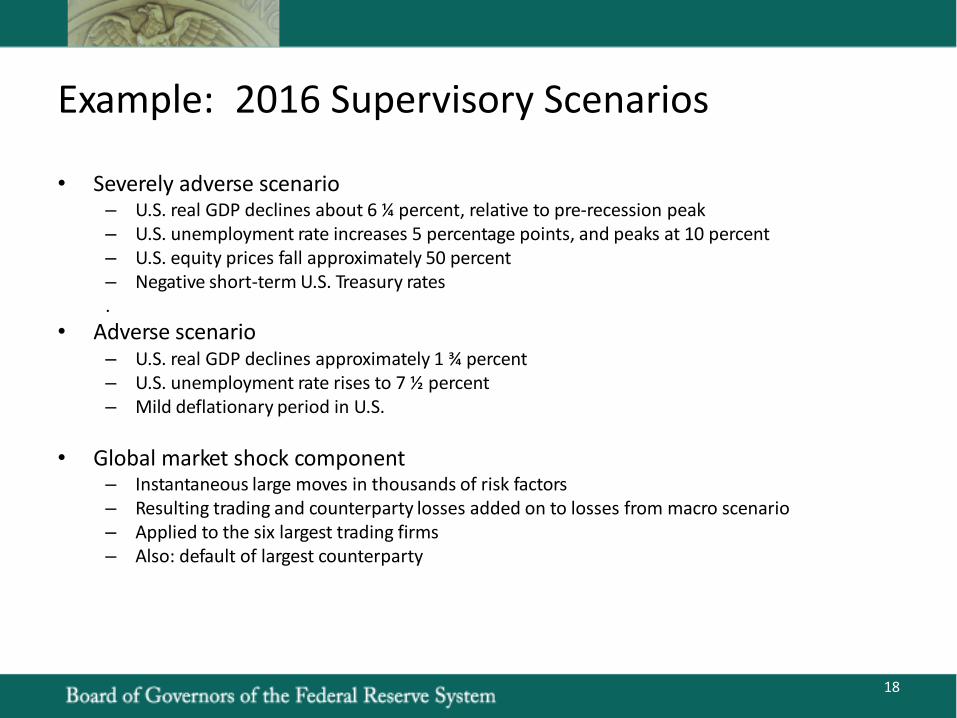
• Severely adverse scenario– U.S. real GDP declines about 6 ¼ percent, relative to pre-recession peak– U.S. unemployment rate increases 5 percentage points, and peaks at 10 percent– U.S. equity prices fall approximately 50 percent– Negative short-term U.S. Treasury rates.
• Adverse scenario– U.S. real GDP declines approximately 1 ¾ percent– U.S. unemployment rate rises to 7 ½ percent– Mild deflationary period in U.S.
• Global market shock component– Instantaneous large moves in thousands of risk factors– Resulting trading and counterparty losses added on to losses from macro scenario– Applied to the six largest trading firms– Also: default of largest counterparty

Collecting Information
19
• Understanding the effect of an adverse scenario on relevant outcomes, such as revenues or losses, requires information.
• This information includes some measure of the risk and return characteristics of the firm’s various portfolios.
• Considerations:
– The level of detail of the information, which may drive modeling choices, depends in part on the data available and on the materiality of the portfolio.
– Representativeness, particularly for external data.
– Quality and integrity.
• Good models require good data.

The FR Y-14 Collection
20
• The Federal Reserve collects detailed data on PPNR, loans, securities, trading and counterparty risk, and losses related to operational-risk events on the FRY-14 report.
• Includes a set of schedules collected monthly, quarterly, or annually.
• Data are collected on individual loans or credit facilities for wholesale loan, domestic retail credit card, and residential mortgage portfolios and are collected on segments of the loan portfolios for other domestic and international retail portfolios.
• Data are collected at the CUSIP level for securities, and at the event level for operational risk events.

Modeling Outcomes Under Stress Scenarios
21
• Models transform the risk and return characteristics of the firm and the stress scenario into relevant stressed outcomes, such as revenues or losses.
• Losses on the accrual loan portfolio– Wholesale: Corporate loans and CRE.– Retail: Residential mortgages, credit cards, auto, other retail.– Loan loss provisions
• Other losses– Loans held-for-sale or measured under the fair-value option– Securities– Trading and private equity– Counterparty default
• PPNR– Net interest income, non-interest income and expense– Operational risk– Mortgage repurchase
• Balance sheet and RWA

Model Granularity
22
• Supervisory models contain loan-level expected loss models and segment-level models of delinquencies and charge-offs.
• Factors to consider when choosing model granularity:
– Is there sufficient data available to model borrower decisions?
– Do the loss rates exhibit non-linearities in explanatory variables?
• Jensen’s inequality
• New research by Hale, Krainer, and McCarthy (2015)

Example of Loan-level Model: First-lien Mortgage
23
• Large loan-level, mortgage data sets covering more than 10 years of performance are available in the United States
• Literature suggests that the relationship between default and explanatory variables (e.g. house prices) can be highly non-linear.
• First lien mortgage model is an expected loss model built on loan-level data.
• EL = PD*LGD
• Separate models built for different product types.
• Fixed-rate, adjustable rate, option adjustable-rate.

Example of Segment-level Model: Other Retail
24
• Because of data limitations and the relatively small size of these portfolios, net charge-off rates are modeled using industry-wide, monthly data at the segment level.
• NCO rate modeled as a system of equations that includes delinquency rate and default rate.
• Autoregressive specifications that include lags of previous delinquency state.
• Implicitly captures roll-rate dynamics.

Calculating Post-stress Capital
Change in regulatory capital
= Change in equity capital
= Net income
= Pretax net income
= PPNR
- Provisions
- Other losses
- Taxes
- Other changes to net income
- Net capital distributions
- Deductions from regulatory capitalBased on Capital Rules
+ Additions to regulatory capital
Supervisory Models of PPNR, Losses, and Balances
Extraordinary items and valuation allowance
Different Assumptions in CCAR and DFAST
25

Transparency of Supervisory Stress Test
26
• Supervisory scenarios– We release all relevant details of the scenarios
– We published a policy statement regarding the goals of scenario design and factorsrelevant to development of scenarios.
• Models– We publish descriptions of all models, including key risk drivers and scenario variables
for each key modeling area
– We host an annual conference about modeling practices
– We disclose a description of the most material model changes
• Results– We publish post-stress capital ratios, a breakdown of net income, and a breakdown of
losses by loan type.

Resources
27
• http://www.federalreserve.gov/bankinforeg/stress-tests-capital-planning.htm
• Supervisory and Company-Run Stress Test Requirements for Covered Companies, October 2012.
• Policy Statement on the Scenario Design Framework for Stress Testing. November 2013.
• Federal Reserve Supervisory Assessment of Capital Planning and Positions for Large and Noncomplex Firms (SR 15-19), December 2015
• Federal Reserve Supervisory Assessment of Capital Planning and Positions for LISCC Firms and Large and Complex Firms (SR 15-18), December 2015
• 2016 Supervisory Scenarios for Annual Stress Tests Required under the Dodd-Frank Stress Testing Rules and the Capital Plan Rule. January 2016.
• Dodd-Frank Act Stress Test 2016: Supervisory Stress Test Methodology and Results. June 2016.
• Comprehensive Capital Analysis and Review 2016: Assessment Framework and Results. June 2016.