Embed Size (px)
Citation preview

February 12, 2016
SUPPLEMENT TO LISTING PROSPECTUS
This document is a supplement to the listing prospectus (the “Listing Prospectus”) of Nokia Oyj (“Nokia” or the
“Company”), approved by the Finnish Financial Supervisory Authority on October 23, 2015. The journal number of
the Finnish Financial Supervisory Authority’s decision of approval for the Listing Prospectus is FIVA
85/02.05.04/2015, for the supplement dated November 16, 2015 FIVA 101/02.05.04/2015 and for the supplement
dated February 2, 2016 FIVA 1/02.05.04/2016. The Finnish Financial Supervisory Authority has on February 12, 2016
approved this supplement with the journal number FIVA 9/02.05.04/2016. A certificate of approval of this supplement,
with a copy of this supplement and a French language translation of the summary of the Listing Prospectus as amended
through this supplement, will be, in accordance with the Prospectus Directive (2003/71/EC), notified to the French
stock market authority (Autorité des marchés financiers, or “AMF”).
The definitions used in this supplement have the same meaning as in the Listing Prospectus, unless otherwise stated.
This supplement constitutes a part of the Listing Prospectus and should be read together therewith.
This supplement is prepared due to the announcements and developments that have taken place after the approval of
the Listing Prospectus on October 23, 2015, most important of which are listed hereunder, and that have not at the date
of this supplement been supplemented to the Listing Prospectus.
• On February 10, 2016, Nokia announced the results of the reopened offer period in the Exchange Offer.
• On February 10, 2016, Nokia announced that USD 1.85 billion senior notes issued by Alcatel Lucent
USA Inc. had been redeemed as part of Nokia’s capital structure optimization program.
• On February 11, 2016, Nokia and Alcatel Lucent published their respective unaudited results for the year
ended December 31, 2015. In conjunction with its release, Nokia announced that, as of the first quarter
2016, Nokia expects to align its financial reporting under two areas: the Networks business and Nokia
Technologies.
• On February 11, 2016, Nokia announced that the Nokia Board of Directors had approved the Nokia
Equity Program for 2016 (as defined below) and the issuance of shares held by Nokia.
Consequently, the information contained in the Listing Prospectus is updated in the manner set out in this supplement.
The unaudited interim report of Nokia for the year ended December 31, 2015, as well as Alcatel Lucent’s unaudited
consolidated financial statements at December 31, 2015 and related press release concerning Alcatel Lucent’s results
for the year ended December 31, 2015 (“Alcatel Lucent Q4 Results Release”) are hereby incorporated by reference
into the Listing Prospectus. The section “Documents Incorporated by Reference” on pages 361–362 of the Listing
Prospectus is updated accordingly.

2
TABLE OF CONTENTS
SUPPLEMENTS TO THE LISTING PROSPECTUS ........................................................................... 3
SUPPLEMENTS TO THE CAUTIONARY STATEMENTS ......................................................... 3
SUPPLEMENTS TO THE SECTION “SUMMARY” ....................................................................... 3
SUPPLEMENTS TO THE SECTION “TIIVISTELMÄ” ................................................................ 14
SUPPLEMENTS TO THE SECTION “DIVIDENDS AND DIVIDEND POLICY — NOKIA” ...... 25
SUPPLEMENTS TO THE SECTION “OPERATING AND FINANCIAL REVIEW AND
PROSPECTS — NOKIA — RECENT DEVELOPMENTS” ............................................................ 25
SUPPLEMENTS TO THE SECTION “OPERATING AND FINANCIAL REVIEW AND
PROSPECTS — NOKIA — PROSPECTS” ..................................................................................... 26
SUPPLEMENTS RELATING TO THE SECTION “CAPITALIZATION AND INDEBTEDNESS OF
NOKIA” .......................................................................................................................................... 28
SUPPLEMENTS RELATING TO THE SECTION “SELECTED FINANCIAL INFORMATION”31
SUPPLEMENTS RELATING TO THE APPROVAL BY THE NOKIA BOARD OF DIRECTORS
OF THE EQUITY PROGRAM FOR 2016 AND THE ISSUANCE OF SHARES HELD BY NOKIA
........................................................................................................................................................ 39
THE AVAILABILITY OF THE SUPPLEMENT .......................................................................... 41
3
SUPPLEMENTS TO THE LISTING PROSPECTUS
Supplements to the cautionary statements
The Listing Prospectus, as supplemented from time to time, and in particular the section “Cautionary Statement
Regarding Forward-Looking Statements”, contain forward-looking statements which should be read in conjunction
with the other cautionary statements that are included elsewhere, including the section “Risk Factors” of the Listing
Prospectus, Nokia Annual Report, Alcatel Lucent Annual Report, Nokia Interim Report, the unaudited interim report
of Nokia for the nine months ended September 30, 2015, the unaudited interim report of Nokia for the year ended
December 31, 2015, Alcatel Lucent Interim Report, Alcatel Lucent Q3 Interim Report, Alcatel Lucent Q4 Results
Release and any other documents that Nokia or Alcatel Lucent have released through their respective stock exchanges.
Any forward-looking statements made in this communication are qualified in their entirety by these cautionary
statements, and there can be no assurance that the actual results or developments anticipated by Nokia will be realized
or, even if substantially realized, that they will have the expected consequences to, or effects on, Nokia or Nokia’s
business or operations. Except as required by law, Nokia undertakes no obligation to publicly update or revise any
forward-looking statements, whether as a result of new information, future events or otherwise.
Shareholders and potential investors should note that all of the information concerning Alcatel Lucent presented in the
Listing Prospectus, as supplemented from time to time, and in particular in Annex A, is solely based on publicly
available information of Alcatel Lucent included in Alcatel Lucent Annual Report and the Alcatel Lucent Interim
Report Alcatel Lucent has filed with the SEC, as well as Alcatel Lucent Q3 Interim Report and Alcatel Lucent Q4
Results Release. Nokia confirms that this information has been accurately reproduced and that as far as Nokia is aware
and is able to ascertain from information published by Alcatel Lucent, no facts have been omitted which would render
the reproduced information inaccurate or misleading.
Supplements to the section “Summary”
Elements B.7 and B.9 of the summary is replaced in their entirety with the following information to reflect the
respective financial information of Nokia and Alcatel Lucent for the year ended December 31, 2015. Element C.7 is
also supplemented with new information. The amended information in the summary has been marked with an asterisk
(*).
B.7 Selected
historical key
financial
information
Nokia
The following tables set forth selected consolidated financial information for Nokia.
This information is qualified by reference to, and should be read in conjunction with,
Nokia’s consolidated financial statements and the notes thereto for the years ended
December 31, 2014, 2013 and 2012 and the unaudited interim report of Nokia for the
year ended December 31, 2015, all of which are incorporated by reference into this
Listing Prospectus. The selected consolidated historical income statement and
statement of cash flow data for the years ended December 31, 2014, 2013 and 2012
and the consolidated statement of financial position data as of December 31, 2014,
2013 and 2012 have been derived from Nokia’s audited consolidated financial
statements for the respective years, prepared in accordance with the International
Financial Reporting Standards (“IFRS”). The selected consolidated historical income
statement and statement of cash flow data for the year ended December 31, 2015 and
the consolidated statement of financial position as of December 31, 2015 have been
derived from the unaudited interim report of Nokia for the year ended December 31,
2015, prepared in accordance with IFRS.*
In September 2013, Nokia announced the sale of substantially all of its Devices &
Services Business to Microsoft. Subsequent to the approval for the sale received in the
Extraordinary General Meeting in November 2013, Nokia Group has presented
Devices & Services Business as discontinued operations. The sale was completed on
April 25, 2014. In the consolidated income statement for the year 2013, the financial

4
results of the Devices & Services Business were reported as discontinued operations
separately from the continuing operations. The income statement information for the
year 2012 were restated accordingly. As of January 1, 2013, Nokia adopted new
revised IAS 19 Employee Benefits standard. As a result, the net pension liabilities and
other comprehensive income were impacted mainly by the retrospectively applied
elimination of the ’corridor’ approach and financial information for the year 2012
were adjusted accordingly. Thus, the restated information for the year 2012 presented
in the following tables is unaudited.
On August 3, 2015, Nokia announced an agreement to sell its HERE digital mapping
and location services business to a consortium of leading automotive companies,
comprising AUDI AG, BMW Group and Daimler AG. The sale of HERE was
completed on December 4, 2015. In the unaudited consolidated income statement for
the financial year ended December 31, 2015, HERE has been reported as discontinued
operations separately from the continuing operations. The income statement
information for the year 2014 were restated accordingly. Thus, the restated
consolidated income statement information for the year 2014 presented in the
following table is unaudited. HERE has been reported as part of Nokia’s continuing
operations in the consolidated financial information for the financial years ended
December 31, 2013 and 2012.*
Year ended
December
31, Year ended December 31,
2015 2014 2013 2012
(unaudited)* (unaudited) (audited) (unaudited)
CONSOLIDATED INCOME
STATEMENT
(in EUR
million, except for
shares
outstanding and earnings
per share)
(in EUR million, except for shares
outstanding and earnings per share)
Net sales 12 499 11 763 12 709 15 400
Cost of sales (7 045) (6 855) (7 364) (9 841)
Gross profit 5 453 4 907 5 345 5 559
Research and development
expenses (2 126) (1 948) (2 619) (3 081)
Selling, general and administrative expenses (1 651) (1 453) (1 671) (2 062)
Other income and expenses 12 (95) (536) 1 (1 237) 2
Operating profit/(loss) 1 688 1 412 519 (821)
Share of results of associated companies and joint ventures 29 (12) 4 (1)
Financial income and expenses (177) (401) (280) (357)
Profit/(loss) before tax 1 540 999 243 (1 179)
Income tax (expense)/benefit (346) 1 718 (202) (304)
Profit/(loss) from continuing
operations 1 194 2 718* 41 (1 483)
Attributable to:
Equity holders of the parent 1 192 2 710* 186 (771)
Non-controlling interests 2 8 (145) (712)
Profit/(loss) from discontinued
operations 1 274 758* (780) (2 303)
Attributable to:
Equity holders of the parent 1 274 752 (801) (2 334)
Non-controlling interests 0 6 21 31
Profit/(loss) 2 468 3 476 (739) (3 786)
Attributable to:
Equity holders of the parent 2 466 3 462 (615) (3 105) Non-controlling interests 2 14 (124) (681)

5
Earnings per share (for
profit/(loss) attributable to the
equity holders of the parent)
Basic earnings per share (in
EUR)
Continuing operations 0.32 0.73 0.05 (0.21)
Discontinued operations 0.35 0.20 (0.22) (0.63) Nokia Group 0.67 0.94 (0.17) (0.84)
Diluted earnings per share (in
EUR) Continuing operations 0.31 0.67 0.05 (0.21)
Discontinued operations 0.32 0.18 (0.22) (0.63)
Nokia Group 0.63 0.85 (0.17) (0.84)
Average number of shares
(’ 000 shares)
Basic Continuing operations 3 670 934 3 698 723 3 712 079 3 710 845
Discontinued operations 3 670 934 3 698 723 3 712 079 3 710 845
Nokia Group 3 670 934 3 698 723 3 712 079 3 710 845
Diluted
Continuing operations 3 949 312 4 131 602 3 733 364 3 710 845
Discontinued operations 3 949 312 4 131 602 3 712 079 3 710 845 Nokia Group 3 949 312 4 131 602 3 712 079 3 710 845
1 Consist of “Other income” of EUR 272 million and “Other expenses” of EUR (808) million. 2 Consist of “Other income” of EUR 276 million and “Other expenses” of EUR (1 513) million.
Year ended
December
31, Year ended December 31,
2015 2014 2013 2012
(unaudited)* (unaudited) (audited) (unaudited)
CONSOLIDATED
STATEMENT OF
COMPREHENSIVE
INCOME
(in EUR
million) (in EUR million)
Profit/(loss) 2 468 3 476 (739) (3 786)
Other comprehensive
income/(expense)
Items that will not be
reclassified to profit or loss:
Remeasurements on defined
benefit pensions 112 (275) 83 (228) Income tax related to items that
will not be reclassified to profit
or loss (28) 96 (3) 22
Items that may be reclassified
subsequently to profit or loss:
Translation differences (1 054) 820 (496) 41 Net investment hedges 323 (167) 114 (58)
Cash flow hedges (5) (30) 3 (41) Available-for-sale investments 57 106 49 35
Other increase/(decrease), net 1 40* 5 10
Income tax related to items that may be reclassified
subsequently to profit or loss (88) 16 1 12
Other comprehensive
income/(expense), net of tax (682) 606 (244) (207)
Total comprehensive income 1 786 4 082 (983) (3 993)
Attributable to:
Equity holders of the parent 1 781 4 061 (863) (3 281)
Non-controlling interests 5 21 (120) (712) 1 786 4 082 (983) (3 993)
Attributable to equity holders
of the parent: Continuing operations 1 457 2 350* 34 (831)

6
Discontinued operations 324 1 711* (897) (2 450)
1 781 4 061 (863) (3 281)
Attributable to non-
controlling interest:
Continuing operations 5 16 (139) (740) Discontinued operations 0 5 19 28
5 21 (120) (712)
As of
December
31, As of December 31,
2015 2014 2013 2012
(unaudited)* (audited) (audited) (unaudited)
CONSOLIDATED
STATEMENT OF
FINANCIAL POSITION
(in EUR million) (in EUR million)
ASSETS Goodwill 237 2 563 3 295 4 876
Other intangible assets 323 350 296 647
Property, plant and equipment 695 716 566 1 431 Investments in associated
companies and joint ventures 84 51 65 58
Available-for-sale investments 948 828 741 689 Deferred tax assets 2 634 2 720 890 1 279
Long-term loans receivable 49 34 96 125
Prepaid pension costs1 25 31 38 152 Other non-current assets1 51 47 61 66
Non-current assets 5 046 7 339 6 048 9 323
Inventories 1 014 1 275 804 1 538 Accounts receivable, net of
allowances for doubtful
accounts 3 913 3 429* 2 901 5 551 Prepaid expenses and accrued
income 749 913 660 2 682
Current income tax assets 171 124 146 495 Current portion of long-term
loans receivable 21 1 29 35
Other financial assets 107 266 285 451
Investments at fair value
through profit and loss, liquid
assets 687 418 382 415 Available-for-sale investments,
liquid assets 2 167 2 127 956 542
Cash and cash equivalents2 6 995 5 170 7 633 8 952
Current assets 15 824 13 724 13 796 20 661
Assets held for sale - - 89 -
Assets of disposal groups
classified as held for sale - - 5 258 -
Total assets 20 870 21 063 25 191 29 984
SHAREHOLDERS’
EQUITY AND
LIABILITIES
Share capital 246 246 246 246
Share issue premium 380 439 615 446
Treasury shares at cost (718) (988) (603) (629) Translation differences 292 1 099 434 746
Fair value and other reserves 148 22 80 (5)
Reserve for invested non-restricted equity 3 820 3 083 3 115 3 136
Retained earnings 6 279 4 710 2 581 3 997
Capital and reserves
attributable to equity holders
of the parent 10 446 8 611 6 468 7 937
Non-controlling interests 21 58 192 1 302
Total equity 10 468 8 669 6 660 9 239

7
Long-term interest-bearing
liabilities 2 023 2 576 3 286 5 087 Deferred tax liabilities 62 32 195 701
Deferred revenue and other
long-term liabilities 1 677 2 197 630 997 Provisions 250 301 242 304
Non-current liabilities 4 011 5 107* 4 353 7 089
Current portion of interest-bearing liabilities 1 1 3 192 201
Short-term borrowing 50 115 184 261
Other financial liabilities 113 174 35 90 Current income tax liabilities 446 481 484 499
Accounts payable 1 910 2 313 1 842 4 394
Accrued expenses, deferred revenue and other liabilities 3 395 3 632 3 033 6 223
Provisions 476 572 680 1 988
Current liabilities 6 391 7 288 9 450 13 656
Liabilities of disposal groups classified as held for sale - - 4 728 -
Total shareholders’ equity
and liabilities 20 870 21 063 25 191 29 984
1 Prepaid pension costs previously reported under “Other non-current assets” have been reported separately since June 30, 2015. The information for prior periods presented has been adjusted
accordingly. 2 Since June 30, 2015, “Bank and cash” and “Available for sale investments, cash equivalents” have been reported as a single line item “Cash and cash equivalents”. The information for prior periods
presented has been adjusted accordingly.
Year ended
December
31, Year ended December 31,
2015 2014 2013 2012
(unaudited)* (audited)
CONSOLIDATED
STATEMENT OF CASH
FLOWS
(in EUR
million) (in EUR million)
Net cash from/(used in) operating activities 507 1 275 72 (354)
Net cash from/(used in)
investing activities 1 896 886 (691) 562 Net cash used in financing
activities (584) (4 576) (477) (465)
Foreign exchange adjustment 6 (48) (223) (27) Net increase/(decrease) in cash
and equivalents 1 825 (2 463) (1 319) (284)
Cash and cash equivalents at beginning of period 5 170 7 633 8 952 9 236
Cash and cash equivalents at
end of period 6 995 5 170 7 633 8 952
Consolidated statement of cash flows combines cash flows from both the continuing and the discontinued operations.

8
Key Ratios
Year ended
December
31, Year ended December 31,
2015 2014 2013 2012
(unaudited)* (unaudited)
Key ratios at the reporting
date, continuing operations
Earnings per share for profit
attributable to equity holders
of parent Earnings per share, basic, EUR 0.32 0.73 0.051 (0.21)
Earnings per share, diluted,
EUR 0.31 0.67 0.051 (0.21) P/E ratio, basic 20.61 8.99 116.40 neg.
Ordinary dividend per share,
EUR* 0.164 0.14 0.11 0 Special dividend per share,
EUR* 0.104 0 0.26 0
Total dividends paid, EURm 1 500 511 1 374 0 Payout ratio, basic2 0.50 0.19* 2.20* 0
Dividend yield, %3 2.43 2.13 1.89* 0
Shareholders’ equity per share, EUR* 2.65 2.36 1.74 2.14
Market capitalization, EURm 25 979 23 932 21 606 10 873
1 Earnings per share (basic and diluted) for the year ended December 31, 2013 are audited. 2 Payout ratio, basic is calculated based on the Ordinary dividend per share, EUR. The payout ratio
including the Special dividend per share is 0.81 for the year ended December 31, 2015, 0.19 for the year
ended December 31, 2014 and 7.40 for the year ended December 31, 2013.* 3 Dividend yield, % is calculated based on the Ordinary dividend per share, EUR. The dividend yield, %
including the Special dividend per share is 3.94 for the year ended December 31, 2015, 2.13 for the year
ended December 31, 2014 and 6.36 for the year ended December 31, 2013.* 4 The ordinary and special dividend for 2015 will be proposed by the Nokia Board of Directors. The
resolution on the dividend will be made by the Annual General Meeting in 2016.*
In November 2011, Nokia Networks announced its strategy to focus on mobile
broadband and services. It also announced an extensive global restructuring program
that ultimately resulted in the reduction of its annualized operating expenses and
production overhead by over EUR 1.5 billion when the program was completed at the
end of 2013. As part of its strategy of focusing on mobile broadband, Nokia Networks
also divested a number of non-core businesses.
Beginning in 2013, Nokia undertook a series of transactions to transform its business
portfolio. On July 1, 2013, Nokia announced the agreement to acquire Siemens’ 50%
stake in the companies’ joint venture Nokia Siemens Networks. The purchase price
was EUR 1.7 billion and the transaction closed on August 7, 2013. On September 3,
2013, Nokia announced that it had signed an agreement to sell its Devices & Services
Business to Microsoft for a total purchase price of EUR 5.44 billion, of which EUR
3.79 billion related to the Sale of the Devices & Services Business and EUR 1.65
billion related to a mutual patent license agreement. In conjunction with the
transaction, Nokia established the Nokia Technologies business to focus on
technology development and intellectual property rights activities. The transaction
significantly strengthened the Company’s financial position and subsequent to the
transaction, in 2014, Nokia started the optimization of its capital structure and
recommenced dividend payments, distributed excess capital to shareholders and
reduced its interest-bearing debt.
On April 15, 2015, Nokia continued its transformation with the announcement that it
had signed an agreement to acquire Alcatel Lucent through the Exchange Offer on the
basis of 0.5500 Nokia Shares for each Alcatel Lucent Share. In conjunction with this
announcement, Nokia announced that it has suspended its capital structure

9
optimization program effective immediately. On August 3, 2015, Nokia announced an
agreement to sell HERE to an automotive industry consortium and estimates that it
will receive net proceeds of slightly above EUR 2.5 billion. The transaction was
completed on December 4, 2015.* On October 29, 2015, Nokia announced a planned
EUR 7 billion program to optimize Nokia’s capital structure and return excess capital
to shareholders, subject to the closing of the Alcatel Lucent and HERE transactions,
as well as the conversion of all Nokia and Alcatel Lucent convertible bonds.
Nokia obtained control of Alcatel Lucent on January 4, 2016 when the interim results
of the successful initial Exchange Offer were announced by the AMF with a
shareholding of 76.31% of the share capital and at least 76.01% of the voting rights.
On January 14, 2016, the combined operations of Nokia and Alcatel Lucent
commenced. On the same day, Nokia reopened the Exchange Offer. The results of the
reopened offer period in the Exchange Offer were published on February 10, 2016 and
as a result, Nokia holds 91.25% of the share capital and at least 91.17% of the voting
rights of Alcatel Lucent.*
Alcatel Lucent
The following tables set out selected consolidated financial information for Alcatel
Lucent. This information is qualified by reference to, and should be read in
conjunction with, Alcatel Lucent’s consolidated financial statements and the notes
thereto for the year ended December 31, 2014, which are included in Annex A, Alcatel
Lucent’s consolidated financial statements and the notes thereto for the years ended
December 31, 2013 and 2012, which are incorporated by reference into this Listing
Prospectus, and Alcatel Lucent’s unaudited consolidated financial statements at
December 31, 2015, which are incorporated by reference into this Listing Prospectus.
The selected consolidated historical income statement and statement of cash flow data
for the years ended December 31, 2014, 2013 and 2012 and the consolidated statement
of financial position data as of December 31, 2014, 2013 and 2012 have been derived
from Alcatel Lucent’s audited consolidated financial statements for the respective
years, prepared in accordance with IFRS. The selected consolidated historical income
statement and statement of cash flow data for the year ended December 31, 2015 and
the consolidated statement of financial position as of December 31, 2015 have been
derived from Alcatel Lucent’s unaudited consolidated financial statements at
December 31, 2015, prepared in accordance with IFRS.*
On September 30, 2014, Alcatel Lucent completed the disposal of 85% of its
Enterprise business to China Huaxin, for cash proceeds of EUR 205 million, following
the binding offer Alcatel Lucent received early February 2014. As a result of this
transaction, the results pertaining to the Enterprise business for the year ended
December 31, 2014 were treated as discontinued operations and years ended
December 31, 2013 and 2012 were re-presented accordingly.
For the year
ended as of
December 31, For the year ended as of December 31,
2015 2014 20131 20121
(unaudited)* (audited)
CONSOLIDATED
INCOME STATEMENTS
(in EUR
million, except
per share data) (in EUR million, except per share data)
Revenues 14 275 13 178 13 813 13 764
Cost of sales (9 132) (8 770) (9 491) (9 753)
Gross profit 5 143 4 408 4 322 4 011
Administrative and selling
expenses (1 761) (1 621) (1 862) (2 161)
Research and development costs (2 378) (2 215) (2 268) (2 330)

10
Income (loss) from operating
activities before restructuring
costs, litigations, gain/(loss)
on disposal of consolidated
entities, impairment of assets
and post-retirement benefit
plan amendments 1 004 572 192 (480)
Restructuring costs (401) (574) (518) (479) Litigations (20) 7 (2) 2
Gain/(loss) on disposal of
consolidated entities (1) 20 2 11 Transaction-related costs (104) - - -
Impairment of assets (193) - (548) (894)
Post-retirement benefit plan amendments 404 112 135 204
Income (loss) from
operating activities 689 137 (739) (1 636)
Finance cost (269) (291) (392) (279)
Other financial income (loss) (136) (211) (318) (394)
Share in net income (losses)
of associates & joint ventures 2 15 7 5
Income (loss) before income
tax and discontinued
operations 286 (350) (1 442) (2 304)
Income tax (expense) benefit 16 316 173 (423)
Income (loss) from
continuing operations 302 (34) (1 269) (2 727)
Income (loss) from discontinued operations (16) (49) (25) 639
NET INCOME (LOSS) 286 (83) (1 294) (2 088)
Attributable to:
Equity owners of the parent 257 (118) (1 304) (2 011)
Non-controlling interests 29 35 10 (77)
Earnings (loss) per share
(in euros)2
Basic earnings (loss) per share:
From continuing operations 0.10 (0.02) (0.53) (1.11)
From discontinued operations (0.01) (0.02) (0.01) 0.27 Attributable to the equity
owners of the parent 0.09 (0.04) (0.54) (0.84)
Diluted earnings (loss) per share:
From continuing operations 0.10 (0.02) (0.53) (1.11)
From discontinued operations (0.01) (0.02) (0.01) 0.22 Attributable to the equity
owners of the parent 0.09 (0.04) (0.54) (0.84)
1 2013 and 2012 amounts are re-presented to reflect the impacts of discontinued operations.
2 As a result of the 2013 capital increase made by Alcatel Lucent through an offering of preferential
subscription rights to existing shareholders, the calculation of basic and diluted earnings per share has
been adjusted retrospectively. Number of outstanding ordinary shares has been adjusted to reflect the proportionate change in the number of shares.

11
For the year
ended as of
December 31, For the year ended as of December 31,
2015 2014 2013 2012
(unaudited)* (audited)
CONSOLIDATED
STATEMENTS OF
COMPREHENSIVE
INCOME
(in EUR million) (in EUR million)
Net income (loss) for the
year / period 286 (83) (1 294) (2 088)
Items to be subsequently
reclassified to Income
Statement 386 510 (221) (4)
Financial assets available for
sale 2 8 11 16
Cumulative translation adjustments 384 503 (232) (34)
Cash flow hedging - (1) - 14
Tax on items recognized
directly in equity - - - -
Items that will not be
subsequently reclassified to
Income Statement 878 (1 568) 1 411 71
Actuarial gains (losses) and
adjustments arising from asset ceiling limitation and
IFRIC 14 933 (1 822) 1 667 172
Tax on items recognized directly in equity (55) 254 (256) (101)
Other comprehensive
income (loss) for the year 1 264 (1 058) 1 190 67
TOTAL
COMPREHENSIVE
INCOME (LOSS) FOR THE
YEAR 1 550 (1 141) (104) (2 021)
Attributable to:
Equity owners of the
parent 1 467 (1 256) (99) (1 933)
Non-controlling interests 83 115 (5) (88)
As of
December 31, As of December 31,
2015 2014 2013 2012
(unaudited)* (audited)
CONSOLIDATED
STATEMENTS OF
FINANCIAL POSITION
(in EUR
million)
(in EUR million)
ASSETS
Non-current assets:
Goodwill 3 215 3 181 3 156 3 820 Intangible assets, net 1 435 1 011 1 001 1 175
Goodwill and intangible
assets, net 4 650 4 192 4 157 4 995
Property, plant and
equipment, net 1 382 1 132 1 075 1 133
Investments in associates & joint ventures 20 51 35 29
Other non-current financial
assets, net 361 406 322 341 Deferred tax assets 1 740 1 516 1 000 985
Prepaid pension costs 2 935 2 636 3 150 2 797
Other non-current assets 509 429 413 428
Total non-current assets 11 597 10 362 10 152 10 708
Current assets:
Inventories and work in
progress, net 1 600 1 971 1 935 1 940

12
Trade receivables and other
receivables, net 2 535 2 528 2 482 2 860 Advances and progress
payments 45 43 46 53
Other current assets 778 877 751 726 Current income taxes 64 64 33 118
Marketable securities, net 1 626 1 672 2 259 1 528
Cash and cash equivalents 4 905 3 878 4 096 3 401
Current assets before assets
held for sale 11 553 11 033 11 602 10 626
Assets held for sale and assets included in disposal
groups held for sale 39 65 142 20
Total current assets 11 592 11 098 11 744 10 646
TOTAL ASSETS 23 189 21 460 21 896 21 354
EQUITY AND
LIABILITIES
Equity:
Capital stock 152 141 140 4 653
Additional paid-in capital 21 232 20 869 20 855 16 593 Less treasury stock at cost (1 084) (1 084) (1 428) (1 567)
Accumulated deficit, fair
value and other reserves (16 882) (17 633) (14 588) (15 159) Other items recognized
directly in equity 54 52 45 - Cumulative translation
adjustments (36) (366) (787) (571)
Net income (loss) - attributable to the equity
owners of the parent 257 (118) (1 304) (2 011)
Equity attributable to
equity owners of the parent 3 693 1 861 2 933 1 938
Non-controlling interests 904 833 730 745
Total equity 4 597 2 694 3 663 2 683
Non-current liabilities:
Pensions, retirement
indemnities and other post-
retirement benefits 4 506 5 163 3 854 5 338
Convertible bonds and other
bonds, long-term 4 394 4 696 4 711 3 727 Other long-term debt 238 179 211 227
Deferred tax liabilities 946 872 990 889
Other non-current liabilities 561 175 188 177
Total non-current liabilities 10 645 11 085 9 954 10 358
Current liabilities: Provisions 1 128 1 364 1 416 1 649
Current portion of long-term
debt and short-term debt 579 402 1 240 851 Customers’ deposits and
advances 794 810 681 718
Trade payables and other payables 3 578 3 571 3 518 3 726
Current income tax liabilities 65 73 93 145
Other current liabilities 1 789 1 429 1 237 1 204
Current liabilities before
liabilities related to
disposal groups held for
sale 7 933 7 649 8 185 8 293
Liabilities related to disposal
groups held for sale 14 32 94 20
Total current liabilities 7 947 7 681 8 279 8 313
TOTAL EQUITY AND
LIABILITIES 23 189 21 460 21 896 21 354

13
For the year
ended
December 31, For the year ended December 31,
2015 2014 20131 20121
(unaudited)* (audited)
CONSOLIDATED
STATEMENTS OF CASH
FLOWS
(in EUR
million) (in EUR million)
Net cash provided (used) by
operating activities 1 177 127 (221) (144)
Net cash provided (used) by
investing activities (485) 235 (1 128) (1 039)
Net cash provided (used) by
financing activities (211) (1 383) 2 350 (12)
Cash provided (used) by operating activities of
discontinued operations 11 34 65 (71)
Cash provided (used) by
investing activities of
discontinued operations 30 71 (64) 1 066
Cash provided (used) by financing activities of
discontinued operations - 65 (15) 36
Net effect of exchange rate changes 505 633 (292) 23
NET INCREASE
(DECREASE) IN CASH
AND CASH
EQUIVALENTS 1 027 (218) 695 (141)
Cash and cash equivalents
at beginning of period /
year 3 878 4 096 3 401 3 533
Cash and cash equivalents
at beginning of period /
year classified as assets
held for sale - - - 9
Cash and cash equivalents
at end of period / year 2 4 905 3 878 4 096 3 400
Cash and cash equivalents
at end of period / year
classified as assets held for
sale - - - 1
Cash and cash equivalents
including cash and cash
equivalents classified as
held for sale at the end of
period 4 905 3 878 4 096 3 401
1 2013 and 2012 amounts are re-presented to reflect the impacts of discontinued operations. 2 Includes EUR 1 505 million of cash and cash equivalents held in countries subject to exchange control
restrictions as of December 31, 2015 (EUR 1 019 million as of December 31, 2014, EUR 756 million as of December 31, 2013 and EUR 949 million as of December 31, 2012). Such restrictions can limit
the use of such cash and cash equivalents by other Alcatel Lucent Group subsidiaries and Alcatel Lucent.
On June 19, 2013, Alcatel Lucent announced the Shift Plan, a detailed three-year plan
to transform itself into a specialist provider of IP and Cloud Networking and Ultra-
Broadband Access. As part of this process, effective from July 1, 2013, Alcatel Lucent
implemented a new organization composed of three reportable segments: Core
Networking, Access and Other.
The Shift Plan has targeted investments in Core Networking businesses (including IP
Routing, IP Transport, IP Platforms and associates services), increasing segment
operating cash flow from the Access segment, and technological partnerships. The
Shift Plan has also focused on market diversification and rightsizing Alcatel Lucent’s

14
cost structure. In particular, the Shift Plan aims to reduce Alcatel Lucent’s fixed-cost
base by EUR 950 million in 2015 compared to its 2012 cost base. Alcatel Lucent has
stated that it expects that the cumulative amount of restructuring cash outlays pursuant
to the Shift Plan should be approximately EUR 1.8 billion, of which approximately
EUR 1.4 billion will be incurred between 2013 and 2015, with the remainder in 2016.
In addition, Alcatel Lucent has completed multiple dispositions as part of the Shift
Plan and re-profiled and reduced the financial debt of the company.
Nokia obtained control of Alcatel Lucent on January 4, 2016 when the interim results
of the successful initial Exchange Offer were announced by the AMF with a
shareholding of 76.31% of the share capital and at least 76.01% of the voting rights.
On January 14, 2016, the combined operations of Nokia and Alcatel Lucent
commenced. On the same day, Nokia reopened the Exchange Offer. The results of the
reopened offer period in the Exchange Offer were published on February 10, 2016 and
as a result, Nokia holds 91.25% of the share capital and at least 91.17% of the voting
rights of Alcatel Lucent. *
B.9 Profit
forecast and
estimates
Not applicable.*
C.7 Dividend
policy
On February 11, 2016, Nokia announced that the Board of Directors of Nokia will
propose to the Annual General Meeting in 2016 a dividend of EUR 0.16 per share for
2015 and a special dividend of EUR 0.10 per share. The resolution on the dividend
will be made by the Annual General Meeting in 2016.*
Supplements to the section “Tiivistelmä”
Tiivistelmän osatekijät B.7 ja B.9 korvataan kokonaisuudessaan seuraavilla tiedoilla, jotka kuvastavat Nokian ja
Alcatel Lucentin taloudellisia tietoja 31.12.2015 päättyneeltä vuodelta. Myös osatekijää C.7 täydennetään uusilla
tiedoilla. Täydennetyt tiedot on merkitty tiivistelmässä tähdellä (*).
Osakkeenomistajien ja potentiaalisten sijoittajien tulisi huomata, että kaikki Alcatel Lucentia koskeva
Listalleottoesitteessä (erityisesti liitteessä A) esitetty tieto, siinä muodossa kuin Listalleottoesitettä on täydennetty aika
ajoin, perustuu ainoastaan julkisista lähteistä saatavilla olevaan Alcatel Lucentia koskevaan tietoon, joka on sisällytetty
Alcatel Lucentin vuosikertomukseen ja Alcatel Lucentin 30.6.2015 päättyneen kuuden kuukauden jakson
osavuosikatsaukseen, jotka Alcatel Lucent on jättänyt Yhdysvaltojen arvopaperimarkkinaviranomaiselle, sekä Alcatel
Lucentin 30.9.2015 päättyneen yhdeksän kuukauden jakson osavuosikatsaukseen ja sitä koskevaan tiedotteeseen sekä
Alcatel Lucentin tilintarkastamattomaan tilinpäätökseen 31.12.2015 päätyneeltä vuodelta ja sitä koskevaan
tiedotteeseen. Nokia vahvistaa, että tämä tieto on toistettu täsmällisesti ja että siltä osin kuin Nokia on tietoinen ja
pystyy varmistamaan, Alcatel Lucentin julkaisemasta tiedosta ei ole jätetty pois sellaisia faktoja, jotka tekisivät
toistetusta tiedosta epätarkkaa tai harhaanjohtavaa.*
B.7 Valikoidut
historialliset
keskeiset
taloudelliset
tiedot
Nokia
Seuraavissa taulukoissa on esitetty Nokian valikoituja konsolidoituja taloudellisia
tietoja. Esitetyt tiedot perustuvat Listalleottoesitteeseen viittaamalla sisällytettyihin
Nokian konsernitilinpäätöksiin 31.12.2014, 31.12.2013 ja 31.12.2012 päättyneiltä
vuosilta ja niiden liitetietoihin sekä Nokian tilintarkastamattomaan
osavuosikatsaukseen 31.12.2015 päättyneeltä vuodelta, ja tässä esitettyjä taloudellisia
tietoja tulee tarkastella yhdessä niiden kanssa. Valikoidut historialliset konsernin
tuloslaskelma- ja rahavirtatiedot 31.12.2014, 31.12.2013 ja 31.12.2012 päättyneiltä
vuosilta sekä konsernitasetiedot 31.12.2014, 31.12.2013 ja 31.12.2012 perustuvat
Nokian tilintarkastettuihin konsernitilinpäätöksiin, jotka on laadittu IFRS-
tilinpäätösstandardien (”IFRS”) mukaisesti. Valikoidut historialliset konsernin
tuloslaskelma- ja rahavirtatiedot 31.12.2015 päättyneeltä vuodelta sekä

15
konsernitasetiedot 31.12.2015 perustuvat Nokian tilintarkastamattomaan
osavuosikatsaukseen 31.12.2015 päättyneeltä vuodelta, joka on laadittu IFRS:n
mukaisesti.*
Nokia julkisti syyskuussa 2013 myyvänsä olennaisilta osin koko Devices &
Services -liiketoimintansa Microsoftille. Ylimääräisen yhtiökokouksen hyväksyttyä
myynnin marraskuussa 2013 Nokia-konserni on raportoinut Devices &
Services -liiketoiminnan lopetettuna toimintana. Myynti saatettiin päätökseen
25.4.2014. Vuoden 2013 konsernituloslaskelmassa Devices &
Services -liiketoiminnan taloudellinen tulos on esitetty lopetetuissa toiminnoissa
erillään jatkuvista toiminnoista. Vuoden 2012 tuloslaskelmatiedot on oikaistu
vastaavasti. Nokia otti 1.1.2013 käyttöön uudistetun IAS 19 -standardin
(Työntekijöiden maksusuoritukset). Tämä vaikutti eläkevastuiden nettomäärään ja
muuhun laajaan tulokseen pääasiassa putkimenetelmän takautuvan eliminoinnin
kautta, ja taloudelliset tiedot vuodelta 2012 on oikaistu vastaavasti. Tämän vuoksi
seuraavissa taulukoissa esitetyt oikaistut tiedot vuodelta 2012 ovat
tilintarkastamattomia.
Nokia julkisti 3.8.2015 solmineensa sopimuksen kartta- ja sijaintipalveluja tarjoavan
HERE-liiketoimintansa myynnistä johtavien autonvalmistajien yhteenliittymälle,
johon kuuluvat AUDI AG, BMW Group ja Daimler AG. HERE-liiketoiminnan
myynti saatiin päätökseen 4.12.2015. Tilintarkastamattomassa
konsernituloslaskelmassa 31.12.2015 päättyneeltä tilivuodelta HERE on esitetty
lopetetuissa toiminnoissa erillään jatkuvista toiminnoista. Vuoden 2014
tuloslaskelmatiedot on oikaistu vastaavasti. Tämän vuoksi seuraavassa taulukossa
esitetyt oikaistut konsernin tuloslaskelmatiedot vuodelta 2014 ovat
tilintarkastamattomia. HERE on raportoitu osana Nokian jatkuvia toimintoja
konsernin taloudellisissa tiedoissa 31.12.2013 ja 31.12.2012 päättyneiltä vuosilta.*
1.1.–31.12. 1.1.–31.12.
2015 2014 2013 2012
(tilintarkas-
tamaton)*
(tilintar-
kastamaton)
(tilintar-
kastettu)
(tilintar-
kastamaton)
KONSERNIN
TULOSLASKELMA
(milj. EUR, paitsi
osakemäärä
ja osakekohtai-
nen tulos)
(milj. EUR, paitsi osakemäärä ja osakekohtainen
tulos)
Liikevaihto 12 499 11 763 12 709 15 400
Hankinnan ja valmistuksen
kulut -7 045 -6 855 -7 364 -9 841
Bruttokate 5 453 4 907 5 345 5 559
Tutkimus- ja kehityskulut -2 126 -1 948 -2 619 -3 081
Myynnin ja hallinnon kulut -1 651 -1 453 -1 671 -2 062
Liiketoiminnan muut tuotot ja kulut 12 -95 -5361 -1 2372
Liikevoitto/-tappio 1 688 1 412 519 -821
Osuus osakkuusyhtiöiden ja yhteisyritysten tuloksista 29 -12 4 -1
Rahoitustuotot ja -kulut -177 -401 -280 -357
Voitto/tappio ennen veroja 1 540 999 243 -1 179
Tuloverotuotot/-kulut -346 1 718 -202 -304
Jatkuvien toimintojen
voitto/tappio 1 194 2 718* 41 -1 483
Jakautuminen:
Emoyhtiön osakkeenomistajille 1 192 2 710* 186 -771 Määräysvallattomille
omistajille 2 8 -145 -712

16
Lopetettujen toimintojen
voitto/tappio 1 274 758* -780 -2 303
Jakautuminen:
Emoyhtiön osakkeenomistajille 1 274 752 -801 -2 334
Määräysvallattomille
omistajille 0 6 21 31
Tilikauden voitto/tappio 2 468 3 476 -739 -3 786
Jakautuminen:
Emoyhtiön osakkeenomistajille 2 466 3 462 -615 -3 105
Määräysvallattomille omistajille 2 14 -124 -681
Osakekohtainen tulos
(emoyhtiön
osakkeenomistajille
kuuluvalle voitolle/tappiolle)
Laimentamaton, EUR
Jatkuvat toiminnot 0,32 0,73 0,05 -0,21 Lopetetut toiminnot 0,35 0,20 -0,22 -0,63
Nokia-konserni 0,67 0,94 -0,17 -0,84
Laimennettu, EUR Jatkuvat toiminnot 0,31 0,67 0,05 -0,21
Lopetetut toiminnot 0,32 0,18 -0,22 -0,63
Nokia-konserni 0,63 0,85 -0,17 -0,84
Osakkeita keskimäärin
(1 000 osaketta)
Laimentamaton Jatkuvat toiminnot 3 670 934 3 698 723 3 712 079 3 710 845
Lopetetut toiminnot 3 670 934 3 698 723 3 712 079 3 710 845
Nokia-konserni 3 670 934 3 698 723 3 712 079 3 710 845
Laimennettu
Jatkuvat toiminnot 3 949 312 4 131 602 3 733 364 3 710 845
Lopetetut toiminnot 3 949 312 4 131 602 3 712 079 3 710 845 Nokia-konserni 3 949 312 4 131 602 3 712 079 3 710 845
1 Sisältää ”Liiketoiminnat muut tuotot” 272 miljoonaa euroa ja ”Liiketoiminnat muut kulut” -808
miljoonaa euroa. 2 Sisältää ”Liiketoiminnat muut tuotot” 276 miljoonaa euroa ja ”Liiketoiminnat muut kulut” -1 513
miljoonaa euroa.
1.1.–31.12. 1.1.–31.12.
2015 2014 2013 2012
(tilintarkas-
tamaton)*
(tilintar-
kastamaton)
(tilintar-
kastettu)
(tilintar-
kastamaton)
KONSERNIN LAAJA
TULOSLASKELMA (milj. EUR) (milj. EUR)
Tilikauden voitto/tappio 2 468 3 476 -739 -3 786
Muut laajan tuloksen erät
Erät, joita ei siirretä
tulosvaikutteisiksi:
Etuuspohjaisten eläkejärjeste-
lyjen uudelleenarvostus 112 -275 83 -228 Tuloverot eristä, joita ei siirretä
tulosvaikutteisiksi -28 96 -3 22
Erät, jotka siirretään myö-
hemmin tulosvaikutteisiksi:
Muuntoerot -1 054 820 -496 41
Nettosijoituksen suojaus 323 -167 114 -58 Rahavirtojen suojaus -5 -30 3 -41
Available-for-sale -sijoitukset 57 106 49 35
Muut lisäykset/vähennykset, netto 1 40* 5 10
Tuloverot eristä, jotka
siirretään myöhemmin tulosvaikutteisiksi -88 16 1 12

17
Muut laajan tuloksen erät
verojen jälkeen -682 606 -244 -207
Laaja tulos 1 786 4 082 -983 -3 993
Laajan tuloksen
jakautuminen:
Emoyhtiön omistajille 1 781 4 061 -863 -3 281 Määräysvallattomille
omistajille 5 21 -120 -712
1 786 4 082 -983 -3 993
Emoyhtiön omistajille
kuuluvan laajan tuloksen
jakautuminen:
Jatkuvat toiminnot 1 457 2 350* 34 -831 Lopetetut toiminnot 324 1 711* -897 -2 450
1 781 4 061 -863 -3 281
Määräysvallattomille
omistajille kuuluvan laajan
tuloksen jakautuminen:
Jatkuvat toiminnot 5 16 -139 -740 Lopetetut toiminnot 0 5 19 28
5 21 -120 -712
31.12. 31.12.
2015 2014 2013 2012
(tilintarkas-
tamaton)*
(tilintar-
kastettu)
(tilintar-
kastettu)
(tilintarkas-
tamaton)
KONSERNITASE (milj. EUR) (milj. EUR)
VASTAAVAA
Liikearvo 237 2 563 3 295 4 876
Muut aineettomat hyödykkeet 323 350 296 647 Aineelliset hyödykkeet 695 716 566 1 431
Osuudet osakkuusyhtiöissä ja
yhteisyrityksissä 84 51 65 58 Available-for-sale -sijoitukset 948 828 741 689
Laskennalliset verosaamiset 2 634 2 720 890 1 279
Pitkäaikaiset lainasaamiset 49 34 96 125
Ennakkomaksut eläkkeistä1 25 31 38 152
Muut pitkäaikaiset saamiset1 51 47 61 66
Pitkäaikaiset varat 5 046 7 339 6 048 9 323
Vaihto-omaisuus 1 014 1 275 804 1 538
Myyntisaamiset, oikaistuna
arvonalentumiskirjauksilla 3 913 3 429* 2 901 5 551 Siirtosaamiset ja
ennakkomaksut 749 913 660 2 682
Tuloverosaamiset 171 124 146 495 Lyhytaikainen osuus
pitkäaikaisista lainasaamisista 21 1 29 35
Muut rahoitusvarat 107 266 285 451 Käypään arvoon tulos-
vaikutteisesti kirjattavat
sijoitukset, likvidit varat 687 418 382 415 Available-for-sale -sijoitukset,
likvidit varat 2 167 2 127 956 542
Rahavarat2 6 995 5 170 7 633 8 952
Lyhytaikaiset varat 15 824 13 724 13 796 20 661
Myytävänä olevat aineelliset
hyödykkeet - - 89 - Myytävänä olevien lopetettujen
toimintojen varat - - 5 258 -
Vastaavaa yhteensä 20 870 21 063 25 191 29 984
VASTATTAVAA
Osakepääoma 246 246 246 246 Ylikurssirahasto 380 439 615 446

18
Omat osakkeet
hankintamenoon -718 -988 -603 -629 Muuntoerot 292 1 099 434 746
Arvonmuutosrahasto 148 22 80 -5
Sijoitetun vapaan oman pääoman rahasto 3 820 3 083 3 115 3 136
Kertyneet voittovarat 6 279 4 710 2 581 3 997
Emoyhtiön omistajille
kuuluva oma pääoma 10 446 8 611 6 468 7 937
Määräysvallattomille
omistajille kuuluva osuus 21 58 192 1 302
Oma pääoma yhteensä 10 468 8 669 6 660 9 239
Pitkäaikaiset korolliset velat 2 023 2 576 3 286 5 087
Laskennalliset verovelat 62 32 195 701
Myynnin jaksotukset ja muut pitkäaikaiset velat 1 677 2 197 630 997
Varaukset 250 301 242 304
Pitkäaikainen vieras pääoma 4 011 5 107* 4 353 7 089 Lyhytaikainen osuus
korollisista veloista 1 1 3 192 201
Lyhytaikaiset velat 50 115 184 261 Muut lyhytaikaiset rahoitus-
velat 113 174 35 90
Tuloverovelat 446 481 484 499 Ostovelat 1 910 2 313 1 842 4 394
Siirtovelat, myynnin
jaksotukset ja muut velat 3 395 3 632 3 033 6 223 Varaukset 476 572 680 1 988
Lyhytaikainen vieras pääoma 6 391 7 288 9 450 13 656
Myytävänä olevien lopetettujen
toimintojen velat - - 4 728 -
Vastattavaa yhteensä 20 870 21 063 25 191 29 984
1 Aikaisemmin rivillä ”Muut pitkäaikaiset varat” raportoidut ennakkomaksut eläkkeistä on esitetty
erikseen 30.6.2015 lähtien, ja aikaisemmilta jaksoilta esitetyt tiedot on oikaistu vastaavasti. 2 ”Rahavarat” ja ”Available-for-sale -sijoitukset, likvidit varat” on esitetty yhdellä rivillä ”Rahavarat”
30.6.2015 lähtien, ja aikaisemmilta jaksoilta esitetyt tiedot on oikaistu vastaavasti.
1.1.–31.12. 1.1.–31.12.
2015 2014 2013 2012
(tilintarkas-
tamaton)*
(tilintarkastettu)
KONSERNIN
RAHAVIRTALASKELMA (milj. EUR) (milj. EUR)
Liiketoiminnan nettorahavirta 507 1 275 72 -354
Investointien nettorahavirta 1 896 886 -691 562
Rahoitustoimintojen nettorahavirta -584 -4 576 -477 -465
Muuntoero-oikaisu 6 -48 -223 -27
Rahavarojen lisäys/vähennys 1 825 -2 463 -1 319 -284 Rahavarat tilikauden alussa 5 170 7 633 8 952 9 236
Rahavarat tilikauden lopussa 6 995 5 170 7 633 8 952

19
Tunnusluvut
1.1.–31.12. 1.1.–31.12.
2015 2014 2013 2012
(tilintarkas-
tamaton)* (tilintarkastamaton)
Tunnusluvut
raportointipäivänä
Jatkuvat toiminnot
Osakekohtainen tulos
(emoyhtiön omistajille
kuuluvasta voitosta)
Osakekohtainen tulos, laimentamaton, EUR 0,32 0,73 0,051 -0,21
Osakekohtainen tulos,
laimennettu, EUR 0,31 0,67 0,051 -0,21 P/E-luku, laimentamaton 20,61 8,99 116,40 neg.
Tavallinen osakekohtainen
osinko, EUR* 0,164 0,14 0,11 0 Erityinen osakekohtainen
osinko, EUR* 0,164 0 0,26 0
Osingot, milj. EUR 1 500 511 1 374 0 Osingonjakosuhde,
laimentamaton2 0,50 0,19* 2,20* 0
Osinkotuotto, %3 2,43 2,13 1,89* 0 Osakekohtainen oma pääoma,
milj. EUR 2,65 2,36 1,74 2,14
Osakekannan markkina-arvo, milj. EUR 25 979 23 932 21 606 10 873
1 Osakekohtaiset tulokset (laimennettu ja laimentamaton) 31.12.2013 päättyneeltä vuodelta on
tilitarkastettu. 2 Osingonjakosuhde, laimentamaton on laskettu osakekohtaisesta osingosta, EUR. Osingonjakosuhde
sisältäen osakekohtaisen lisäosingon on 31.12.2015 päättyneeltä vuodelta 0,81, 31.12.2014 päättyneeltä
vuodelta 0,19 ja 31.12.2013 päättyneeltä vuodelta 7,40.* 3 Osinkotuotto, % on laskettu osakekohtaisesta osingosta, EUR. Osinkotuotto, % sisältäen
osakekohtaisen lisäosingon on 31.12.2015 päättyneeltä vuodelta 3,94, 31.12.2014 päättyneeltä vuodelta
2,13 ja 31.12.2013 päättyneeltä vuodelta 6,36.* 4 Osinko ja lisäosinko vuodelta 2015 perustuvat Nokian hallituksen ehdotukseen. Päätöksen osingon
jakamisesta tekee vuoden 2016 varsinainen yhtiökokous.*
Marraskuussa 2011 Nokia Networks tiedotti strategiastaan keskittyä
mobiiliverkkoihin ja -palveluihin. Se tiedotti myös laajasta globaalista
uudelleenjärjestelyohjelmasta, joka lopulta johti sen vuosittaisten operatiivisten
kulujen ja tuotantokulujen laskuun yli 1,5 miljardilla eurolla, kun ohjelma saatiin
päätökseen vuoden 2013 lopussa. Osana strategiaansa keskittyä mobiiliverkkoihin,
Nokia Networks myös luopui useasta ei-ydinliiketoiminnasta.
Vuodesta 2013 eteenpäin Nokia toteutti useita transaktioita muuttaakseen
liiketoimintaportfoliotaan. 1.7.2013 Nokia tiedotti sopimuksesta, jolla se osti
Siemensiltä sen 50 % osuuden yhtiöiden yhteisyrityksestä Nokia Siemens
Networksista. Ostohinta oli 1,7 miljardia euroa ja kauppa toteutettiin 7.8.2013. Nokia
tiedotti 3.9.2013, että se oli allekirjoittanut sopimuksen myydäkseen Devices &
Services -liiketoimintansa Microsoftille yhteensä 5,44 miljardin euron hintaan, josta
3,79 miljardia liittyivät Devices & Services -liiketoiminnan myyntiin ja 1,65 miljardia
liittyivät molemminpuoleiseen patenttilisenssisopimukseen. Transaktion yhteydessä
Nokia perusti Nokia Technologies -liiketoiminnan, joka keskittyisi teknologian
kehitykseen ja immateriaalioikeusaktiviteetteihin. Transaktio vahvisti merkittävästi
Yhtiön taloudellista asemaa, ja transaktion jälkeen vuonna 2014 Nokia aloitti
pääomarakenteen optimoinnin ja aloitti uudelleen osingonjaon, jakoi ylimääräistä
pääomaa osakkeenomistajille ja vähensi korollista velkaansa.
15.4.2015 Nokia jatkoi muutostaan tiedottamalla, että se oli allekirjoittanut
sopimuksen Alcatel Lucentin ostamisesta Osakevaihtotarjouksella tarjoamalla 0,5500
uutta Nokian osaketta jokaisesta Alcatel Lucentin osakkeesta. Tiedotteen yhteydessä

20
Nokia julkisti, että se on siitä hetkestä lähtien keskeyttänyt pääomarakenteen
optimointiohjelmansa. 3.8.2015 Nokia tiedotti solmineensa sopimuksen HERE-
liiketoimintansa myymisestä johtavien autonvalmistajien yhteenliittymälle ja arvioi
saavansa hieman yli 2,5 miljardin euron nettotuoton. Kauppa saatiin päätökseen
4.12.2015.* Nokia julkisti 29.10.2015 suunnitelmansa 7 miljardin euron
pääomarakenteen optimointiohjelmasta ja pääoman palautuksista
osakkeenomistajille, minkä ehtona on Alcatel Lucent- ja HERE-transaktioiden
toteutuminen sekä kaikkien Nokian ja Alcatel Lucentin vaihtovelkakirjalainojen
vaihtaminen osakkeiksi.
Nokia saavutti määräysvallan Alcatel Lucentissa 4.1.2016 76,31 %:n
osakeomistuksella ja vähintään 76,01 %:lla kaikista äänistä, kun AMF julkaisi
Osakevaihtotarjouksen ensisijaisen tarjousajan lopullisen tuloksen. Nokian ja
Alcatelin toiminta yhdistyneenä yhtiönä alkoi 14.1.2016. Samana päivänä Nokia
käynnisti Osakevaihtotarjouksessa jatketun tarjousajan. Osakevaihtotarjouksen
jatketun tarjousajan tulos julkaistiin 10.2.2016, ja sen myötä Nokia omistaa 91,25 %
Alcatel Lucentin kaikista osakkeista ja vähintään 91,17 % äänistä.*
Alcatel Lucent
Seuraavissa taulukoissa on esitetty Alcatel Lucentin valikoituja konsolidoituja
taloudellisia tietoja. Esitetyt tiedot perustuvat Listalleottoesitteen liitteessä A
esitettyyn Alcatel Lucentin konsernitilinpäätökseen 31.12.2014 päättyneeltä vuodelta
ja sen liitetietoihin sekä Listalleottoesitteeseen viittaamalla sisällytettyihin Alcatel
Lucentin konsernitilinpäätöksiin 31.12.2013 ja 31.12.2012 päättyneiltä vuosilta ja
niiden liitetietoihin sekä Alcatel Lucentin tilintarkastamattomaan tilinpäätökseen
31.12.2015 päättyneeltä vuodelta, ja tässä esitettyjä taloudellisia tietoja tulee
tarkastella yhdessä niiden kanssa. Valikoidut historialliset konsernin tuloslaskelma-
ja rahavirtatiedot 31.12.2014, 31.12.2013 ja 31.12.2012 päättyneiltä vuosilta sekä
konsernitasetiedot 31.12.2014, 31.12.2013 ja 31.12.2012 perustuvat Alcatel Lucentin
tilintarkastettuihin konsernitilinpäätöksiin, jotka on laadittu IFRS:n mukaisesti.
Valikoidut historialliset konsernin tuloslaskelma- ja rahavirtatiedot 31.12.2015
päättyneeltä vuodelta sekä konsernitasetiedot 31.12.2015 perustuvat Alcatel Lucentin
tilintarkastamattomaan tilinpäätökseen 31.12.2015 päättyneeltä vuodelta, joka on
laadittu IFRS:n mukaisesti.*
Alcatel Lucentin helmikuussa 2014 saaman sitovan tarjouksen jälkeen Alcatel Lucent
saattoi 30.9.2014 loppuun 85 % osuuden myynnin sen Enterprise-liiketoiminnasta
China Huaxinille, saaden käteisvoittoa 205 miljoonaa euroa. Tämän kaupan
seurauksena Enterprise-liiketoiminnan tuloksia 31.12.2014 päättyneeltä vuodelta
kohdeltiin lopetettuina toimintoina ja 31.12.2013 ja 31.12.2012 päättyneet vuodet on
uudelleen esitetty vastaavasti.
1.1.–31.12.
2015 2014 20131 20121
(tilintarkas-
tamaton)* (tilintarkastettu)
KONSERNIN
TULOSLASKELMA
(milj. EUR,
paitsi per
osaketieto) (milj. EUR, paitsi per osaketieto)
Liikevaihto 14 275 13 178 13 813 13 764
Hankinnan ja valmistuksen
kulut -9 132 -8 770 -9 491 -9 753
Bruttokate 5 143 4 408 4 322 4 011
Myynnin ja hallinnon kulut -1 761 -1 621 -1 862 -2 161
Tutkimus- ja kehityskulut -2 378 -2 215 -2 268 -2 330
Liikevoitto/-tappio ennen
uudelleenjärjestelykuluja, 1 004 572 192 -480

21
oikeudenkäyntikuluja,
myyntivoittoja/-tappioita
myydyistä konserniyhtiöistä,
arvonalentumisia ja muutoksia
työsuhteiden päättymisen
jälkeisiä etuuksia koskeviin
järjestelyihin Uudelleenjärjestelykulut -401 -574 -518 -479 Oikeudenkäynnit -20 7 -2 2
Myyntivoitto/-tappio
myydyistä konserniyhtiöistä -1 20 2 11 Transaktioon liittyvät kulut -104 - - -
Arvonalentumiset -193 - -548 -894
Muutokset työsuhteen päättymisen jälkeisiä etuuksia
koskeviin järjestelyihin 404 112 135 204
Liikevoitto/-tappio 689 137 -739 -1 636
Rahoituskulut -269 -291 -392 -279
Muut rahoitustuotot/-kulut -136 -211 -318 -394
Osuus osakkuusyhtiöiden ja
yhteisyritysten nettotuloksista 2 15 7 5
Voitto/tappio ennen veroja ja
lopetettuja toimintoja 286 -350 -1 442 -2 304
Tuloverotuotot/-kulut 16 316 173 -423
Jatkuvien toimintojen
voitto/tappio 302 -34 -1 269 -2 727
Lopetettujen toimintojen
voitto/tappio -16 -49 -25 639
Tilikauden voitto/tappio 286 -83 -1 294 -2 088
Jakautuminen:
Emoyhtiön
osakkeenomistajille 257 -118 -1 304 -2 011
Määräysvallattomille
omistajille 29 35 10 -77
Osakekohtainen tulos, EUR2
Laimentamaton osakekohtainen
tulos:
Jatkuvat toiminnot 0,10 -0,02 -0,53 -1,11
Lopetetut toiminnot -0,01 -0,02 -0,01 0,27 Emoyhtiön osakkeenomistajille
kuuluva osuus 0,09 -0,04 -0,54 -0,84
Laimennettu osakekohtainen tulos:
Jatkuvat toiminnot 0,10 -0,02 -0,53 -1,11
Lopetetut toiminnot -0,01 -0,02 -0,01 0,22 Emoyhtiön osakkeenomistajille
kuuluva osuus 0,09 -0,04 -0,54 -0,84
1 Vuosien 2013 ja 2012 luvut on oikaistu huomioiden lopetettujen toimintojen vaikutus. 2 Alcatel Lucent korotti osakepääomaansa vuonna 2013 tarjoamalla etuoikeutettuja
merkintäetuoikeuksia olemassa oleville osakkeenomistajilleen, minkä seurauksena laimentamatonta ja
laimennettua osakekohtaista tulosta on oikaistu takautuvasti. Ulkona olevien osakkeiden lukumäärä on oikaistu osakemäärän suhteellisen muutoksen mukaisesti.
0.09

22
1.1.–31.12. 1.1.–31.12.
2015 2014 2013 2012
(tilintarkas-
tamaton)* (tilintarkastettu)
KONSERNIN LAAJA
TULOSLASKELMA (milj. EUR) (milj. EUR)
Tilikauden voitto/tappio 286 -83 -1 294 -2 088
Erät, jotka siirretään myö-
hemmin tulosvaikutteisiksi: 386 510 -221 -4
Available-for-sale -sijoitukset 2 8 11 16
Muuntoerot 384 503 -232 -34
Rahavirtojen suojaus - -1 - 14 Omaan pääomaan suoraan
kirjattaviin eriin liittyvät verot - - - -
Erät, joita ei siirretä
tulosvaikutteisiksi: 878 -1 568 1 411 71
Vakuutusmatemaattiset voitot/
tappiot ja oikaisut, jotka
johtuvat omaisuuserän
enimmäismäärän
rajoittamisesta ja IFRIC 14 -tulkinnasta 933 -1 822 1 667 172
Omaan pääomaan suoraan
kirjattaviin eriin liittyvät verot -55 254 -256 -101
Tilikauden muu laaja tulos 1 264 -1 058 1 190 67
Tilikauden laaja tulos 1 550 -1 141 -104 -2 021
Laajan tuloksen jakautuminen:
Emoyhtiön omistajille 1 467 -1 256 -99 -1 933
Määräysvallattomille
omistajille 83 115 -5 -88
31.12. 31.12.
2015 2014 2013 2012
(tilintarkas-
tamaton)* (tilintarkastettu)
KONSERNITASE (milj. EUR) (milj. EUR)
VASTAAVAA
Pitkäaikaiset varat:
Liikearvo 3 215 3 181 3 156 3 820 Muut aineettomat hyödykkeet,
netto 1 435 1 011 1 001 1 175
Liikearvo ja muut
aineettomat hyödykkeet 4 650 4 192 4 157 4 995
Aineelliset hyödykkeet 1 382 1 132 1 075 1 133
Osuudet osakkuusyhtiöissä & yhteisyrityksissä 20 51 35 29
Muut pitkäaikaiset
rahoitusvarat, netto 361 406 322 341 Laskennalliset verosaamiset 1 740 1 516 1 000 985
Ennakkomaksut eläkkeistä 2 935 2 636 3 150 2 797
Muut pitkäaikaiset saamiset 509 429 413 428
Pitkäaikaiset varat 11 597 10 362 10 152 10 708
Lyhytaikaiset varat:
Vaihto-omaisuus ja
keskeneräiset tuotteet, netto 1 600 1 971 1 935 1 940 Myyntisaamiset ja muut
saamiset, netto 2 535 2 528 2 482 2 860
Ennakkomaksut ja työn etenemisen perusteella
suoritetut maksut 45 43 46 53
Muut lyhytaikaiset varat 778 877 751 726
Tuloverosaamiset 64 64 33 118

23
Markkina-arvopaperit, netto 1 626 1 672 2 259 1 528
Rahavarat 4 905 3 878 4 096 3 401
Lyhytaikaiset varat ennen
available-for-sale -sijoituksia 11 553 11 033 11 602 10 626
Myytävänä olevat
omaisuuserät ja omaisuuserät, jotka sisältyvät luovutettavien
erien ryhmiin 39 65 142 20
Lyhytaikaiset varat 11 592 11 098 11 744 10 646
VASTAAVAA YHTEENSÄ 23 189 21 460 21 896 21 354
VASTATTAVAA
Oma pääoma:
Osakepääoma 152 141 140 4 653
Maksettu lisäosakepääoma 21 232 20 869 20 855 16 593
Vähennetään omat osakkeet
hankintamenoon -1 084 -1 084 -1 428 -1 567 Kertyneet tappiot,
arvonmuutosrahasto ja muut
rahastot -16 882 -17 633 -14 588 -15 159 Muut suoraan omaan
pääomaan kirjattavat erät 54 52 45 -
Muuntoerot -36 -366 -787 -571 Emoyhtiön omistajille kuuluva
tilikauden voitto/tappio 257 -118 -1 304 -2 011
Emoyhtiön omistajille
kuuluva oma pääoma 3 693 1 861 2 933 1 938
Määräysvallattomille
omistajille kuuluva osuus 904 833 730 745
Oma pääoma yhteensä 4 597 2 694 3 663 2 683
Pitkäaikainen vieras
pääoma:
Eläkkeet, eläkekorvaukset ja muut työsuhteen päättymisen
jälkeiset etuudet 4 506 5 163 3 854 5 338
Pitkäaikaiset vaihtovelkakirjalainat ja muut
pitkäaikaiset
joukkovelkakirjalainat 4 394 4 696 4 711 3 727
Muut pitkäaikaiset velat 238 179 211 227
Laskennalliset verovelat 946 872 990 889
Muut pitkäaikaiset velat 561 175 188 177
Pitkäaikainen vieras pääoma
yhteensä 10 645 11 085 9 954 10 358
Lyhytaikainen vieras
pääoma:
Varaukset 1 128 1 364 1 416 1 649
Lyhytaikainen osuus pitkä-aikaisista veloista ja
lyhytaikaiset velat 579 402 1 240 851
Asiakkaiden vakuudet ja ennakot 794 810 681 718
Ostovelat ja muut velat 3 578 3 571 3 518 3 726
Tuloverovelat 65 73 93 145
Muu lyhytaikaiset velat 1 789 1 429 1 237 1 204
Lyhytaikainen vieras pääoma
ennen myytävänä olevien
erien ryhmiin sisältyviä
velkoja 7 933 7 649 8 185 8 293
Myytävänä olevien erien
ryhmiin sisältyvät velat 14 32 94 20

24
Lyhytaikainen vieras pääoma
yhteensä 7 947 7 681 8 279 8 313
VASTATTAVAA
YHTEENSÄ 23 189 21 460 21 896 21 354
1.1.–31.12. 1.1.–31.12.
2015 2014 20131 20121
(tilintarkas-
tamaton)* (tilintarkastettu)
KONSERNIN
RAHAVIRTALASKELMA (milj. EUR) (milj. EUR)
Liiketoiminnan
nettorahavirta 1 177 127 -221 -144
Investointien nettorahavirta -485 235 -1 128 -1 039
Rahoituksen nettorahavirta -211 -1 383 2 350 -12
Lopetettujen toimintojen
liiketoiminnan rahavirta 11 34 65 -71
Lopetettujen toimintojen investointien rahavirta 30 71 -64 1 066
Lopetettujen toimintojen
rahoituksen rahavirta - 65 -15 36 Valuuttakurssien muutosten
nettovaikutus 505 633 -292 23
RAHAVAROJEN MUUTOS 1 027 -218 695 -141
Rahavarat tilikauden alussa 3 878 4 096 3 401 3 533
Myytävänä olevien
toimintojen rahavarat
tilikauden alussa - - 9
Rahavarat tilikauden
lopussa2 4 905 3 878 4 096 3 400
Myytävänä olveiksi
omaisuuseriksi luokitellut
rahavarat tilikauden lopussa - - - 1
Rahavarat tilikauden
lopussa, sis. myytävänä
oleviksi omaisuuseriksi
luokitellut rahavarat
tilikauden lopussa 4 905 3 878 4 096 3 401
1 Vuosien 2013 ja 2012 luvut on oikaistu huomioiden lopetettujen toimintojen vaikutus. 2 Sisältää 1 505 miljoonan euron rahavarat maissa, joissa sovellettiin valuuttasäännöstelyä 31.12.2015 (1 019 miljoonaa euroa 31.12.2014, 756 miljoonaa euroa 31.12.2013 ja 949 miljoonaa euroa
31.12.2012). Valuuttasäännöstely saattaa rajoittaa Alcatel Lucentin tytäryhtiöiden ja Alcatel Lucentin
mahdollisuuksia käyttää näitä rahavaroja.
19.6.2013 Alcatel Lucent julkisti Shift Plan -rakennemuutosohjelman, joka on
yksityiskohtainen kolmivuotissuunnitelma Alcatel Lucentin muuttamiseksi IP, Cloud
Networking ja Ultra Broadband Access -palvelujen erikoistoimittajaksi. Osana tätä
prosessia 1.7.2013 alkaen Alcatel Lucent toteutti uuden organisaatiorakenteen, joka
astui voimaan 1.7.2013, ja joka koostuu kolmesta raportoitavasta segmentistä: Core
Networking, Access ja Other.
Shift Plan -rakennemuutosohjelma on tähdännyt investointeihin Core Networking -
liiketoiminnassa (mukaan lukien IP Routing-, IP Transport- ja IP Platforms- sekä
näihin liittyvät palvelut) lisäten Access-segmentin toiminnallista rahavirtaa sekä
teknologisia kumppanuuksia. Shift Plan -rakennemuutosohjelma on myös keskittynyt
monipuolistamaan Alcatel Lucentin markkinaa sekä tasapainottamaan Alcatel
Lucentin kustannusrakennetta. Erityisesti Shift Plan -rakennemuutosohjelma tähtää
vähentämään Alcatel Lucentin kiinteiden kustannusten määrää 950 miljoonalla
eurolla vuonna 2015 verrattuna sen vuoden 2012 kustannusten määrään. Alcatel

25
Lucent on todennut, että se odottaa Shift Plan -rakennemuutosohjelman johdosta
kumulatiivisten rakenteensa uudelleenjärjestelystä aiheutuvien
käteiskuluvähennysten olevan noin 1,8 miljardia euroa, josta noin 1,4 miljardia euroa
syntyvät vuosien 2013 ja 2015 välillä ja loput vuonna 2016.
Osana Shift Plan -rakennemuutosohjelmaa Alcatel Lucent on lisäksi toteuttanut
lukuisia yritysjärjestelyjä sekä uudelleenprofiloinut ja vähentänyt yhtiön velkojen
määrää.
Nokia saavutti määräysvallan Alcatel Lucentissa 4.1.2016 76,31 %:n
osakeomistuksella ja vähintään 76,01 %:lla kaikista äänistä, kun AMF julkaisi
Osakevaihtotarjouksen ensisijaisen tarjousajan lopullisen tuloksen. Nokian ja
Alcatelin toiminta yhdistyneenä yhtiönä alkoi 14.1.2016. Samana päivänä Nokia
käynnisti Osakevaihtotarjouksessa jatketun tarjousajan. Osakevaihtotarjouksen
jatketun tarjousajan tulos julkaistiin 10.2.2016, ja sen myötä Nokia omistaa 91,25 %
Alcatel Lucentin kaikista osakkeista ja vähintään 91,17 % äänistä. *
B.9 Tulosennus-
teet ja -arviot
Ei sovellu.*
C.7 Osingonjako-
periaatteet
Nokia tiedotti 11.2.2016, että Nokian hallitus tulee ehdottamaan vuoden 2016
varsinaiselle yhtiökokoukselle, että vuodelta 2015 maksetaan osinkoa 0,16 euroa
osakkeelta ja että sen lisäksi maksetaan ylimääräistä osinkoa 0,10 euroa osakkeelta.
Päätöksen osingon jakamisesta tekee vuoden 2016 varsinainen yhtiökokous.*
Supplements to the section “Dividends and Dividend Policy — Nokia”
The information under the section “Dividends and Dividend Policy — Nokia” on page 189 of the Listing Prospectus is
supplemented with the following information:
On February 11, 2016, Nokia announced that the Board of Directors of Nokia will propose to the Annual General
Meeting in 2016 a dividend of EUR 0.16 per share for 2015 and a special dividend of EUR 0.10 per share. The
resolution on the dividend will be made by the Annual General Meeting in 2016.
Supplements to the section “Operating and Financial Review and Prospects — Nokia — Recent Developments”
The information under the section “Operating and Financial Review and Prospects — Nokia — Recent Developments”
on pages 252–253 of the Listing Prospectus is supplemented with the following information:
On February 10, 2016, Nokia announced the results of its successful reopened Exchange Offer for Alcatel Lucent
Securities. Nokia will hold 91.25% of the share capital of Alcatel Lucent, following the settlement of the Alcatel
Lucent Securities tendered into the reopened offer, which is expected to occur on February 12, 2016. This equates to
Nokia holding 88.07% of the share capital of Alcatel Lucent on a fully diluted basis.
Nokia confirmed that it will issue approximately 321 million new Nokia Shares as consideration for the Alcatel Lucent
Securities that have been tendered into the reopened Exchange Offer. Nokia expects to register these new Nokia Shares
with the Finnish Trade Register on February 12, 2016. After the registration, the total number of Nokia Shares will
equal approximately 5 769 million shares. The trading in the new Nokia Shares is expected to commence on February
15, 2016.
Assuming the conversion of all remaining outstanding Alcatel Lucent Securities into Nokia Shares at the exchange
ratio offered in the Exchange Offer, the total number of Nokia Shares would equal approximately 6 billion shares.
On February 10, 2016, Nokia announced that the USD 1.85 billion aggregate principal amount of senior notes issued
by Alcatel Lucent USA Inc., comprising the USD 650 million 4.625% notes due July 2017, USD 500 million 8.875%

26
notes due January 2020 and USD 700 million 6.750% notes due November 2020, had been redeemed in accordance
with terms and conditions of the notes. Alcatel Lucent USA Inc. is a subsidiary of Alcatel Lucent S.A.
The redemption was part of Nokia’s EUR 7 billion capital structure optimization program announced on October 29,
2015, which focuses on, among other things, reducing interest-bearing liabilities of the combined Nokia and Alcatel
Lucent by approximately EUR 2 billion.
Alcatel Lucent S.A. had also on February 9, 2016 terminated its EUR 504 million revolving credit facility. Following
these transactions all debt items in the Combined Company capital structure are based on investment grade
documentation and have no financial covenants.
On February 11, 2016, Nokia announced that, as of the first quarter 2016, Nokia expects to align its financial reporting
under two areas: the Networks business and Nokia Technologies. The Networks business will be comprised of four
business groups: Mobile Networks, Fixed Networks, Applications & Analytics and IP/Optical Networks. Nokia
Technologies will continue to operate as a separate business group, with a clear focus on licensing and the incubation
of new technologies, and will include the licensing and portfolio management operations from Alcatel Lucent. In
addition, Nokia expects to operate the undersea cables business, Alcatel Lucent Submarine Networks (ASN), and the
antenna systems business, Radio Frequency Systems (RFS), as separate entities and plans to report ASN and RFS as
part of Group Common Functions.
Supplements to the section “Operating and Financial Review and Prospects — Nokia — Prospects”
The information under the section “Operating and Financial Review and Prospects — Nokia — Prospects” on pages
253–254 of the Listing Prospectus is replaced with the following information:
This section “Prospects” includes forward-looking statements. Forward-looking statements are no guarantees of
future developments, and Nokia’s actual results may differ materially from the results described in or implied by
forward-looking statements contained herein due to various factors, some of them described in the sections
“Cautionary Statement Regarding Forward-Looking Statements” and “Risk Factors”. Nokia cautions investors not
to place undue reliance on these forward-looking statements, which speak only as at the date of the Listing Prospectus,
as supplemented from time to time.
The following table sets forth Nokia’s outlook as disclosed in conjunction with the unaudited interim report of Nokia
for the year ended December 31, 2015.
This outlook does not constitute a profit forecast, and no auditor’s statement has been issued thereon.
Metric1 Guidance Commentary
Nokia Annual operating
cost synergies
Approximately EUR 900
million of net operating
cost synergies to be
achieved in full year 2018
Compared to the combined non-IFRS
operating costs of Nokia and Alcatel Lucent
for full year 2015. Expected to be derived
from a wide range of initiatives related to
operating expenses and cost of sales,
including:
Streamlining of overlapping
products and services, particularly
within the Mobile Networks
business group;
Rationalization of regional and
sales organizations;
Rationalization of overhead,
particularly within manufacturing,

27
supply-chain, real estate and
information technology;
Reduction of central function and
public company costs; and
Procurement efficiencies, given
the Combined Company’s
expanded purchasing power.
Annual interest
expense reduction
Approximately EUR 200
million of reductions in
interest expenses to be
achieved on a full year
basis in 2016 (update)
Compared to the cost of debt run rate for the
combined entity at year end 2014. This is an
update to the earlier annual interest expense
reduction target of approximately EUR 200
million of reductions in interest expenses to
be achieved on a full year basis in 2017.
Networks Full year 2016 net
sales
Full year 2016
non-IFRS
operating margin
Not provided Due to the very recent acquisition of Alcatel
Lucent, Nokia believes it is not appropriate
to provide an annual outlook for the new
combined Networks business at the present
time, and intends to provide its full year
outlook in conjunction with its Q1 results
announcement. Q1 2016 net sales and non-
IFRS operating margin are expected to be
influenced by factors including:
A flattish capex environment in
2016 for Nokia’s overall
addressable market;
A declining wireless infrastructure
market in 2016, with a greater than
normal seasonal decline in Q1
2016;
Competitive industry dynamics;
Product and regional mix;
The timing of major network
deployments; and
Execution of integration and
synergy plans.
Nokia
Technologies
Full year 2016 net
sales
Not provided Due to risks and uncertainties in determining
the timing and value of significant licensing
agreements, Nokia believes it is not
appropriate to provide an annual outlook.
Factors that are outside Nokia’s influence affecting the outlook relate mainly to a flattish capex environment in 2016
for Nokia’s overall addressable market, a declining wireless infrastructure market in 2016, with greater than normal
seasonal decline in Q1 2016, competitive industry dynamics, product and regional mix, and the timing of major
network deployments. Additional risk factors can be found in the section “Risk Factors—Risks Relating to the
Operating Environment, Business and Financing of Nokia”.

28
Supplements relating to the section “Capitalization and Indebtedness of Nokia”
The section “Capitalization and Indebtedness of Nokia” on pages 187–188 of the Listing Prospectus is replaced with
the information presented herein.
The following table sets forth Nokia Group’s capitalization and indebtedness as at December 31, 2015 derived from
the unaudited interim report of Nokia for the year ended December 31, 2015. This table should be read together with
the unaudited interim report of Nokia for the year ended December 31, 2015, which is incorporated by reference into
this Listing Prospectus, as well as the following section “Operating and Financial Review and Prospects—Nokia”,
including “—Liquidity and Capital Resources”.
EUR million
As of December 31,
2015
Actual
(unaudited)
Capitalization
Short-term interest-bearing liabilities 51
Unguaranteed/Unsecured 51
Guaranteed/Secured -
Long-term interest-bearing liabilities 2 023
Unguaranteed/Unsecured 2 023
Guaranteed/Secured -
Total interest-bearing liabilities 2 074
Shareholders’ equity
Share capital 246
Share issue premium 380
Treasury shares at cost (718)
Translation differences 292
Fair value and other reserves 148
Reserve for invested non-restricted equity 3 820
Retained earnings 6 279
Capital and reserves attributable to equity holders of the parent 10 446
Non-controlling interest 21
Total equity 10 468
Total shareholders’ equity and interest-bearing liabilities 12 542
Net indebtedness
Cash and cash equivalents 6 995
Available-for-sale investments, liquid assets 2 167
Investments at fair value through profit and loss, liquid assets 687
Liquidity 9 849
Current portion of long-term interest bearing liabilities 1
Short-term borrowings 50
Total short-term interest bearing liabilities 51
Net current financial indebtedness (net cash) 9 798
Long-term interest-bearing liabilities 2 023
Net financial indebtedness (net cash) 7 775

29
Nokia obtained control of Alcatel Lucent on January 4, 2016. Following the initial and reopened Exchange Offer,
Nokia holds 91.25% of the share capital and 91.17% of the voting rights of Alcatel Lucent. Based on the results of the
initial and reopened Exchange Offer, a total of 1.8 billion new Nokia Shares are issued to the holders of Alcatel Lucent
Securities tendered in the Exchange Offer. The closing price of the Nokia Share on Nasdaq Helsinki as at the date of
acquisition (i.e. January 4, 2016) was EUR 6.58.
The following table sets forth Alcatel Lucent's indebtedness as at December 31, 2015. The information presented below
has been derived from Alcatel Lucent’s unaudited consolidated financial statements at December 31, 2015, which are
incorporated by reference into this Listing Prospectus, and should be read together therewith.
Net indebtedness
Marketable securities – short-term, net 1 626
Cash and cash equivalents 4 905
Liquidity 6 531
Current portion of long term debt – bonds and credit facilities 1) 2) 190
Current portion of other long-term debt and short-term debt 389
Total short-term interest bearing liabilities 579
Net current financial indebtedness (net cash) 5 952
Convertible bonds and other bonds, long-term 1) 2) 4 394
Other long-term debt 238
Net financial indebtedness (net cash) before derivative instrument
adjustments 1 320
Derivative instruments on financial debt 88
Net financial indebtedness (net cash) 1 409
1) The carrying value of the 2018 OCEANEs, 2019 OCEANEs and 2020 OCEANEs that were outstanding was
EUR 1 302 million as of December 31, 2015. As a result of the Exchange Offer, Nokia holds 99.62%, 37.18%
and 68.17% of the 2018 OCEANEs, 2019 OCEANEs and 2020 OCEANEs, respectively. After consideration
of the tendered OCEANEs, the remaining OCEANEs carrying amount outstanding as of December 31, 2015
was EUR 473 million.
2) The total amount of outstanding Alcatel Lucent senior notes as of December 31, 2015 was EUR 3 282 million
(carrying value) that will be assumed by Nokia through the acquisition. Nokia announced on February 10,
2016 that the USD 1 850 million (EUR 1 699 million) aggregate principal amount of senior notes issued by
Alcatel Lucent USA Inc., comprising the USD 650 million 4.625% notes due July 2017, USD 500 million
8.875% notes due January 2020 and USD 700 million 6.750% notes due November 2020, had been redeemed
on February 10, 2016 in accordance with the terms and conditions of the notes. The carrying value for the
redeemed bonds as of December 31, 2015 was EUR 1 682 million. The redemption is part of Nokia’s planned
EUR 7 billion capital structure optimization program announced on October 29, 2015, which focuses on,
among other things, reducing interest-bearing liabilities of the combined Nokia and Alcatel Lucent by
approximately EUR 2 billion.
Alcatel Lucent S.A. has also on February 9, 2016 terminated its EUR 504 million revolving credit facility. Following
these transactions, all debt items in the Combined Company capital structure are based on investment grade
documentation and have no financial covenants. Alcatel Lucent had not utilized the revolving credit facility as of
December 31, 2015.
Nokia’s Board of Directors will propose to the Annual General Meeting of Nokia in 2016 a dividend of EUR 0.16 per
share for 2015 and a special dividend of EUR 0.10 per share. The distributable funds on the balance sheet of the parent
company as at December 31, 2015 amounted to EUR 9 456 million. Proposed dividend is estimated to result in a

30
payout of approximately EUR 1 500 million in total dividend. The proposed dividend is calculated based on a total
number of Nokia Shares of approximately 5.8 billion shares. The resolution on the dividend will be made by the Annual
General Meeting in 2016.
For information on Nokia’s contractual, contingent and off-balance sheet liabilities, refer to Note 11. Commitments
and contingencies, Nokia Group, continuing operations, reported (unaudited) on page 47 of the unaudited interim
report of Nokia for the year ended December 31, 2015, incorporated by reference into this Listing Prospectus.
For information Alcatel Lucent’s contractual, contingent and off-balance sheet liabilities, refer to Note 28 Contractual
obligations and off balance sheet commitments on pages 79–84 of the Alcatel Lucent Q4 Results Release, incorporated
by reference into this Listing Prospectus.

31
Supplements relating to the section “Selected Financial Information”
The section “Selected Financial Information” on pages 190–197 of the Listing Prospectus is replaced with the
information presented herein.
Readers should note that the amended paragraphs or information, as applicable, have been marked with an asterisk (*).
Nokia
The following tables set forth selected consolidated financial information for Nokia. This information is qualified by
reference to, and should be read in conjunction with, Nokia’s consolidated financial statements and the notes thereto
for the years ended December 31, 2014, 2013 and 2012 and the unaudited interim report of Nokia for the year ended
December 31, 2015, all of which are incorporated by reference into this Listing Prospectus. The selected consolidated
historical income statement and statement of cash flow data for the years ended December 31, 2014, 2013 and 2012
and the consolidated statement of financial position data as of December 31, 2014, 2013 and 2012 have been derived
from Nokia’s audited consolidated financial statements for the respective years, prepared in accordance with the
International Financial Reporting Standards (“IFRS”). The selected consolidated historical income statement and
statement of cash flow data for the year ended December 31, 2015 and the consolidated statement of financial
position as of December 31, 2015 have been derived from the unaudited interim report of Nokia for the year ended
December 31, 2015, prepared in accordance with IFRS.*
In September 2013, Nokia announced the sale of substantially all of its Devices & Services Business to Microsoft.
Subsequent to the approval for the sale received in the Extraordinary General Meeting in November 2013, Nokia
Group has presented Devices & Services Business as discontinued operations. The sale was completed on April 25,
2014. In the consolidated income statement for the year 2013 the financial results of the Devices & Services Business
were reported as discontinued operations separately from the continuing operations. The income statement
information for the year 2012 were restated accordingly. As of January 1, 2013 Nokia adopted new revised IAS 19
Employee Benefits standard. As a result, the net pension liabilities and other comprehensive income were impacted
mainly by the retrospectively applied elimination of the ’corridor’ approach and financial information for the year
2012 were adjusted accordingly. Thus, the restated information for the year 2012 presented in the following tables is
unaudited.
On August 3, 2015, Nokia announced an agreement to sell its HERE digital mapping and location services business
to a consortium of leading automotive companies, comprising AUDI AG, BMW Group and Daimler AG. The sale of
HERE was completed on December 4, 2015. In the unaudited consolidated income statement for the year ended
December 31, 2015, HERE has been reported as discontinued operations separately from the continuing operations.
The income statement information for the year 2014 was restated accordingly. Thus, the restated consolidated income
statement information for the year 2014 presented in the following table is unaudited. HERE has been reported as part
of Nokia’s continuing operations in the consolidated financial information for the financial years ended December 31,
2013 and 2012.*

32
Selected Historical Consolidated Financial Information for Nokia
Year ended
December 31, Year ended December 31,
2015 2014 2013 2012
(unaudited)* (unaudited) (audited) (unaudited)
CONSOLIDATED INCOME
STATEMENT
(in EUR million,
except for
shares
outstanding and
earnings per
share)
(in EUR million, except for shares
outstanding and earnings per share)
Net sales 12 499 11 763 12 709 15 400
Cost of sales (7 045) (6 855) (7 364) (9 841)
Gross profit 5 453 4 907 5 345 5 559
Research and development expenses (2 126) (1 948) (2 619) (3 081)
Selling, general and administrative
expenses (1 651) (1 453) (1 671) (2 062)
Other income and expenses 12 (95) (536) 1 (1 237) 2
Operating profit/(loss) 1 688 1 412 519 (821)
Share of results of associated
companies and joint ventures 29 (12) 4 (1)
Financial income and expenses (177) (401) (280) (357)
Profit/(loss) before tax 1 540 999 243 (1 179)
Income tax (expense)/benefit (346) 1 718 (202) (304)
Profit/(loss) from continuing
operations 1 194 2 718* 41 (1 483)
Attributable to:
Equity holders of the parent 1 192 2 710* 186 (771)
Non-controlling interests 2 8 (145) (712)
Profit/(loss) from discontinued
operations 1 274 758* (780) (2 303)
Attributable to:
Equity holders of the parent 1 274 752 (801) (2 334)
Non-controlling interests 0 6 21 31
Profit/(loss) 2 468 3 476 (739) (3 786)
Attributable to:
Equity holders of the parent 2 466 3 462 (615) (3 105)
Non-controlling interests 2 14 (124) (681)
Earnings per share (for profit/(loss)
attributable to the equity holders of
the parent)
Basic earnings per share (in EUR)
Continuing operations 0.32 0.73 0.05 (0.21)
Discontinued operations 0.35 0.20 (0.22) (0.63)
Nokia Group 0.67 0.94 (0.17) (0.84)
Diluted earnings per share (in EUR)
Continuing operations 0.31 0.67 0.05 (0.21)
Discontinued operations 0.32 0.18 (0.22) (0.63)
Nokia Group 0.63 0.85 (0.17) (0.84)
Average number of shares
(’ 000 shares)

33
Basic
Continuing operations 3 670 934 3 698 723 3 712 079 3 710 845
Discontinued operations 3 670 934 3 698 723 3 712 079 3 710 845
Nokia Group 3 670 934 3 698 723 3 712 079 3 710 845
Diluted
Continuing operations 3 949 312 4 131 602 3 733 364 3 710 845
Discontinued operations 3 949 312 4 131 602 3 712 079 3 710 845
Nokia Group 3 949 312 4 131 602 3 712 079 3 710 845
1 Consist of “Other income” of EUR 272 million and “Other expenses” of EUR (808) million. 2 Consist of “Other income” of EUR 276 million and “Other expenses” of EUR (1 513) million.
Year ended
December 31, Year ended December 31,
2015 2014 2013 2012
(unaudited)* (unaudited) (audited) (unaudited)
CONSOLIDATED STATEMENT
OF COMPREHENSIVE INCOME
(in EUR
million) (in EUR million)
Profit/(loss) 2 468 3 476 (739) (3 786)
Other comprehensive
income/(expense)
Items that will not be reclassified to
profit or loss:
Remeasurements on defined benefit
pensions 112 (275) 83 (228)
Income tax related to items that will
not be reclassified to profit or loss (28) 96 (3) 22
Items that may be reclassified
subsequently to profit or loss:
Translation differences (1 054) 820 (496) 41
Net investment hedges 323 (167) 114 (58)
Cash flow hedges (5) (30) 3 (41)
Available-for-sale investments 57 106 49 35
Other increase/(decrease), net 1 40* 5 10
Income tax related to items that may
be reclassified subsequently to profit
or loss (88) 16 1 12
Other comprehensive
income/(expense), net of tax (682) 606 (244) (207)
Total comprehensive income 1 786 4 082 (983) (3 993)
Attributable to:
Equity holders of the parent 1 781 4 061 (863) (3 281)
Non-controlling interests 5 21 (120) (712)
1 786 4 082 (983) (3 993)
Attributable to equity holders of
the parent:
Continuing operations 1 457 2 350* 34 (831)
Discontinued operations 324 1 711* (897) (2 450)
1 781 4 061 (863) (3 281)
Attributable to non-controlling
interests:
Continuing operations 5 16 (139) (740)
Discontinued operations 0 5 19 28

34
5 21 (120) (712)
As of
December 31, As of December 31,
2015 2014 2013 2012
(unaudited)* (audited) (audited) (unaudited)
CONSOLIDATED STATEMENT
OF FINANCIAL POSITION
(in EUR
million) (in EUR million)
ASSETS
Goodwill 237 2 563 3 295 4 876
Other intangible assets 323 350 296 647
Property, plant and equipment 695 716 566 1 431
Investments in associated companies
and joint ventures 84 51 65 58
Available-for-sale investments 948 828 741 689
Deferred tax assets 2 634 2 720 890 1 279
Long-term loans receivable 49 34 96 125
Prepaid pension costs1 25 31 38 152
Other non-current assets1 51 47 61 66
Non-current assets 5 046 7 339 6 048 9 323
Inventories 1 014 1 275 804 1 538
Accounts receivable, net of
allowances for doubtful accounts 3 913 3 429* 2 901 5 551
Prepaid expenses and accrued income 749 913 660 2 682
Current income tax assets 171 124 146 495
Current portion of long-term loans
receivable 21 1 29 35
Other financial assets 107 266 285 451
Investments at fair value through
profit and loss, liquid assets 687 418 382 415
Available-for-sale investments, liquid
assets 2 167 2 127 956 542
Cash and cash equivalents2 6 995 5 170 7 633 8 952
Current assets 15 824 13 724 13 796 20 661
Assets held for sale - - 89 -
Assets of disposal groups classified as
held for sale - - 5 258 -
Total assets 20 870 21 063 25 191 29 984
SHAREHOLDERS’ EQUITY AND
LIABILITIES
Capital and reserves attributable to
equity holders of the parent
Share capital 246 246 246 246
Share issue premium 380 439 615 446
Treasury shares at cost (718) (988) (603) (629)
Translation differences 292 1 099 434 746
Fair value and other reserves 148 22 80 (5)
Reserve for invested non-restricted
equity 3 820 3 083 3 115 3 136
Retained earnings 6 279 4 710 2 581 3 997
Capital and reserves attributable to
equity holders of the parent 10 446 8 611 6 468 7 937

35
Non-controlling interests 21 58 192 1 302
Total equity 10 468 8 669 6 660 9 239
Long-term interest-bearing liabilities 2 023 2 576 3 286 5 087
Deferred tax liabilities 62 32 195 701
Deferred revenue and other long-term
liabilities 1 677 2 197 630 997
Provisions 250 301 242 304
Non-current liabilities 4 011 5 107* 4 353 7 089
Current portion of interest-bearing
liabilities 1 1 3 192 201
Short-term borrowing 50 115 184 261
Other financial liabilities 113 174 35 90
Current income tax liabilities 446 481 484 499
Accounts payable 1 910 2 313 1 842 4 394
Accrued expenses, deferred revenue
and other liabilities 3 395 3 632 3 033 6 223
Provisions 476 572 680 1 988
Current liabilities 6 391 7 288 9 450 13 656
Liabilities of disposal groups
classified as held for sale - - 4 728 -
Total shareholders’ equity and
liabilities 20 870 21 063 25 191 29 984
1 Prepaid pension costs previously reported under “Other non-current assets” have been reported separately since June 30, 2015. The information for prior periods presented has been adjusted accordingly. 2 Since June 30, 2015, “Bank and cash” and “Available for sale investments, cash equivalents” have been reported as a single line item “Cash
and cash equivalents”. The information for prior periods presented has been adjusted accordingly.
Year ended
December 31, Year ended December 31,
2015 2014 2013 2012
(unaudited)* (audited)
CONSOLIDATED STATEMENT
OF CASH FLOWS
(in EUR
million) (in EUR million)
Net cash from/(used in) operating
activities 507 1 275 72 (354)
Net cash from/(used in) investing
activities 1 896 886 (691) 562
Net cash used in financing activities (584) (4 576) (477) (465)
Foreign exchange adjustment 6 (48) (223) (27)
Net increase/(decrease) in cash and
equivalents 1 825 (2 463) (1 319) (284)
Cash and cash equivalents at
beginning of period 5 170 7 633 8 952 9 236
Cash and cash equivalents at end of
period 6 995 5 170 7 633 8 952
Consolidated statement of cash flows combines cash flows from both the continuing and the discontinued operations. The figures in the consolidated statement of cash flows cannot be directly traced from the statement of financial position without additional information as a
result of acquisitions and disposals of subsidiaries and net foreign exchange differences arising on consolidation.
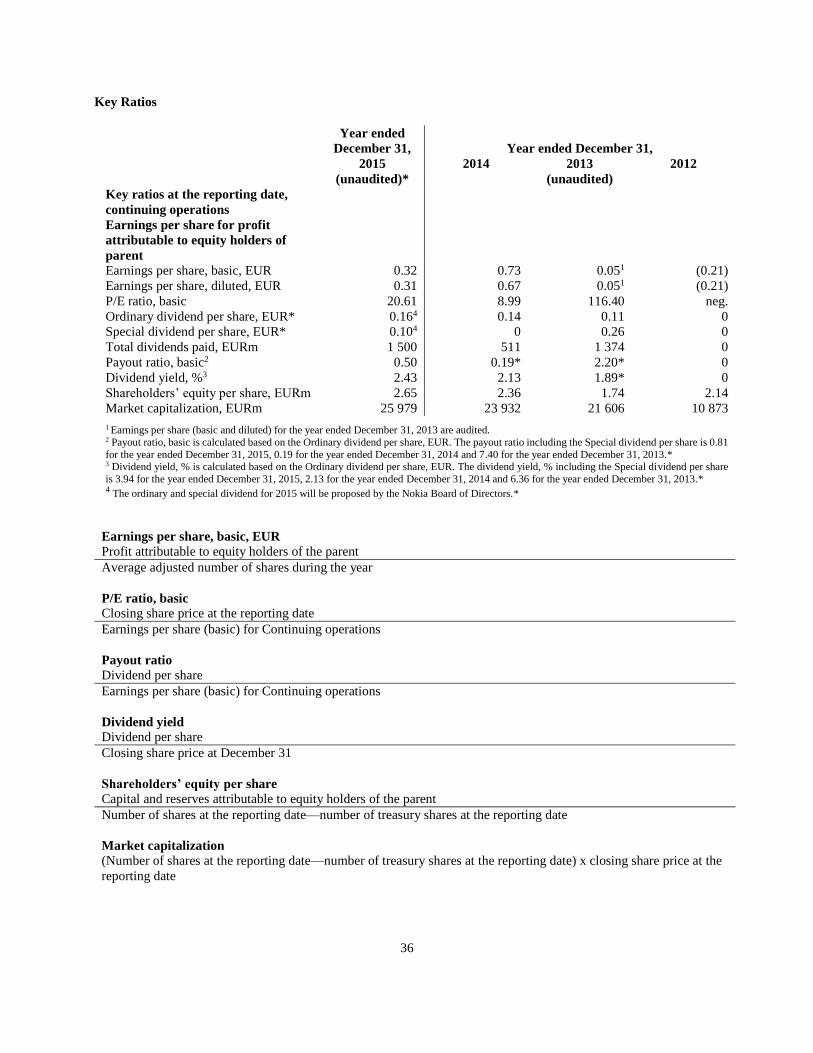
36
Key Ratios
Year ended
December 31, Year ended December 31,
2015 2014 2013 2012
(unaudited)* (unaudited)
Key ratios at the reporting date,
continuing operations
Earnings per share for profit
attributable to equity holders of
parent
Earnings per share, basic, EUR 0.32 0.73 0.051 (0.21)
Earnings per share, diluted, EUR 0.31 0.67 0.051 (0.21)
P/E ratio, basic 20.61 8.99 116.40 neg.
Ordinary dividend per share, EUR* 0.164 0.14 0.11 0
Special dividend per share, EUR* 0.104 0 0.26 0
Total dividends paid, EURm 1 500 511 1 374 0
Payout ratio, basic2 0.50 0.19* 2.20* 0
Dividend yield, %3 2.43 2.13 1.89* 0
Shareholders’ equity per share, EURm 2.65 2.36 1.74 2.14
Market capitalization, EURm 25 979 23 932 21 606 10 873
1 Earnings per share (basic and diluted) for the year ended December 31, 2013 are audited. 2 Payout ratio, basic is calculated based on the Ordinary dividend per share, EUR. The payout ratio including the Special dividend per share is 0.81
for the year ended December 31, 2015, 0.19 for the year ended December 31, 2014 and 7.40 for the year ended December 31, 2013.* 3 Dividend yield, % is calculated based on the Ordinary dividend per share, EUR. The dividend yield, % including the Special dividend per share
is 3.94 for the year ended December 31, 2015, 2.13 for the year ended December 31, 2014 and 6.36 for the year ended December 31, 2013.* 4 The ordinary and special dividend for 2015 will be proposed by the Nokia Board of Directors.*
Earnings per share, basic, EUR
Profit attributable to equity holders of the parent
Average adjusted number of shares during the year
P/E ratio, basic
Closing share price at the reporting date
Earnings per share (basic) for Continuing operations
Payout ratio
Dividend per share
Earnings per share (basic) for Continuing operations
Dividend yield
Dividend per share
Closing share price at December 31
Shareholders’ equity per share
Capital and reserves attributable to equity holders of the parent
Number of shares at the reporting date—number of treasury shares at the reporting date
Market capitalization (Number of shares at the reporting date—number of treasury shares at the reporting date) x closing share price at the
reporting date
37
Significant Change in Financial Condition or Operating Results
In November 2011, Nokia Networks announced its strategy to focus on mobile broadband and services. It also
announced an extensive global restructuring program that ultimately resulted in the reduction of its annualized
operating expenses and production overhead by over EUR 1.5 billion when the program was completed at the end of
2013. As part of its strategy of focusing on mobile broadband, Nokia Networks also divested a number of non-core
businesses.
Beginning in 2013, Nokia undertook a series of transactions to transform its business portfolio. On July 1, 2013, Nokia
announced the agreement to acquire Siemens’ 50% stake in the companies’ joint venture Nokia Siemens Networks.
The purchase price was EUR 1.7 billion and the transaction closed on August 7, 2013. On September 3, 2013, Nokia
announced that it had signed an agreement to sell its Devices & Services Business to Microsoft for a total purchase
price of EUR 5.44 billion, of which EUR 3.79 billion related to the Sale of the Devices & Services Business and EUR
1.65 billion related to a mutual patent license agreement. In conjunction with the transaction, Nokia established the
Nokia Technologies business to focus on technology development and intellectual property rights activities. The
transaction significantly strengthened the Company’s financial position and subsequent to the transaction, in 2014,
Nokia started the optimization of its capital structure and recommenced dividend payments, distributed excess capital
to shareholders and reduced its interest-bearing debt.
On April 15, 2015, Nokia continued its transformation with the announcement that it had signed an agreement to
acquire Alcatel Lucent through the Exchange Offer on the basis of 0.5500 Nokia Shares for each Alcatel Lucent Share.
In conjunction with this announcement, Nokia announced that it has suspended its capital structure optimization
program effective immediately. On August 3, 2015, Nokia announced an agreement to sell HERE to an automotive
industry consortium and estimates that it will receive net proceeds of slightly above EUR 2.5 billion. The sale of HERE
was completed on December 4, 2015.* On October 29, 2015, Nokia announced a planned EUR 7 billion program to
optimize Nokia’s capital structure and return excess capital to shareholders, subject to the closing of the Alcatel Lucent
and HERE transactions, as well as the conversion of all Nokia and Alcatel Lucent convertible bonds.
Nokia obtained control of Alcatel Lucent on January 4, 2016 when the interim results of the successful initial Exchange
Offer were announced by the AMF with a shareholding of 76.31% of the share capital and at least 76.01% of the voting
rights. On January 14, 2016, the combined operations of Nokia and Alcatel Lucent commenced. On the same day,
Nokia reopened the Exchange Offer. The results of the reopened offer period in the Exchange Offer were published
on February 10, 2016 and as a result, Nokia holds 91.25% of the share capital and at least 91.17% of the voting rights
of Alcatel Lucent.*
Sufficiency of Working Capital
In the opinion of Nokia’s management, the working capital available to Nokia is sufficient to cover its present needs
for the next 12 months following the date of this Listing Prospectus.
In order to evaluate Nokia’s working capital needs after the Acquisition, Nokia has prepared financial projections
assuming the combination of Nokia and Alcatel Lucent and excluding the HERE business. Based on these financial
projections, Nokia anticipates that the combination of Nokia and Alcatel Lucent will not adversely impact the
sufficiency of working capital for the Combined Company.

38
Alcatel Lucent
Shareholders and potential investors should note that all of the information concerning Alcatel Lucent presented in
the Listing Prospectus, as supplemented from time to time, and in particular in Annex A, is solely based on publicly
available information of Alcatel Lucent included in Alcatel Lucent Annual Report and the Alcatel Lucent Interim
Report Alcatel Lucent has filed with the SEC, as well as Alcatel Lucent Q3 Interim Report and Alcatel Lucent Q4
Results Release. Nokia confirms that this information has been accurately reproduced and that as far as Nokia is
aware and is able to ascertain from information published by Alcatel Lucent, no facts have been omitted which would
render the reproduced information inaccurate or misleading.*
Selected Historical Consolidated Financial Information for Alcatel Lucent
For information about Alcatel Lucent’s selected historical consolidated financial information, refer to sections “Alcatel
Lucent consolidated financial statements at December 31, 2014” of the Alcatel Lucent Annual Report on pages A-197
to A-201 of Annex A and pages 2 to 5 of the Alcatel Lucent Q4 Results Release.*
Significant Change in the Financial Condition or Operating Results
On June 19, 2013, Alcatel Lucent announced the Shift Plan, a detailed three-year plan to transform itself into a
specialist provider of IP and Cloud Networking and Ultra-Broadband Access. As part of this process, effective from
July 1, 2013, Alcatel Lucent implemented a new organization composed of three reportable segments: Core
Networking, Access and Other.
The Shift Plan has targeted investments in Core Networking businesses (including IP Routing, IP Transport, IP
Platforms and associates services), increasing segment operating cash flow from the Access segment, and technological
partnerships. The Shift Plan has also focused on market diversification and rightsizing Alcatel Lucent’s cost structure.
In particular, the Shift Plan aims to reduce Alcatel Lucent’s fixed-cost base by EUR 950 million in 2015 compared to
its 2012 cost base. Alcatel Lucent has stated that it expects that the cumulative amount of restructuring cash outlays
pursuant to the Shift Plan should be approximately EUR 1.8 billion, of which approximately EUR 1.4 billion will be
incurred between 2013 and 2015, with the remainder in 2016.
In addition, Alcatel Lucent has completed multiple dispositions as part of the Shift Plan and re-profiled and reduced
the financial debt of the company.
On January 5, 2016, the final results of the initial offer period in the Exchange Offer were published, and Nokia
gained control of Alcatel Lucent with a shareholding of approximately 70.52% on a fully diluted basis. On January
14, 2016, the combined operations of Nokia and Alcatel Lucent commenced. On the same day Nokia reopened the
Exchange Offer. The results of the reopened offer period in the Exchange Offer were published on February 10, 2016,
and according to them Nokia will hold approximately 88.07% of the share capital of Alcatel Lucent on a fully diluted
basis.*

39
Supplements relating to the approval by the Nokia Board of Directors of the Equity Program for 2016 and the
issuance of shares held by Nokia
The below supplement updates, in particular, the sections “Operating and Financial Review and Prospects — Nokia
— Recent Developments” on pages 252–253 of the Listing Prospectus and “Shares and Share Capital — Nokia —
Stock Options, Equity Compensation and Other Special Rights Entitling to Shares” on pages 318–323 of the Listing
Prospectus.
On February 11, 2016, Nokia announced that its Board of Directors has approved Nokia’s equity program for 2016
(the “Equity Program 2016”). In line with previous years, the Equity Program 2016 includes the following equity
instruments:
An employee share purchase plan for Nokia employees in selected jurisdictions (the “Employee Share Purchase Plan”),
entitling the eligible employees to contribute a part of their salary to purchase Nokia Shares. After a 12-month holding
period, Nokia will offer the employees one matching share for every two purchased shares held by the employee at the
end of the holding period;
Performance shares, which are dependent on the achievement of independent performance criteria (“Performance
Shares”); and
Restricted shares, which are used on a limited basis or in exceptional retention and recruitment circumstances
(“Restricted Shares”).
Equity Program 2016
The Equity Program 2016 is designed to support and align the participants’ focus with Nokia’s strategy and long-term
success. Employees of Alcatel Lucent, who have transferred to Nokia as part of the acquisition of Alcatel Lucent, are
also eligible to participate in the Equity Program 2016.
Nokia uses Performance Shares as the main long-term incentive vehicle with the intention of effectively contributing
to the long-term value creation and sustainability of the Nokia and to align interests of the employees with those of
Nokia’s shareholders. Performance Shares are also designed to ensure that the overall equity-based compensation is
based on performance, while also supporting the recruitment and ensuring retention of vital talent for the future success
of Nokia.
Restricted Shares are granted on a limited basis for exceptional purposes related to retention and recruitment, primarily
in the United States, to ensure Nokia is able to retain and recruit vital talent for the future success of Nokia.
Since 2014, stock options have no longer been part of Nokia’s equity programs.
Employee Share Purchase Plan
Under the Employee Share Purchase Plan, the eligible Nokia employees may elect to make monthly contributions from
their net salary to purchase Nokia Shares. Participation in the plan is voluntary.
The annual minimum and maximum contribution limit to the Employee Share Purchase Plan is EUR 180 and EUR
1 200, respectively. Generally, the share purchases will be made at market value on pre-determined dates on a monthly
basis during a 12-month period. In October 2017, Nokia intends to deliver one matching share for every two purchased
shares that the participant still holds on July 31, 2017, which marks the end of the Employee Share Purchase Plan cycle
for 2016. The aggregate maximum amount of contributions that employees can make during the enrolment window
for the plan cycle commencing in 2016 will be approximately EUR 60 million, which equals approximately 11 494 253
Nokia Shares using the February 8, 2016 Nokia closing price of EUR 5.22 on Nasdaq Helsinki. Based on the matching
ratio of one matching share for every two purchased shares, the number of matching shares would be approximately
5 747 126. In addition, to welcome employees of Alcatel Lucent who have transferred to Nokia as part of the

40
acquisition of Alcatel Lucent and to mark the beginning of the new Nokia Group, Nokia intends to offer 20 free shares
for every participant making the first three consecutive share purchases in 2016.
The Employee Share Purchase Plan is planned to be offered to Nokia employees in up to 54 countries for the plan
cycle commencing in 2016. The savings period is intended to start in July 2016 and the first monthly purchases are
planned to be made in August 2016.
Performance Shares
Under the Performance Share plan, target pay-out will depend on whether independent performance criteria have been
met by the end of the performance period. The performance criteria are Nokia’s continuing operations average annual
non-IFRS net sales and average annual non-IFRS earnings per share (diluted).
The Performance Share plan of 2016 has a two-year performance period (2016–2017) and a subsequent one-year
restriction period. The number of Performance Shares to be settled after the restriction period will start at 25% of the
grant amount and any pay-out beyond this will be determined with reference to the financial performance during the
two-year performance period. The grant under the Performance Share plan could result in an aggregate maximum pay-
out of 51 million Nokia Shares, in the event that maximum performance against all the performance criteria is achieved.
Restricted Shares
The Restricted Shares under the 2016 Restricted Share plan are divided into three tranches, each tranche consisting of
one third of the Restricted Shares granted. The first tranche has a one-year restriction period, the second tranche a two-
year restriction period, and the third tranche a three-year restriction period. The grant of Restricted Shares in 2016
could result in an aggregate maximum payout of 1 350 000 Nokia Shares.
Employees covered by the Equity Program 2016
In accordance with the previous year’s practice, the primary equity instruments granted to executive employees and
directors below the executive level are Performance Shares.
Nokia limits the use of Restricted Shares as means of compensation. However, to support the specific needs, practices
and competitive market environment in the United States, restricted shares may be used, in conjunction with the use
of performance shares, on a limited basis in the United States.
In addition, shares under the Restricted Share plan can be granted for exceptional retention or recruitment purposes,
aimed primarily at US markets, to ensure Nokia is able to retain and recruit vital talent for the future success of Nokia.
Nokia employees in up to 54 countries are planned to be offered the possibility to participate in the Employee Share
Purchase Plan for the cycle commencing in 2016, provided that there are no local regulatory or administrative restraints
in relation to such plan.
Employees of Alcatel Lucent who have transferred to Nokia as part of the acquisition of Alcatel Lucent are included
in equity plans under the Equity Program 2016.
Dilution effect
On February 10, 2016, Nokia announced the final results of its subsequent offer period for outstanding Alcatel Lucent
Securities. As of February 12, 2016, subject to and following the registration of new Nokia Shares issued as
consideration for the Alcatel Lucent Securities tendered into the subsequent French and/or U.S. offers, and
consequently, included in the aggregate amount of Nokia Shares, the aggregate maximum dilution effect of Nokia’s
currently outstanding equity programs, assuming that the Performance Shares would be delivered at maximum level,
is approximately 0.86%. The potential maximum dilution effect of the Equity Program 2016 would approximately be
an additional 1.04%, assuming delivery at maximum level for Performance Shares and the delivery of matching shares

41
against the maximum amount of contributions of approximately EUR 60 million under the Employee Share Purchase
Plan. Employees of Alcatel Lucent that have transferred as part of the acquisition of Alcatel Lucent are only included
in equity plans under the Equity Program 2016.
Issuance of Nokia Shares for settlement of various Nokia equity plans
The performance period for the 2014 Performance Share Plan ended on December 31, 2015, and Nokia’s performance
over 2014 and 2015, assessed against the independent performance criteria set out in the plan rules, was above the
threshold performance level for the plan. The settlement to the participants under the plan is planned to take place after
the restriction period ends on January 1, 2017.
To fulfill Nokia’s obligations under the 2012, 2013 and 2015 Restricted Share Plans as well as the 2013 Performance
Share Plan in respect of shares to be settled in 2016, Nokia’s Board of Directors has resolved to issue, without
consideration, a total of 1 657 000 Nokia Shares held by Nokia to settle its commitments to plan participants, who are
all employees of the Nokia Group.
Issuance of Nokia Shares to beneficiaries of Alcatel-Lucent employee equity compensation arrangements
In accordance with the Memorandum of Understanding dated April 15, 2015 between Nokia and Alcatel Lucent, as
amended, Nokia has entered into liquidity agreements with beneficiaries of Alcatel Lucent employee equity
compensation arrangements who accepted to subscribe for the liquidity program for the exchange of their Alcatel
Lucent Shares resulting from Alcatel Lucent equity instruments that they hold for Nokia Shares in certain
circumstances.
To fulfill Nokia’s obligations under the aforementioned agreements, Nokia’s Board of Directors has resolved, pursuant
to the share issue authorization granted by the Extraordinary General Meeting of Nokia on December 2, 2015, to issue
a maximum amount of 400 000 Nokia Shares held by Nokia in the course of 2016 against contribution in kind in the
form of the Alcatel Lucent Shares being exchanged for the Nokia Shares. The exchange ratio applied in such exchanges
is the same as the exchange ratio applied in the Exchange Offer, subject to certain adjustments in the event of certain
financial transactions by Nokia or Alcatel Lucent.
The Availability of the Supplement
The supplement is available as of February 12, 2016 on the Company’s website at
http://company.nokia.com/en/investors/financial-reports/filings-related-to-the-alcatel-lucent-transaction, and as of
February 15, 2016 at the office of Nokia at Karaportti 3, FI-02610 Espoo, Finland, and the reception of Nasdaq Helsinki
at Fabianinkatu 14, FI-00100 Helsinki, Finland.