Embed Size (px)
Citation preview

APPENDIX H
Supplemental Air Quality and Greenhouse Gas Information and Technical Approach

This page intentionally left blank.
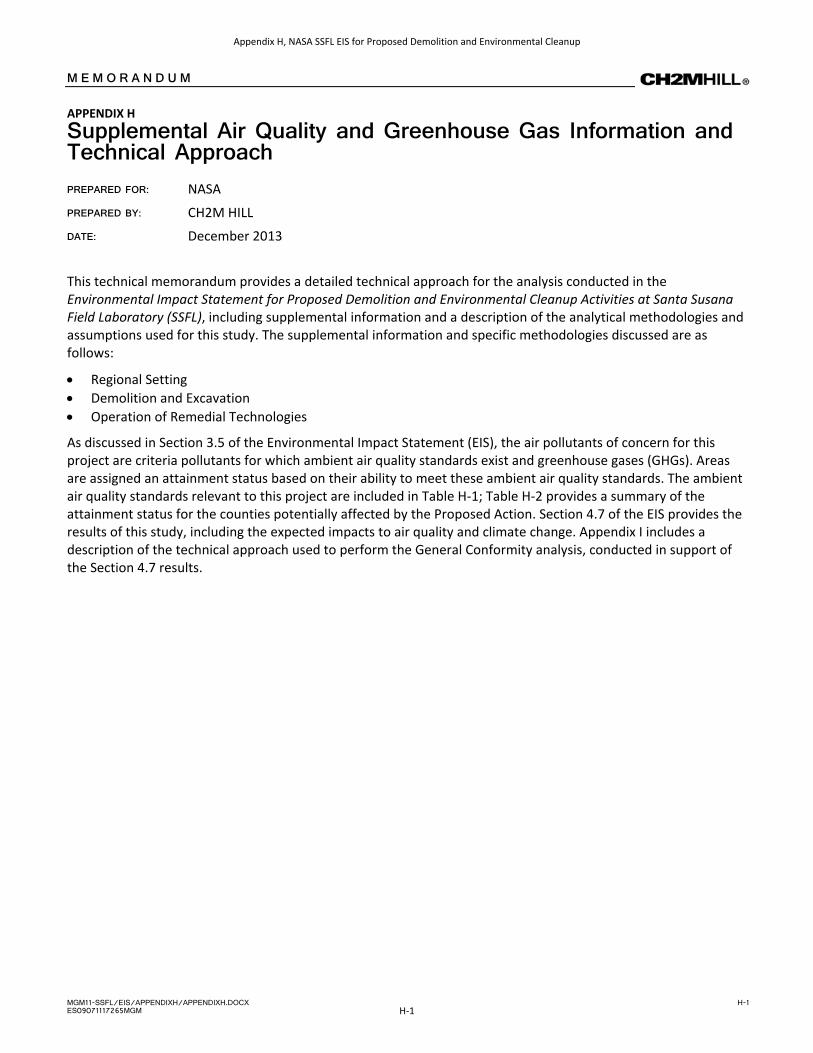
M E M O R A N D U M APPENDIX H Supplemental Air Quality and Greenhouse Gas Information and Technical ApproachPREPARED FOR: NASA PREPARED BY: CH2M HILL DATE: December 2013
This technical memorandum provides a detailed technical approach for the analysis conducted in the Environmental Impact Statement for Proposed Demolition and Environmental Cleanup Activities at Santa Susana Field Laboratory (SSFL), including supplemental information and a description of the analytical methodologies and assumptions used for this study. The supplemental information and specific methodologies discussed are as follows:
• Regional Setting • Demolition and Excavation • Operation of Remedial Technologies
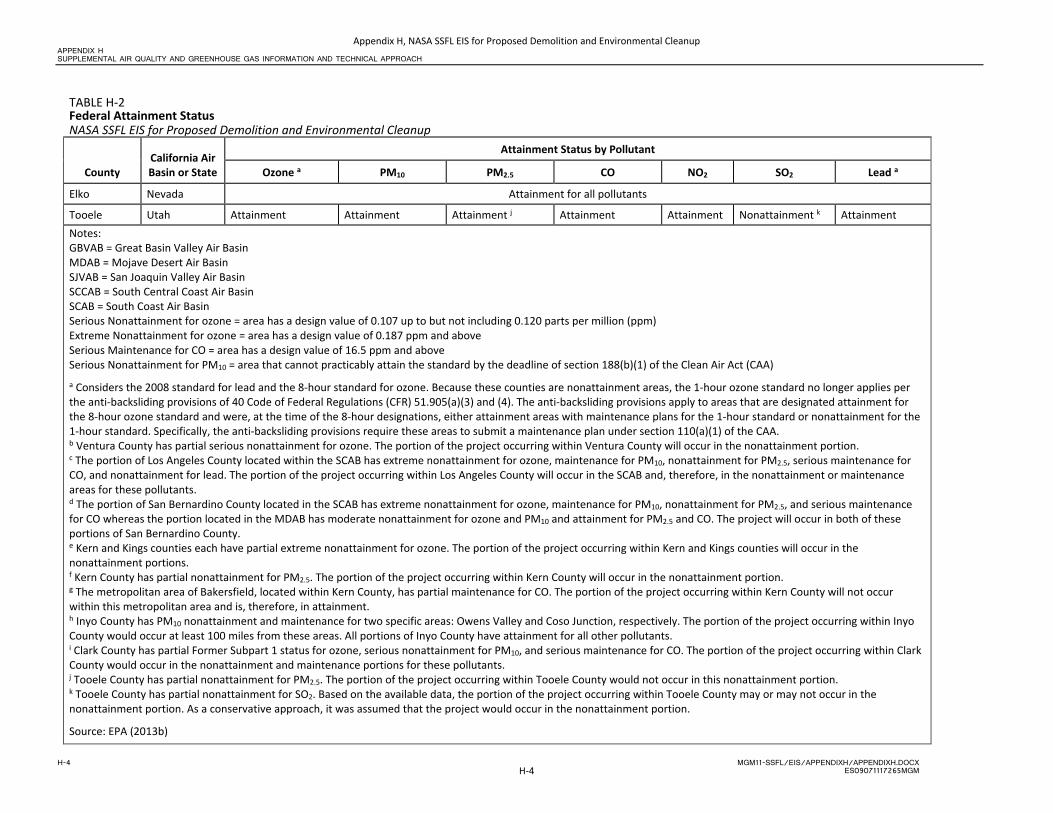
As discussed in Section 3.5 of the Environmental Impact Statement (EIS), the air pollutants of concern for this project are criteria pollutants for which ambient air quality standards exist and greenhouse gases (GHGs). Areas are assigned an attainment status based on their ability to meet these ambient air quality standards. The ambient air quality standards relevant to this project are included in Table H-1; Table H-2 provides a summary of the attainment status for the counties potentially affected by the Proposed Action. Section 4.7 of the EIS provides the results of this study, including the expected impacts to air quality and climate change. Appendix I includes a description of the technical approach used to perform the General Conformity analysis, conducted in support of the Section 4.7 results.
MGM11-SSFL/EIS/APPENDIXH/APPENDIXH.DOCX H-1 ES09071117265MGM
Appendix H, NASA SSFL EIS for Proposed Demolition and Environmental Cleanup
H-1
APPENDIX H SUPPLEMENTAL AIR QUALITY AND GREENHOUSE GAS INFORMATION AND TECHNICAL APPROACH
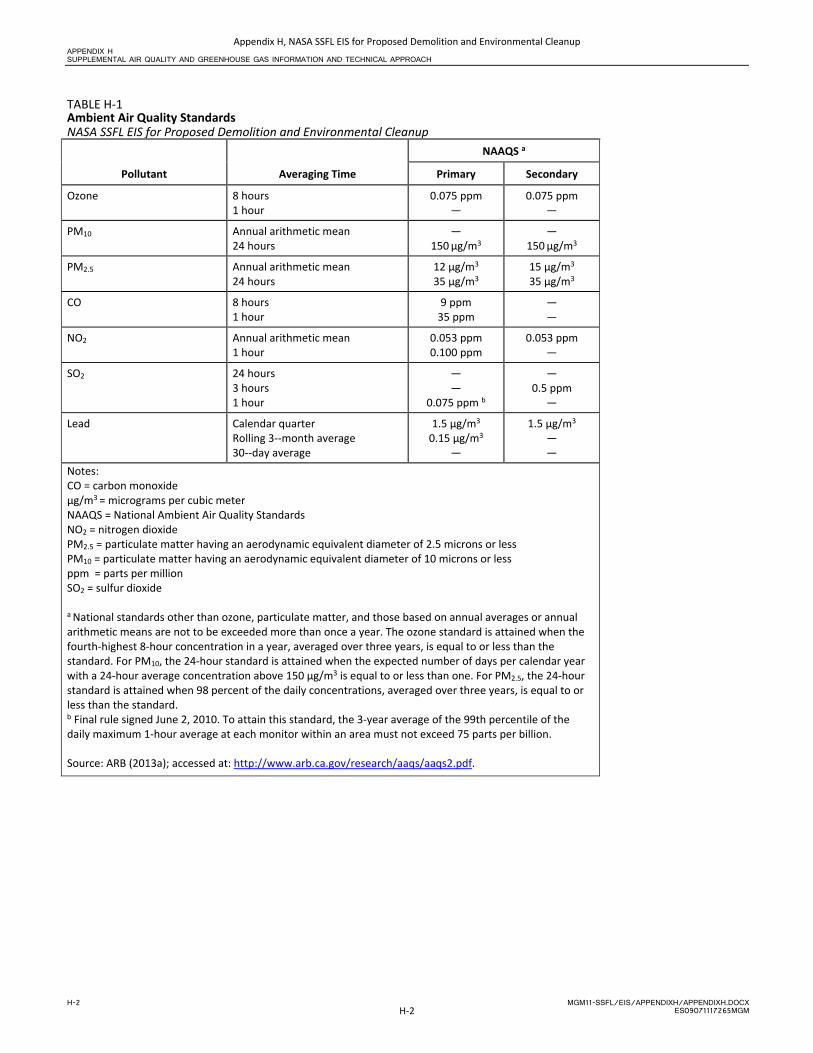
TABLE H-1 Ambient Air Quality Standards NASA SSFL EIS for Proposed Demolition and Environmental Cleanup
Pollutant Averaging Time
NAAQS a
Primary Secondary
Ozone 8 hours 1 hour
0.075 ppm —
0.075 ppm —
PM10 Annual arithmetic mean 24 hours
— 150 µg/m3
— 150 µg/m3
PM2.5 Annual arithmetic mean 24 hours
12 µg/m3 35 µg/m3
15 µg/m3 35 µg/m3
CO 8 hours 1 hour
9 ppm 35 ppm
— —
NO2 Annual arithmetic mean 1 hour
0.053 ppm 0.100 ppm
0.053 ppm —
SO2 24 hours 3 hours 1 hour
— —
0.075 ppm b
— 0.5 ppm
—
Lead Calendar quarter Rolling 3--month average 30--day average
1.5 µg/m3
0.15 µg/m3
—
1.5 µg/m3
—
— Notes: CO = carbon monoxide µg/m3 = micrograms per cubic meter NAAQS = National Ambient Air Quality Standards NO2 = nitrogen dioxide PM2.5 = particulate matter having an aerodynamic equivalent diameter of 2.5 microns or less PM10 = particulate matter having an aerodynamic equivalent diameter of 10 microns or less ppm = parts per million SO2 = sulfur dioxide
a National standards other than ozone, particulate matter, and those based on annual averages or annual arithmetic means are not to be exceeded more than once a year. The ozone standard is attained when the fourth-highest 8-hour concentration in a year, averaged over three years, is equal to or less than the standard. For PM10, the 24-hour standard is attained when the expected number of days per calendar year with a 24-hour average concentration above 150 µg/m3 is equal to or less than one. For PM2.5, the 24-hour standard is attained when 98 percent of the daily concentrations, averaged over three years, is equal to or less than the standard. b Final rule signed June 2, 2010. To attain this standard, the 3-year average of the 99th percentile of the daily maximum 1-hour average at each monitor within an area must not exceed 75 parts per billion. Source: ARB (2013a); accessed at: http://www.arb.ca.gov/research/aaqs/aaqs2.pdf.
H-2 MGM11-SSFL/EIS/APPENDIXH/APPENDIXH.DOCX ES09071117265MGM
Appendix H, NASA SSFL EIS for Proposed Demolition and Environmental Cleanup
H-2

APPENDIX H SUPPLEMENTAL AIR QUALITY AND GREENHOUSE GAS INFORMATION AND TECHNICAL APPROACH
TABLE H-2 Federal Attainment Status NASA SSFL EIS for Proposed Demolition and Environmental Cleanup
County California Air Basin or State
Attainment Status by Pollutant
Ozone a PM10 PM2.5 CO NO2 SO2 Lead a
Ventura SCCAB Serious Nonattainment b
Attainment Attainment Attainment Attainment Attainment Attainment
Los Angeles SCAB Extreme Nonattainment c
Maintenance c Nonattainment c Serious Maintenance c
Attainment Attainment c Nonattainment c
San Bernardino
SCAB Extreme Nonattainment d
Maintenance d Nonattainment d Serious Maintenance d
Attainment Attainment Attainment
MDAB Moderate Nonattainment d
Moderate Nonattainment d
Attainment d Attainment d Attainment Attainment Attainment
Kern SJVAB Extreme Nonattainment e
Serious Nonattainment
Nonattainment f Attainment g Attainment Attainment Attainment
Kings SJVAB Extreme Nonattainment e
Maintenance Nonattainment Attainment Attainment Attainment Attainment
Inyo GBVAB Attainment for all pollutants h
Nye Nevada Attainment for all pollutants
Clark Nevada Former Subpart 1 i Serious Nonattainment
Attainment Serious Maintenance
Attainment Attainment Attainment
Lincoln Nevada Attainment for all pollutants
White Pine Nevada Attainment Attainment Attainment Attainment Attainment Maintenance Attainment
MGM11-SSFL/EIS/APPENDIXH/APPENDIXH.DOCX H-3 ES09071117265MGM
Appendix H, NASA SSFL EIS for Proposed Demolition and Environmental Cleanup
H-3
APPENDIX H SUPPLEMENTAL AIR QUALITY AND GREENHOUSE GAS INFORMATION AND TECHNICAL APPROACH
TABLE H-2 Federal Attainment Status NASA SSFL EIS for Proposed Demolition and Environmental Cleanup
County California Air Basin or State
Attainment Status by Pollutant
Ozone a PM10 PM2.5 CO NO2 SO2 Lead a
Elko Nevada Attainment for all pollutants
Tooele Utah Attainment Attainment Attainment j Attainment Attainment Nonattainment k Attainment Notes: GBVAB = Great Basin Valley Air Basin MDAB = Mojave Desert Air Basin SJVAB = San Joaquin Valley Air Basin SCCAB = South Central Coast Air Basin SCAB = South Coast Air Basin Serious Nonattainment for ozone = area has a design value of 0.107 up to but not including 0.120 parts per million (ppm) Extreme Nonattainment for ozone = area has a design value of 0.187 ppm and above Serious Maintenance for CO = area has a design value of 16.5 ppm and above Serious Nonattainment for PM10 = area that cannot practicably attain the standard by the deadline of section 188(b)(1) of the Clean Air Act (CAA) a Considers the 2008 standard for lead and the 8-hour standard for ozone. Because these counties are nonattainment areas, the 1-hour ozone standard no longer applies per the anti-backsliding provisions of 40 Code of Federal Regulations (CFR) 51.905(a)(3) and (4). The anti-backsliding provisions apply to areas that are designated attainment for the 8-hour ozone standard and were, at the time of the 8-hour designations, either attainment areas with maintenance plans for the 1-hour standard or nonattainment for the 1-hour standard. Specifically, the anti-backsliding provisions require these areas to submit a maintenance plan under section 110(a)(1) of the CAA. b Ventura County has partial serious nonattainment for ozone. The portion of the project occurring within Ventura County will occur in the nonattainment portion. c The portion of Los Angeles County located within the SCAB has extreme nonattainment for ozone, maintenance for PM10, nonattainment for PM2.5, serious maintenance for CO, and nonattainment for lead. The portion of the project occurring within Los Angeles County will occur in the SCAB and, therefore, in the nonattainment or maintenance areas for these pollutants. d The portion of San Bernardino County located in the SCAB has extreme nonattainment for ozone, maintenance for PM10, nonattainment for PM2.5, and serious maintenance for CO whereas the portion located in the MDAB has moderate nonattainment for ozone and PM10 and attainment for PM2.5 and CO. The project will occur in both of these portions of San Bernardino County. e Kern and Kings counties each have partial extreme nonattainment for ozone. The portion of the project occurring within Kern and Kings counties will occur in the nonattainment portions. f Kern County has partial nonattainment for PM2.5. The portion of the project occurring within Kern County will occur in the nonattainment portion. g The metropolitan area of Bakersfield, located within Kern County, has partial maintenance for CO. The portion of the project occurring within Kern County will not occur within this metropolitan area and is, therefore, in attainment. h Inyo County has PM10 nonattainment and maintenance for two specific areas: Owens Valley and Coso Junction, respectively. The portion of the project occurring within Inyo County would occur at least 100 miles from these areas. All portions of Inyo County have attainment for all other pollutants. i Clark County has partial Former Subpart 1 status for ozone, serious nonattainment for PM10, and serious maintenance for CO. The portion of the project occurring within Clark County would occur in the nonattainment and maintenance portions for these pollutants. j Tooele County has partial nonattainment for PM2.5. The portion of the project occurring within Tooele County would not occur in this nonattainment portion. k Tooele County has partial nonattainment for SO2. Based on the available data, the portion of the project occurring within Tooele County may or may not occur in the nonattainment portion. As a conservative approach, it was assumed that the project would occur in the nonattainment portion.
Source: EPA (2013b)
H-4 MGM11-SSFL/EIS/APPENDIXH/APPENDIXH.DOCX ES09071117265MGM
Appendix H, NASA SSFL EIS for Proposed Demolition and Environmental Cleanup
H-4

APPENDIX H SUPPLEMENTAL AIR QUALITY AND GREENHOUSE GAS INFORMATION AND TECHNICAL APPROACH
Regional Setting As noted in Section 3.5, the most recent published emission inventory data for the region of influence (ROI), which includes Ventura, Los Angeles, and Kern counties, are provided in Tables H-3 through H-5.
TABLE H-3 Estimated Annual Average Emissions for Ventura County (tons per day) NASA SSFL EIS for Proposed Demolition and Environmental Cleanup
Source Category TOG VOC CO NOx SOx PM PM10 PM2.5
Stationary Sources
Fuel Combustion 4.9 0.7 7.7 4.4 0.2 0.6 0.6 0.6
Waste Disposal 20.5 0.2 0.5 0.1 0.1 0.0 0.0 0.0
Cleaning and Surface Coatings 7.6 5.4 - - - 0.1 0.1 0.0
Petroleum Production and Marketing 26.3 4.6 0.5 0.1 0.1 0.0 0.0 0.0
Industrial Processes 0.7 0.6 0.7 0.1 0.2 1.0 0.6 0.3
Total Stationary Sources 60.0 11.5 9.4 4.7 0.6 1.7 1.3 0.9
Stationary Sources Percentage of Total 43.3 14.4 3.9 7.3 4.4 3.1 4.0 6.5
Areawide Sources
Solvent Evaporation 12.3 11.3 - - - - - -
Miscellaneous Processes 4.6 1.6 22.2 1.7 0.1 43.5 22.2 5.4
Total Areawide Sources 17.0 12.9 22.2 1.7 0.1 43.5 22.2 5.4
Areawide Sources Percentage of Total 12.3 16.1 9.2 2.6 0.7 80.1 68.7 39.1
Mobile Sources
On-road Motor Vehicles 11.9 11.0 97.5 17.4 0.1 1.0 1.0 0.7
Other Mobile Sources 12.7 11.7 65.9 39.4 12.3 3.3 3.2 3.0
Total Mobile Sources 24.6 22.7 163.3 56.8 12.4 4.3 4.1 3.6
Mobile Sources Percentage of Total 17.7 28.3 67.9 87.9 91.9 7.9 12.7 26.1
Natural Sources
Natural (Non-man Made) Sources 37.0 33.0 45.6 1.4 0.4 4.8 4.6 3.9
Total Natural Sources 37.0 33.0 45.6 1.4 0.4 4.8 4.6 3.9
Natural Sources Percentage of Total 26.7 41.2 19.0 2.2 3.0 8.8 14.2 28.3
Grand Total 138.6 80.1 240.5 64.6 13.5 54.3 32.3 13.8
Notes: CO = carbon monoxide NOx = nitrogen oxides PM = particulate matter PM2.5 = particulate matter having an aerodynamic equivalent diameter of 2.5 microns or less PM10 = particulate matter having an aerodynamic equivalent diameter of 10 microns or less SOx = sulfur oxides TOG = total organic gas VOC = volatile organic compound Source: ARB (2011)
MGM11-SSFL/EIS/APPENDIXH/APPENDIXH.DOCX H-5 ES09071117265MGM
Appendix H, NASA SSFL EIS for Proposed Demolition and Environmental Cleanup
H-5

APPENDIX H SUPPLEMENTAL AIR QUALITY AND GREENHOUSE GAS INFORMATION AND TECHNICAL APPROACH
TABLE H-4 Estimated Annual Average Emissions for Los Angeles County (tons per day) NASA SSFL EIS for Proposed Demolition and Environmental Cleanup
Source Category TOG VOC CO NOx SOx PM PM10 PM2.5
Stationary Sources
Fuel Combustion 17.8 4.3 24.1 30.5 6.4 4.1 4.0 3.9
Waste Disposal 16.5 0.9 0.8 1.6 0.4 0.8 0.4 0.2
Cleaning and Surface Coatings 32.9 25.8 0.0 0.1 0.0 0.5 0.4 0.4
Petroleum Production and Marketing 34.5 25.1 8.9 4.4 6.6 3.8 2.5 2.1
Industrial Processes 12.8 11.6 1.3 2.8 2.9 35.9 17.6 5.6
Total Stationary Sources 114.5 67.7 35.0 39.2 16.4 45.1 24.8 12.1
Stationary Sources Percentage of Total 23.7 17.3 1.9 7.6 32.3 13.1 12.7 16.9
Areawide Sources
Solvent Evaporation 94.6 82.7 - - - 0.0 0.0 0.0
Miscellaneous Processes 13.1 5.4 51.2 14.1 0.4 263.7 135.7 30.8
Total Areawide Sources 107.7 88.0 51.2 14.1 0.4 263.7 135.7 30.8
Areawide Sources Percentage of Total 22.3 22.5 2.8 2.7 0.8 76.4 69.3 42.9
Mobile Sources
On-road Motor Vehicles 124.3 113.1 1,096.3 248.3 1.3 15.3 15.1 11.0
Other Mobile Sources 89.1 81.0 579.5 210.1 32.0 14.1 13.6 12.4
Total Mobile Sources 213.4 194.1 1,675.8 458.4 33.3 29.4 28.8 23.3
Mobile Sources Percentage of Total 44.2 49.7 91.7 89.2 65.7 8.5 14.7 32.5
Natural Sources
Natural (Non-man Made) Sources 46.8 40.5 65.0 1.9 0.6 6.8 6.6 5.6
Total Natural Sources 46.8 40.5 65.0 1.9 0.6 6.8 6.6 5.6
Natural Sources Percentage of Total 9.7 1.3 3.6 0.4 1.2 2.0 3.4 7.8
Grand Total 482.3 390.3 1,827.1 513.7 50.7 345.1 195.9 71.8
Notes: CO = carbon monoxide NOx = nitrogen oxides PM = particulate matter PM2.5 = particulate matter having an aerodynamic equivalent diameter of 2.5 microns or less PM10 = particulate matter having an aerodynamic equivalent diameter of 10 microns or less SOx = sulfur oxides TOG = total organic gas VOC = volatile organic compound Source: ARB (2011)
H-6 MGM11-SSFL/EIS/APPENDIXH/APPENDIXH.DOCX ES09071117265MGM
Appendix H, NASA SSFL EIS for Proposed Demolition and Environmental Cleanup
H-6

APPENDIX H SUPPLEMENTAL AIR QUALITY AND GREENHOUSE GAS INFORMATION AND TECHNICAL APPROACH
TABLE H-5 Estimated Annual Average Emissions for Kern County (tons per day) NASA SSFL EIS for Proposed Demolition and Environmental Cleanup
Source Category TOG VOC CO NOx SOx PM PM10 PM2.5
Stationary Sources
Fuel Combustion 28.1 8.4 18.0 27.1 4.5 4.6 4.3 4.2
Waste Disposal 28.1 0.3 0.1 0.0 0.0 0.2 0.1 0.0
Cleaning and Surface Coatings 2.5 2.3 0.0 - - 0.0 0.0 0.0
Petroleum Production and Marketing 69.3 28.8 1.1 0.4 0.2 0.2 0.2 0.1
Industrial Processes 2.5 2.2 9.4 18.4 3.3 15.4 9.4 3.9
Total Stationary Sources 130.4 42.1 28.6 45.9 8.0 20.4 14.0 8.3
Stationary Sources Percentage of Total 43.7 30.1 7.7 23.3 85.1 13.8 16.1 24.7
Areawide Sources
Solvent Evaporation 15.0 14.0 - - - - - -
Miscellaneous Processes 66.5 7.4 30.2 2.3 0.1 112.3 58.0 11.8
Total Areawide Sources 81.5 21.3 30.2 2.3 0.1 112.3 58.0 11.8
Areawide Sources Percentage of Total 27.3 15.2 8.2 1.2 1.1 75.7 66.5 35.1
Mobile Sources
On-road Motor Vehicles 21.4 19.3 166.1 111.4 0.2 5.0 4.9 4.1
Other Mobile Sources 14.3 12.8 87.4 35.2 0.5 4.6 4.5 4.3
Total Mobile Sources 35.7 32.1 253.5 146.5 0.7 9.6 9.4 8.4
Mobile Sources Percentage of Total 12.0 23.0 68.5 74.5 7.4 6.5 10.8 25.0
Natural Sources
Natural (Non-man Made) Sources 50.6 44.2 57.7 1.8 0.6 6.1 5.9 5.0
Total Natural Sources 50.6 44.2 57.7 1.8 0.6 6.1 5.9 5.0
Natural Sources Percentage of Total 17.0 31.6 15.6 0.9 6.4 4.1 6.8 14.9
Grand Total 298.2 139.8 370.0 196.6 9.4 148.3 87.2 33.6
Notes: CO = carbon monoxide NOx = nitrogen oxides PM = particulate matter PM2.5 = particulate matter having an aerodynamic equivalent diameter of 2.5 microns or less PM10 = particulate matter having an aerodynamic equivalent diameter of 10 microns or less SOx = sulfur oxides TOG = total organic gas VOC = volatile organic compound Source: ARB (2011)
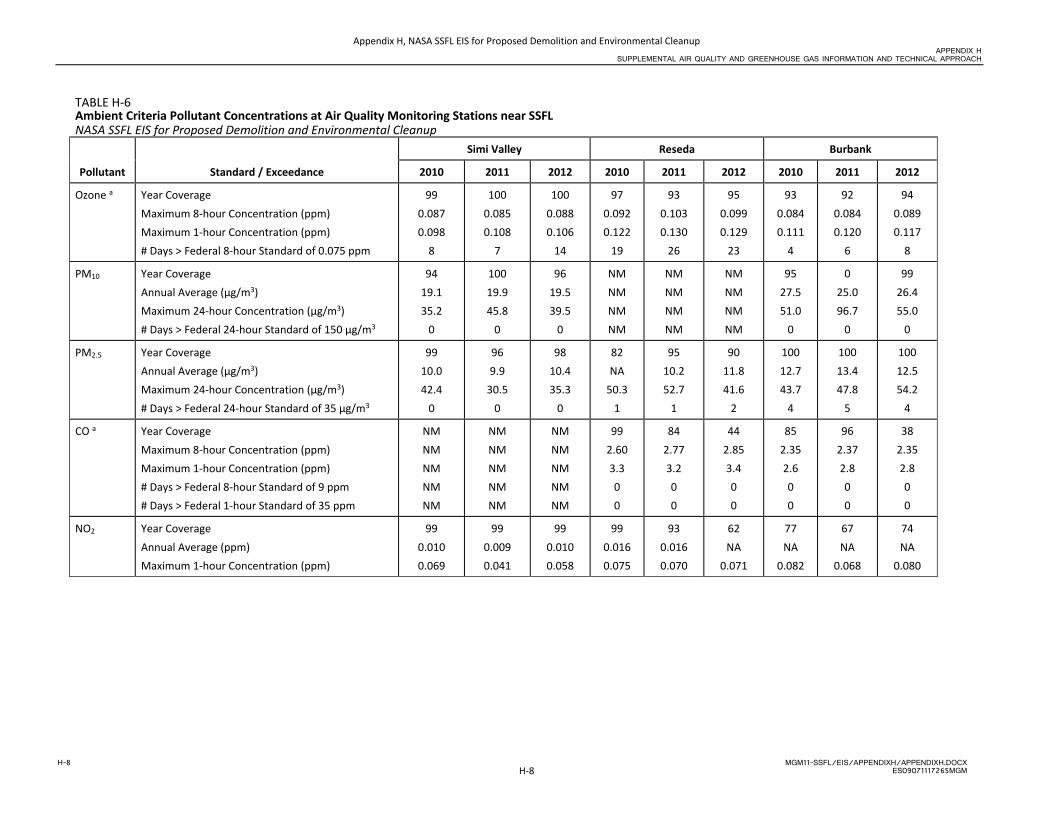
Local Setting A summary of ambient criteria pollutant concentrations at air quality monitoring stations near SSFL, as identified in Section 3.5, is provided in Table H-6.
MGM11-SSFL/EIS/APPENDIXH/APPENDIXH.DOCX H-7 ES09071117265MGM
Appendix H, NASA SSFL EIS for Proposed Demolition and Environmental Cleanup
H-7
APPENDIX H SUPPLEMENTAL AIR QUALITY AND GREENHOUSE GAS INFORMATION AND TECHNICAL APPROACH
TABLE H-6 Ambient Criteria Pollutant Concentrations at Air Quality Monitoring Stations near SSFL NASA SSFL EIS for Proposed Demolition and Environmental Cleanup
Pollutant Standard / Exceedance
Simi Valley Reseda Burbank
2010 2011 2012 2010 2011 2012 2010 2011 2012
Ozone a Year Coverage Maximum 8-hour Concentration (ppm) Maximum 1-hour Concentration (ppm) # Days > Federal 8-hour Standard of 0.075 ppm
99 0.087 0.098
8
100 0.085 0.108
7
100 0.088 0.106
14
97 0.092 0.122
19
93 0.103 0.130
26
95 0.099 0.129
23
93 0.084 0.111
4
92 0.084 0.120
6
94 0.089 0.117
8
PM10 Year Coverage Annual Average (µg/m3) Maximum 24-hour Concentration (µg/m3) # Days > Federal 24-hour Standard of 150 µg/m3
94 19.1 35.2
0
100 19.9 45.8
0
96 19.5 39.5
0
NM NM NM NM
NM NM NM NM
NM NM NM NM
95 27.5 51.0
0
0 25.0 96.7
0
99 26.4 55.0
0
PM2.5 Year Coverage Annual Average (µg/m3) Maximum 24-hour Concentration (µg/m3) # Days > Federal 24-hour Standard of 35 µg/m3
99 10.0 42.4
0
96 9.9
30.5 0
98 10.4 35.3
0
82 NA
50.3 1
95 10.2 52.7
1
90 11.8 41.6
2
100 12.7 43.7
4
100 13.4 47.8
5
100 12.5 54.2
4
CO a Year Coverage Maximum 8-hour Concentration (ppm) Maximum 1-hour Concentration (ppm) # Days > Federal 8-hour Standard of 9 ppm # Days > Federal 1-hour Standard of 35 ppm
NM NM NM NM NM
NM NM NM NM NM
NM NM NM NM NM
99 2.60 3.3 0 0
84 2.77 3.2 0 0
44 2.85 3.4 0 0
85 2.35 2.6 0 0
96 2.37 2.8 0 0
38 2.35 2.8 0 0
NO2 Year Coverage Annual Average (ppm) Maximum 1-hour Concentration (ppm)
99 0.010 0.069
99 0.009 0.041
99 0.010 0.058
99 0.016 0.075
93 0.016 0.070
62 NA
0.071
77 NA
0.082
67 NA
0.068
74 NA
0.080
H-8 MGM11-SSFL/EIS/APPENDIXH/APPENDIXH.DOCX ES09071117265MGM
Appendix H, NASA SSFL EIS for Proposed Demolition and Environmental Cleanup
H-8

APPENDIX H SUPPLEMENTAL AIR QUALITY AND GREENHOUSE GAS INFORMATION AND TECHNICAL APPROACH
TABLE H-6 Ambient Criteria Pollutant Concentrations at Air Quality Monitoring Stations near SSFL NASA SSFL EIS for Proposed Demolition and Environmental Cleanup
Pollutant Standard / Exceedance
Simi Valley Reseda Burbank
2010 2011 2012 2010 2011 2012 2010 2011 2012
SO2 b Year Coverage Maximum 24-hour Concentration (ppm) Maximum 3-hour Concentration (ppm) Maximum 1-hour Concentration (ppm) # Days > Federal 3-hour Standard of 0.5 ppm
NM NM NM NM NM
NM NM NM NM NM
NM NM NM NM NM
NM NM NM NM NM
NM NM NM NM NM
NM NM NM NM NM
83 0.004
NA 0.015
NA
69 0.002
NA 0.009
NA
32 0.002
NA 0.007
NA
Notes: CO = carbon monoxide µg/m3 = micrograms per cubic meter NA = not available NM = not monitored NO2 = nitrogen dioxide PM2.5 = particulate matter having an aerodynamic equivalent diameter of 2.5 microns or less PM10 = particulate matter having an aerodynamic equivalent diameter of 10 microns or less ppm = parts per million SO2 = sulfur dioxide
a Year Coverage is for the 8-hour standard. b Year Coverage is for the 24-hour standard. Sources: EPA (2013a); ARB (2013d)
MGM11-SSFL/EIS/APPENDIXH/APPENDIXH.DOCX H-9 ES09071117265MGM
Appendix H, NASA SSFL EIS for Proposed Demolition and Environmental Cleanup
H-9
APPENDIX H SUPPLEMENTAL AIR QUALITY AND GREENHOUSE GAS INFORMATION AND TECHNICAL APPROACH
Demolition and Excavation To evaluate the potential impact to air quality and climate change from demolition and remediation activities, criteria pollutant and GHG emissions were estimated from equipment operation associated with demolition, excavation, and road repairs; truck travel associated with material and equipment hauling; and worker commutes. Fugitive dust emissions were also estimated as a result of demolition and earthmoving activities. Although the EIS analyzes the potential air quality and GHG emissions related to numerous soil and groundwater remedial technologies, a quantitative analysis was developed based on the Excavation and Offsite Disposal technology to represent the highest levels of potential emissions. As discussed in Section 4.7, two soil removal estimates were quantitatively considered under the Excavation and Offsite Disposal technology. The high soil removal estimate assumes that the contaminated soil will be untreatable and must all be removed, whereas the low soil removal estimate assumes that, in certain areas, soil 2 feet or more below the ground surface will be treatable such that the soil removal volume will be reduced.
For each phase evaluated, activities were expected to occur five days per week and up to 10 hours per day, based on SSFL’s daily operational schedule of 7 a.m. to 7 p.m. NASA provided a site-specific equipment list for demolition activities. In the absence of site-specific data for excavation and road repair activities, equipment lists were pulled from the California Emissions Estimator Model (CalEEMod) User’s Guide (Environ International Corporation [Environ], 2013) and the Sacramento Metropolitan Air Quality Management District’s (SMAQMD) Road Construction Emissions Model (Version 6.3.2) (SMAQMD, 2009), respectively. For excavation, the maximum possible equipment counts for grading were assumed1; for road repairs, the road characteristics and repair durations were used as input to the Road Construction Emissions Model.
Direct emissions from off-road construction equipment were calculated using emission factors from the California Air Resources Board’s (ARB) OFFROAD 2011 (Version 3) model (ARB, 2013c) and the equipment hours of operation. These emission factors2 were obtained from the CalEEMod User’s Guide, based on the average equipment horsepower ratings presented3 (Environ, 2013). Unless otherwise noted, off-road construction equipment contributes to onsite emissions.
Direct emissions from on-road vehicles, including haul trucks and worker vehicles, were calculated using emission factors from the ARB’s EMFAC2011-PL (Version 1.1) model with EMFAC2007 vehicle categories (ARB, 2013b) and the vehicle miles traveled (VMT) by each vehicle. The emission factors from EMFAC2011-PL were generated using the following model parameters:
• A vehicle speed of 15 miles per hour (mph) for onsite activities • A vehicle speed of 55 mph for offsite activities
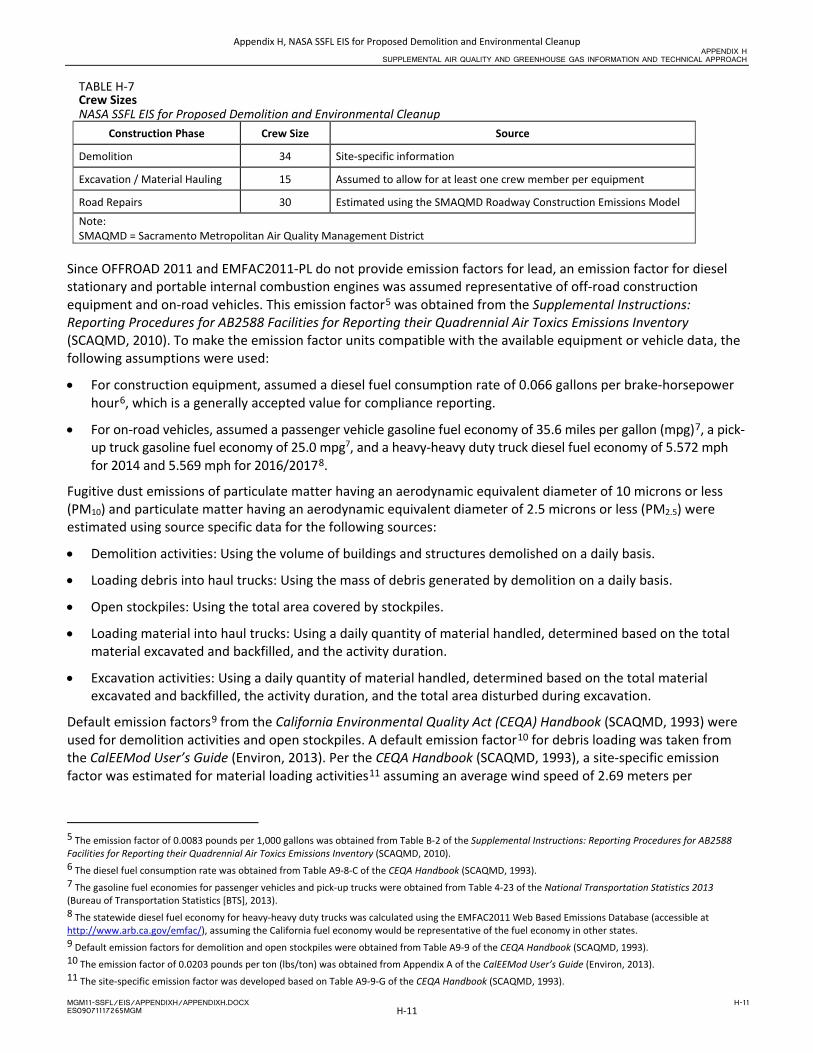
On-road vehicles contribute to both onsite and offsite emissions. The VMT for onsite vehicles, including 15-passenger vans4, supervisory vehicles, and flatbed and dump trucks, was determined by estimating the round trip distance between the activity locations and the SSFL entrance. The VMT for offsite vehicles, including haul trucks and workers, was determined by assuming particular haul routes to the potential offsite disposal locations identified in Section 4.7 and particular routes for commuting to work assuming crew members live within 20 miles of SSFL (50 percent in Ventura County and 50 percent in Los Angeles County), respectively. The crew size expected for each construction phase is included in Table H-7.
1 Equipment list was obtained from Table 3.2 of Appendix D of the CalEEMod User’s Guide (Environ, 2013). 2 Emission factors were obtained from Table 3.4 of Appendix D of the CalEEMod User’s Guide (Environ, 2013). 3 Horsepower ratings were obtained from Table 3.3 of Appendix D of the CalEEMod User’s Guide (Environ, 2013). 4 It was assumed that crew members would be transported around SSFL using 15-passenger vans. H-10 MGM11-SSFL/EIS/APPENDIXH/APPENDIXH.DOCX ES09071117265MGM
Appendix H, NASA SSFL EIS for Proposed Demolition and Environmental Cleanup
H-10
APPENDIX H SUPPLEMENTAL AIR QUALITY AND GREENHOUSE GAS INFORMATION AND TECHNICAL APPROACH
TABLE H-7 Crew Sizes NASA SSFL EIS for Proposed Demolition and Environmental Cleanup
Construction Phase Crew Size Source
Demolition 34 Site-specific information
Excavation / Material Hauling 15 Assumed to allow for at least one crew member per equipment
Road Repairs 30 Estimated using the SMAQMD Roadway Construction Emissions Model
Note: SMAQMD = Sacramento Metropolitan Air Quality Management District
Since OFFROAD 2011 and EMFAC2011-PL do not provide emission factors for lead, an emission factor for diesel stationary and portable internal combustion engines was assumed representative of off-road construction equipment and on-road vehicles. This emission factor5 was obtained from the Supplemental Instructions: Reporting Procedures for AB2588 Facilities for Reporting their Quadrennial Air Toxics Emissions Inventory (SCAQMD, 2010). To make the emission factor units compatible with the available equipment or vehicle data, the following assumptions were used:
• For construction equipment, assumed a diesel fuel consumption rate of 0.066 gallons per brake-horsepower hour6, which is a generally accepted value for compliance reporting.
• For on-road vehicles, assumed a passenger vehicle gasoline fuel economy of 35.6 miles per gallon (mpg)7, a pick-up truck gasoline fuel economy of 25.0 mpg7, and a heavy-heavy duty truck diesel fuel economy of 5.572 mph for 2014 and 5.569 mph for 2016/20178.
Fugitive dust emissions of particulate matter having an aerodynamic equivalent diameter of 10 microns or less (PM10) and particulate matter having an aerodynamic equivalent diameter of 2.5 microns or less (PM2.5) were estimated using source specific data for the following sources:
• Demolition activities: Using the volume of buildings and structures demolished on a daily basis.
• Loading debris into haul trucks: Using the mass of debris generated by demolition on a daily basis.
• Open stockpiles: Using the total area covered by stockpiles.
• Loading material into haul trucks: Using a daily quantity of material handled, determined based on the total material excavated and backfilled, and the activity duration.
• Excavation activities: Using a daily quantity of material handled, determined based on the total material excavated and backfilled, the activity duration, and the total area disturbed during excavation.
Default emission factors9 from the California Environmental Quality Act (CEQA) Handbook (SCAQMD, 1993) were used for demolition activities and open stockpiles. A default emission factor10 for debris loading was taken from the CalEEMod User’s Guide (Environ, 2013). Per the CEQA Handbook (SCAQMD, 1993), a site-specific emission factor was estimated for material loading activities11 assuming an average wind speed of 2.69 meters per
5 The emission factor of 0.0083 pounds per 1,000 gallons was obtained from Table B-2 of the Supplemental Instructions: Reporting Procedures for AB2588 Facilities for Reporting their Quadrennial Air Toxics Emissions Inventory (SCAQMD, 2010). 6 The diesel fuel consumption rate was obtained from Table A9-8-C of the CEQA Handbook (SCAQMD, 1993). 7 The gasoline fuel economies for passenger vehicles and pick-up trucks were obtained from Table 4-23 of the National Transportation Statistics 2013 (Bureau of Transportation Statistics [BTS], 2013). 8 The statewide diesel fuel economy for heavy-heavy duty trucks was calculated using the EMFAC2011 Web Based Emissions Database (accessible at http://www.arb.ca.gov/emfac/), assuming the California fuel economy would be representative of the fuel economy in other states. 9 Default emission factors for demolition and open stockpiles were obtained from Table A9-9 of the CEQA Handbook (SCAQMD, 1993). 10 The emission factor of 0.0203 pounds per ton (lbs/ton) was obtained from Appendix A of the CalEEMod User’s Guide (Environ, 2013). 11 The site-specific emission factor was developed based on Table A9-9-G of the CEQA Handbook (SCAQMD, 1993).
MGM11-SSFL/EIS/APPENDIXH/APPENDIXH.DOCX H-11 ES09071117265MGM
Appendix H, NASA SSFL EIS for Proposed Demolition and Environmental Cleanup
H-11

APPENDIX H SUPPLEMENTAL AIR QUALITY AND GREENHOUSE GAS INFORMATION AND TECHNICAL APPROACH
second12 and dry soil moisture conditions. Default emission factors13 from the Software User’s Guide: URBEMIS2007 for Windows (JSA, 2007) were used for excavation activities, assuming a low level of activity detail.
For all construction-related activities, PM2.5 emissions were assumed to be 20.8 percent of the PM10 emissions, per the Final–Methodology to Calculate Particulate Matter (PM) 2.5 and PM 2.5 Significance Thresholds (SCAQMD, 2006). Unless otherwise noted, fugitive dust emissions (PM10 and PM2.5) contribute to onsite emissions.
Following the methodology discussed for construction activities, GHG emissions from off-road equipment were calculated using carbon dioxide (CO2) and methane (CH4) emission factors from ARB’s OFFROAD 2011 model and equipment hours of operation. GHG emissions from on-road vehicles were calculated using CO2 emission factors from ARB’s EMFAC2011-PL model, based on vehicle speed, type, and analysis year, CH4 emission factors from The Climate Registry’s (TCR) General Reporting Protocol (Version 2.0) (TCR, 2013), and estimated VMT.
The complete set of data used to estimate construction emissions for the EIS, as well as the emissions calculations, are captured in the Air Quality Analysis Workbooks, which are included in Attachments 1 and 2 of this memorandum. Note that Attachment 1 presents the results for the high soil removal estimate; Attachment 2 presents the results for the low soil removal estimate, excluding any parameters and emissions previously provided in Attachment 1 that are not affected by the soil removal volume.
Operation of Remedial Technologies To determine the potential impact to air quality and climate change from operation of the remedial technologies, a screening assessment was performed. Technologies that would require a significant power source, use combustion, generate fugitive dust or volatile organic compound (VOC) emissions, or rely on heavy duty trucks or equipment, were evaluated qualitatively based on preliminary engineering data or industry standard practices. Additionally, the operational duration for each remedial technology was considered in this evaluation.
References Bureau of Transportation Statistics (BTS). 2013. National Transportation Statistics 2013. October.
California Air Resources Board (ARB). 2011. 2009 Almanac Emission Projection Data. http://www.arb.ca.gov/app/emsinv/emssumcat.php. Accessed November 28, 2011.
California Air Resources Board (ARB). 2013a. Ambient Air Quality Standards. http://www.arb.ca.gov/research/aaqs/aaqs2.pdf. Updated June 4, 2013. Accessed December 2, 2013.
California Air Resources Board (ARB). 2013b. EMFAC2011-PL (Version 1.1). January.
California Air Resources Board (ARB). 2013c. OFFROAD 2011 (Version 3). July.
California Air Resources Board (ARB). 2013d. Top 4 Summary Pollutant / Year Range Selection. http://www.arb.ca.gov/adam/topfour/topfour1.php. Accessed December 4, 2013.
Environ International Corporation (Environ). 2013. California Emissions Estimator Model User’s Guide. Version 2013.2.2. October.
Jones & Stokes Associates (JSA). 2007. Software User’s Guide: URBEMIS2007 for Windows. November.
Sacramento Metropolitan Air Quality Management District (SMAQMD). 2009. Road Construction Emissions Model (Version 6.3.2). November.
South Coast Air Quality Management District (SCAQMD). 1993. CEQA Air Quality Handbook. April.
South Coast Air Quality Management District (SCAQMD). 2006. Final – Methodology to Calculate Particulate Matter (PM) 2.5 and PM2.5 Significance Thresholds. October.
12 Wind speed taken as the average for the years 2002 through 2006, as measured at a meteorological tower located at SSFL and operated by Boeing. 13 Default emission factors for excavation activities were obtained from Table A-4 of Appendix A of the Software User’s Guide: URBEMIS2007 for Windows (JSA, 2007).
H-12 MGM11-SSFL/EIS/APPENDIXH/APPENDIXH.DOCX ES09071117265MGM
Appendix H, NASA SSFL EIS for Proposed Demolition and Environmental Cleanup
H-12

APPENDIX H SUPPLEMENTAL AIR QUALITY AND GREENHOUSE GAS INFORMATION AND TECHNICAL APPROACH
South Coast Air Quality Management District (SCAQMD). 2010. Supplemental Instructions: Reporting Procedures for AB2588 Facilities for Reporting their Quadrennial Air Toxics Emissions Inventory. January.
The Climate Registry (TCR). 2013. General Reporting Protocol (Version 2.0). March, with emission factors updated in April.
U.S. Environmental Protection Agency (EPA). 2013a. Air Data: Monitor Values Report – Criteria Air Pollutants. http://www.epa.gov/airdata/ad_rep_mon.html. Updated September 9, 2013. Accessed December 4, 2013.
U.S. Environmental Protection Agency (EPA). 2013b. Green Book. http://www.epa.gov/oaqps001/greenbk/index.html. Updated July 31, 2013. Accessed December 4, 2013.
MGM11-SSFL/EIS/APPENDIXH/APPENDIXH.DOCX H-13 ES09071117265MGM
Appendix H, NASA SSFL EIS for Proposed Demolition and Environmental Cleanup
H-13
APPENDIX H SUPPLEMENTAL AIR QUALITY AND GREENHOUSE GAS INFORMATION AND TECHNICAL APPROACH
This page intentionally left blank.
H-14 MGM11-SSFL/EIS/APPENDIXH/APPENDIXH.DOCX ES09071117265MGM
Appendix H, NASA SSFL EIS for Proposed Demolition and Environmental Cleanup
H-14

Attachments
Appendix H, NASA SSFL EIS for Proposed Demolition and Environmental Cleanup
H-15

This page intentionally left blank.
Appendix H, NASA SSFL EIS for Proposed Demolition and Environmental Cleanup
H-16
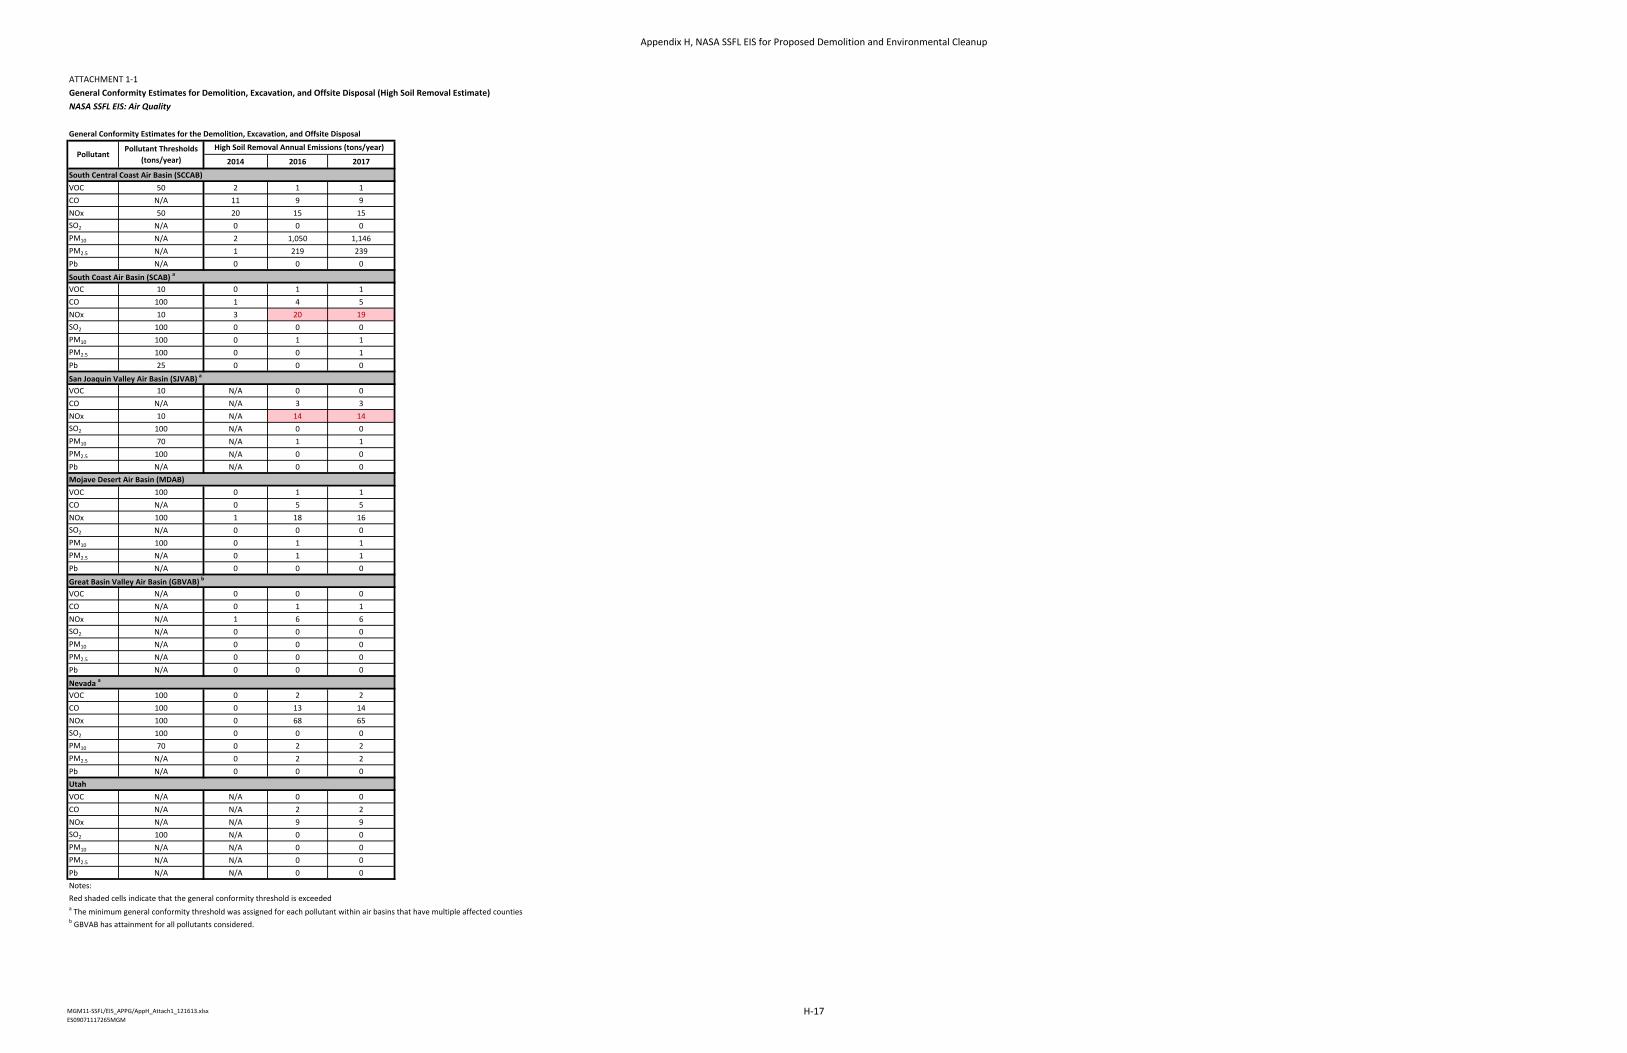
ATTACHMENT 1‐1General Conformity Estimates for Demolition, Excavation, and Offsite Disposal (High Soil Removal Estimate)
NASA SSFL EIS: Air Quality
General Conformity Estimates for the Demolition, Excavation, and Offsite Disposal
2014 2016 2017
South Central Coast Air Basin (SCCAB)
VOC 50 2 1 1CO N/A 11 9 9NOx 50 20 15 15SO2 N/A 0 0 0PM10 N/A 2 1,050 1,146PM2.5 N/A 1 219 239Pb N/A 0 0 0South Coast Air Basin (SCAB) a
VOC 10 0 1 1CO 100 1 4 5NOx 10 3 20 19SO2 100 0 0 0PM10 100 0 1 1PM2.5 100 0 0 1Pb 25 0 0 0San Joaquin Valley Air Basin (SJVAB) a
VOC 10 N/A 0 0CO N/A N/A 3 3NOx 10 N/A 14 14SO2 100 N/A 0 0PM10 70 N/A 1 1PM2.5 100 N/A 0 0Pb N/A N/A 0 0Mojave Desert Air Basin (MDAB)
VOC 100 0 1 1CO N/A 0 5 5NOx 100 1 18 16SO2 N/A 0 0 0PM10 100 0 1 1PM2.5 N/A 0 1 1Pb N/A 0 0 0Great Basin Valley Air Basin (GBVAB) b
VOC N/A 0 0 0CO N/A 0 1 1NOx N/A 1 6 6SO2 N/A 0 0 0PM10 N/A 0 0 0PM2.5 N/A 0 0 0Pb N/A 0 0 0Nevada a
VOC 100 0 2 2CO 100 0 13 14NOx 100 0 68 65SO2 100 0 0 0PM10 70 0 2 2PM2.5 N/A 0 2 2Pb N/A 0 0 0Utah
VOC N/A N/A 0 0CO N/A N/A 2 2NOx N/A N/A 9 9SO2 100 N/A 0 0PM10 N/A N/A 0 0PM2.5 N/A N/A 0 0Pb N/A N/A 0 0Notes:Red shaded cells indicate that the general conformity threshold is exceededa The minimum general conformity threshold was assigned for each pollutant within air basins that have multiple affected counties.b GBVAB has attainment for all pollutants considered.
High Soil Removal Annual Emissions (tons/year)Pollutant
Pollutant Thresholds
(tons/year)
MGM11‐SSFL/EIS_APPG/AppH_Attach1_121613.xlsxES09071117265MGM
Appendix H, NASA SSFL EIS for Proposed Demolition and Environmental Cleanup
H-17

ATTACHMENT 1‐1General Conformity Estimates for Demolition, Excavation, and Offsite Disposal (High Soil Removal Estimate)
NASA SSFL EIS: Air Quality
General Conformity Thresholds
Serious N 50 Extreme N 10 Extreme N 10 Moderate N c 100 Extreme N 10 Extreme N 10Former Subpart
I d 100 A N/A A N/ASerious N 50 Extreme N 10 Extreme N 10 Moderate N c 100 Extreme N 10 Extreme N 10
Former Subpart I d 100 A N/A A N/A
Serious N 50 Extreme N 10 Extreme N 10 Moderate N c 100 Extreme N 10 Extreme N 10Former Subpart
I d 100 A N/A A N/AA N/A M 100 M 100 Moderate N 100 Serious N 70 M 100 Serious N 70 A N/A A N/AA N/A N 100 N 100 A N/A N 100 N 100 A N/A A N/A A N/AA N/A N 100 N 100 A N/A N 100 N 100 A N/A A N/A A N/AA N/A N 100 N 100 A N/A N 100 N 100 A N/A A N/A A N/AA N/A N 100 N 100 A N/A N 100 N 100 A N/A A N/A A N/AA N/A Serious M 100 Serious M 100 A N/A A N/A A N/A Serious M 100 A N/A A N/AA N/A A N/A A N/A A N/A A N/A A N/A A N/A A N/A A N/AA N/A A N/A A N/A A N/A A N/A A N/A A N/A M 100 N 100A N/A N 25 A N/A A N/A A N/A A N/A A N/A A N/A A N/A
Notes:A = AttainmentM = MaintenanceN = NonattainmentN/A = Not Applicablea General Conformity de minimis threshold values from 40 CFR Parts 51 and 93, EPA‐HQ‐OAR‐2004‐0491; FRL‐8197‐4.b Refer to Table H‐2 of Appendix H for details on which counties are in partial nonattainment, maintenance, or attainment areas.c California is not located in an ozone transportation region (http://www.epa.gov/glo/fs20080317.html). As a result, the General Conformity de minimis threshold value for an ozone attainment status of "Moderate Nonattainment" was taken as 100 tons/year.
Tooele
UtahNevada
Clark White Pine
Federal Attainment Status / General Conformity De Minimis Threshold Values (tons/year) a, bMDAB
San Bernardino Kern
SJVAB
Kings
CO
Ventura Los Angeles
SCCAB SCAB
d Per 76 FR 17373, the designation status of the Clark County ozone nonattainment area remains nonattainment despite the EPA's determination that the area has attained the NAAQS. Since Clark County is not located in an ozone transportation region, the General Conformity de minimis threshold value of 100 tons/year was used.
Ozone Precursor (NOx)
Pollutant
Ozone
State or California Air Basin
SO2
Lead (2008 standard)
Ozone Precursor (VOC)PM10
PM2.5 (Direct Emissions)PM2.5 Precursor (SO2)PM2.5 Precursor (NOx)PM2.5 Precursor (VOC )
NO2
MGM11‐SSFL/EIS_APPG/AppH_Attach1_121613.xlsxES09071117265MGM
Appendix H, NASA SSFL EIS for Proposed Demolition and Environmental Cleanup
H-18
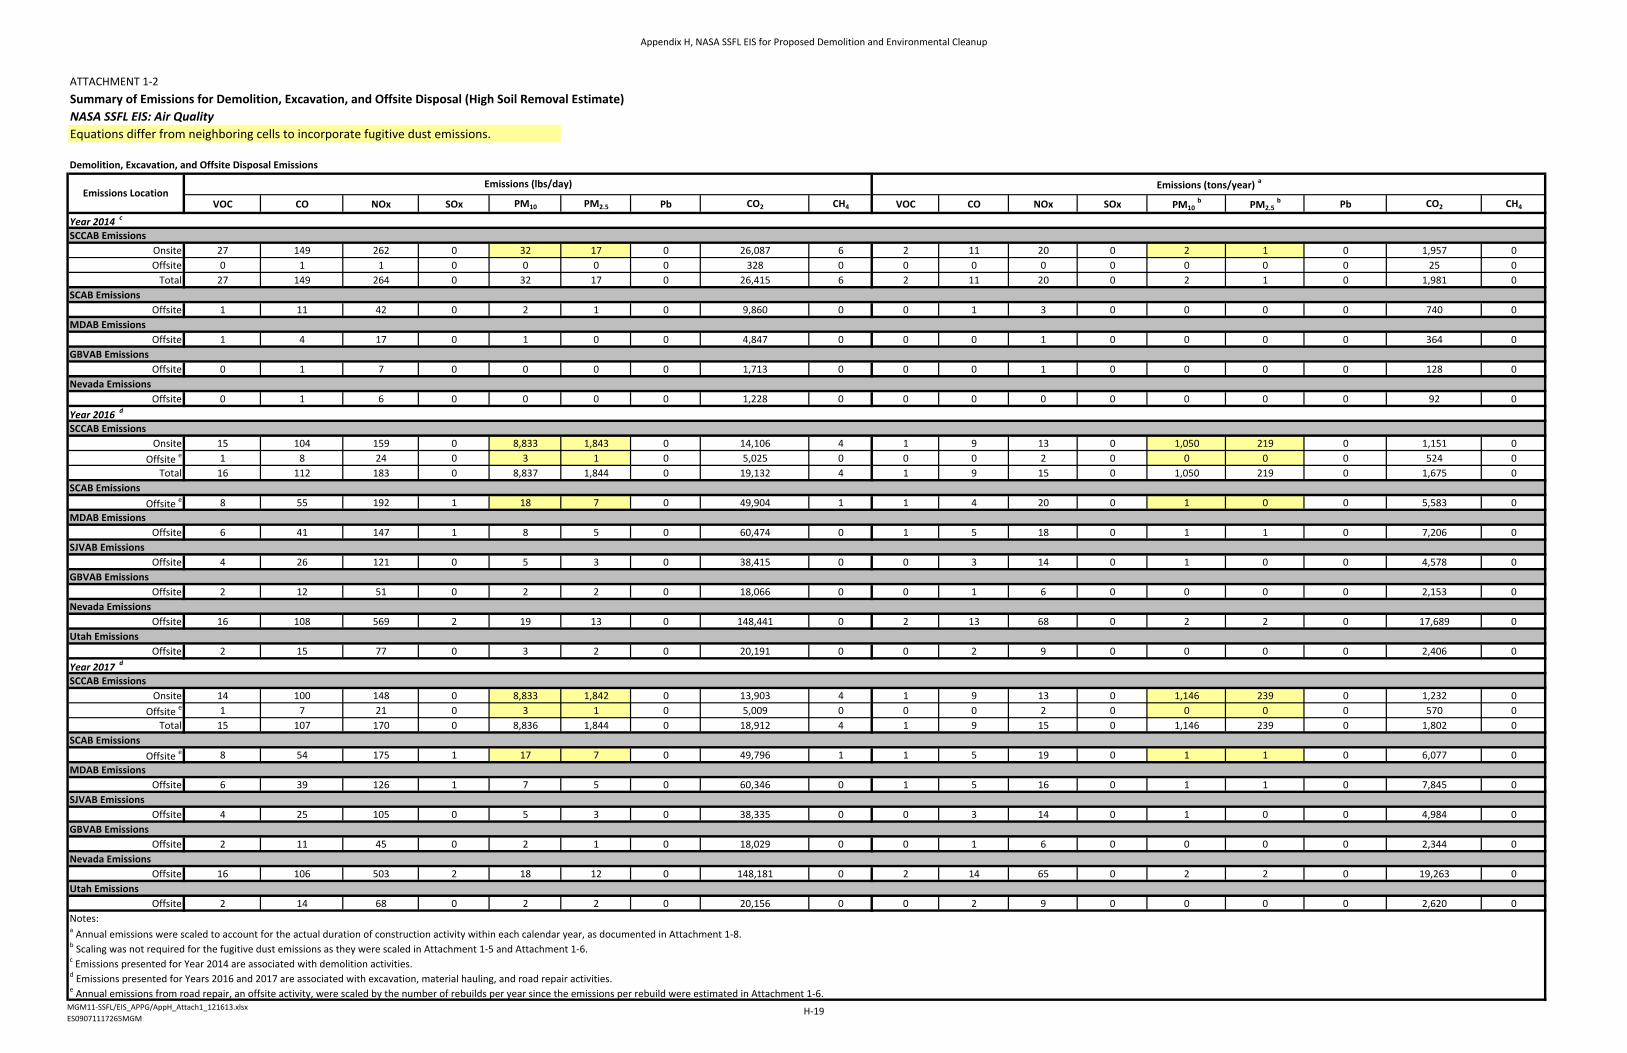
ATTACHMENT 1‐2Summary of Emissions for Demolition, Excavation, and Offsite Disposal (High Soil Removal Estimate)
NASA SSFL EIS: Air QualityEquations differ from neighboring cells to incorporate fugitive dust emissions.
Demolition, Excavation, and Offsite Disposal Emissions
VOC CO NOx SOx PM10 PM2.5 Pb CO2 CH4 VOC CO NOx SOx PM10 b PM2.5
b Pb CO2 CH4
Year 2014 c
SCCAB Emissions
Onsite 27 149 262 0 32 17 0 26,087 6 2 11 20 0 2 1 0 1,957 0Offsite 0 1 1 0 0 0 0 328 0 0 0 0 0 0 0 0 25 0
Total 27 149 264 0 32 17 0 26,415 6 2 11 20 0 2 1 0 1,981 0SCAB Emissions
Offsite 1 11 42 0 2 1 0 9,860 0 0 1 3 0 0 0 0 740 0MDAB Emissions
Offsite 1 4 17 0 1 0 0 4,847 0 0 0 1 0 0 0 0 364 0GBVAB Emissions
Offsite 0 1 7 0 0 0 0 1,713 0 0 0 1 0 0 0 0 128 0Nevada Emissions
Offsite 0 1 6 0 0 0 0 1,228 0 0 0 0 0 0 0 0 92 0Year 2016 d
SCCAB Emissions
Onsite 15 104 159 0 8,833 1,843 0 14,106 4 1 9 13 0 1,050 219 0 1,151 0Offsite e 1 8 24 0 3 1 0 5,025 0 0 0 2 0 0 0 0 524 0
Total 16 112 183 0 8,837 1,844 0 19,132 4 1 9 15 0 1,050 219 0 1,675 0SCAB Emissions
Offsite e 8 55 192 1 18 7 0 49,904 1 1 4 20 0 1 0 0 5,583 0MDAB Emissions
Offsite 6 41 147 1 8 5 0 60,474 0 1 5 18 0 1 1 0 7,206 0SJVAB Emissions
Offsite 4 26 121 0 5 3 0 38,415 0 0 3 14 0 1 0 0 4,578 0GBVAB Emissions
Offsite 2 12 51 0 2 2 0 18,066 0 0 1 6 0 0 0 0 2,153 0Nevada Emissions
Offsite 16 108 569 2 19 13 0 148,441 0 2 13 68 0 2 2 0 17,689 0Utah Emissions
Offsite 2 15 77 0 3 2 0 20,191 0 0 2 9 0 0 0 0 2,406 0Year 2017 d
SCCAB Emissions
Onsite 14 100 148 0 8,833 1,842 0 13,903 4 1 9 13 0 1,146 239 0 1,232 0Offsite e 1 7 21 0 3 1 0 5,009 0 0 0 2 0 0 0 0 570 0
Total 15 107 170 0 8,836 1,844 0 18,912 4 1 9 15 0 1,146 239 0 1,802 0SCAB Emissions
Offsite e 8 54 175 1 17 7 0 49,796 1 1 5 19 0 1 1 0 6,077 0MDAB Emissions
Offsite 6 39 126 1 7 5 0 60,346 0 1 5 16 0 1 1 0 7,845 0SJVAB Emissions
Offsite 4 25 105 0 5 3 0 38,335 0 0 3 14 0 1 0 0 4,984 0GBVAB Emissions
Offsite 2 11 45 0 2 1 0 18,029 0 0 1 6 0 0 0 0 2,344 0Nevada Emissions
Offsite 16 106 503 2 18 12 0 148,181 0 2 14 65 0 2 2 0 19,263 0Utah Emissions
Offsite 2 14 68 0 2 2 0 20,156 0 0 2 9 0 0 0 0 2,620 0Notes:a Annual emissions were scaled to account for the actual duration of construction activity within each calendar year, as documented in Attachment 1‐8.b Scaling was not required for the fugitive dust emissions as they were scaled in Attachment 1‐5 and Attachment 1‐6.c Emissions presented for Year 2014 are associated with demolition activities.d Emissions presented for Years 2016 and 2017 are associated with excavation, material hauling, and road repair activities.e Annual emissions from road repair, an offsite activity, were scaled by the number of rebuilds per year since the emissions per rebuild were estimated in Attachment 1‐6.
Emissions LocationEmissions (lbs/day) Emissions (tons/year) a
MGM11‐SSFL/EIS_APPG/AppH_Attach1_121613.xlsxES09071117265MGM
Appendix H, NASA SSFL EIS for Proposed Demolition and Environmental Cleanup
H-19
This page intentionally left blank.
Appendix H, NASA SSFL EIS for Proposed Demolition and Environmental Cleanup
H-20
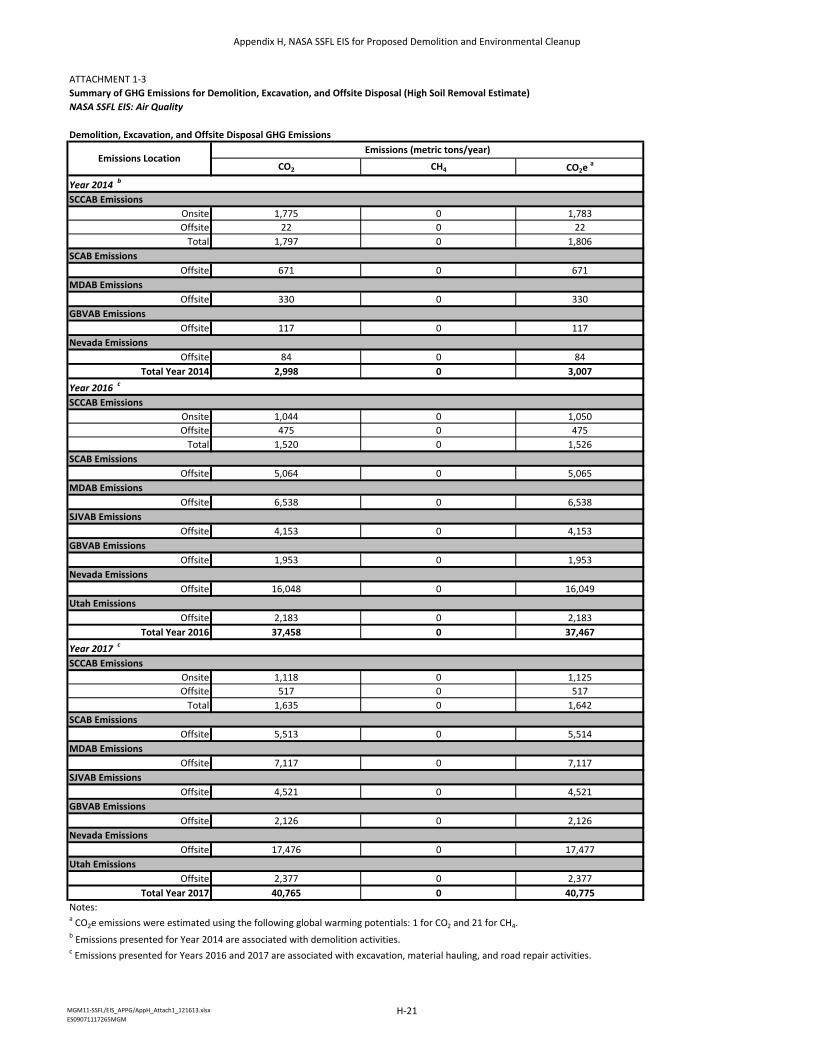
ATTACHMENT 1‐3Summary of GHG Emissions for Demolition, Excavation, and Offsite Disposal (High Soil Removal Estimate)
NASA SSFL EIS: Air Quality
Demolition, Excavation, and Offsite Disposal GHG Emissions
CO2 CH4 CO2e a
Year 2014 b
SCCAB Emissions
Onsite 1,775 0 1,783Offsite 22 0 22
Total 1,797 0 1,806SCAB Emissions
Offsite 671 0 671MDAB Emissions
Offsite 330 0 330GBVAB Emissions
Offsite 117 0 117Nevada Emissions
Offsite 84 0 84Total Year 2014 2,998 0 3,007
Year 2016 c
SCCAB Emissions
Onsite 1,044 0 1,050Offsite 475 0 475
Total 1,520 0 1,526SCAB Emissions
Offsite 5,064 0 5,065MDAB Emissions
Offsite 6,538 0 6,538SJVAB Emissions
Offsite 4,153 0 4,153GBVAB Emissions
Offsite 1,953 0 1,953Nevada Emissions
Offsite 16,048 0 16,049Utah Emissions
Offsite 2,183 0 2,183Total Year 2016 37,458 0 37,467
Year 2017 c
SCCAB Emissions
Onsite 1,118 0 1,125Offsite 517 0 517
Total 1,635 0 1,642SCAB Emissions
Offsite 5,513 0 5,514MDAB Emissions
Offsite 7,117 0 7,117SJVAB Emissions
Offsite 4,521 0 4,521GBVAB Emissions
Offsite 2,126 0 2,126Nevada Emissions
Offsite 17,476 0 17,477Utah Emissions
Offsite 2,377 0 2,377Total Year 2017 40,765 0 40,775
Notes:a CO2e emissions were estimated using the following global warming potentials: 1 for CO2 and 21 for CH4.b Emissions presented for Year 2014 are associated with demolition activities.c Emissions presented for Years 2016 and 2017 are associated with excavation, material hauling, and road repair activities.
Emissions LocationEmissions (metric tons/year)
MGM11‐SSFL/EIS_APPG/AppH_Attach1_121613.xlsxES09071117265MGM
Appendix H, NASA SSFL EIS for Proposed Demolition and Environmental Cleanup
H-21

This page intentionally left blank.
Appendix H, NASA SSFL EIS for Proposed Demolition and Environmental Cleanup
H-22

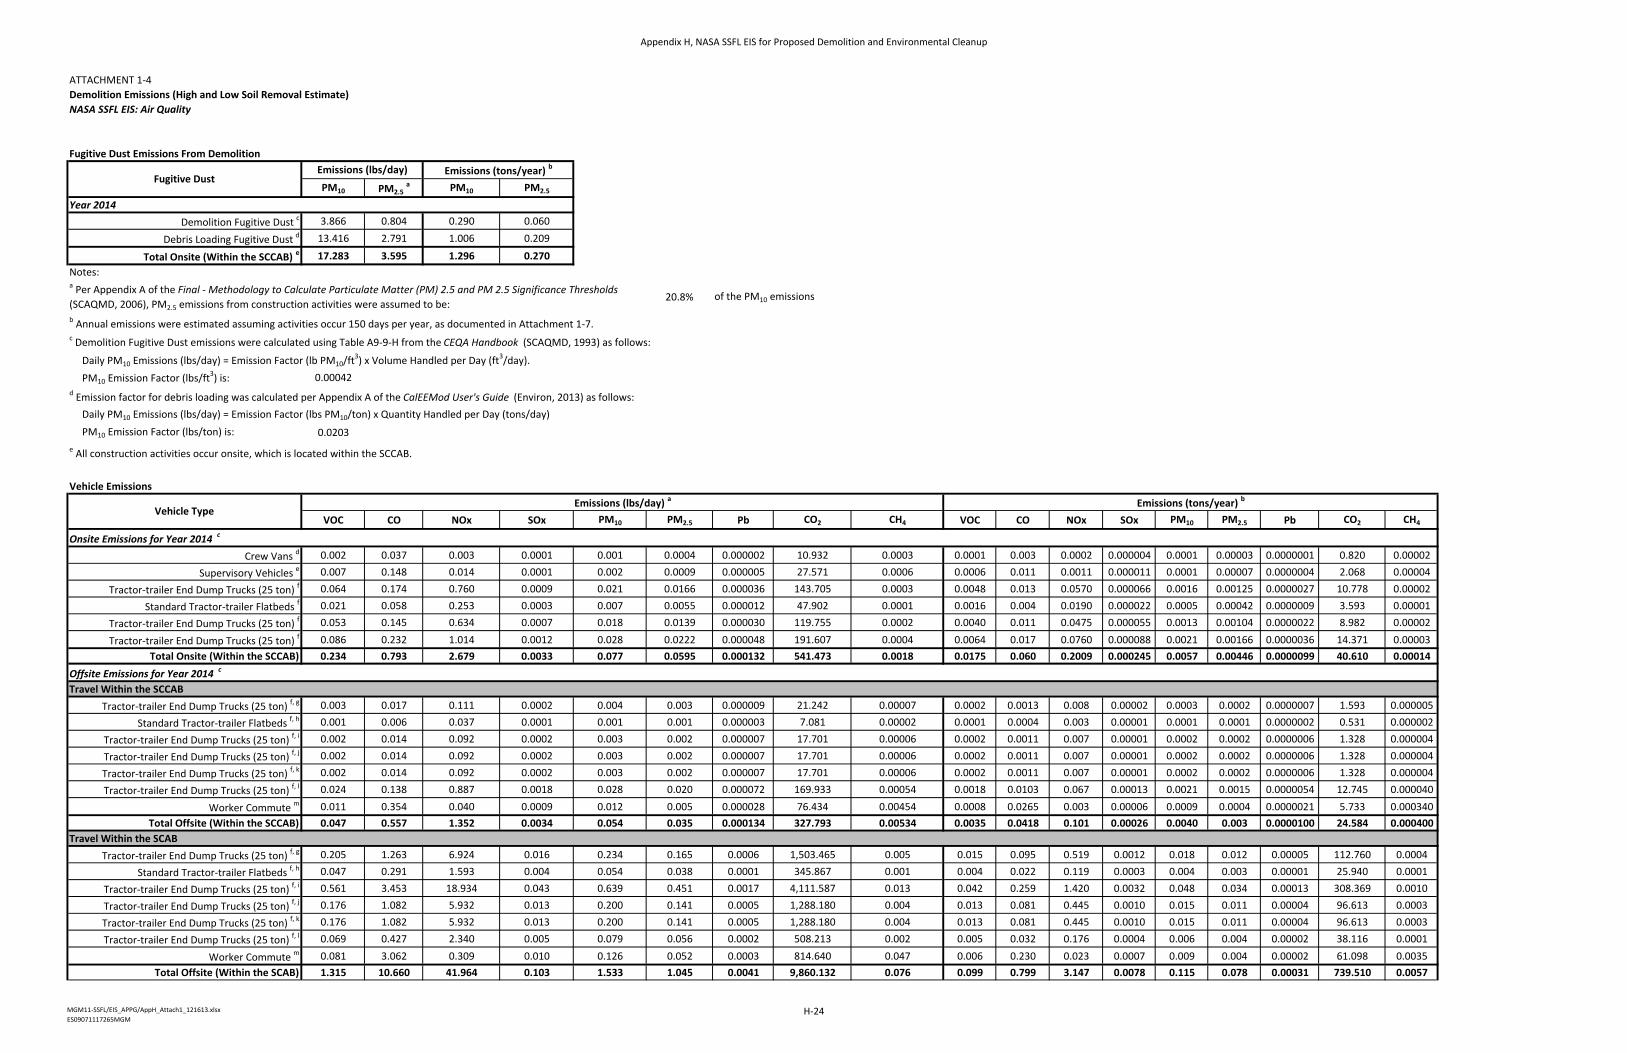
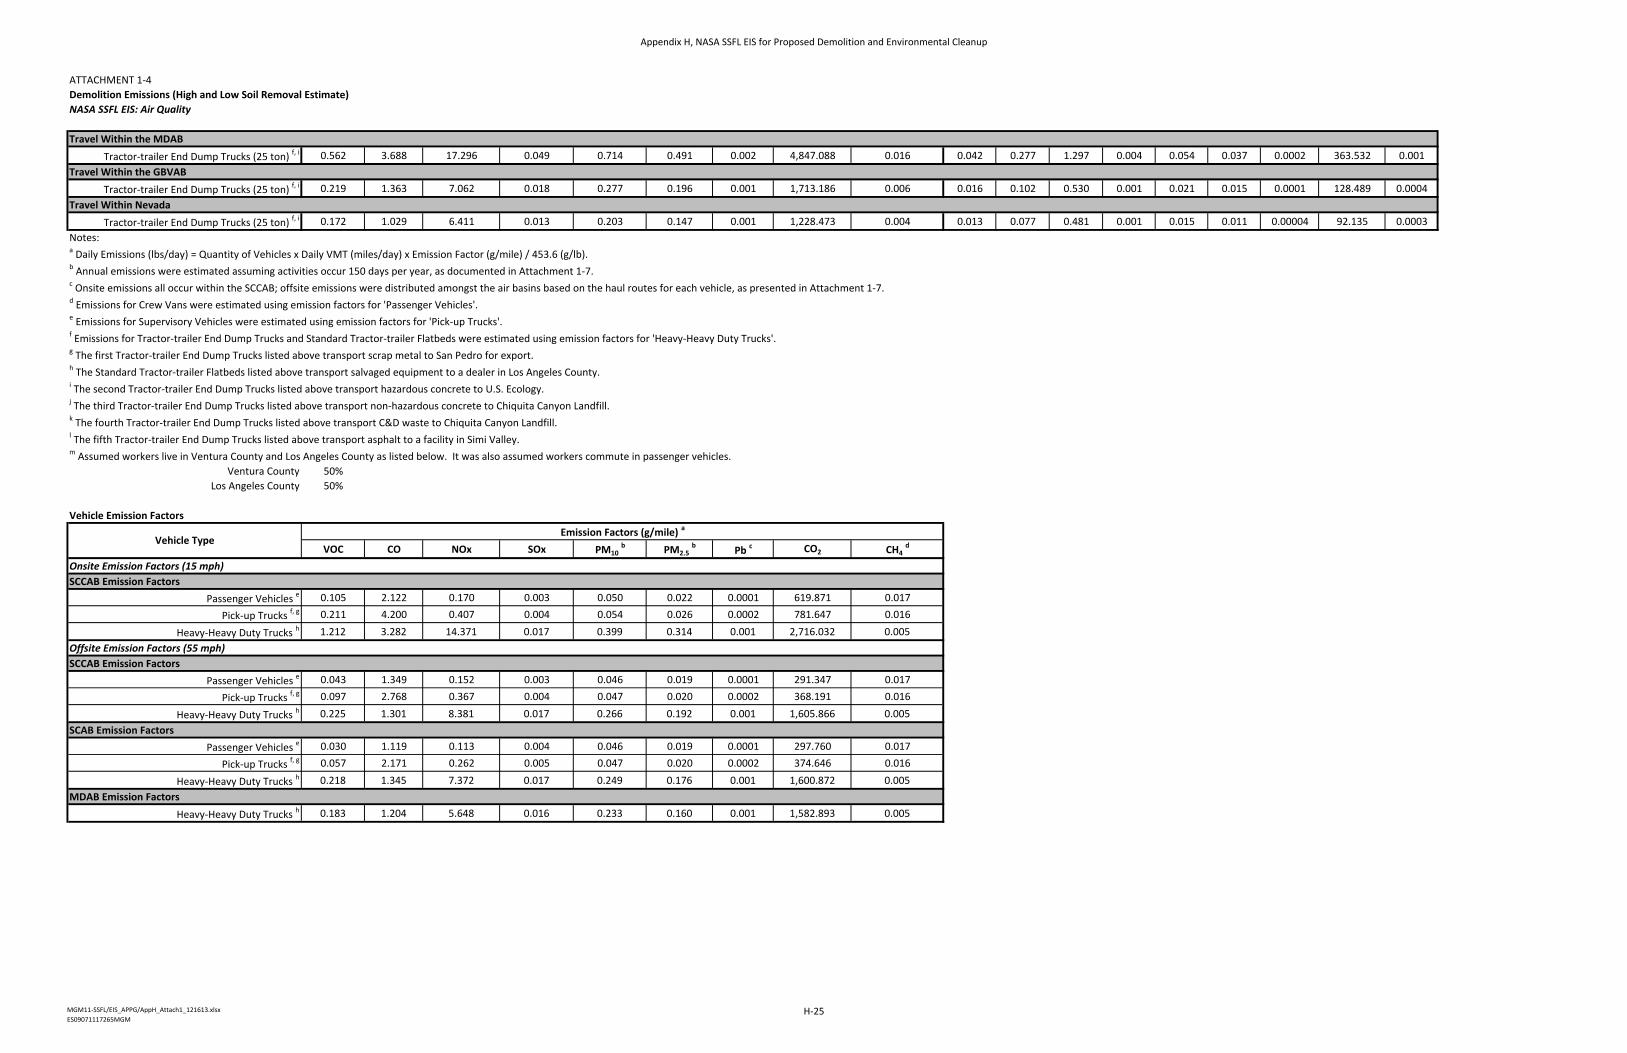
ATTACHMENT 1‐4Demolition Emissions (High and Low Soil Removal Estimate)
NASA SSFL EIS: Air Quality
Construction Equipment Emissions
VOC CO NOx SOx PM10 PM2.5 Pb CO2 CH4 VOC CO NOx SOx PM10 PM2.5 Pb CO2 CH4
Year 2014Excavators 2.663 21.537 31.796 0.033 1.563 1.438 0.0017 3,529.232 1.043 0.200 1.615 2.385 0.0025 0.117 0.108 0.00013 264.692 0.078
Crawler Cranes c 0.955 3.939 11.357 0.007 0.521 0.479 0.0004 747.993 0.221 0.072 0.295 0.852 0.0005 0.039 0.036 0.00003 56.099 0.017
All‐Terrain Cranes c 1.909 7.878 22.714 0.014 1.041 0.958 0.0007 1,495.986 0.442 0.143 0.591 1.704 0.0011 0.078 0.072 0.00005 112.199 0.033
Manlifts d 0.174 2.772 2.904 0.004 0.138 0.127 0.0002 444.939 0.131 0.013 0.208 0.218 0.0003 0.010 0.010 0.00002 33.370 0.010
Wheel Loaders e 1.291 4.716 17.446 0.015 0.593 0.546 0.0008 1,632.434 0.483 0.097 0.354 1.308 0.0011 0.044 0.041 0.00006 122.433 0.036Off‐highway Trucks 2.637 13.908 31.404 0.033 1.203 1.107 0.0017 3,492.095 1.032 0.198 1.043 2.355 0.0025 0.090 0.083 0.00012 261.907 0.077
Dozers f 1.590 13.862 18.120 0.011 0.845 0.777 0.0006 1,179.827 0.349 0.119 1.040 1.359 0.0008 0.063 0.058 0.00004 88.487 0.026
Vacuum Trucks g 1.318 6.954 15.702 0.016 0.601 0.554 0.0008 1,746.047 0.516 0.099 0.522 1.178 0.0012 0.045 0.042 0.00006 130.954 0.039
Motor Graders h 1.340 6.249 13.765 0.008 0.773 0.711 0.0004 834.922 0.247 0.100 0.469 1.032 0.0006 0.058 0.053 0.00003 62.619 0.019Skid‐steer Loaders 0.645 7.080 8.511 0.010 0.497 0.458 0.0005 1,096.591 0.324 0.048 0.531 0.638 0.0008 0.037 0.034 0.00004 82.244 0.024
Miscellaneous Small Equipment i, j 12.350 58.986 85.939 0.099 6.627 6.627 0.0041 9,345.361 1.102 0.926 4.424 6.445 0.0074 0.497 0.497 0.00031 700.902 0.083
Total Onsite (Within the SCCAB) k 26.871 147.882 259.658 0.251 14.402 13.781 0.0118 25,545.427 5.890 2.015 11.091 19.474 0.0189 1.080 1.034 0.00089 1,915.907 0.442
Notes:a Daily Emissions (lbs/day) = Emission Factor (g/bhp‐hr) x Quantity X Horsepower x Load Factor x Hours of Operation per Day / 453.6 (g/lb).b Annual emissions were estimated assuming activities occur 150 days per year, as documented in Attachment 1‐7.c Emissions for Crawler Cranes and All‐Terrain Cranes were estimated using emission factors for 'Cranes'.d Emissions for Manlifts were estimated using emission factors for 'Aerial Lifts'.e Emissions for Wheel Loaders were estimated using emission factors for 'Rubber Tired Loaders'.f Emissions for Dozers were estimated using emission factors for 'Rubber Tired Dozers'.g Emissions for Vacuum Trucks were estimated using emission factors for 'Off‐highway Trucks'.h Emissions for Motor Graders were estimated using emission factors for 'Graders'.i Emissions for Miscellaneous Small Equipment were estimated using emission factors for 'Pumps'.j While Miscellaneous Small Equipment may include compressors, lighting, pumps, etc., emissions were estimated assuming all equipment were pumps.k All construction activities occur onsite, which is located within the SCCAB.
Construction Equipment Emission Factors
VOC CO NOx SOx PM10 PM2.5 Pb b, c CO2 CH4
Year 2014Excavators 0.390 3.154 4.657 0.005 0.229 0.211 0.0002 516.907 0.153
Cranes 0.661 2.726 7.860 0.005 0.360 0.331 0.0002 517.683 0.153Aerial Lifts 0.202 3.220 3.373 0.005 0.161 0.148 0.0002 516.703 0.153
Rubber Tired Loaders 0.407 1.486 5.495 0.005 0.187 0.172 0.0002 514.217 0.152Off‐highway Trucks 0.393 2.075 4.686 0.005 0.180 0.165 0.0002 521.057 0.154
Rubber Tired Dozers 0.707 6.165 8.058 0.005 0.376 0.346 0.0002 524.676 0.155Graders 0.847 3.951 8.702 0.005 0.488 0.449 0.0002 527.834 0.156
Skid‐steer Loaders 0.304 3.338 4.013 0.005 0.235 0.216 0.0002 517.062 0.153Pumps 0.751 3.587 5.226 0.006 0.403 0.403 0.0002 568.299 0.067
Notes:a Emission factors were obtained from Table 3.4 of Appendix D of the CalEEMod User's Guide (Environ, 2013).
0.0083 lbs/1,000 gallons
c For construction equipment, assumed the following diesel fuel consumption per Table A9‐8‐C of the CEQA Handbook (SCAQMD, 1993): 0.066 gallons/bhp‐hr
Emissions (tons/year) b
Construction EquipmentEmission Factors (g/bhp‐hr) a
b A lead emission factor for stationary and portable internal combustion engines was assumed representative of construction equipment. This factor was obtained from Table B‐2 of the Supplemental Instructions: Reporting Procedures for AB2588 Facilities for Reporting their Quadrennial Air Toxics Emissions
Inventory (SCAQMD, 2010):
Construction EquipmentEmissions (lbs/day) a
MGM11‐SSFL/EIS_APPG/AppH_Attach1_121613.xlsxES09071117265MGM
Appendix H, NASA SSFL EIS for Proposed Demolition and Environmental Cleanup
H-23
ATTACHMENT 1‐4Demolition Emissions (High and Low Soil Removal Estimate)
NASA SSFL EIS: Air Quality
Fugitive Dust Emissions From Demolition
PM10 PM2.5 a PM10 PM2.5
Year 2014Demolition Fugitive Dust c 3.866 0.804 0.290 0.060
Debris Loading Fugitive Dust d 13.416 2.791 1.006 0.209
Total Onsite (Within the SCCAB) e 17.283 3.595 1.296 0.270
Notes:
20.8% of the PM10 emissions
b Annual emissions were estimated assuming activities occur 150 days per year, as documented in Attachment 1‐7.c Demolition Fugitive Dust emissions were calculated using Table A9‐9‐H from the CEQA Handbook (SCAQMD, 1993) as follows:
Daily PM10 Emissions (lbs/day) = Emission Factor (lb PM10/ft3) x Volume Handled per Day (ft3/day). PM10 Emission Factor (lbs/ft3) is: 0.00042d Emission factor for debris loading was calculated per Appendix A of the CalEEMod User's Guide (Environ, 2013) as follows: Daily PM10 Emissions (lbs/day) = Emission Factor (lbs PM10/ton) x Quantity Handled per Day (tons/day) PM10 Emission Factor (lbs/ton) is: 0.0203e All construction activities occur onsite, which is located within the SCCAB.
Vehicle Emissions
VOC CO NOx SOx PM10 PM2.5 Pb CO2 CH4 VOC CO NOx SOx PM10 PM2.5 Pb CO2 CH4
Onsite Emissions for Year 2014 c
Crew Vans d 0.002 0.037 0.003 0.0001 0.001 0.0004 0.000002 10.932 0.0003 0.0001 0.003 0.0002 0.000004 0.0001 0.00003 0.0000001 0.820 0.00002
Supervisory Vehicles e 0.007 0.148 0.014 0.0001 0.002 0.0009 0.000005 27.571 0.0006 0.0006 0.011 0.0011 0.000011 0.0001 0.00007 0.0000004 2.068 0.00004
Tractor‐trailer End Dump Trucks (25 ton) f 0.064 0.174 0.760 0.0009 0.021 0.0166 0.000036 143.705 0.0003 0.0048 0.013 0.0570 0.000066 0.0016 0.00125 0.0000027 10.778 0.00002
Standard Tractor‐trailer Flatbeds f 0.021 0.058 0.253 0.0003 0.007 0.0055 0.000012 47.902 0.0001 0.0016 0.004 0.0190 0.000022 0.0005 0.00042 0.0000009 3.593 0.00001
Tractor‐trailer End Dump Trucks (25 ton) f 0.053 0.145 0.634 0.0007 0.018 0.0139 0.000030 119.755 0.0002 0.0040 0.011 0.0475 0.000055 0.0013 0.00104 0.0000022 8.982 0.00002
Tractor‐trailer End Dump Trucks (25 ton) f 0.086 0.232 1.014 0.0012 0.028 0.0222 0.000048 191.607 0.0004 0.0064 0.017 0.0760 0.000088 0.0021 0.00166 0.0000036 14.371 0.00003Total Onsite (Within the SCCAB) 0.234 0.793 2.679 0.0033 0.077 0.0595 0.000132 541.473 0.0018 0.0175 0.060 0.2009 0.000245 0.0057 0.00446 0.0000099 40.610 0.00014
Offsite Emissions for Year 2014 c
Travel Within the SCCAB
Tractor‐trailer End Dump Trucks (25 ton) f, g 0.003 0.017 0.111 0.0002 0.004 0.003 0.000009 21.242 0.00007 0.0002 0.0013 0.008 0.00002 0.0003 0.0002 0.0000007 1.593 0.000005
Standard Tractor‐trailer Flatbeds f, h 0.001 0.006 0.037 0.0001 0.001 0.001 0.000003 7.081 0.00002 0.0001 0.0004 0.003 0.00001 0.0001 0.0001 0.0000002 0.531 0.000002
Tractor‐trailer End Dump Trucks (25 ton) f, i 0.002 0.014 0.092 0.0002 0.003 0.002 0.000007 17.701 0.00006 0.0002 0.0011 0.007 0.00001 0.0002 0.0002 0.0000006 1.328 0.000004
Tractor‐trailer End Dump Trucks (25 ton) f, j 0.002 0.014 0.092 0.0002 0.003 0.002 0.000007 17.701 0.00006 0.0002 0.0011 0.007 0.00001 0.0002 0.0002 0.0000006 1.328 0.000004
Tractor‐trailer End Dump Trucks (25 ton) f, k 0.002 0.014 0.092 0.0002 0.003 0.002 0.000007 17.701 0.00006 0.0002 0.0011 0.007 0.00001 0.0002 0.0002 0.0000006 1.328 0.000004
Tractor‐trailer End Dump Trucks (25 ton) f, l 0.024 0.138 0.887 0.0018 0.028 0.020 0.000072 169.933 0.00054 0.0018 0.0103 0.067 0.00013 0.0021 0.0015 0.0000054 12.745 0.000040
Worker Commute m 0.011 0.354 0.040 0.0009 0.012 0.005 0.000028 76.434 0.00454 0.0008 0.0265 0.003 0.00006 0.0009 0.0004 0.0000021 5.733 0.000340Total Offsite (Within the SCCAB) 0.047 0.557 1.352 0.0034 0.054 0.035 0.000134 327.793 0.00534 0.0035 0.0418 0.101 0.00026 0.0040 0.003 0.0000100 24.584 0.000400
Travel Within the SCAB
Tractor‐trailer End Dump Trucks (25 ton) f, g 0.205 1.263 6.924 0.016 0.234 0.165 0.0006 1,503.465 0.005 0.015 0.095 0.519 0.0012 0.018 0.012 0.00005 112.760 0.0004
Standard Tractor‐trailer Flatbeds f, h 0.047 0.291 1.593 0.004 0.054 0.038 0.0001 345.867 0.001 0.004 0.022 0.119 0.0003 0.004 0.003 0.00001 25.940 0.0001
Tractor‐trailer End Dump Trucks (25 ton) f, i 0.561 3.453 18.934 0.043 0.639 0.451 0.0017 4,111.587 0.013 0.042 0.259 1.420 0.0032 0.048 0.034 0.00013 308.369 0.0010
Tractor‐trailer End Dump Trucks (25 ton) f, j 0.176 1.082 5.932 0.013 0.200 0.141 0.0005 1,288.180 0.004 0.013 0.081 0.445 0.0010 0.015 0.011 0.00004 96.613 0.0003
Tractor‐trailer End Dump Trucks (25 ton) f, k 0.176 1.082 5.932 0.013 0.200 0.141 0.0005 1,288.180 0.004 0.013 0.081 0.445 0.0010 0.015 0.011 0.00004 96.613 0.0003
Tractor‐trailer End Dump Trucks (25 ton) f, l 0.069 0.427 2.340 0.005 0.079 0.056 0.0002 508.213 0.002 0.005 0.032 0.176 0.0004 0.006 0.004 0.00002 38.116 0.0001
Worker Commute m 0.081 3.062 0.309 0.010 0.126 0.052 0.0003 814.640 0.047 0.006 0.230 0.023 0.0007 0.009 0.004 0.00002 61.098 0.0035Total Offsite (Within the SCAB) 1.315 10.660 41.964 0.103 1.533 1.045 0.0041 9,860.132 0.076 0.099 0.799 3.147 0.0078 0.115 0.078 0.00031 739.510 0.0057
Fugitive DustEmissions (lbs/day) Emissions (tons/year) b
a Per Appendix A of the Final ‐ Methodology to Calculate Particulate Matter (PM) 2.5 and PM 2.5 Significance Thresholds
(SCAQMD, 2006), PM2.5 emissions from construction activities were assumed to be:
Emissions (tons/year) bEmissions (lbs/day) aVehicle Type
MGM11‐SSFL/EIS_APPG/AppH_Attach1_121613.xlsxES09071117265MGM
Appendix H, NASA SSFL EIS for Proposed Demolition and Environmental Cleanup
H-24
ATTACHMENT 1‐4Demolition Emissions (High and Low Soil Removal Estimate)
NASA SSFL EIS: Air Quality
Travel Within the MDAB
Tractor‐trailer End Dump Trucks (25 ton) f, i 0.562 3.688 17.296 0.049 0.714 0.491 0.002 4,847.088 0.016 0.042 0.277 1.297 0.004 0.054 0.037 0.0002 363.532 0.001Travel Within the GBVAB
Tractor‐trailer End Dump Trucks (25 ton) f, i 0.219 1.363 7.062 0.018 0.277 0.196 0.001 1,713.186 0.006 0.016 0.102 0.530 0.001 0.021 0.015 0.0001 128.489 0.0004Travel Within Nevada
Tractor‐trailer End Dump Trucks (25 ton) f, i 0.172 1.029 6.411 0.013 0.203 0.147 0.001 1,228.473 0.004 0.013 0.077 0.481 0.001 0.015 0.011 0.00004 92.135 0.0003Notes:a Daily Emissions (lbs/day) = Quantity of Vehicles x Daily VMT (miles/day) x Emission Factor (g/mile) / 453.6 (g/lb).b Annual emissions were estimated assuming activities occur 150 days per year, as documented in Attachment 1‐7.c Onsite emissions all occur within the SCCAB; offsite emissions were distributed amongst the air basins based on the haul routes for each vehicle, as presented in Attachment 1‐7.d Emissions for Crew Vans were estimated using emission factors for 'Passenger Vehicles'.e Emissions for Supervisory Vehicles were estimated using emission factors for 'Pick‐up Trucks'.f Emissions for Tractor‐trailer End Dump Trucks and Standard Tractor‐trailer Flatbeds were estimated using emission factors for 'Heavy‐Heavy Duty Trucks'.g The first Tractor‐trailer End Dump Trucks listed above transport scrap metal to San Pedro for export.h The Standard Tractor‐trailer Flatbeds listed above transport salvaged equipment to a dealer in Los Angeles County.i The second Tractor‐trailer End Dump Trucks listed above transport hazardous concrete to U.S. Ecology.j The third Tractor‐trailer End Dump Trucks listed above transport non‐hazardous concrete to Chiquita Canyon Landfill.k The fourth Tractor‐trailer End Dump Trucks listed above transport C&D waste to Chiquita Canyon Landfill.l The fifth Tractor‐trailer End Dump Trucks listed above transport asphalt to a facility in Simi Valley.m Assumed workers live in Ventura County and Los Angeles County as listed below. It was also assumed workers commute in passenger vehicles.
Ventura County 50%Los Angeles County 50%
Vehicle Emission Factors
VOC CO NOx SOx PM10 b PM2.5
bPb c CO2 CH4
d
Onsite Emission Factors (15 mph)SCCAB Emission Factors
Passenger Vehicles e 0.105 2.122 0.170 0.003 0.050 0.022 0.0001 619.871 0.017
Pick‐up Trucks f, g 0.211 4.200 0.407 0.004 0.054 0.026 0.0002 781.647 0.016
Heavy‐Heavy Duty Trucks h 1.212 3.282 14.371 0.017 0.399 0.314 0.001 2,716.032 0.005Offsite Emission Factors (55 mph)SCCAB Emission Factors
Passenger Vehicles e 0.043 1.349 0.152 0.003 0.046 0.019 0.0001 291.347 0.017
Pick‐up Trucks f, g 0.097 2.768 0.367 0.004 0.047 0.020 0.0002 368.191 0.016
Heavy‐Heavy Duty Trucks h 0.225 1.301 8.381 0.017 0.266 0.192 0.001 1,605.866 0.005SCAB Emission Factors
Passenger Vehicles e 0.030 1.119 0.113 0.004 0.046 0.019 0.0001 297.760 0.017
Pick‐up Trucks f, g 0.057 2.171 0.262 0.005 0.047 0.020 0.0002 374.646 0.016
Heavy‐Heavy Duty Trucks h 0.218 1.345 7.372 0.017 0.249 0.176 0.001 1,600.872 0.005MDAB Emission Factors
Heavy‐Heavy Duty Trucks h 0.183 1.204 5.648 0.016 0.233 0.160 0.001 1,582.893 0.005
Vehicle TypeEmission Factors (g/mile) a
MGM11‐SSFL/EIS_APPG/AppH_Attach1_121613.xlsxES09071117265MGM
Appendix H, NASA SSFL EIS for Proposed Demolition and Environmental Cleanup
H-25

ATTACHMENT 1‐4Demolition Emissions (High and Low Soil Removal Estimate)
NASA SSFL EIS: Air Quality
GBVAB Emission Factors
Heavy‐Heavy Duty Trucks h 0.202 1.262 6.537 0.017 0.256 0.182 0.001 1,585.921 0.005
Nevada Emission Factors i
Heavy‐Heavy Duty Trucks h 0.225 1.345 8.381 0.017 0.266 0.192 0.001 1,605.866 0.005Notes:a Unless otherwise noted, emission factors are from EMFAC2011‐PL for each air basin.b PM10 and PM2.5 emission factors account for particulate emissions from running exhaust, tire wear, and break wear.
0.0083 lbs/1,000 gallons
d CH4 emission factors taken from Table 13‐5 of the General Reporting Protocol (Version 2.0) for the most recent model year available (TCR, 2013).e Per Table 4‐23 of the National Transportation Statistics 2013 (BTS, 2013), assumed a passenger fuel economy of: 35.6 miles per gallonf EMFAC2011‐PL emission factors for Pick‐Up Trucks assume an equal mix of LDT1 and LDT2 vehicles.g Per Table 4‐23 of the National Transportation Statistics 2013 (BTS, 2013), assumed a pick‐up truck fuel economy of: 25.0 miles per gallon
5.572 miles per gallon
i As a conservative estimate, the maximum California emission factors were assumed representative of Nevada.
h As calculated using the EMFAC2011 Web Based Emissions Database for California (which was assumed to be representative of Nevada), the heavy‐heavy duty truck (diesel) fuel economy is:
c A lead emission factor for stationary and portable internal combustion engines was assumed representative of on‐road vehicles. This factor was obtained from Table B‐2 of the Supplemental Instructions: Reporting Procedures for AB2588 Facilities for Reporting their Quadrennial Air Toxics Emissions
Inventory (SCAQMD, 2010). Due to limited available data, this emission factor was assumed equal for all air basins, all vehicle speeds, and all construction years:
MGM11‐SSFL/EIS_APPG/AppH_Attach1_121613.xlsxES09071117265MGM
Appendix H, NASA SSFL EIS for Proposed Demolition and Environmental Cleanup
H-26

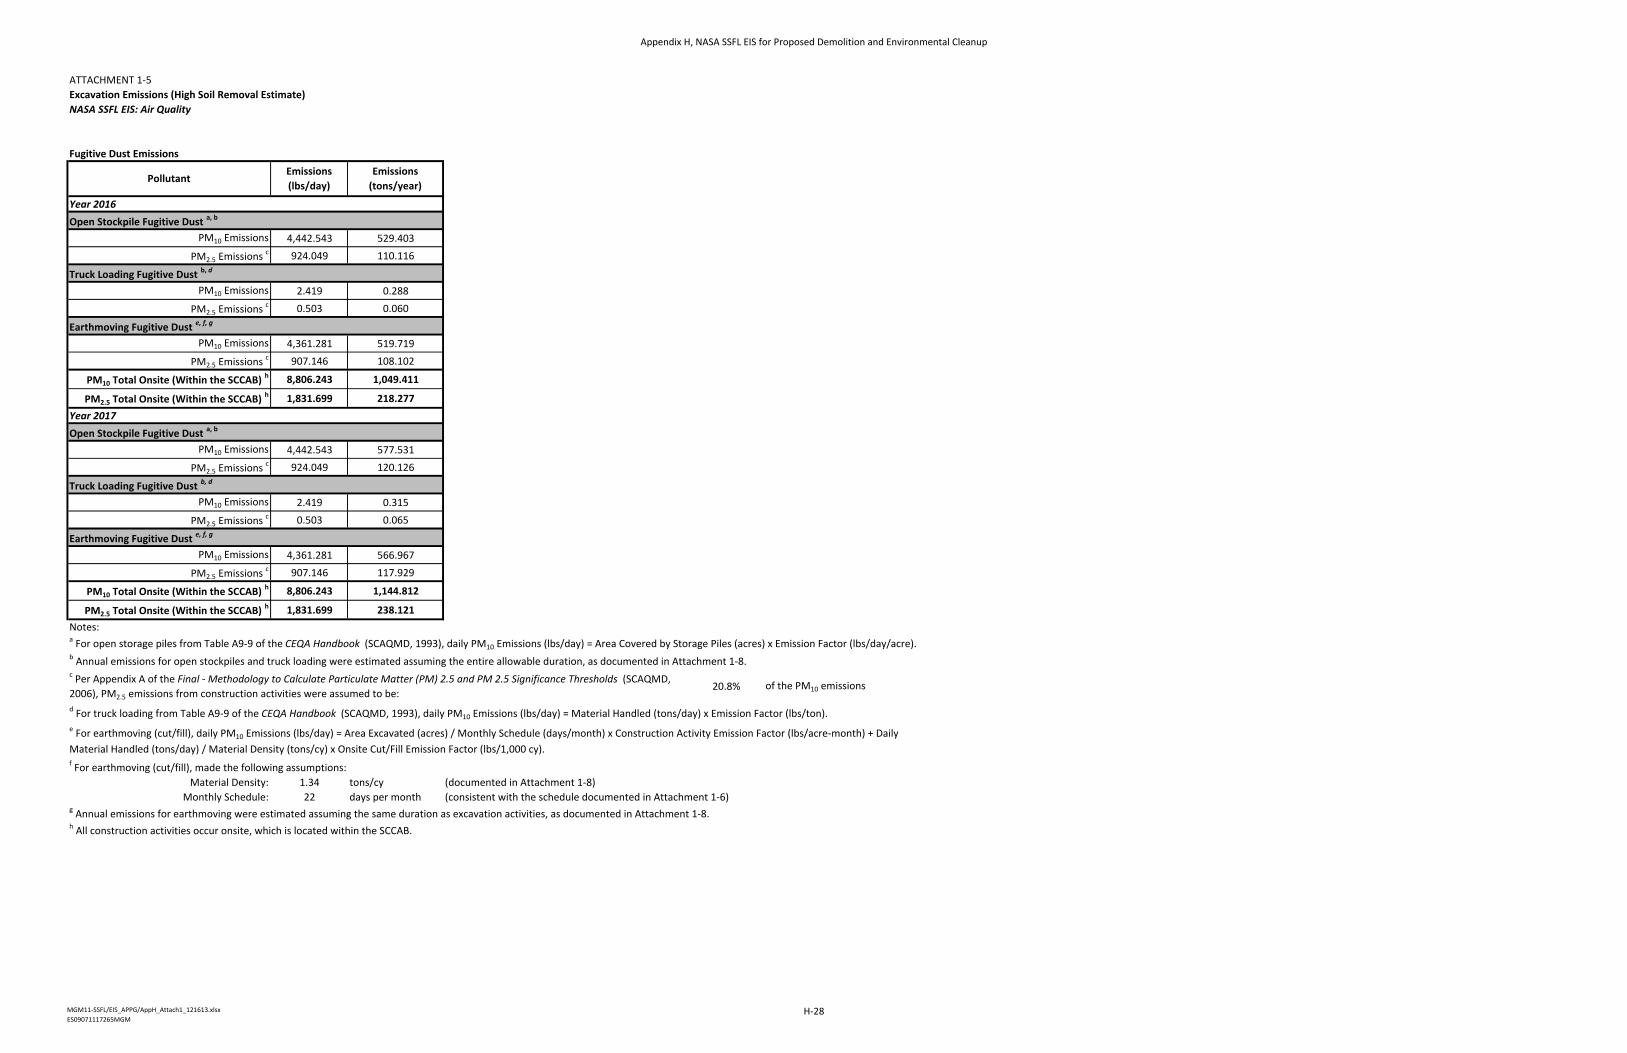
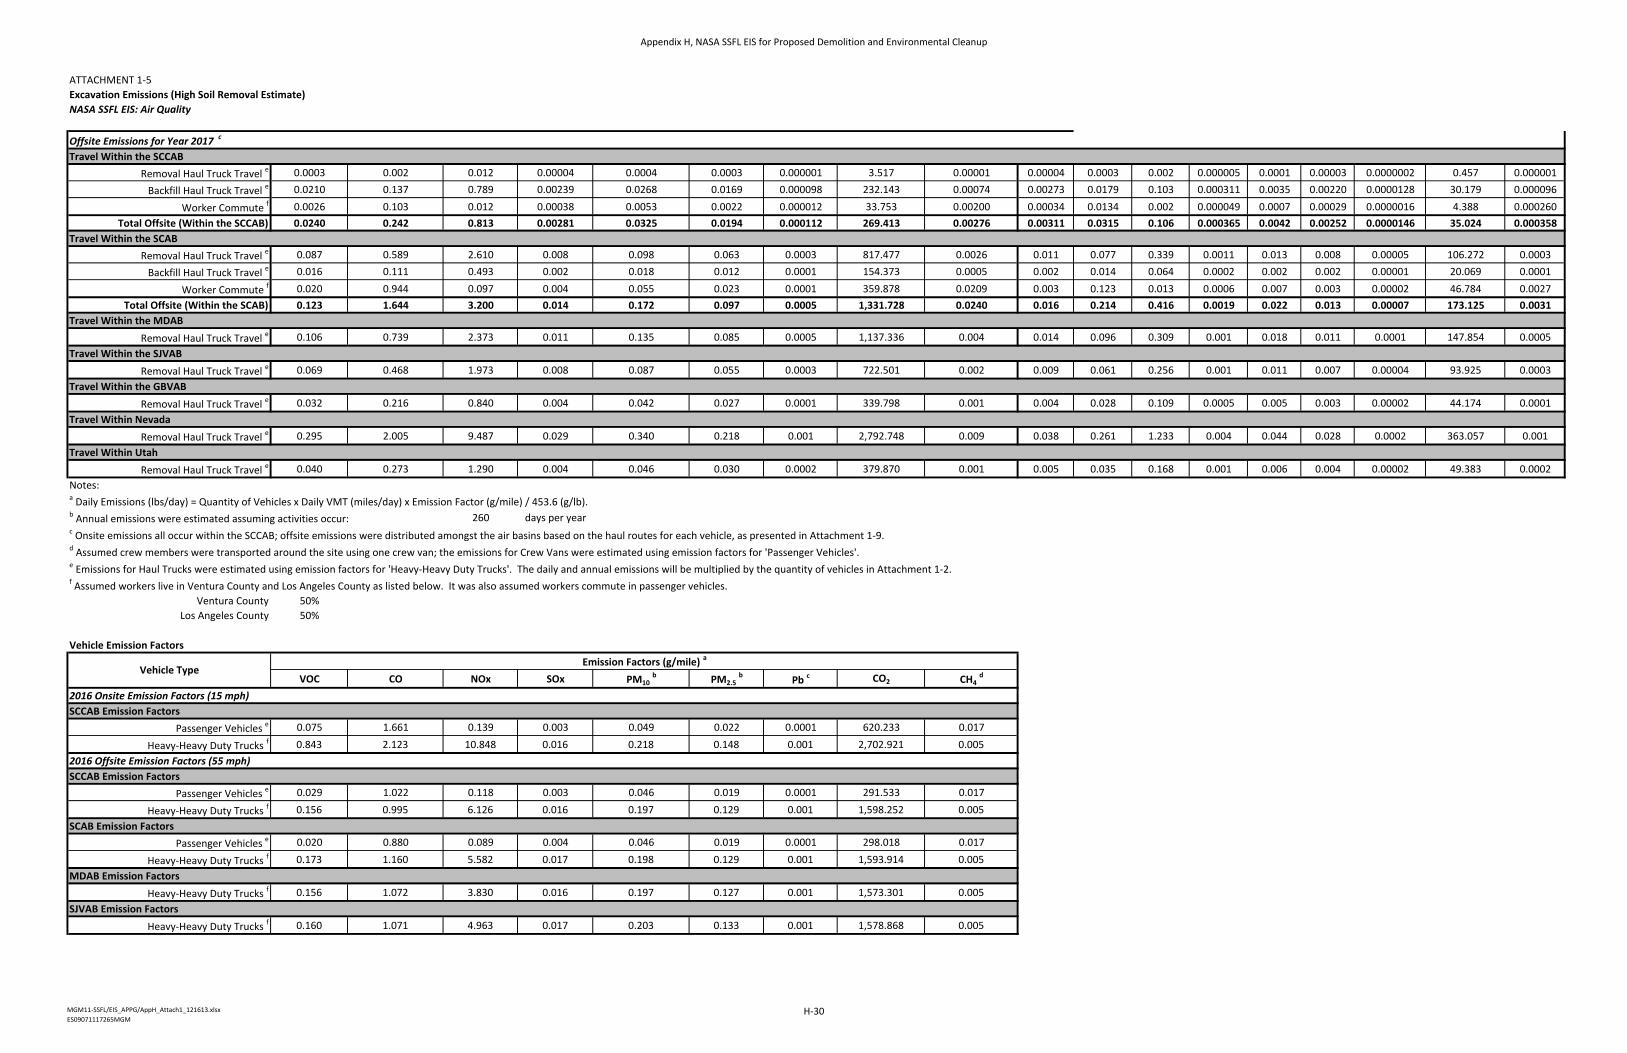
ATTACHMENT 1‐5Excavation Emissions (High Soil Removal Estimate)
NASA SSFL EIS: Air Quality
Construction Equipment Emissions
VOC CO NOx SOx PM10 PM2.5 Pb CO2 CH4 VOC CO NOx SOx PM10 PM2.5 Pb CO2 CH4
Year 2016Rubber Tired Dozers 1.548 13.106 17.338 0.011 0.807 0.742 0.0006 1,154.271 0.348 0.201 1.704 2.254 0.001 0.105 0.096 0.00007 150.055 0.045
Concrete/Industrial Saws 0.808 4.719 5.777 0.008 0.434 0.434 0.0003 740.820 0.072 0.105 0.613 0.751 0.001 0.056 0.056 0.00004 96.307 0.009Tractors/Loaders/Backhoes 1.290 9.140 12.332 0.012 0.949 0.874 0.0006 1,226.283 0.370 0.168 1.188 1.603 0.002 0.123 0.114 0.00008 159.417 0.048
Graders 1.281 6.195 13.049 0.008 0.733 0.674 0.0004 816.410 0.246 0.167 0.805 1.696 0.001 0.095 0.088 0.00005 106.133 0.032Excavators 0.976 8.624 11.145 0.013 0.548 0.504 0.0007 1,383.258 0.417 0.127 1.121 1.449 0.002 0.071 0.066 0.00009 179.824 0.054
Scrapers 3.466 27.629 44.110 0.038 1.778 1.636 0.0019 3,879.340 1.170 0.451 3.592 5.734 0.005 0.231 0.213 0.00025 504.314 0.152Total Onsite (Within the SCCAB) c 9.369 69.413 103.752 0.089 5.250 4.865 0.0045 9,200.381 2.623 1.218 9.024 13.488 0.012 0.683 0.632 0.00058 1,196.050 0.341
Year 2017Rubber Tired Dozers 1.488 12.425 16.491 0.011 0.766 0.705 0.0006 1,137.492 0.349 0.193 1.615 2.144 0.001 0.100 0.092 0.00007 147.874 0.045
Concrete/Industrial Saws 0.726 4.686 5.326 0.008 0.383 0.383 0.0003 740.818 0.065 0.094 0.609 0.692 0.001 0.050 0.050 0.00004 96.306 0.008Tractors/Loaders/Backhoes 1.200 9.069 11.532 0.012 0.867 0.798 0.0006 1,205.777 0.370 0.156 1.179 1.499 0.002 0.113 0.104 0.00008 156.751 0.048
Graders 1.198 6.082 12.121 0.008 0.681 0.626 0.0004 801.569 0.246 0.156 0.791 1.576 0.001 0.089 0.081 0.00005 104.204 0.032Excavators 0.911 8.605 10.104 0.013 0.497 0.457 0.0007 1,361.484 0.417 0.118 1.119 1.314 0.002 0.065 0.059 0.00009 176.993 0.054
Scrapers 3.257 25.566 40.908 0.038 1.642 1.510 0.0019 3,818.867 1.170 0.423 3.324 5.318 0.005 0.213 0.196 0.00025 496.453 0.152Total Onsite (Within the SCCAB) c 8.780 66.435 96.482 0.089 4.836 4.480 0.0045 9,066.008 2.616 1.141 8.636 12.543 0.012 0.629 0.582 0.00058 1,178.581 0.340
Notes:a Daily Emissions = Emission Factor (g/bhp‐hr) x Equipment Quantity X Horsepower x Load Factor x Hours of Operation per Day / 453.6 (g/lb).b Annual emissions assume activities occur: 260 days per yearc All construction activities occur onsite, which is located within the SCCAB.
Construction Equipment Emission Factors
VOC CO NOx SOx PM10 PM2.5 Pb b, c CO2 CH4
Year 2016Rubber Tired Dozers 0.688 5.828 7.710 0.005 0.359 0.330 0.0002 513.311 0.155
Concrete/Industrial Saws 0.620 3.620 4.432 0.006 0.333 0.333 0.0002 568.300 0.055Tractors/Loaders/Backhoes 0.538 3.811 5.142 0.005 0.396 0.364 0.0002 511.346 0.154
Graders 0.810 3.916 8.250 0.005 0.464 0.426 0.0002 516.131 0.156Excavators 0.358 3.158 4.081 0.005 0.201 0.185 0.0002 506.495 0.153
Scrapers 0.452 3.606 5.757 0.005 0.232 0.214 0.0002 506.350 0.153Year 2017
Rubber Tired Dozers 0.662 5.526 7.333 0.005 0.341 0.313 0.0002 505.849 0.155Concrete/Industrial Saws 0.557 3.595 4.086 0.006 0.294 0.294 0.0002 568.299 0.050
Tractors/Loaders/Backhoes 0.501 3.782 4.809 0.005 0.362 0.333 0.0002 502.795 0.154Graders 0.757 3.845 7.663 0.005 0.430 0.396 0.0002 506.748 0.155
Excavators 0.334 3.151 3.700 0.005 0.182 0.168 0.0002 498.522 0.153Scrapers 0.425 3.337 5.340 0.005 0.214 0.197 0.0002 498.457 0.153
Notes:a Emission factors were obtained from Table 3.4 of Appendix D of the CalEEMod User's Guide (Environ, 2013).
0.0083 lbs/1,000 gallons
c For construction equipment, assumed the following diesel fuel consumption per Table A9‐8‐C of the CEQA Handbook (SCAQMD, 1993): 0.066 gallons/bhp‐hr
Emission Factors (g/bhp‐hr) a
Emissions (lbs/day) a Emissions (tons/year) bConstruction Equipment
Construction Equipment
b A lead emission factor for stationary and portable internal combustion engines was assumed representative of construction equipment. This factor was obtained from Table B‐2 of the Supplemental Instructions: Reporting Procedures for AB2588 Facilities for Reporting their Quadrennial Air Toxics Emissions Inventory (SCAQMD, 2010):
MGM11‐SSFL/EIS_APPG/AppH_Attach1_121613.xlsxES09071117265MGM
Appendix H, NASA SSFL EIS for Proposed Demolition and Environmental Cleanup
H-27
ATTACHMENT 1‐5Excavation Emissions (High Soil Removal Estimate)
NASA SSFL EIS: Air Quality
Fugitive Dust Emissions
Year 2016Open Stockpile Fugitive Dust a, b
PM10 Emissions 4,442.543 529.403
PM2.5 Emissions c 924.049 110.116
Truck Loading Fugitive Dust b, d
PM10 Emissions 2.419 0.288
PM2.5 Emissions c 0.503 0.060
Earthmoving Fugitive Dust e, f, g
PM10 Emissions 4,361.281 519.719
PM2.5 Emissions c 907.146 108.102
PM10 Total Onsite (Within the SCCAB) h 8,806.243 1,049.411
PM2.5 Total Onsite (Within the SCCAB) h 1,831.699 218.277
Year 2017Open Stockpile Fugitive Dust a, b
PM10 Emissions 4,442.543 577.531
PM2.5 Emissions c 924.049 120.126
Truck Loading Fugitive Dust b, d
PM10 Emissions 2.419 0.315
PM2.5 Emissions c 0.503 0.065
Earthmoving Fugitive Dust e, f, g
PM10 Emissions 4,361.281 566.967
PM2.5 Emissions c 907.146 117.929
PM10 Total Onsite (Within the SCCAB) h 8,806.243 1,144.812
PM2.5 Total Onsite (Within the SCCAB) h 1,831.699 238.121
Notes:a For open storage piles from Table A9‐9 of the CEQA Handbook (SCAQMD, 1993), daily PM10 Emissions (lbs/day) = Area Covered by Storage Piles (acres) x Emission Factor (lbs/day/acre).b Annual emissions for open stockpiles and truck loading were estimated assuming the entire allowable duration, as documented in Attachment 1‐8.
20.8% of the PM10 emissions
f For earthmoving (cut/fill), made the following assumptions:Material Density: 1.34 tons/cy (documented in Attachment 1‐8)
Monthly Schedule: 22 days per month (consistent with the schedule documented in Attachment 1‐6)g Annual emissions for earthmoving were estimated assuming the same duration as excavation activities, as documented in Attachment 1‐8.h All construction activities occur onsite, which is located within the SCCAB.
Emissions
(lbs/day)
c Per Appendix A of the Final ‐ Methodology to Calculate Particulate Matter (PM) 2.5 and PM 2.5 Significance Thresholds (SCAQMD, 2006), PM2.5 emissions from construction activities were assumed to be:
PollutantEmissions
(tons/year)
d For truck loading from Table A9‐9 of the CEQA Handbook (SCAQMD, 1993), daily PM10 Emissions (lbs/day) = Material Handled (tons/day) x Emission Factor (lbs/ton).e For earthmoving (cut/fill), daily PM10 Emissions (lbs/day) = Area Excavated (acres) / Monthly Schedule (days/month) x Construction Activity Emission Factor (lbs/acre‐month) + Daily Material Handled (tons/day) / Material Density (tons/cy) x Onsite Cut/Fill Emission Factor (lbs/1,000 cy).
MGM11‐SSFL/EIS_APPG/AppH_Attach1_121613.xlsxES09071117265MGM
Appendix H, NASA SSFL EIS for Proposed Demolition and Environmental Cleanup
H-28

ATTACHMENT 1‐5Excavation Emissions (High Soil Removal Estimate)
NASA SSFL EIS: Air Quality
Fugitive Dust Emission Factors
PM10 Units
Open Stockpile Fugitive Dust a 85.6 lbs/day/acre
Truck Loading Fugitive Dust b 0.0014 lbs/ton
0.11 ton/acre‐month220 lbs/acre‐month
0.059 ton/1,000 cy118 lbs/1,000 cy
Notes:a Default emission factor for open storage piles from Table A9‐9 from the CEQA Handbook (SCAQMD, 1993).b Emission factor for truck loading was calculated using Table A9‐9‐G from the CEQA Handbook (SCAQMD, 1993) as follows:Emission Factor (lbs/ton) = 0.00112 x {[(Average Wind Speed / 5) ^ 1.3] / [(Dirt Moisture Content / 2) ^ 1.4]}
Average Wind Speed: 6.0 mph (value of 2.69 m/s, as measured onsite)Dirt Moisture Content: 2.0 % (assumed dry soil)
c Default emission factor for earthmoving (cut/fill) from Table A‐4 of Appendix A of the Software User's Guide: URBEMIS2007 for Windows (JSA, 2007).
Vehicle Emissions
VOC CO NOx SOx PM10 PM2.5 Pb CO2 CH4 VOC CO NOx SOx PM10 PM2.5 Pb CO2 CH4
Onsite Emissions for Year 2016 c
Crew Vans d 0.001 0.015 0.001 0.00003 0.0004 0.0002 0.000001 5.469 0.0002 0.0001 0.002 0.0002 0.000004 0.0001 0.00003 0.0000001 0.711 0.00002
Offsite Emissions for Year 2016 c
Travel Within the SCCAB
Removal Haul Truck Travel e 0.0003 0.002 0.014 0.00004 0.0004 0.0003 0.000001 3.523 0.00001 0.00004 0.0003 0.002 0.000005 0.0001 0.00004 0.0000002 0.458 0.000001
Backfill Haul Truck Travel e 0.0227 0.145 0.891 0.00240 0.0287 0.0187 0.000098 232.550 0.00074 0.00295 0.0188 0.116 0.000312 0.0037 0.00243 0.0000128 30.231 0.000096
Worker Commute f 0.0033 0.118 0.014 0.00038 0.0053 0.0022 0.000012 33.742 0.00200 0.00043 0.0154 0.002 0.000049 0.0007 0.00029 0.0000016 4.386 0.000260Total Offsite (Within the SCCAB) 0.0263 0.265 0.918 0.00281 0.0345 0.0212 0.000112 269.816 0.00276 0.00342 0.0345 0.119 0.000366 0.0045 0.00276 0.0000146 35.076 0.000358
Travel Within the SCAB
Removal Haul Truck Travel e 0.089 0.596 2.867 0.008 0.102 0.066 0.0003 818.743 0.0026 0.012 0.077 0.373 0.0011 0.013 0.009 0.00005 106.437 0.0003
Backfill Haul Truck Travel e 0.017 0.113 0.541 0.002 0.019 0.013 0.0001 154.612 0.0005 0.002 0.015 0.070 0.0002 0.003 0.002 0.00001 20.100 0.0001
Worker Commute f 0.025 1.062 0.108 0.004 0.055 0.023 0.0001 359.711 0.0209 0.003 0.138 0.014 0.0006 0.007 0.003 0.00002 46.762 0.0027Total Offsite (Within the SCAB) 0.130 1.770 3.517 0.014 0.177 0.102 0.0005 1,333.067 0.0240 0.017 0.230 0.457 0.0019 0.023 0.013 0.00007 173.299 0.0031
Travel Within the MDAB
Removal Haul Truck Travel e 0.113 0.777 2.775 0.011 0.143 0.092 0.0005 1,139.742 0.004 0.015 0.101 0.361 0.001 0.019 0.012 0.0001 148.166 0.0005Travel Within the SJVAB
Removal Haul Truck Travel e 0.073 0.491 2.276 0.008 0.093 0.061 0.0003 723.996 0.002 0.010 0.064 0.296 0.001 0.012 0.008 0.00004 94.119 0.0003Travel Within the GBVAB
Removal Haul Truck Travel e 0.034 0.229 0.967 0.004 0.045 0.029 0.0001 340.491 0.001 0.004 0.030 0.126 0.0005 0.006 0.004 0.00002 44.264 0.0001Travel Within Nevada
Removal Haul Truck Travel e 0.303 2.031 10.724 0.029 0.362 0.238 0.001 2,797.646 0.009 0.039 0.264 1.394 0.004 0.047 0.031 0.0002 363.694 0.001Travel Within Utah
Removal Haul Truck Travel e 0.041 0.276 1.459 0.004 0.049 0.032 0.0002 380.536 0.001 0.005 0.036 0.190 0.001 0.006 0.004 0.00002 49.470 0.0002
Onsite Emissions for Year 2017 c
Crew Vans d 0.001 0.013 0.001 0.00003 0.0004 0.0002 0.000001 5.471 0.0002 0.0001 0.002 0.0001 0.000004 0.0001 0.00003 0.0000001 0.711 0.00002
Construction ElementEmission Factors
Onsite Cut/Fill
Emissions (tons/year) bVehicle Type
Emissions (lbs/day) a
Earthmoving Fugitive Dust c
Construction Activity
MGM11‐SSFL/EIS_APPG/AppH_Attach1_121613.xlsxES09071117265MGM
Appendix H, NASA SSFL EIS for Proposed Demolition and Environmental Cleanup
H-29
ATTACHMENT 1‐5Excavation Emissions (High Soil Removal Estimate)
NASA SSFL EIS: Air Quality
Offsite Emissions for Year 2017 c
Travel Within the SCCAB
Removal Haul Truck Travel e 0.0003 0.002 0.012 0.00004 0.0004 0.0003 0.000001 3.517 0.00001 0.00004 0.0003 0.002 0.000005 0.0001 0.00003 0.0000002 0.457 0.000001
Backfill Haul Truck Travel e 0.0210 0.137 0.789 0.00239 0.0268 0.0169 0.000098 232.143 0.00074 0.00273 0.0179 0.103 0.000311 0.0035 0.00220 0.0000128 30.179 0.000096
Worker Commute f 0.0026 0.103 0.012 0.00038 0.0053 0.0022 0.000012 33.753 0.00200 0.00034 0.0134 0.002 0.000049 0.0007 0.00029 0.0000016 4.388 0.000260Total Offsite (Within the SCCAB) 0.0240 0.242 0.813 0.00281 0.0325 0.0194 0.000112 269.413 0.00276 0.00311 0.0315 0.106 0.000365 0.0042 0.00252 0.0000146 35.024 0.000358
Travel Within the SCAB
Removal Haul Truck Travel e 0.087 0.589 2.610 0.008 0.098 0.063 0.0003 817.477 0.0026 0.011 0.077 0.339 0.0011 0.013 0.008 0.00005 106.272 0.0003
Backfill Haul Truck Travel e 0.016 0.111 0.493 0.002 0.018 0.012 0.0001 154.373 0.0005 0.002 0.014 0.064 0.0002 0.002 0.002 0.00001 20.069 0.0001
Worker Commute f 0.020 0.944 0.097 0.004 0.055 0.023 0.0001 359.878 0.0209 0.003 0.123 0.013 0.0006 0.007 0.003 0.00002 46.784 0.0027Total Offsite (Within the SCAB) 0.123 1.644 3.200 0.014 0.172 0.097 0.0005 1,331.728 0.0240 0.016 0.214 0.416 0.0019 0.022 0.013 0.00007 173.125 0.0031
Travel Within the MDAB
Removal Haul Truck Travel e 0.106 0.739 2.373 0.011 0.135 0.085 0.0005 1,137.336 0.004 0.014 0.096 0.309 0.001 0.018 0.011 0.0001 147.854 0.0005Travel Within the SJVAB
Removal Haul Truck Travel e 0.069 0.468 1.973 0.008 0.087 0.055 0.0003 722.501 0.002 0.009 0.061 0.256 0.001 0.011 0.007 0.00004 93.925 0.0003Travel Within the GBVAB
Removal Haul Truck Travel e 0.032 0.216 0.840 0.004 0.042 0.027 0.0001 339.798 0.001 0.004 0.028 0.109 0.0005 0.005 0.003 0.00002 44.174 0.0001Travel Within Nevada
Removal Haul Truck Travel e 0.295 2.005 9.487 0.029 0.340 0.218 0.001 2,792.748 0.009 0.038 0.261 1.233 0.004 0.044 0.028 0.0002 363.057 0.001Travel Within Utah
Removal Haul Truck Travel e 0.040 0.273 1.290 0.004 0.046 0.030 0.0002 379.870 0.001 0.005 0.035 0.168 0.001 0.006 0.004 0.00002 49.383 0.0002Notes:a Daily Emissions (lbs/day) = Quantity of Vehicles x Daily VMT (miles/day) x Emission Factor (g/mile) / 453.6 (g/lb).b Annual emissions were estimated assuming activities occur: 260 days per yearc Onsite emissions all occur within the SCCAB; offsite emissions were distributed amongst the air basins based on the haul routes for each vehicle, as presented in Attachment 1‐9.d Assumed crew members were transported around the site using one crew van; the emissions for Crew Vans were estimated using emission factors for 'Passenger Vehicles'.e Emissions for Haul Trucks were estimated using emission factors for 'Heavy‐Heavy Duty Trucks'. The daily and annual emissions will be multiplied by the quantity of vehicles in Attachment 1‐2.f Assumed workers live in Ventura County and Los Angeles County as listed below. It was also assumed workers commute in passenger vehicles.
Ventura County 50%Los Angeles County 50%
Vehicle Emission Factors
VOC CO NOx SOx PM10 b PM2.5
bPb c CO2 CH4
d
2016 Onsite Emission Factors (15 mph)SCCAB Emission Factors
Passenger Vehicles e 0.075 1.661 0.139 0.003 0.049 0.022 0.0001 620.233 0.017
Heavy‐Heavy Duty Trucks f 0.843 2.123 10.848 0.016 0.218 0.148 0.001 2,702.921 0.0052016 Offsite Emission Factors (55 mph)SCCAB Emission Factors
Passenger Vehicles e 0.029 1.022 0.118 0.003 0.046 0.019 0.0001 291.533 0.017
Heavy‐Heavy Duty Trucks f 0.156 0.995 6.126 0.016 0.197 0.129 0.001 1,598.252 0.005SCAB Emission Factors
Passenger Vehicles e 0.020 0.880 0.089 0.004 0.046 0.019 0.0001 298.018 0.017
Heavy‐Heavy Duty Trucks f 0.173 1.160 5.582 0.017 0.198 0.129 0.001 1,593.914 0.005MDAB Emission Factors
Heavy‐Heavy Duty Trucks f 0.156 1.072 3.830 0.016 0.197 0.127 0.001 1,573.301 0.005SJVAB Emission Factors
Heavy‐Heavy Duty Trucks f 0.160 1.071 4.963 0.017 0.203 0.133 0.001 1,578.868 0.005
Vehicle TypeEmission Factors (g/mile) a
MGM11‐SSFL/EIS_APPG/AppH_Attach1_121613.xlsxES09071117265MGM
Appendix H, NASA SSFL EIS for Proposed Demolition and Environmental Cleanup
H-30

ATTACHMENT 1‐5Excavation Emissions (High Soil Removal Estimate)
NASA SSFL EIS: Air Quality
GBVAB Emission Factors
Heavy‐Heavy Duty Trucks f 0.159 1.060 4.477 0.017 0.207 0.136 0.001 1,575.989 0.005Nevada Emission Factors
Heavy‐Heavy Duty Trucks g 0.173 1.160 6.126 0.017 0.207 0.136 0.001 1,598.252 0.005Utah Emission Factors
Heavy‐Heavy Duty Trucks g 0.173 1.160 6.126 0.017 0.207 0.136 0.001 1,598.252 0.0052017 Onsite Emission Factors (15 mph)SCCAB Emission Factors
Passenger Vehicles e 0.061 1.464 0.126 0.003 0.049 0.022 0.0001 620.453 0.017
Heavy‐Heavy Duty Trucks f 0.776 1.933 9.706 0.016 0.189 0.122 0.001 2,698.156 0.0052017 Offsite Emission Factors (55 mph)SCCAB Emission Factors
Passenger Vehicles e 0.023 0.890 0.104 0.003 0.046 0.019 0.0001 291.623 0.017
Heavy‐Heavy Duty Trucks f 0.144 0.944 5.420 0.016 0.184 0.116 0.001 1,595.454 0.005SCAB Emission Factors
Passenger Vehicles e 0.017 0.782 0.080 0.004 0.046 0.019 0.0001 298.156 0.017
Heavy‐Heavy Duty Trucks f 0.169 1.146 5.082 0.016 0.191 0.122 0.001 1,591.449 0.005MDAB Emission Factors
Heavy‐Heavy Duty Trucks f 0.147 1.020 3.276 0.016 0.186 0.117 0.001 1,569.980 0.005SJVAB Emission Factors
Heavy‐Heavy Duty Trucks f 0.150 1.021 4.302 0.016 0.190 0.121 0.001 1,575.607 0.005GBVAB Emission Factors
Heavy‐Heavy Duty Trucks f 0.148 1.001 3.886 0.016 0.194 0.125 0.001 1,572.781 0.005Nevada Emission Factors
Heavy‐Heavy Duty Trucks g 0.169 1.146 5.420 0.016 0.194 0.125 0.001 1,595.454 0.005Utah Emission Factors
Heavy‐Heavy Duty Trucks g 0.169 1.146 5.420 0.016 0.194 0.125 0.001 1,595.454 0.005Notes:a Unless otherwise noted, emission factors are from EMFAC2011‐PL for each air basin.b PM10 and PM2.5 emission factors account for particulate emissions from running exhaust, tire wear, and break wear.
0.0083 lbs/1,000 gallons
d CH4 emission factors taken from Table 13‐5 of the General Reporting Protocol (Version 2.0) for the most recent model year available (TCR, 2013).e Per Table 4‐23 of the National Transportation Statistics 2013 (BTS, 2013), assumed a passenger fuel economy of: 35.6 miles per gallon
5.569 miles per gallon
g As a conservative estimate, the maximum California emission factors were assumed representative of Nevada and Utah.
c A lead emission factor for stationary and portable internal combustion engines was assumed representative of on‐road vehicles. This factor was obtained from Table B‐2 of the Supplemental Instructions: Reporting Procedures for AB2588 Facilities for Reporting their Quadrennial Air Toxics Emissions Inventory (SCAQMD, 2010). Due to limited available data, this emission factor was assumed equal for all air basins, all vehicle speeds, and all construction years:
f As calculated using the EMFAC2011 Web Based Emissions Database for California (which was assumed to be representative of Nevada and Utah), the heavy‐heavy duty truck (diesel) fuel economy is:
MGM11‐SSFL/EIS_APPG/AppH_Attach1_121613.xlsxES09071117265MGM
Appendix H, NASA SSFL EIS for Proposed Demolition and Environmental Cleanup
H-31
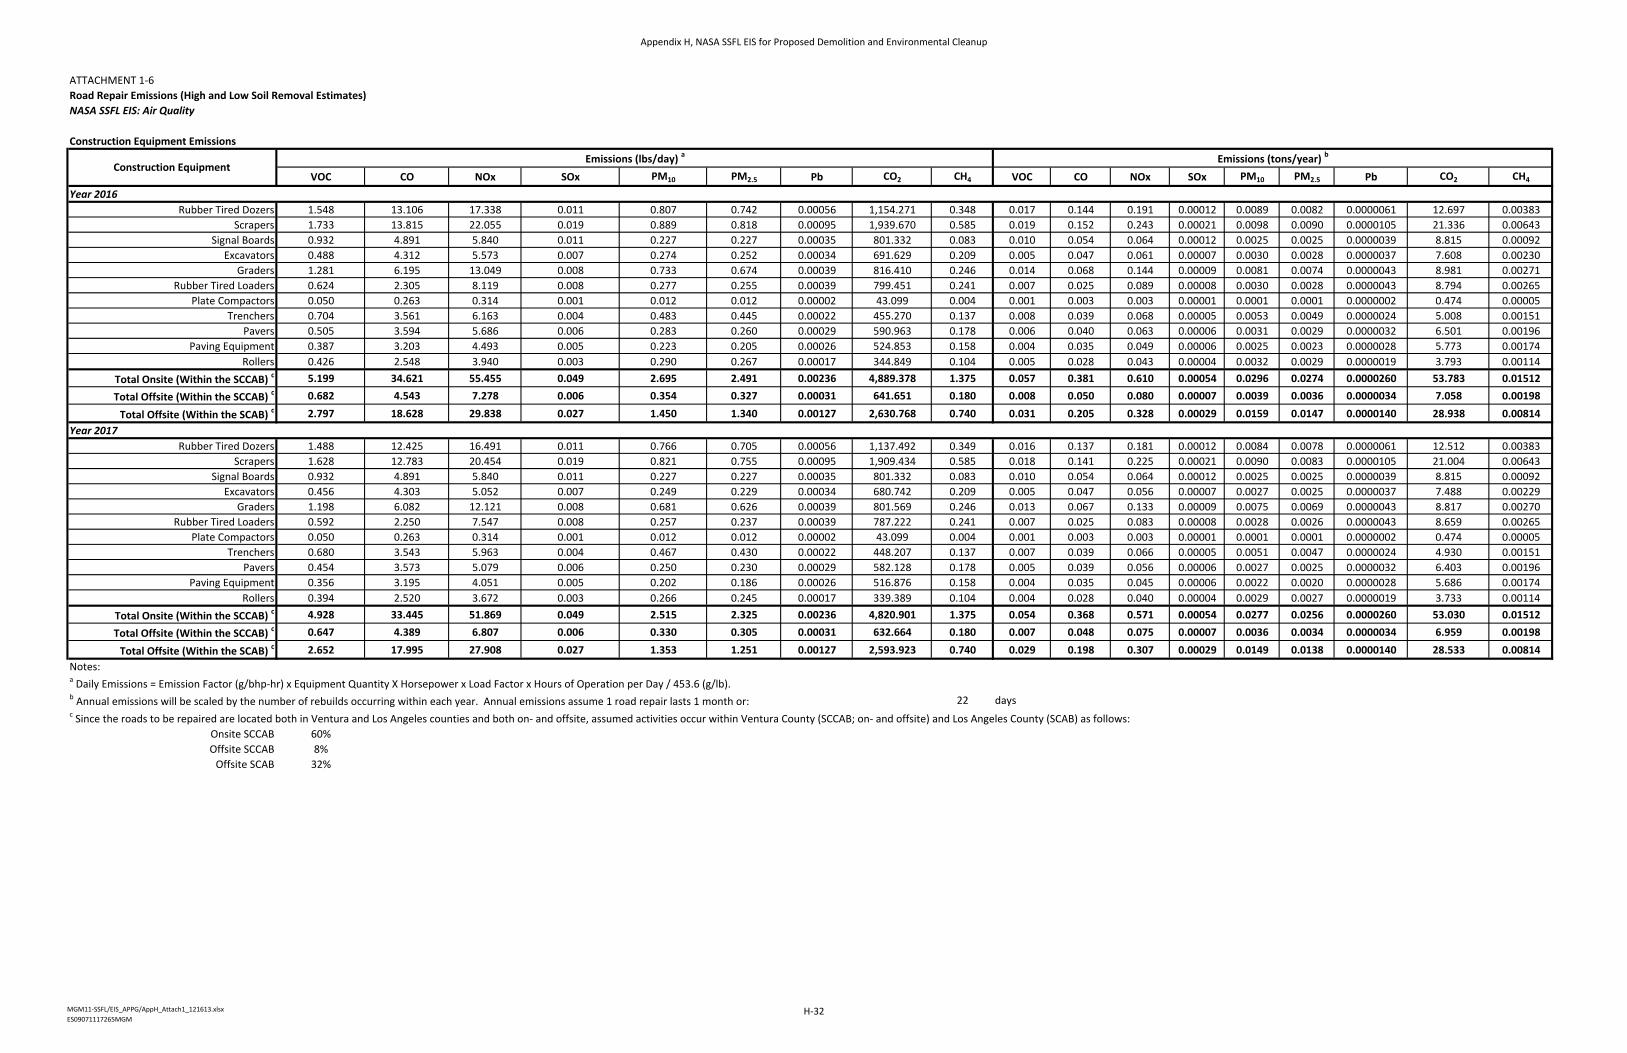
ATTACHMENT 1‐6Road Repair Emissions (High and Low Soil Removal Estimates)
NASA SSFL EIS: Air Quality
Construction Equipment Emissions
VOC CO NOx SOx PM10 PM2.5 Pb CO2 CH4 VOC CO NOx SOx PM10 PM2.5 Pb CO2 CH4
Year 2016Rubber Tired Dozers 1.548 13.106 17.338 0.011 0.807 0.742 0.00056 1,154.271 0.348 0.017 0.144 0.191 0.00012 0.0089 0.0082 0.0000061 12.697 0.00383
Scrapers 1.733 13.815 22.055 0.019 0.889 0.818 0.00095 1,939.670 0.585 0.019 0.152 0.243 0.00021 0.0098 0.0090 0.0000105 21.336 0.00643Signal Boards 0.932 4.891 5.840 0.011 0.227 0.227 0.00035 801.332 0.083 0.010 0.054 0.064 0.00012 0.0025 0.0025 0.0000039 8.815 0.00092
Excavators 0.488 4.312 5.573 0.007 0.274 0.252 0.00034 691.629 0.209 0.005 0.047 0.061 0.00007 0.0030 0.0028 0.0000037 7.608 0.00230Graders 1.281 6.195 13.049 0.008 0.733 0.674 0.00039 816.410 0.246 0.014 0.068 0.144 0.00009 0.0081 0.0074 0.0000043 8.981 0.00271
Rubber Tired Loaders 0.624 2.305 8.119 0.008 0.277 0.255 0.00039 799.451 0.241 0.007 0.025 0.089 0.00008 0.0030 0.0028 0.0000043 8.794 0.00265Plate Compactors 0.050 0.263 0.314 0.001 0.012 0.012 0.00002 43.099 0.004 0.001 0.003 0.003 0.00001 0.0001 0.0001 0.0000002 0.474 0.00005
Trenchers 0.704 3.561 6.163 0.004 0.483 0.445 0.00022 455.270 0.137 0.008 0.039 0.068 0.00005 0.0053 0.0049 0.0000024 5.008 0.00151Pavers 0.505 3.594 5.686 0.006 0.283 0.260 0.00029 590.963 0.178 0.006 0.040 0.063 0.00006 0.0031 0.0029 0.0000032 6.501 0.00196
Paving Equipment 0.387 3.203 4.493 0.005 0.223 0.205 0.00026 524.853 0.158 0.004 0.035 0.049 0.00006 0.0025 0.0023 0.0000028 5.773 0.00174Rollers 0.426 2.548 3.940 0.003 0.290 0.267 0.00017 344.849 0.104 0.005 0.028 0.043 0.00004 0.0032 0.0029 0.0000019 3.793 0.00114
Total Onsite (Within the SCCAB) c 5.199 34.621 55.455 0.049 2.695 2.491 0.00236 4,889.378 1.375 0.057 0.381 0.610 0.00054 0.0296 0.0274 0.0000260 53.783 0.01512
Total Offsite (Within the SCCAB) c 0.682 4.543 7.278 0.006 0.354 0.327 0.00031 641.651 0.180 0.008 0.050 0.080 0.00007 0.0039 0.0036 0.0000034 7.058 0.00198
Total Offsite (Within the SCAB) c 2.797 18.628 29.838 0.027 1.450 1.340 0.00127 2,630.768 0.740 0.031 0.205 0.328 0.00029 0.0159 0.0147 0.0000140 28.938 0.00814
Year 2017Rubber Tired Dozers 1.488 12.425 16.491 0.011 0.766 0.705 0.00056 1,137.492 0.349 0.016 0.137 0.181 0.00012 0.0084 0.0078 0.0000061 12.512 0.00383
Scrapers 1.628 12.783 20.454 0.019 0.821 0.755 0.00095 1,909.434 0.585 0.018 0.141 0.225 0.00021 0.0090 0.0083 0.0000105 21.004 0.00643Signal Boards 0.932 4.891 5.840 0.011 0.227 0.227 0.00035 801.332 0.083 0.010 0.054 0.064 0.00012 0.0025 0.0025 0.0000039 8.815 0.00092
Excavators 0.456 4.303 5.052 0.007 0.249 0.229 0.00034 680.742 0.209 0.005 0.047 0.056 0.00007 0.0027 0.0025 0.0000037 7.488 0.00229Graders 1.198 6.082 12.121 0.008 0.681 0.626 0.00039 801.569 0.246 0.013 0.067 0.133 0.00009 0.0075 0.0069 0.0000043 8.817 0.00270
Rubber Tired Loaders 0.592 2.250 7.547 0.008 0.257 0.237 0.00039 787.222 0.241 0.007 0.025 0.083 0.00008 0.0028 0.0026 0.0000043 8.659 0.00265Plate Compactors 0.050 0.263 0.314 0.001 0.012 0.012 0.00002 43.099 0.004 0.001 0.003 0.003 0.00001 0.0001 0.0001 0.0000002 0.474 0.00005
Trenchers 0.680 3.543 5.963 0.004 0.467 0.430 0.00022 448.207 0.137 0.007 0.039 0.066 0.00005 0.0051 0.0047 0.0000024 4.930 0.00151Pavers 0.454 3.573 5.079 0.006 0.250 0.230 0.00029 582.128 0.178 0.005 0.039 0.056 0.00006 0.0027 0.0025 0.0000032 6.403 0.00196
Paving Equipment 0.356 3.195 4.051 0.005 0.202 0.186 0.00026 516.876 0.158 0.004 0.035 0.045 0.00006 0.0022 0.0020 0.0000028 5.686 0.00174Rollers 0.394 2.520 3.672 0.003 0.266 0.245 0.00017 339.389 0.104 0.004 0.028 0.040 0.00004 0.0029 0.0027 0.0000019 3.733 0.00114
Total Onsite (Within the SCCAB) c 4.928 33.445 51.869 0.049 2.515 2.325 0.00236 4,820.901 1.375 0.054 0.368 0.571 0.00054 0.0277 0.0256 0.0000260 53.030 0.01512
Total Offsite (Within the SCCAB) c 0.647 4.389 6.807 0.006 0.330 0.305 0.00031 632.664 0.180 0.007 0.048 0.075 0.00007 0.0036 0.0034 0.0000034 6.959 0.00198
Total Offsite (Within the SCAB) c 2.652 17.995 27.908 0.027 1.353 1.251 0.00127 2,593.923 0.740 0.029 0.198 0.307 0.00029 0.0149 0.0138 0.0000140 28.533 0.00814
Notes:a Daily Emissions = Emission Factor (g/bhp‐hr) x Equipment Quantity X Horsepower x Load Factor x Hours of Operation per Day / 453.6 (g/lb).b Annual emissions will be scaled by the number of rebuilds occurring within each year. Annual emissions assume 1 road repair lasts 1 month or: 22 daysc Since the roads to be repaired are located both in Ventura and Los Angeles counties and both on‐ and offsite, assumed activities occur within Ventura County (SCCAB; on‐ and offsite) and Los Angeles County (SCAB) as follows:
Onsite SCCAB 60%Offsite SCCAB 8%
Offsite SCAB 32%
Construction EquipmentEmissions (lbs/day) a Emissions (tons/year) b
MGM11‐SSFL/EIS_APPG/AppH_Attach1_121613.xlsxES09071117265MGM
Appendix H, NASA SSFL EIS for Proposed Demolition and Environmental Cleanup
H-32
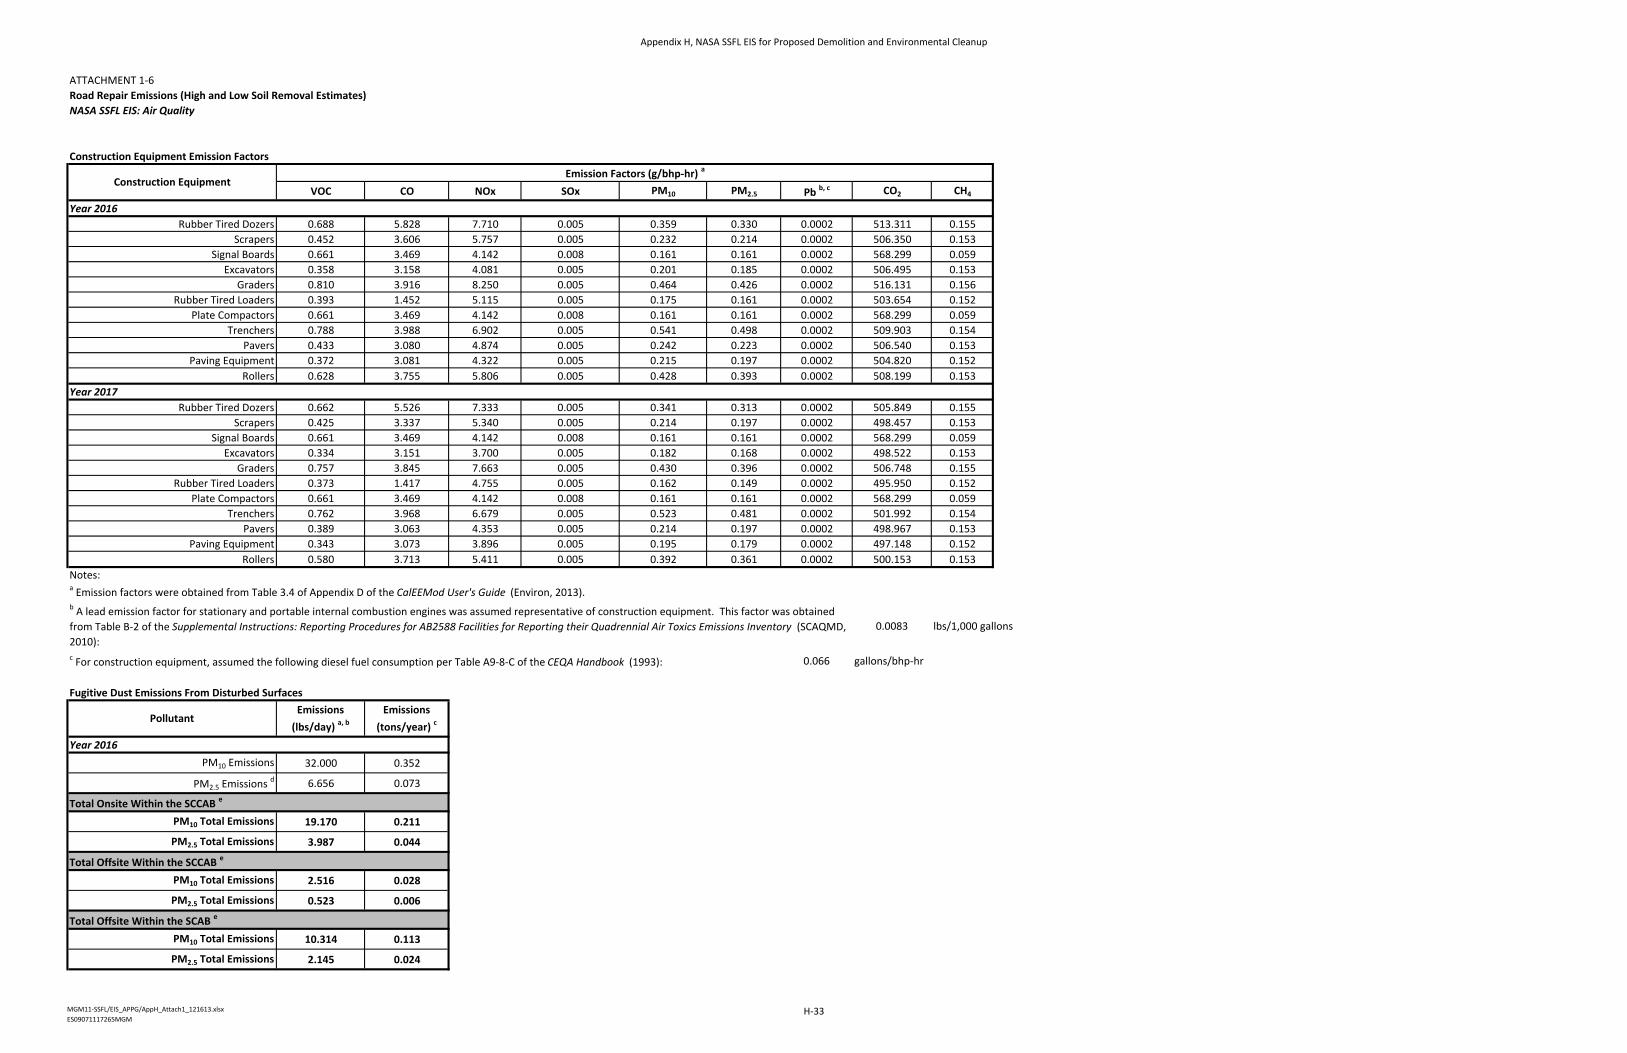
ATTACHMENT 1‐6Road Repair Emissions (High and Low Soil Removal Estimates)
NASA SSFL EIS: Air Quality
Construction Equipment Emission Factors
VOC CO NOx SOx PM10 PM2.5 Pb b, c CO2 CH4
Year 2016Rubber Tired Dozers 0.688 5.828 7.710 0.005 0.359 0.330 0.0002 513.311 0.155
Scrapers 0.452 3.606 5.757 0.005 0.232 0.214 0.0002 506.350 0.153Signal Boards 0.661 3.469 4.142 0.008 0.161 0.161 0.0002 568.299 0.059
Excavators 0.358 3.158 4.081 0.005 0.201 0.185 0.0002 506.495 0.153Graders 0.810 3.916 8.250 0.005 0.464 0.426 0.0002 516.131 0.156
Rubber Tired Loaders 0.393 1.452 5.115 0.005 0.175 0.161 0.0002 503.654 0.152Plate Compactors 0.661 3.469 4.142 0.008 0.161 0.161 0.0002 568.299 0.059
Trenchers 0.788 3.988 6.902 0.005 0.541 0.498 0.0002 509.903 0.154Pavers 0.433 3.080 4.874 0.005 0.242 0.223 0.0002 506.540 0.153
Paving Equipment 0.372 3.081 4.322 0.005 0.215 0.197 0.0002 504.820 0.152Rollers 0.628 3.755 5.806 0.005 0.428 0.393 0.0002 508.199 0.153
Year 2017Rubber Tired Dozers 0.662 5.526 7.333 0.005 0.341 0.313 0.0002 505.849 0.155
Scrapers 0.425 3.337 5.340 0.005 0.214 0.197 0.0002 498.457 0.153Signal Boards 0.661 3.469 4.142 0.008 0.161 0.161 0.0002 568.299 0.059
Excavators 0.334 3.151 3.700 0.005 0.182 0.168 0.0002 498.522 0.153Graders 0.757 3.845 7.663 0.005 0.430 0.396 0.0002 506.748 0.155
Rubber Tired Loaders 0.373 1.417 4.755 0.005 0.162 0.149 0.0002 495.950 0.152Plate Compactors 0.661 3.469 4.142 0.008 0.161 0.161 0.0002 568.299 0.059
Trenchers 0.762 3.968 6.679 0.005 0.523 0.481 0.0002 501.992 0.154Pavers 0.389 3.063 4.353 0.005 0.214 0.197 0.0002 498.967 0.153
Paving Equipment 0.343 3.073 3.896 0.005 0.195 0.179 0.0002 497.148 0.152Rollers 0.580 3.713 5.411 0.005 0.392 0.361 0.0002 500.153 0.153
Notes:a Emission factors were obtained from Table 3.4 of Appendix D of the CalEEMod User's Guide (Environ, 2013).
0.0083 lbs/1,000 gallons
c For construction equipment, assumed the following diesel fuel consumption per Table A9‐8‐C of the CEQA Handbook (1993): 0.066 gallons/bhp‐hr
Fugitive Dust Emissions From Disturbed Surfaces
Year 2016PM10 Emissions 32.000 0.352
PM2.5 Emissions d 6.656 0.073
Total Onsite Within the SCCAB e
PM10 Total Emissions 19.170 0.211
PM2.5 Total Emissions 3.987 0.044
Total Offsite Within the SCCAB e
PM10 Total Emissions 2.516 0.028
PM2.5 Total Emissions 0.523 0.006
Total Offsite Within the SCAB e
PM10 Total Emissions 10.314 0.113
PM2.5 Total Emissions 2.145 0.024
b A lead emission factor for stationary and portable internal combustion engines was assumed representative of construction equipment. This factor was obtained from Table B‐2 of the Supplemental Instructions: Reporting Procedures for AB2588 Facilities for Reporting their Quadrennial Air Toxics Emissions Inventory (SCAQMD, 2010):
Construction EquipmentEmission Factors (g/bhp‐hr) a
PollutantEmissions
(lbs/day) a, bEmissions
(tons/year) c
MGM11‐SSFL/EIS_APPG/AppH_Attach1_121613.xlsxES09071117265MGM
Appendix H, NASA SSFL EIS for Proposed Demolition and Environmental Cleanup
H-33
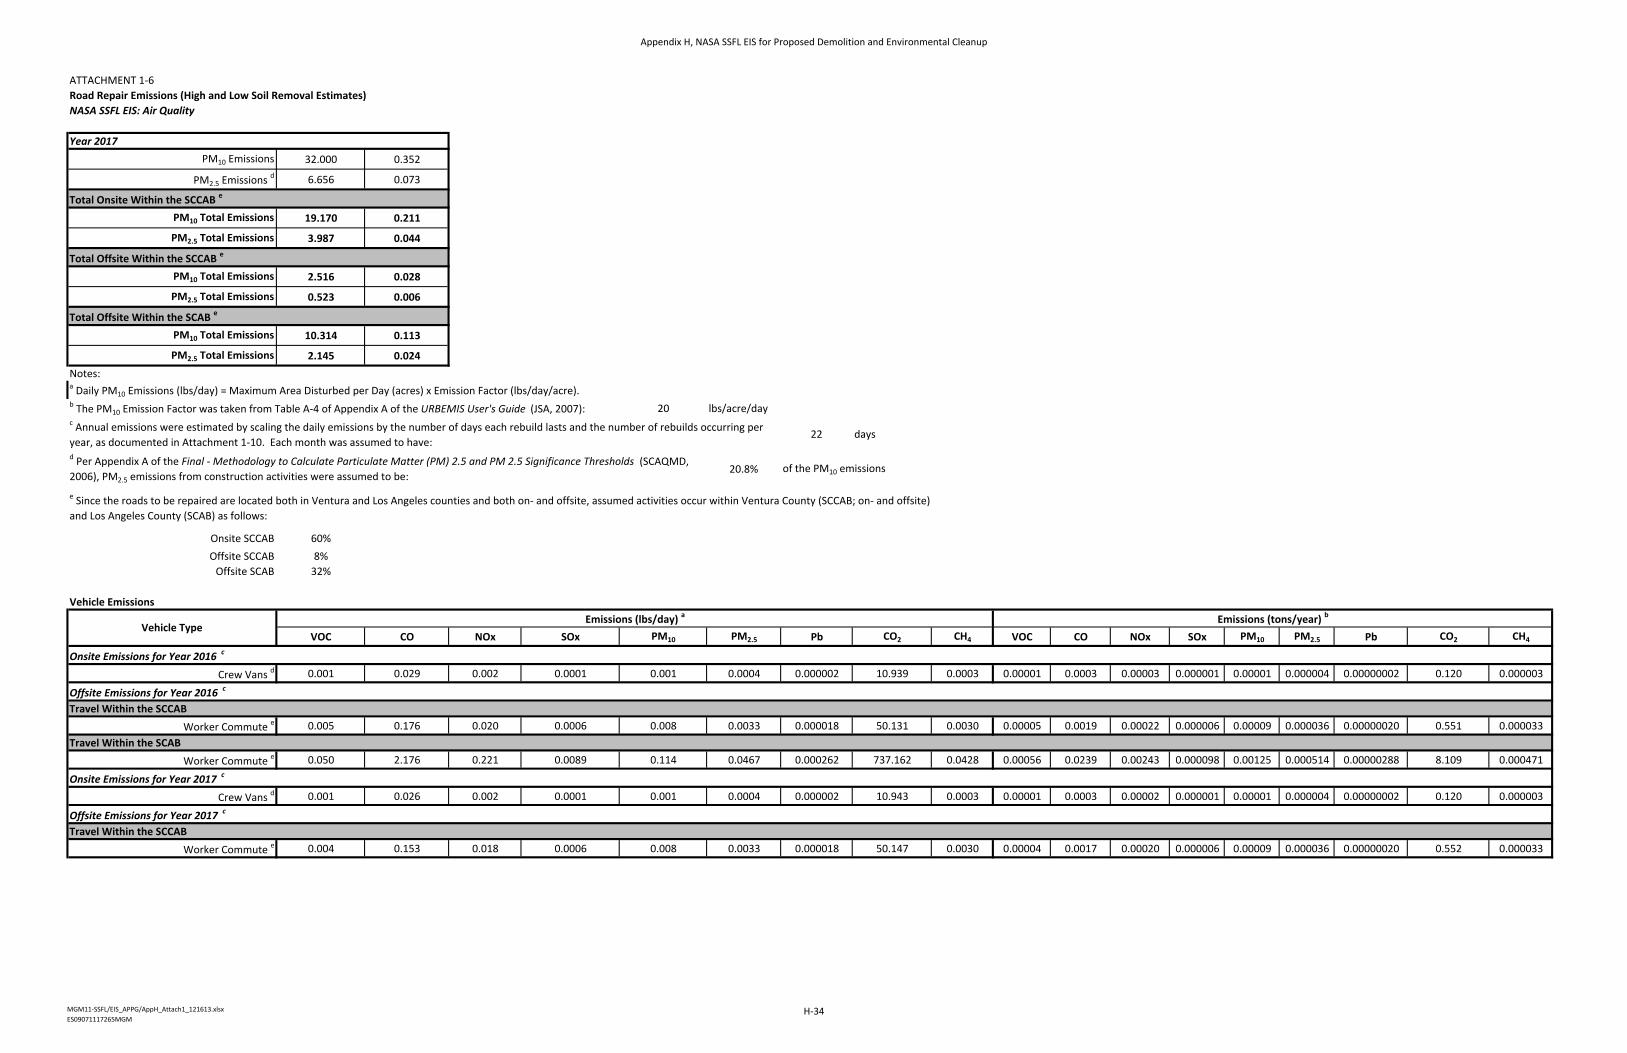
ATTACHMENT 1‐6Road Repair Emissions (High and Low Soil Removal Estimates)
NASA SSFL EIS: Air Quality
Year 2017PM10 Emissions 32.000 0.352
PM2.5 Emissions d 6.656 0.073
Total Onsite Within the SCCAB e
PM10 Total Emissions 19.170 0.211
PM2.5 Total Emissions 3.987 0.044
Total Offsite Within the SCCAB e
PM10 Total Emissions 2.516 0.028
PM2.5 Total Emissions 0.523 0.006
Total Offsite Within the SCAB e
PM10 Total Emissions 10.314 0.113
PM2.5 Total Emissions 2.145 0.024
Notes:a Daily PM10 Emissions (lbs/day) = Maximum Area Disturbed per Day (acres) x Emission Factor (lbs/day/acre).b The PM10 Emission Factor was taken from Table A‐4 of Appendix A of the URBEMIS User's Guide (JSA, 2007): 20 lbs/acre/day
22 days
20.8% of the PM10 emissions
Onsite SCCAB 60%Offsite SCCAB 8%
Offsite SCAB 32%
Vehicle Emissions
VOC CO NOx SOx PM10 PM2.5 Pb CO2 CH4 VOC CO NOx SOx PM10 PM2.5 Pb CO2 CH4
Onsite Emissions for Year 2016 c
Crew Vans d 0.001 0.029 0.002 0.0001 0.001 0.0004 0.000002 10.939 0.0003 0.00001 0.0003 0.00003 0.000001 0.00001 0.000004 0.00000002 0.120 0.000003
Offsite Emissions for Year 2016 c
Travel Within the SCCAB
Worker Commute e 0.005 0.176 0.020 0.0006 0.008 0.0033 0.000018 50.131 0.0030 0.00005 0.0019 0.00022 0.000006 0.00009 0.000036 0.00000020 0.551 0.000033Travel Within the SCAB
Worker Commute e 0.050 2.176 0.221 0.0089 0.114 0.0467 0.000262 737.162 0.0428 0.00056 0.0239 0.00243 0.000098 0.00125 0.000514 0.00000288 8.109 0.000471
Onsite Emissions for Year 2017 c
Crew Vans d 0.001 0.026 0.002 0.0001 0.001 0.0004 0.000002 10.943 0.0003 0.00001 0.0003 0.00002 0.000001 0.00001 0.000004 0.00000002 0.120 0.000003
Offsite Emissions for Year 2017 c
Travel Within the SCCAB
Worker Commute e 0.004 0.153 0.018 0.0006 0.008 0.0033 0.000018 50.147 0.0030 0.00004 0.0017 0.00020 0.000006 0.00009 0.000036 0.00000020 0.552 0.000033
c Annual emissions were estimated by scaling the daily emissions by the number of days each rebuild lasts and the number of rebuilds occurring per year, as documented in Attachment 1‐10. Each month was assumed to have:d Per Appendix A of the Final ‐ Methodology to Calculate Particulate Matter (PM) 2.5 and PM 2.5 Significance Thresholds (SCAQMD, 2006), PM2.5 emissions from construction activities were assumed to be:
Emissions (tons/year) b
e Since the roads to be repaired are located both in Ventura and Los Angeles counties and both on‐ and offsite, assumed activities occur within Ventura County (SCCAB; on‐ and offsite) and Los Angeles County (SCAB) as follows:
Vehicle TypeEmissions (lbs/day) a
MGM11‐SSFL/EIS_APPG/AppH_Attach1_121613.xlsxES09071117265MGM
Appendix H, NASA SSFL EIS for Proposed Demolition and Environmental Cleanup
H-34
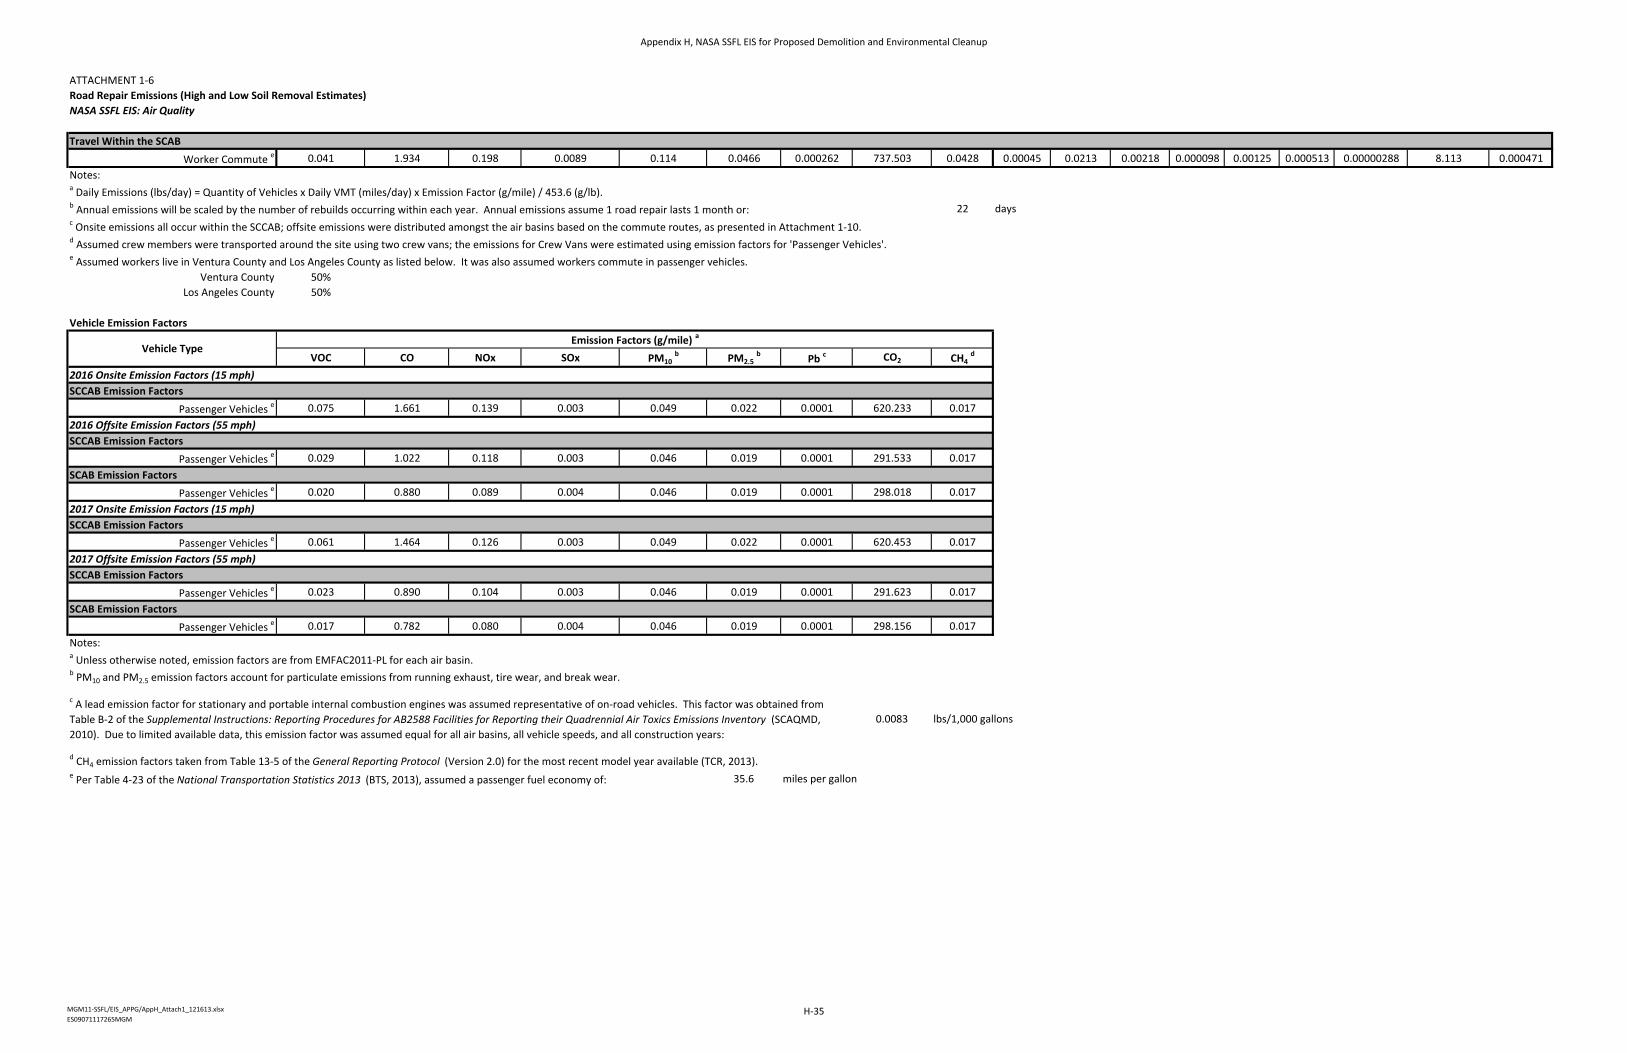
ATTACHMENT 1‐6Road Repair Emissions (High and Low Soil Removal Estimates)
NASA SSFL EIS: Air Quality
Travel Within the SCAB
Worker Commute e 0.041 1.934 0.198 0.0089 0.114 0.0466 0.000262 737.503 0.0428 0.00045 0.0213 0.00218 0.000098 0.00125 0.000513 0.00000288 8.113 0.000471Notes:a Daily Emissions (lbs/day) = Quantity of Vehicles x Daily VMT (miles/day) x Emission Factor (g/mile) / 453.6 (g/lb).b Annual emissions will be scaled by the number of rebuilds occurring within each year. Annual emissions assume 1 road repair lasts 1 month or: 22 daysc Onsite emissions all occur within the SCCAB; offsite emissions were distributed amongst the air basins based on the commute routes, as presented in Attachment 1‐10.d Assumed crew members were transported around the site using two crew vans; the emissions for Crew Vans were estimated using emission factors for 'Passenger Vehicles'.e Assumed workers live in Ventura County and Los Angeles County as listed below. It was also assumed workers commute in passenger vehicles.
Ventura County 50%Los Angeles County 50%
Vehicle Emission Factors
VOC CO NOx SOx PM10 b PM2.5
bPb c CO2 CH4
d
2016 Onsite Emission Factors (15 mph)SCCAB Emission Factors
Passenger Vehicles e 0.075 1.661 0.139 0.003 0.049 0.022 0.0001 620.233 0.0172016 Offsite Emission Factors (55 mph)SCCAB Emission Factors
Passenger Vehicles e 0.029 1.022 0.118 0.003 0.046 0.019 0.0001 291.533 0.017SCAB Emission Factors
Passenger Vehicles e 0.020 0.880 0.089 0.004 0.046 0.019 0.0001 298.018 0.0172017 Onsite Emission Factors (15 mph)SCCAB Emission Factors
Passenger Vehicles e 0.061 1.464 0.126 0.003 0.049 0.022 0.0001 620.453 0.0172017 Offsite Emission Factors (55 mph)SCCAB Emission Factors
Passenger Vehicles e 0.023 0.890 0.104 0.003 0.046 0.019 0.0001 291.623 0.017SCAB Emission Factors
Passenger Vehicles e 0.017 0.782 0.080 0.004 0.046 0.019 0.0001 298.156 0.017Notes:a Unless otherwise noted, emission factors are from EMFAC2011‐PL for each air basin.b PM10 and PM2.5 emission factors account for particulate emissions from running exhaust, tire wear, and break wear.
0.0083 lbs/1,000 gallons
d CH4 emission factors taken from Table 13‐5 of the General Reporting Protocol (Version 2.0) for the most recent model year available (TCR, 2013).e Per Table 4‐23 of the National Transportation Statistics 2013 (BTS, 2013), assumed a passenger fuel economy of: 35.6 miles per gallon
Vehicle TypeEmission Factors (g/mile) a
c A lead emission factor for stationary and portable internal combustion engines was assumed representative of on‐road vehicles. This factor was obtained from Table B‐2 of the Supplemental Instructions: Reporting Procedures for AB2588 Facilities for Reporting their Quadrennial Air Toxics Emissions Inventory (SCAQMD, 2010). Due to limited available data, this emission factor was assumed equal for all air basins, all vehicle speeds, and all construction years:
MGM11‐SSFL/EIS_APPG/AppH_Attach1_121613.xlsxES09071117265MGM
Appendix H, NASA SSFL EIS for Proposed Demolition and Environmental Cleanup
H-35

This page intentionally left blank.
Appendix H, NASA SSFL EIS for Proposed Demolition and Environmental Cleanup
H-36
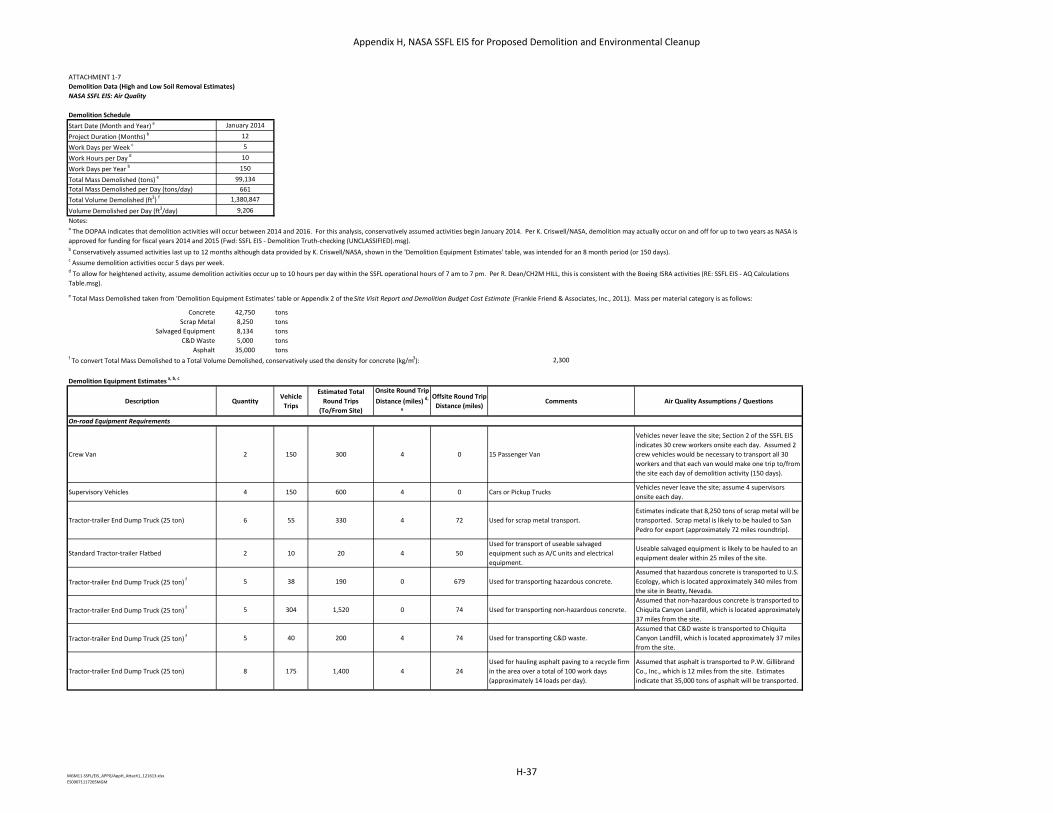
ATTACHMENT 1‐7Demolition Data (High and Low Soil Removal Estimates)
NASA SSFL EIS: Air Quality
Demolition Schedule
Start Date (Month and Year) a January 2014
Project Duration (Months) b 12
Work Days per Week c 5
Work Hours per Day d 10
Work Days per Year b 150
Total Mass Demolished (tons) e 99,134Total Mass Demolished per Day (tons/day) 661Total Volume Demolished (ft3) f 1,380,847
Volume Demolished per Day (ft3/day) 9,206Notes:
b Conservatively assumed activities last up to 12 months although data provided by K. Criswell/NASA, shown in the 'Demolition Equipment Estimates' table, was intended for an 8 month period (or 150 days).c Assume demolition activities occur 5 days per week.
Concrete 42,750 tonsScrap Metal 8,250 tons
Salvaged Equipment 8,134 tonsC&D Waste 5,000 tons
Asphalt 35,000 tonsf To convert Total Mass Demolished to a Total Volume Demolished, conservatively used the density for concrete (kg/m3): 2,300
Demolition Equipment Estimates a, b, c
Description QuantityVehicle
Trips
Estimated Total
Round Trips
(To/From Site)
Onsite Round Trip
Distance (miles) d,
e
Offsite Round Trip
Distance (miles)Comments Air Quality Assumptions / Questions
On‐road Equipment Requirements
Crew Van 2 150 300 4 0 15 Passenger Van
Vehicles never leave the site; Section 2 of the SSFL EIS indicates 30 crew workers onsite each day. Assumed 2 crew vehicles would be necessary to transport all 30 workers and that each van would make one trip to/from the site each day of demolition activity (150 days).
Supervisory Vehicles 4 150 600 4 0 Cars or Pickup TrucksVehicles never leave the site; assume 4 supervisors onsite each day.
Tractor‐trailer End Dump Truck (25 ton) 6 55 330 4 72 Used for scrap metal transport.Estimates indicate that 8,250 tons of scrap metal will be transported. Scrap metal is likely to be hauled to San Pedro for export (approximately 72 miles roundtrip).
Standard Tractor‐trailer Flatbed 2 10 20 4 50Used for transport of useable salvaged equipment such as A/C units and electrical equipment.
Useable salvaged equipment is likely to be hauled to an equipment dealer within 25 miles of the site.
Tractor‐trailer End Dump Truck (25 ton) f 5 38 190 0 679 Used for transporting hazardous concrete.Assumed that hazardous concrete is transported to U.S. Ecology, which is located approximately 340 miles from the site in Beatty, Nevada.
Tractor‐trailer End Dump Truck (25 ton) f 5 304 1,520 0 74 Used for transporting non‐hazardous concrete.Assumed that non‐hazardous concrete is transported to Chiquita Canyon Landfill, which is located approximately 37 miles from the site.
Tractor‐trailer End Dump Truck (25 ton) f 5 40 200 4 74 Used for transporting C&D waste.Assumed that C&D waste is transported to Chiquita Canyon Landfill, which is located approximately 37 miles from the site.
Tractor‐trailer End Dump Truck (25 ton) 8 175 1,400 4 24Used for hauling asphalt paving to a recycle firm in the area over a total of 100 work days (approximately 14 loads per day).
Assumed that asphalt is transported to P.W. Gillibrand Co., Inc., which is 12 miles from the site. Estimates indicate that 35,000 tons of asphalt will be transported.
d To allow for heightened activity, assume demolition activities occur up to 10 hours per day within the SSFL operational hours of 7 am to 7 pm. Per R. Dean/CH2M HILL, this is consistent with the Boeing ISRA activities (RE: SSFL EIS ‐ AQ Calculations Table.msg).
a The DOPAA indicates that demolition activities will occur between 2014 and 2016. For this analysis, conservatively assumed activities begin January 2014. Per K. Criswell/NASA, demolition may actually occur on and off for up to two years as NASA is approved for funding for fiscal years 2014 and 2015 (Fwd: SSFL EIS ‐ Demolition Truth‐checking (UNCLASSIFIED).msg).
e Total Mass Demolished taken from 'Demolition Equipment Estimates' table or Appendix 2 of the Site Visit Report and Demolition Budget Cost Estimate (Frankie Friend & Associates, Inc., 2011). Mass per material category is as follows:
MGM11‐SSFL/EIS_APPG/AppH_Attach1_121613.xlsxES09071117265MGM
Appendix H, NASA SSFL EIS for Proposed Demolition and Environmental Cleanup
H-37

ATTACHMENT 1‐7Demolition Data (High and Low Soil Removal Estimates)
NASA SSFL EIS: Air Quality
Description QuantityVehicle
Trips
Estimated Total
Round Trips
(To/From Site)Horsepower g Load Factor
g Comments Air Quality Assumptions / Questions
Off‐road Equipment RequirementsExcavators (one 75 ton; two 50 ton; and two 25 ton)
5 8 20 163 0.38Includes attachments and counterweights, if needed.
Crawler Crane (100 ton) 1 8 8 226 0.29 Includes boom and counterweights.All‐terrain Crane (50 ton) 2 4 8 226 0.29Manlifts (60 ft or 80 ft) 2 6 12 63 0.31Wheel Loaders (5 cy) 2 4 8 200 0.36Off‐highway Trucks (40 ton) 2 4 8 400 0.38Doser (D‐6 size) 1 4 4 255 0.40Vacuum Truck 1 4 4 400 0.38Motor Grader 1 6 6 175 0.41Skid‐steer Loaders 4 2 8 65 0.37
Miscellaneous Small Equipment 12 2 24 84 0.74Includes compressors, pumps, lighting plants, dust control equipment, etc.
Notes:a Equipment estimates provided are for 100% Demolition.b Unless otherwise noted, data provided by K. Criswell/NASA (RE: SSFL Demolition Alternative Data Needs.msg and SSFL Demo Proj ‐ Estimated Truck Equip Rqmt.pdf).c Except for the Tractor‐trailer End Dump Truck vehicle trips, values presented are based on an estimated project duration of 150 working days.
g Horsepower and load factors taken as the average for each equipment type from Table 3.3 of Appendix D of the CalEEMod User's Guide (Environ, 2013).
Crew Member Estimates for Demolition
Round Trip Distance Traveled to Site (miles) a, b 40
Round Trip Distance Traveled Onsite (miles) a, c 4
Number of Crew Members d, e 34Notes:a Assumed that crew members travel to the site using personal vehicles and are transported around the site using 15‐passenger vans.b The round trip distance crew members may travel to the site was estimated at 40 miles due to the isolated site and surrounding city locations.c The round trip distance crew members may travel onsite was taken from the 'Demolition Equipment Estimates' table.d Assumed 34 crew members onsite for demolition (30 workers per Section 2 of the SSFL EIS and 4 supervisors) based on the vehicles described in the 'Demolition Equipment Estimates' table.e Crew member estimates provided are for 100% Demolition.
e It was assumed that the crushed concrete would be transported a negligible distance as the laydown areas are expected to be near the site locations, as provided by K. Criswell/NASA (RE: SSFL Demolition Alternative Data Needs.msg).
Emissions based on 10 hours per day of operation. Conservatively assume all equipment operates at the
same time. Emissions from Miscellaneous Small Equipment will be represented using a pump emission
factor.
d Except for the crushed concrete transport, the round trip distance between the site location and entrance gate was estimated to be 1.5 to 4 miles using Google Earth™. As a conservative estimate, a distance of 4 miles will be used for onsite travel.
f For the concrete and C&D waste transport, the total number of round trips and the number of trips per truck were estimated based on the truck capacity (25 tons) and the amount of concrete to be crushed (4,750 tons of hazardous concrete and 38,000 tons of non‐hazardous concrete) or C&D waste to be generated (5,000 tons), as provided by J. Glasgow/CH2M HILL (RE: NASA SSFL EIS.msg).
MGM11‐SSFL/EIS_APPG/AppH_Attach1_121613.xlsxES09071117265MGM
Appendix H, NASA SSFL EIS for Proposed Demolition and Environmental Cleanup
H-38

ATTACHMENT 1‐7Demolition Data (High and Low Soil Removal Estimates)
NASA SSFL EIS: Air Quality
Haul Route to San Pedro
CountyRoundtrip
Distance (miles) a
Percent of
Trip
Distance
Air Basin
Los Angeles 71 99% SCABVentura 1 1% SCCABTotal 72 100%
Notes:
Haul Route to Los Angeles County Equipment Dealer
CountyRoundtrip
Distance (miles) a
Percent of
Trip
Distance
Air Basin
Los Angeles 49 98% SCABVentura 1 2% SCCABTotal 50 100%
Notes:
Haul Route to U.S. Ecology
CountyRoundtrip
Distance (miles) a
Percent of
Trip
Distance
Air Basin / State
Nye 69 10% NevadaInyo 98 14% GBVABSan Bernardino 278 41% MDABSan Bernardino 89 13% SCABLos Angeles 144 21% SCABVentura 1 0% SCCABTotal 679 100%
Notes:a The roundtrip distance (miles) within each air basin was estimated using Google Earth, as documented in Attachment 1‐9.
Haul Route to Chiquita Canyon Landfill
CountyRoundtrip
Distance (miles) a
Percent of
Trip
Distance
Air Basin
Los Angeles 73 99% SCABVentura 1 1% SCCABTotal 74 100%
Notes:
Haul Route to Simi Valley
CountyRoundtrip
Distance (miles) a
Percent of
Trip
Distance
Air Basin
Los Angeles 18 75% SCABVentura 6 25% SCCABTotal 24 100%
Notes:
a Per project‐specific data, the roundtrip distance (miles) to San Pedro (where the port for export is located) is 72 miles. The distance traveled within Los Angeles County was back‐calculated from the known total distance and the known distance from the site to the Ventura County border.
a Per project‐specific data, the roundtrip distance (miles) to the equipment dealer is 50 miles. It was assumed that the dealer is located in Los Angeles County. As such, all travel takes place in Los Angeles County once the truck crosses the Los Angeles County border, located approximately 1 mile from the facility entrance.
a Per project‐specific data, the roundtrip distance (miles) to Simi Valley (where asphalt is transported) is 24 miles. The distance traveled within Los Angeles and Ventura counties was estimated assuming trucks travel within Los Angeles County to reach Highway 118.
a The total roundtrip distance (miles) was estimated using Google Earth. Since the landfill is located in Los Angeles County, all travel takes place in Los Angeles County once the truck crosses the Los Angeles County border, located approximately 1 mile from the facility entrance.
MGM11‐SSFL/EIS_APPG/AppH_Attach1_121613.xlsxES09071117265MGM
Appendix H, NASA SSFL EIS for Proposed Demolition and Environmental Cleanup
H-39

ATTACHMENT 1‐7Demolition Data (High and Low Soil Removal Estimates)
NASA SSFL EIS: Air Quality
Worker Commute from Los Angeles County
CountyRoundtrip
Distance (miles) a
Percent of
Trip
Distance
Air Basin
Los Angeles 39 98% SCABVentura 1 3% SCCABTotal 40 100%
Notes:
Worker Commute from Ventura County
CountyRoundtrip
Distance (miles) a
Percent of
Trip
Distance
Air Basin
Los Angeles 34 85% SCABVentura 6 15% SCCABTotal 40 100%
Notes:
™ ‐ Google Earth is a registered trademark of Google, Inc.
a Per project‐specific data, the roundtrip distance (miles) for commuting is 40 miles. The distance traveled within Los Angeles and Ventura counties was estimated assuming employees travel within Los Angeles County to reach Highway 118 and travel a bit beyond the location for asphalt disposal.
a Per project‐specific data, the roundtrip distance (miles) for commuting is 40 miles. If employees live in Los Angeles County, all travel takes place in Los Angeles County once the employee crosses the Los Angeles County border, located approximately 1 mile from the facility entrance.
MGM11‐SSFL/EIS_APPG/AppH_Attach1_121613.xlsxES09071117265MGM
Appendix H, NASA SSFL EIS for Proposed Demolition and Environmental Cleanup
H-40

ATTACHMENT 1‐8Excavation Data (High Soil Removal Estimate)
NASA SSFL EIS: Air Quality
Activity Durations for Annual Scaling a
Excavation Duration (Days) b
Construction Year 2016 238Construction Year 2017 260
Material Hauling / Stockpile Duration (Days) c
Construction Year 2016 238Construction Year 2017 260
Notes:a The durations presented were used to scale annual emissions based on a full 260 day schedule to match the actual project schedule.
Excavation Schedule for the High Soil Removal Estimate a
Excavation Start Date (Month and Year) b February 2016Excavation Duration (Months) 23Excavation Duration (Days) 498Work Days per Week c 5
Work Hours per Day d 10Notes:a Per Section 1.2.2 of the SSFL EIS, the NASA‐administered area over which excavation activities occur is: 421.2 acres
c Assume excavation and hauling activities occur 5 days per week.d To allow for heightened activity, assume excavation activities occur up to 10 hours per day within the SSFL operational hours of 7 a.m. to 7 p.m. Per R. Dean/CH2M HILL, this is consistent with the Boeing ISRA activities (RE: SSFL EIS ‐ AQ Calculations Table.msg).
b For excavation, the 2016 duration accounts for activities beginning in February 2016 per the schedule provided. Excavation activities would also occur in 2017 if the required duration was longer than the 11 months of 2016.
c For material hauling, the 2016 duration accounts for activities beginning in February 2016 per the schedule provided. It was assumed that material hauling would take the entire allowable duration. Stockpiling would be necessary from the start of excavation (simultaneous with material hauling) to the completion of material hauling.
b The SSFL EIS indicates that excavation activities for the High Soil Removal Estimate will occur from February 2016 to December 2017. Assume material hauling begins at the same time. Hauling duration is presented in 'Soil Hauling Truck Estimates' table.
MGM11‐SSFL/EIS_APPG/AppH_Attach1_121613.xlsxES09071117265MGM
Appendix H, NASA SSFL EIS for Proposed Demolition and Environmental Cleanup
H-41

ATTACHMENT 1‐8Excavation Data (High Soil Removal Estimate)
NASA SSFL EIS: Air Quality
Soil Hauling Truck Estimates for the High Soil Removal Estimate
Truck Capacity (cy/truck) a 19
Removal Volume (cy) b 502,381Removal Trucks 26,441Removal Frequency (trucks/day) c 53
Backfill Volume (cy) d 167,460Backfill Trucks 8,814Backfill Frequency (trucks/day) c 18Hauling Duration (days) 498Daily Material Handled (tons/day) e 1,698Notes:
b Removal volumes (cy) provided by O. Edwards/CH2M HILL (CY summary for ea scenario.pdf).c The frequency of trucks was back‐calculated from the maximum duration (hauling must be completed by 2017) and the total trucks necessary to off‐haul the soil or bring in clean backfill.
d According to L. Tice/CH2M HILL and J. Glasgow/CH2M HILL (RE: SSFL EIS ‐ AQ Calculations Table(2).msg), up to 1/3rd of the soil excavated will be replaced using clean backfill taken from onsite areas adjacent to the excavation areas. Since the clean backfill will be from an onsite source, additional offsite truck hauling will not be required. Additionally, the backfilling activities will be performed using the excavation equipment during downtime. Assume stockpiling of the backfill is not required.
e Estimated the Daily Material Handled by considering the total removal and backfill volumes, a soil density of 24 tons per 19 cy (per note a above), and the number of active days in 2016 through 2017 (during which stockpiles may be formed or trucks may be loaded).
a According to C. Brady/Kettleman Hills Landfill (559‐318‐6086), a realistic average load for light‐weight truck and trailer combinations is 19 cy (approximately 24 tons).
MGM11‐SSFL/EIS_APPG/AppH_Attach1_121613.xlsxES09071117265MGM
Appendix H, NASA SSFL EIS for Proposed Demolition and Environmental Cleanup
H-42

ATTACHMENT 1‐8Excavation Data (High Soil Removal Estimate)
NASA SSFL EIS: Air Quality
Excavation Equipment Estimates for the High Soil Removal Estimate
Equipment Type a Quantity a Daily Hours of Operation b Horsepower c Load Factor c
Rubber Tired Dozers 1 10 255 0.40Concrete/Industrial Saws 1 10 81 0.73Tractors/Loaders/Backhoes 3 10 98 0.37Graders 1 10 175 0.41Excavators 2 10 163 0.38Scrapers 2 10 362 0.48Notes:
b Assumed each equipment would operate 10 hours per day, consistent with the schedule provided in the 'Excavation Schedule' table.c Horsepower and load factors taken as the average for each equipment type from Table 3.3 of Appendix D of the CalEEMod User's Guide (Environ, 2013).
Stockpile Estimates for the High Soil Removal Estimate
Stockpiles Utilized (Y or N) a Yes
Number of Stockpiles b 377
Maximum Size of Stockpiles (acres) c 0.14Notes:
8 feet
c Based on VCAPCD Rule 74.29, Maximum Size of Stockpiles conservatively assumed to be: 6,000 square feet
a The equipment list and quantity of each equipment type were taken as the maximum possible equipment counts for grading from Table 3.2 of Appendix D of the CalEEMod
User's Guide (Environ, 2013).
b Number of Stockpiles was estimated based on the total soil removal and backfill volumes, the Maximum Size of Stockpiles, and the conservative assumption that, per SCAQMD Rule 1157(d)(6)(C), each stockpile has a maximum height of:
a As a conservative estimate, assumed that the stockpiles would be used from the start of excavation/hauling activities to the end of hauling activities, which coincides with the total hauling duration.
MGM11‐SSFL/EIS_APPG/AppH_Attach1_121613.xlsxES09071117265MGM
Appendix H, NASA SSFL EIS for Proposed Demolition and Environmental Cleanup
H-43
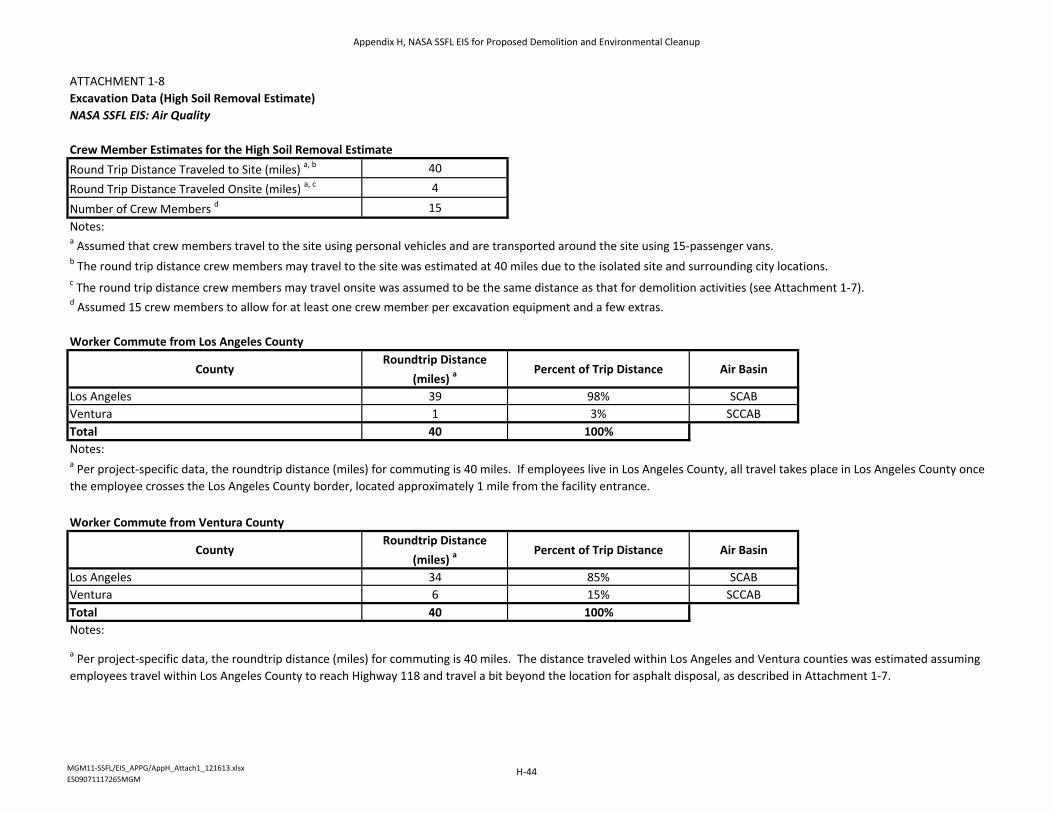
ATTACHMENT 1‐8Excavation Data (High Soil Removal Estimate)
NASA SSFL EIS: Air Quality
Crew Member Estimates for the High Soil Removal Estimate
Round Trip Distance Traveled to Site (miles) a, b 40
Round Trip Distance Traveled Onsite (miles) a, c 4
Number of Crew Members d 15Notes:a Assumed that crew members travel to the site using personal vehicles and are transported around the site using 15‐passenger vans.
c The round trip distance crew members may travel onsite was assumed to be the same distance as that for demolition activities (see Attachment 1‐7).d Assumed 15 crew members to allow for at least one crew member per excavation equipment and a few extras.
Worker Commute from Los Angeles County
CountyRoundtrip Distance
(miles) aPercent of Trip Distance Air Basin
Los Angeles 39 98% SCABVentura 1 3% SCCABTotal 40 100%
Notes:
Worker Commute from Ventura County
CountyRoundtrip Distance
(miles) aPercent of Trip Distance Air Basin
Los Angeles 34 85% SCABVentura 6 15% SCCABTotal 40 100%
Notes:
a Per project‐specific data, the roundtrip distance (miles) for commuting is 40 miles. The distance traveled within Los Angeles and Ventura counties was estimated assuming employees travel within Los Angeles County to reach Highway 118 and travel a bit beyond the location for asphalt disposal, as described in Attachment 1‐7.
b The round trip distance crew members may travel to the site was estimated at 40 miles due to the isolated site and surrounding city locations.
a Per project‐specific data, the roundtrip distance (miles) for commuting is 40 miles. If employees live in Los Angeles County, all travel takes place in Los Angeles County once the employee crosses the Los Angeles County border, located approximately 1 mile from the facility entrance.
MGM11‐SSFL/EIS_APPG/AppH_Attach1_121613.xlsxES09071117265MGM
Appendix H, NASA SSFL EIS for Proposed Demolition and Environmental Cleanup
H-44

ATTACHMENT 1‐9Haul Routes Considered (High and Low Soil Removal Estimates)
NASA SSFL EIS: Air Quality
Haul Routes to Possible Landfills for Soil Removal
SCCAB MDAB GBVAB Utah
Ventura Los Angeles Kern Kings Inyo Nye Clark Lincoln White Pine Elko Tooele
Kettleman Hills 335 1 126 170 38Buttonwillow 252 1 126 125U.S. Ecology 679 1 144.2 88.8 277.8 98 69.4Antelope Valley 141 1 140Energy Solutions 1,465 1 144.2 88.8 328.6 78 178 200 226 112 108
1 144.2 88.8 328.6 170 38 98 78 178 200 226 112 108
1 328.6 98 108
Notes:Shaded cells indicate counties that have attainment for all pollutants considered.a The roundtrip distance (miles) within each air basin was estimated using Google Earth.
Haul Routes from Possible Aggregate Suppliers for Clean Backfill
SCCAB SCAB
Ventura Los Angeles
P.W. Gillibrand Co. 45 21.4 23.4Rindge Dam 45 1.0 44.0Santa Paula Materials 89 66.0 23.4Grimes Rock 66 42.8 23.4Tapo Rock and Sand Products 43 19.4 23.4
66 44
66 44
Notes:a The roundtrip distance (miles) within each air basin was estimated using Google Earth.
Maximum Distance per California Air Basin or State
(miles)233 208 794
SJVAB Nevada
LandfillTotal Roundtrip
Distance (miles)Roundtrip Distance per County (miles) a
State or California Air Basin
San Bernardino
SCAB
Maximum Distance per County (miles)
Roundtrip Distance per County (miles) a
Maximum Distance per County (miles)
Maximum Distance per California Air Basin (miles)
State or California Air Basin
Aggregate SupplierTotal Roundtrip
Distance (miles)
MGM11‐SSFL/EIS_APPG/AppH_Attach1_121613.xlsxES09071117265MGM
Appendix H, NASA SSFL EIS for Proposed Demolition and Environmental Cleanup
H-45

ATTACHMENT 1‐10Road Repair Data (High and Low Soil Removal Estimates)
NASA SSFL EIS: Air Quality
General Comments:
1) Road repairs may be used as a mitigation measure per the text shown below:
Road Repair Schedule for Excavation and Offsite Disposal
Frequency of Rebuilds (per year) a, b 1
Rebuild Duration (months) a, b 1
Maximum Area Disturbed per Day (acres) b 1.6
Work Days per Week c 5
Work Hours per Day d 10
Years Repair Necessary e 2016 ‐ 2017
Description of Repairs (e.g., patching, rebuild) aPatching, overlay, resurface,
reconstruction Notes:a Data provided by G. Satterwhite/CH2M HILL (Air Quality Data_111811_NoGC_GS.xlsx and FW AQ Calculations.msg).
c Assume road repair activities occur 5 days per week.
Some local roadways used by heavy vehicles to access and egress the project site are not designated freight routes by the city or county of Los Angeles. As such, there is increased potential for roadway damage to occur on these facilities over the course of project construction. In anticipation of this roadway damage, the project team will coordinate with the City and County Road Maintenance Departments to restore and repair roadway damage that creates an unsafe or hazardous roadway condition on an as‐needed basis. Additionally, the project team will conduct annual maintenance and preventive repair on non‐freight designated local roadways. Annual maintenance will include repairing potholes, applying sealant, resurfacing, restructuring, and restriping where necessary. At completion of the project, non‐freight roadways will be repaired to their pre‐construction condition.
d To allow for heightened activity, assume excavation activities occur up to 10 hours per day within the SSFL operational hours of 7 a.m. to 7 p.m. Per R. Dean/CH2M HILL, this is consistent with the Boeing ISRA activities (RE: SSFL EIS ‐ AQ Calculations Table.msg).
b Data provided by R. Diven/NASA (RJ Diven Review_Air Quality Data_111811_NoGC.xlsx and Fwd: SSFL EIS ‐ Demolition Truth‐checking (UNCLASSIFIED).msg). If the same data were provided by G. Satterwhite/CH2M HILL (per note a), the more conservative value was used for this analysis.
e Years Repair Necessary correspond to the duration during which material hauling will occur. If material hauling is not occurring, road repair should not be required.
MGM11‐SSFL/EIS_APPG/AppH_Attach1_121613.xlsxES09071117265MGM
Appendix H, NASA SSFL EIS for Proposed Demolition and Environmental Cleanup
H-46
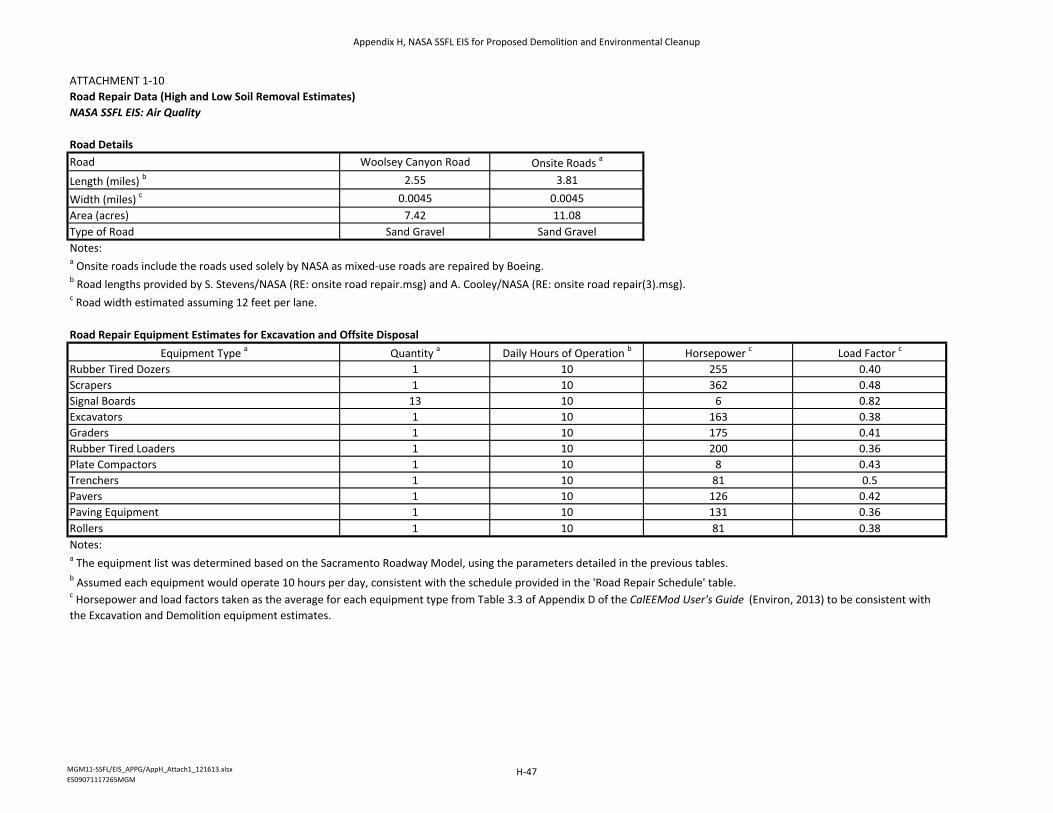
ATTACHMENT 1‐10Road Repair Data (High and Low Soil Removal Estimates)
NASA SSFL EIS: Air Quality
Road Details
Road Woolsey Canyon Road Onsite Roads a
Length (miles) b 2.55 3.81
Width (miles) c 0.0045 0.0045Area (acres) 7.42 11.08Type of Road Sand Gravel Sand GravelNotes:a Onsite roads include the roads used solely by NASA as mixed‐use roads are repaired by Boeing.b Road lengths provided by S. Stevens/NASA (RE: onsite road repair.msg) and A. Cooley/NASA (RE: onsite road repair(3).msg).c Road width estimated assuming 12 feet per lane.
Road Repair Equipment Estimates for Excavation and Offsite Disposal
Equipment Type a Quantity a Daily Hours of Operation b Horsepower c Load Factor c
Rubber Tired Dozers 1 10 255 0.40Scrapers 1 10 362 0.48Signal Boards 13 10 6 0.82Excavators 1 10 163 0.38Graders 1 10 175 0.41Rubber Tired Loaders 1 10 200 0.36Plate Compactors 1 10 8 0.43Trenchers 1 10 81 0.5Pavers 1 10 126 0.42Paving Equipment 1 10 131 0.36Rollers 1 10 81 0.38Notes:
b Assumed each equipment would operate 10 hours per day, consistent with the schedule provided in the 'Road Repair Schedule' table.c Horsepower and load factors taken as the average for each equipment type from Table 3.3 of Appendix D of the CalEEMod User's Guide (Environ, 2013) to be consistent with the Excavation and Demolition equipment estimates.
a The equipment list was determined based on the Sacramento Roadway Model, using the parameters detailed in the previous tables.
MGM11‐SSFL/EIS_APPG/AppH_Attach1_121613.xlsxES09071117265MGM
Appendix H, NASA SSFL EIS for Proposed Demolition and Environmental Cleanup
H-47
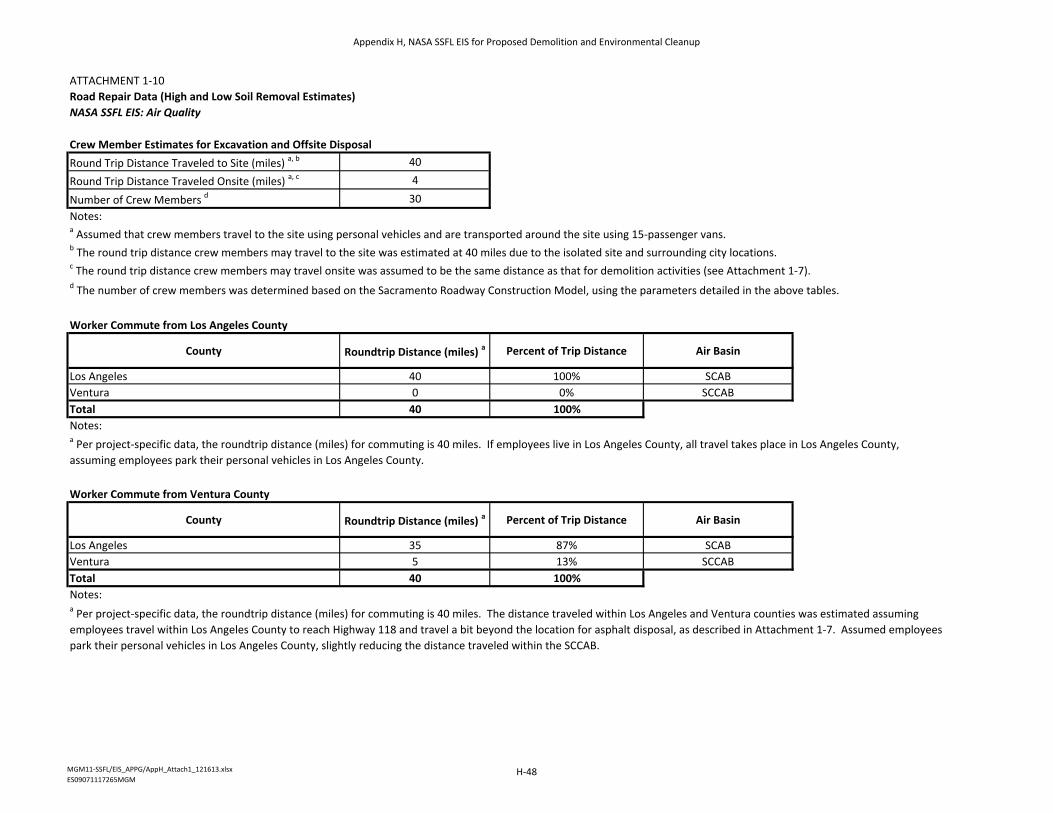
ATTACHMENT 1‐10Road Repair Data (High and Low Soil Removal Estimates)
NASA SSFL EIS: Air Quality
Crew Member Estimates for Excavation and Offsite Disposal
Round Trip Distance Traveled to Site (miles) a, b 40
Round Trip Distance Traveled Onsite (miles) a, c 4
Number of Crew Members d 30Notes:a Assumed that crew members travel to the site using personal vehicles and are transported around the site using 15‐passenger vans.b The round trip distance crew members may travel to the site was estimated at 40 miles due to the isolated site and surrounding city locations.c The round trip distance crew members may travel onsite was assumed to be the same distance as that for demolition activities (see Attachment 1‐7).
Worker Commute from Los Angeles County
County Roundtrip Distance (miles) a Percent of Trip Distance Air Basin
Los Angeles 40 100% SCABVentura 0 0% SCCABTotal 40 100%
Notes:
Worker Commute from Ventura County
County Roundtrip Distance (miles) a Percent of Trip Distance Air Basin
Los Angeles 35 87% SCABVentura 5 13% SCCABTotal 40 100%
Notes:
a Per project‐specific data, the roundtrip distance (miles) for commuting is 40 miles. If employees live in Los Angeles County, all travel takes place in Los Angeles County, assuming employees park their personal vehicles in Los Angeles County.
a Per project‐specific data, the roundtrip distance (miles) for commuting is 40 miles. The distance traveled within Los Angeles and Ventura counties was estimated assuming employees travel within Los Angeles County to reach Highway 118 and travel a bit beyond the location for asphalt disposal, as described in Attachment 1‐7. Assumed employees park their personal vehicles in Los Angeles County, slightly reducing the distance traveled within the SCCAB.
d The number of crew members was determined based on the Sacramento Roadway Construction Model, using the parameters detailed in the above tables.
MGM11‐SSFL/EIS_APPG/AppH_Attach1_121613.xlsxES09071117265MGM
Appendix H, NASA SSFL EIS for Proposed Demolition and Environmental Cleanup
H-48
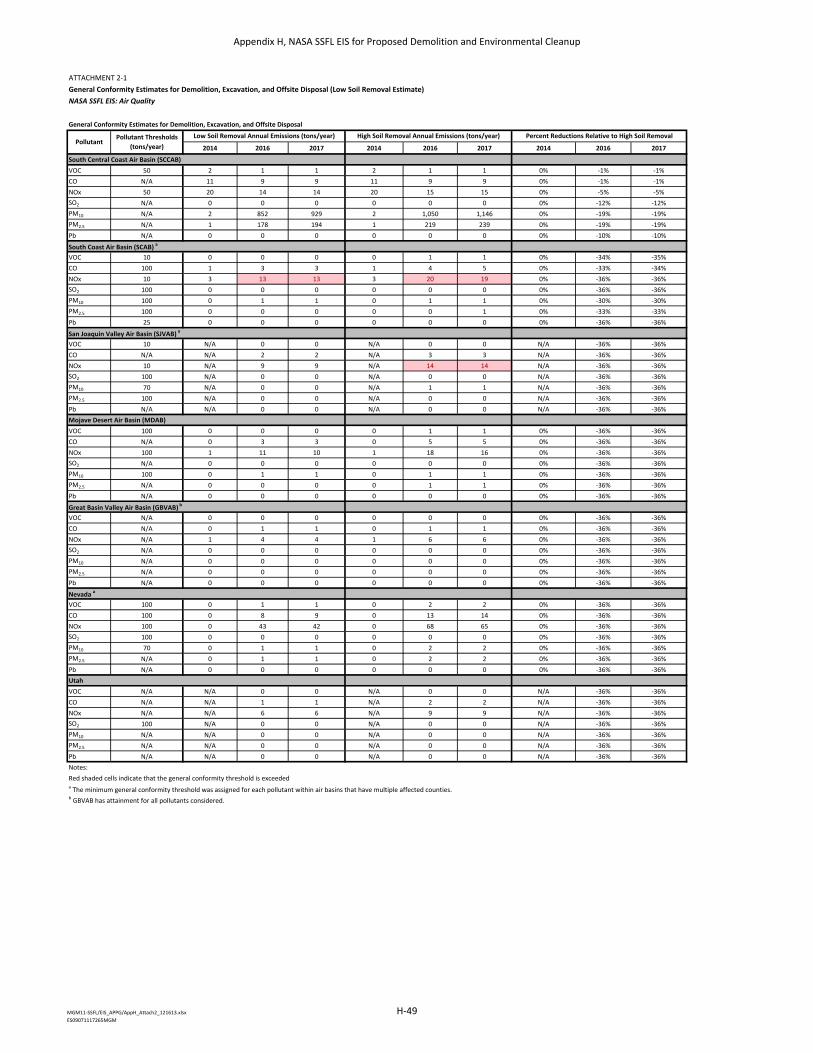
ATTACHMENT 2‐1General Conformity Estimates for Demolition, Excavation, and Offsite Disposal (Low Soil Removal Estimate)
NASA SSFL EIS: Air Quality
General Conformity Estimates for Demolition, Excavation, and Offsite Disposal
2014 2016 2017 2014 2016 2017 2014 2016 2017
South Central Coast Air Basin (SCCAB)
VOC 50 2 1 1 2 1 1 0% ‐1% ‐1%CO N/A 11 9 9 11 9 9 0% ‐1% ‐1%NOx 50 20 14 14 20 15 15 0% ‐5% ‐5%SO2 N/A 0 0 0 0 0 0 0% ‐12% ‐12%PM10 N/A 2 852 929 2 1,050 1,146 0% ‐19% ‐19%PM2.5 N/A 1 178 194 1 219 239 0% ‐19% ‐19%Pb N/A 0 0 0 0 0 0 0% ‐10% ‐10%
South Coast Air Basin (SCAB) a
VOC 10 0 0 0 0 1 1 0% ‐34% ‐35%CO 100 1 3 3 1 4 5 0% ‐33% ‐34%NOx 10 3 13 13 3 20 19 0% ‐36% ‐36%SO2 100 0 0 0 0 0 0 0% ‐36% ‐36%PM10 100 0 1 1 0 1 1 0% ‐30% ‐30%PM2.5 100 0 0 0 0 0 1 0% ‐33% ‐33%Pb 25 0 0 0 0 0 0 0% ‐36% ‐36%
San Joaquin Valley Air Basin (SJVAB) a
VOC 10 N/A 0 0 N/A 0 0 N/A ‐36% ‐36%CO N/A N/A 2 2 N/A 3 3 N/A ‐36% ‐36%NOx 10 N/A 9 9 N/A 14 14 N/A ‐36% ‐36%SO2 100 N/A 0 0 N/A 0 0 N/A ‐36% ‐36%PM10 70 N/A 0 0 N/A 1 1 N/A ‐36% ‐36%PM2.5 100 N/A 0 0 N/A 0 0 N/A ‐36% ‐36%Pb N/A N/A 0 0 N/A 0 0 N/A ‐36% ‐36%Mojave Desert Air Basin (MDAB)
VOC 100 0 0 0 0 1 1 0% ‐36% ‐36%CO N/A 0 3 3 0 5 5 0% ‐36% ‐36%NOx 100 1 11 10 1 18 16 0% ‐36% ‐36%SO2 N/A 0 0 0 0 0 0 0% ‐36% ‐36%PM10 100 0 1 1 0 1 1 0% ‐36% ‐36%PM2.5 N/A 0 0 0 0 1 1 0% ‐36% ‐36%Pb N/A 0 0 0 0 0 0 0% ‐36% ‐36%
Great Basin Valley Air Basin (GBVAB) b
VOC N/A 0 0 0 0 0 0 0% ‐36% ‐36%CO N/A 0 1 1 0 1 1 0% ‐36% ‐36%NOx N/A 1 4 4 1 6 6 0% ‐36% ‐36%SO2 N/A 0 0 0 0 0 0 0% ‐36% ‐36%PM10 N/A 0 0 0 0 0 0 0% ‐36% ‐36%PM2.5 N/A 0 0 0 0 0 0 0% ‐36% ‐36%Pb N/A 0 0 0 0 0 0 0% ‐36% ‐36%
Nevada a
VOC 100 0 1 1 0 2 2 0% ‐36% ‐36%CO 100 0 8 9 0 13 14 0% ‐36% ‐36%NOx 100 0 43 42 0 68 65 0% ‐36% ‐36%SO2 100 0 0 0 0 0 0 0% ‐36% ‐36%PM10 70 0 1 1 0 2 2 0% ‐36% ‐36%PM2.5 N/A 0 1 1 0 2 2 0% ‐36% ‐36%Pb N/A 0 0 0 0 0 0 0% ‐36% ‐36%Utah
VOC N/A N/A 0 0 N/A 0 0 N/A ‐36% ‐36%CO N/A N/A 1 1 N/A 2 2 N/A ‐36% ‐36%NOx N/A N/A 6 6 N/A 9 9 N/A ‐36% ‐36%SO2 100 N/A 0 0 N/A 0 0 N/A ‐36% ‐36%PM10 N/A N/A 0 0 N/A 0 0 N/A ‐36% ‐36%PM2.5 N/A N/A 0 0 N/A 0 0 N/A ‐36% ‐36%Pb N/A N/A 0 0 N/A 0 0 N/A ‐36% ‐36%Notes:Red shaded cells indicate that the general conformity threshold is exceededa The minimum general conformity threshold was assigned for each pollutant within air basins that have multiple affected counties.b GBVAB has attainment for all pollutants considered.
Low Soil Removal Annual Emissions (tons/year) High Soil Removal Annual Emissions (tons/year) Percent Reductions Relative to High Soil RemovalPollutant
Pollutant Thresholds
(tons/year)
MGM11‐SSFL/EIS_APPG/AppH_Attach2_121613.xlsxES09071117265MGM
Appendix H, NASA SSFL EIS for Proposed Demolition and Environmental Cleanup
H-49
This page intentionally left blank.
Appendix H, NASA SSFL EIS for Proposed Demolition and Environmental Cleanup
H-50
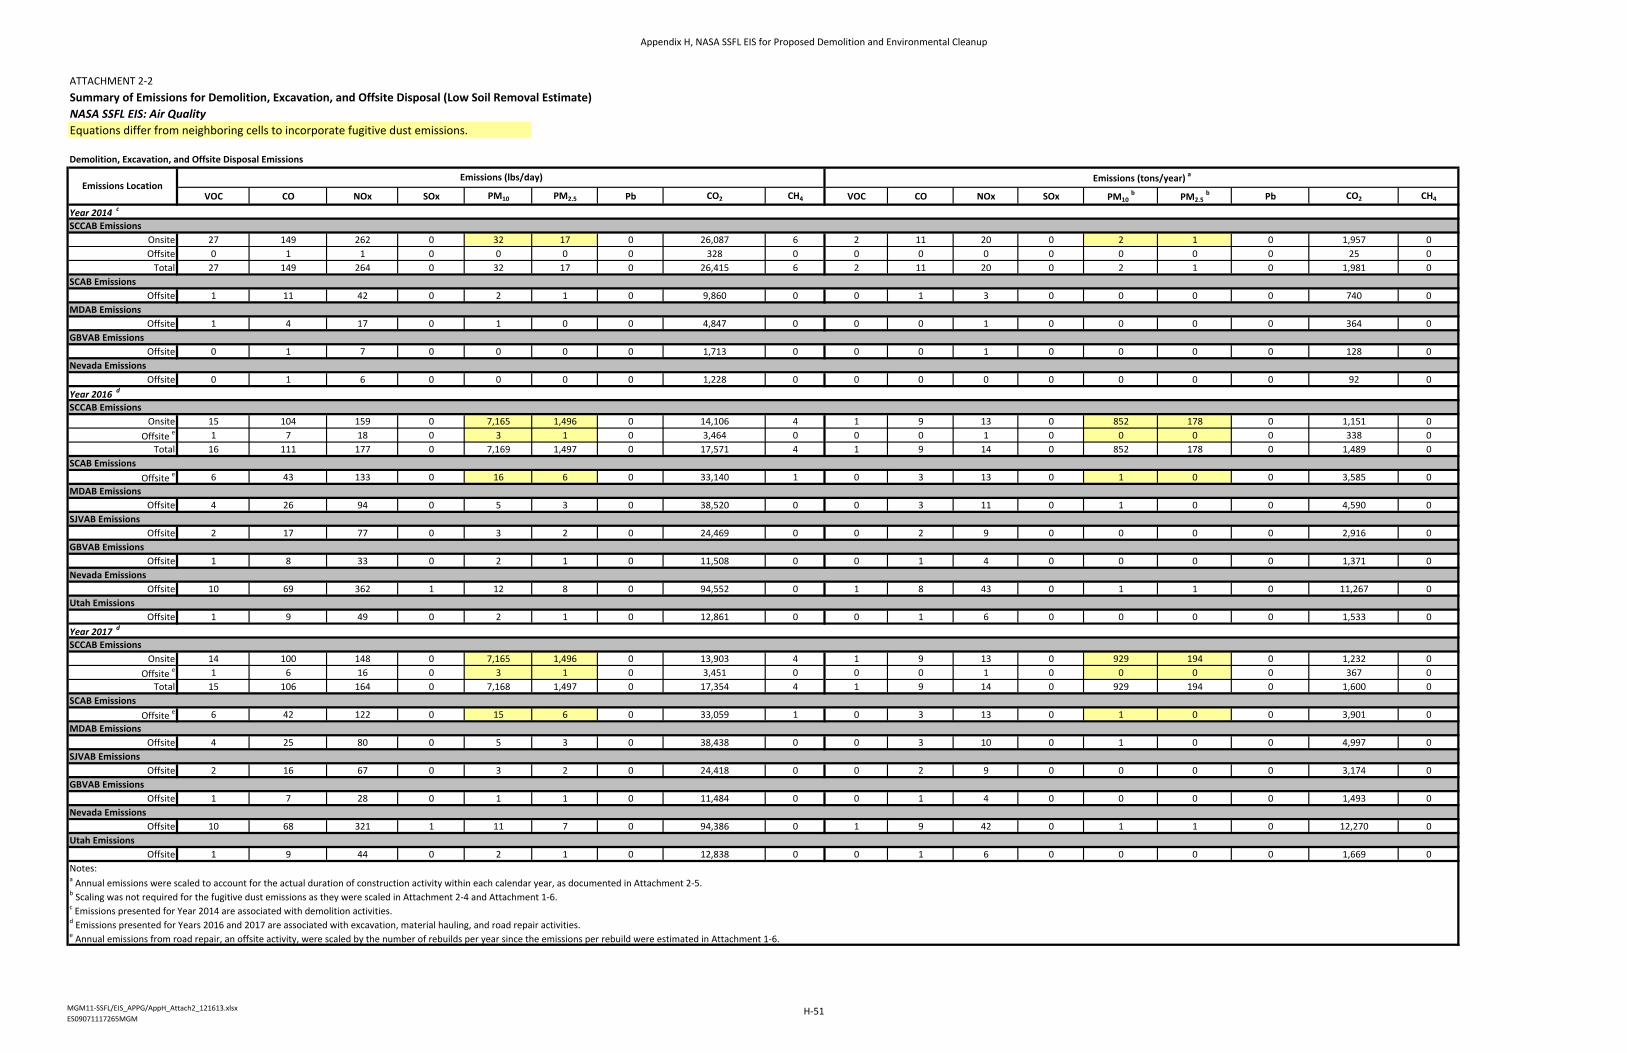
ATTACHMENT 2‐2Summary of Emissions for Demolition, Excavation, and Offsite Disposal (Low Soil Removal Estimate)
NASA SSFL EIS: Air QualityEquations differ from neighboring cells to incorporate fugitive dust emissions.
Demolition, Excavation, and Offsite Disposal Emissions
VOC CO NOx SOx PM10 PM2.5 Pb CO2 CH4 VOC CO NOx SOx PM10 b PM2.5
b Pb CO2 CH4
Year 2014 c
SCCAB Emissions
Onsite 27 149 262 0 32 17 0 26,087 6 2 11 20 0 2 1 0 1,957 0Offsite 0 1 1 0 0 0 0 328 0 0 0 0 0 0 0 0 25 0
Total 27 149 264 0 32 17 0 26,415 6 2 11 20 0 2 1 0 1,981 0SCAB Emissions
Offsite 1 11 42 0 2 1 0 9,860 0 0 1 3 0 0 0 0 740 0MDAB Emissions
Offsite 1 4 17 0 1 0 0 4,847 0 0 0 1 0 0 0 0 364 0GBVAB Emissions
Offsite 0 1 7 0 0 0 0 1,713 0 0 0 1 0 0 0 0 128 0Nevada Emissions
Offsite 0 1 6 0 0 0 0 1,228 0 0 0 0 0 0 0 0 92 0Year 2016 d
SCCAB Emissions
Onsite 15 104 159 0 7,165 1,496 0 14,106 4 1 9 13 0 852 178 0 1,151 0Offsite e 1 7 18 0 3 1 0 3,464 0 0 0 1 0 0 0 0 338 0
Total 16 111 177 0 7,169 1,497 0 17,571 4 1 9 14 0 852 178 0 1,489 0SCAB Emissions
Offsite e 6 43 133 0 16 6 0 33,140 1 0 3 13 0 1 0 0 3,585 0MDAB Emissions
Offsite 4 26 94 0 5 3 0 38,520 0 0 3 11 0 1 0 0 4,590 0SJVAB Emissions
Offsite 2 17 77 0 3 2 0 24,469 0 0 2 9 0 0 0 0 2,916 0GBVAB Emissions
Offsite 1 8 33 0 2 1 0 11,508 0 0 1 4 0 0 0 0 1,371 0Nevada Emissions
Offsite 10 69 362 1 12 8 0 94,552 0 1 8 43 0 1 1 0 11,267 0Utah Emissions
Offsite 1 9 49 0 2 1 0 12,861 0 0 1 6 0 0 0 0 1,533 0Year 2017 d
SCCAB Emissions
Onsite 14 100 148 0 7,165 1,496 0 13,903 4 1 9 13 0 929 194 0 1,232 0Offsite e 1 6 16 0 3 1 0 3,451 0 0 0 1 0 0 0 0 367 0
Total 15 106 164 0 7,168 1,497 0 17,354 4 1 9 14 0 929 194 0 1,600 0SCAB Emissions
Offsite e 6 42 122 0 15 6 0 33,059 1 0 3 13 0 1 0 0 3,901 0MDAB Emissions
Offsite 4 25 80 0 5 3 0 38,438 0 0 3 10 0 1 0 0 4,997 0SJVAB Emissions
Offsite 2 16 67 0 3 2 0 24,418 0 0 2 9 0 0 0 0 3,174 0GBVAB Emissions
Offsite 1 7 28 0 1 1 0 11,484 0 0 1 4 0 0 0 0 1,493 0Nevada Emissions
Offsite 10 68 321 1 11 7 0 94,386 0 1 9 42 0 1 1 0 12,270 0Utah Emissions
Offsite 1 9 44 0 2 1 0 12,838 0 0 1 6 0 0 0 0 1,669 0Notes:a Annual emissions were scaled to account for the actual duration of construction activity within each calendar year, as documented in Attachment 2‐5.b Scaling was not required for the fugitive dust emissions as they were scaled in Attachment 2‐4 and Attachment 1‐6.c Emissions presented for Year 2014 are associated with demolition activities.d Emissions presented for Years 2016 and 2017 are associated with excavation, material hauling, and road repair activities.e Annual emissions from road repair, an offsite activity, were scaled by the number of rebuilds per year since the emissions per rebuild were estimated in Attachment 1‐6.
Emissions LocationEmissions (lbs/day) Emissions (tons/year) a
MGM11‐SSFL/EIS_APPG/AppH_Attach2_121613.xlsxES09071117265MGM
Appendix H, NASA SSFL EIS for Proposed Demolition and Environmental Cleanup
H-51

This page intentionally left blank.
Appendix H, NASA SSFL EIS for Proposed Demolition and Environmental Cleanup
H-52
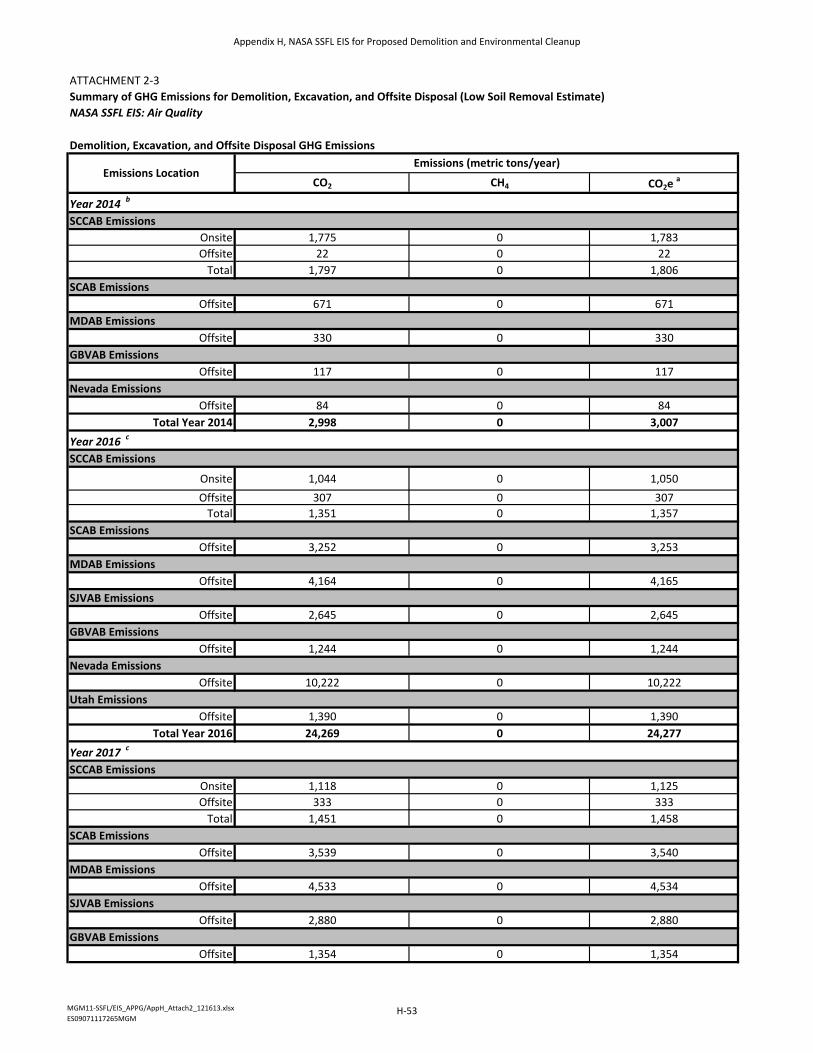
ATTACHMENT 2‐3Summary of GHG Emissions for Demolition, Excavation, and Offsite Disposal (Low Soil Removal Estimate)
NASA SSFL EIS: Air Quality
Demolition, Excavation, and Offsite Disposal GHG Emissions
CO2 CH4 CO2e a
Year 2014 b
SCCAB Emissions
Onsite 1,775 0 1,783Offsite 22 0 22
Total 1,797 0 1,806SCAB Emissions
Offsite 671 0 671MDAB Emissions
Offsite 330 0 330GBVAB Emissions
Offsite 117 0 117Nevada Emissions
Offsite 84 0 84Total Year 2014 2,998 0 3,007
Year 2016 c
SCCAB Emissions
Onsite 1,044 0 1,050Offsite 307 0 307
Total 1,351 0 1,357SCAB Emissions
Offsite 3,252 0 3,253MDAB Emissions
Offsite 4,164 0 4,165SJVAB Emissions
Offsite 2,645 0 2,645GBVAB Emissions
Offsite 1,244 0 1,244Nevada Emissions
Offsite 10,222 0 10,222Utah Emissions
Offsite 1,390 0 1,390Total Year 2016 24,269 0 24,277
Year 2017 c
SCCAB Emissions
Onsite 1,118 0 1,125Offsite 333 0 333
Total 1,451 0 1,458SCAB Emissions
Offsite 3,539 0 3,540MDAB Emissions
Offsite 4,533 0 4,534SJVAB Emissions
Offsite 2,880 0 2,880GBVAB Emissions
Offsite 1,354 0 1,354
Emissions LocationEmissions (metric tons/year)
MGM11‐SSFL/EIS_APPG/AppH_Attach2_121613.xlsxES09071117265MGM
Appendix H, NASA SSFL EIS for Proposed Demolition and Environmental Cleanup
H-53
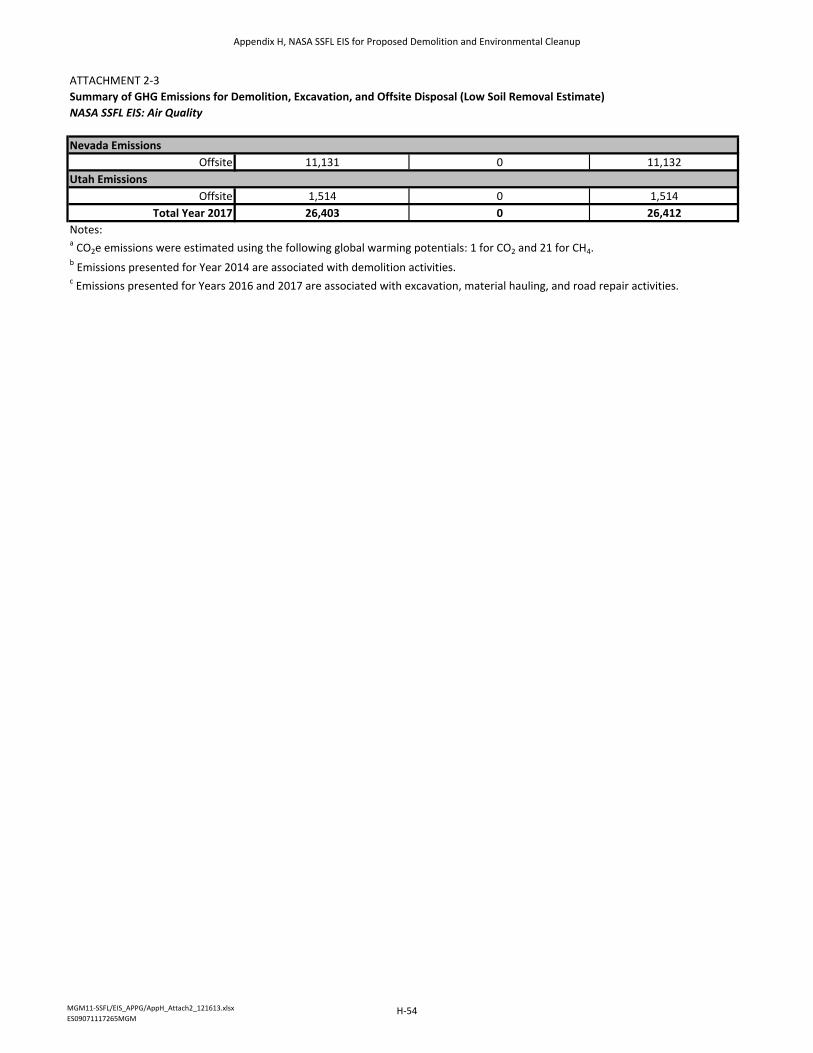
ATTACHMENT 2‐3Summary of GHG Emissions for Demolition, Excavation, and Offsite Disposal (Low Soil Removal Estimate)
NASA SSFL EIS: Air Quality
Nevada Emissions
Offsite 11,131 0 11,132Utah Emissions
Offsite 1,514 0 1,514Total Year 2017 26,403 0 26,412
Notes:a CO2e emissions were estimated using the following global warming potentials: 1 for CO2 and 21 for CH4.b Emissions presented for Year 2014 are associated with demolition activities.c Emissions presented for Years 2016 and 2017 are associated with excavation, material hauling, and road repair activities.
MGM11‐SSFL/EIS_APPG/AppH_Attach2_121613.xlsxES09071117265MGM
Appendix H, NASA SSFL EIS for Proposed Demolition and Environmental Cleanup
H-54
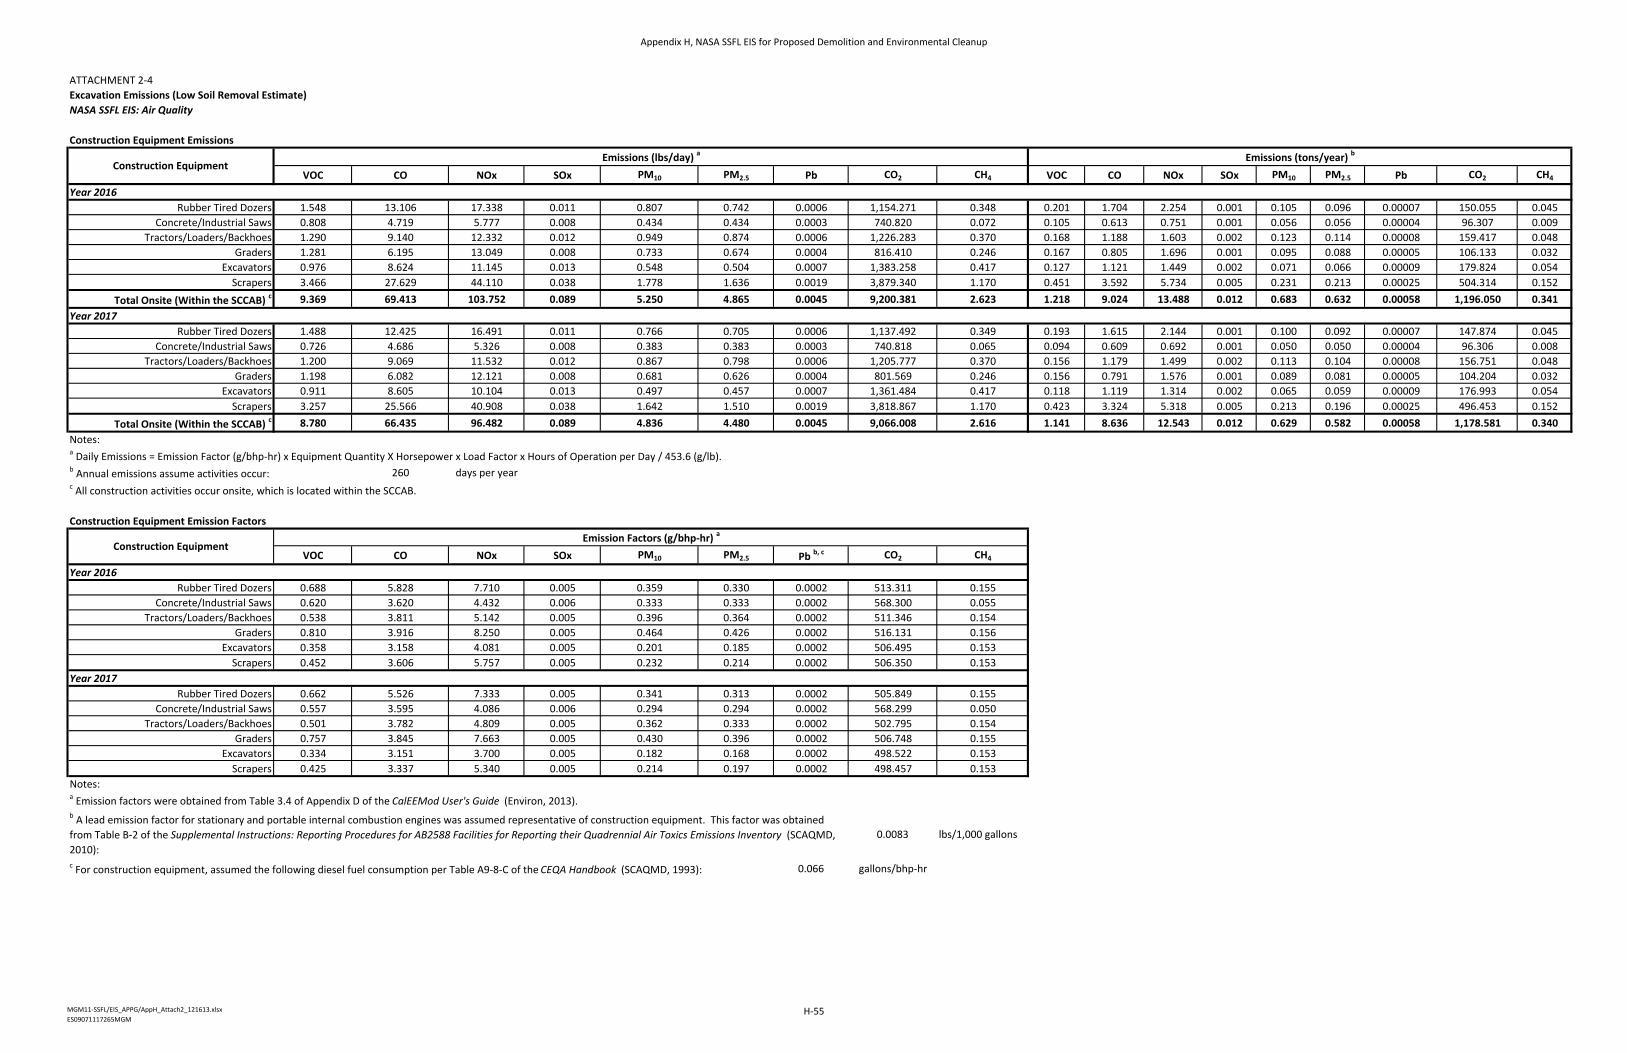
ATTACHMENT 2‐4Excavation Emissions (Low Soil Removal Estimate)
NASA SSFL EIS: Air Quality
Construction Equipment Emissions
VOC CO NOx SOx PM10 PM2.5 Pb CO2 CH4 VOC CO NOx SOx PM10 PM2.5 Pb CO2 CH4
Year 2016Rubber Tired Dozers 1.548 13.106 17.338 0.011 0.807 0.742 0.0006 1,154.271 0.348 0.201 1.704 2.254 0.001 0.105 0.096 0.00007 150.055 0.045
Concrete/Industrial Saws 0.808 4.719 5.777 0.008 0.434 0.434 0.0003 740.820 0.072 0.105 0.613 0.751 0.001 0.056 0.056 0.00004 96.307 0.009Tractors/Loaders/Backhoes 1.290 9.140 12.332 0.012 0.949 0.874 0.0006 1,226.283 0.370 0.168 1.188 1.603 0.002 0.123 0.114 0.00008 159.417 0.048
Graders 1.281 6.195 13.049 0.008 0.733 0.674 0.0004 816.410 0.246 0.167 0.805 1.696 0.001 0.095 0.088 0.00005 106.133 0.032Excavators 0.976 8.624 11.145 0.013 0.548 0.504 0.0007 1,383.258 0.417 0.127 1.121 1.449 0.002 0.071 0.066 0.00009 179.824 0.054
Scrapers 3.466 27.629 44.110 0.038 1.778 1.636 0.0019 3,879.340 1.170 0.451 3.592 5.734 0.005 0.231 0.213 0.00025 504.314 0.152Total Onsite (Within the SCCAB) c 9.369 69.413 103.752 0.089 5.250 4.865 0.0045 9,200.381 2.623 1.218 9.024 13.488 0.012 0.683 0.632 0.00058 1,196.050 0.341
Year 2017Rubber Tired Dozers 1.488 12.425 16.491 0.011 0.766 0.705 0.0006 1,137.492 0.349 0.193 1.615 2.144 0.001 0.100 0.092 0.00007 147.874 0.045
Concrete/Industrial Saws 0.726 4.686 5.326 0.008 0.383 0.383 0.0003 740.818 0.065 0.094 0.609 0.692 0.001 0.050 0.050 0.00004 96.306 0.008Tractors/Loaders/Backhoes 1.200 9.069 11.532 0.012 0.867 0.798 0.0006 1,205.777 0.370 0.156 1.179 1.499 0.002 0.113 0.104 0.00008 156.751 0.048
Graders 1.198 6.082 12.121 0.008 0.681 0.626 0.0004 801.569 0.246 0.156 0.791 1.576 0.001 0.089 0.081 0.00005 104.204 0.032Excavators 0.911 8.605 10.104 0.013 0.497 0.457 0.0007 1,361.484 0.417 0.118 1.119 1.314 0.002 0.065 0.059 0.00009 176.993 0.054
Scrapers 3.257 25.566 40.908 0.038 1.642 1.510 0.0019 3,818.867 1.170 0.423 3.324 5.318 0.005 0.213 0.196 0.00025 496.453 0.152Total Onsite (Within the SCCAB) c 8.780 66.435 96.482 0.089 4.836 4.480 0.0045 9,066.008 2.616 1.141 8.636 12.543 0.012 0.629 0.582 0.00058 1,178.581 0.340
Notes:a Daily Emissions = Emission Factor (g/bhp‐hr) x Equipment Quantity X Horsepower x Load Factor x Hours of Operation per Day / 453.6 (g/lb).b Annual emissions assume activities occur: 260 days per yearc All construction activities occur onsite, which is located within the SCCAB.
Construction Equipment Emission Factors
VOC CO NOx SOx PM10 PM2.5 Pb b, c CO2 CH4
Year 2016Rubber Tired Dozers 0.688 5.828 7.710 0.005 0.359 0.330 0.0002 513.311 0.155
Concrete/Industrial Saws 0.620 3.620 4.432 0.006 0.333 0.333 0.0002 568.300 0.055Tractors/Loaders/Backhoes 0.538 3.811 5.142 0.005 0.396 0.364 0.0002 511.346 0.154
Graders 0.810 3.916 8.250 0.005 0.464 0.426 0.0002 516.131 0.156Excavators 0.358 3.158 4.081 0.005 0.201 0.185 0.0002 506.495 0.153
Scrapers 0.452 3.606 5.757 0.005 0.232 0.214 0.0002 506.350 0.153Year 2017
Rubber Tired Dozers 0.662 5.526 7.333 0.005 0.341 0.313 0.0002 505.849 0.155Concrete/Industrial Saws 0.557 3.595 4.086 0.006 0.294 0.294 0.0002 568.299 0.050
Tractors/Loaders/Backhoes 0.501 3.782 4.809 0.005 0.362 0.333 0.0002 502.795 0.154Graders 0.757 3.845 7.663 0.005 0.430 0.396 0.0002 506.748 0.155
Excavators 0.334 3.151 3.700 0.005 0.182 0.168 0.0002 498.522 0.153Scrapers 0.425 3.337 5.340 0.005 0.214 0.197 0.0002 498.457 0.153
Notes:a Emission factors were obtained from Table 3.4 of Appendix D of the CalEEMod User's Guide (Environ, 2013).
0.0083 lbs/1,000 gallons
c For construction equipment, assumed the following diesel fuel consumption per Table A9‐8‐C of the CEQA Handbook (SCAQMD, 1993): 0.066 gallons/bhp‐hr
Emission Factors (g/bhp‐hr) a
Emissions (lbs/day) a Emissions (tons/year) bConstruction Equipment
Construction Equipment
b A lead emission factor for stationary and portable internal combustion engines was assumed representative of construction equipment. This factor was obtained from Table B‐2 of the Supplemental Instructions: Reporting Procedures for AB2588 Facilities for Reporting their Quadrennial Air Toxics Emissions Inventory (SCAQMD, 2010):
MGM11‐SSFL/EIS_APPG/AppH_Attach2_121613.xlsxES09071117265MGM
Appendix H, NASA SSFL EIS for Proposed Demolition and Environmental Cleanup
H-55
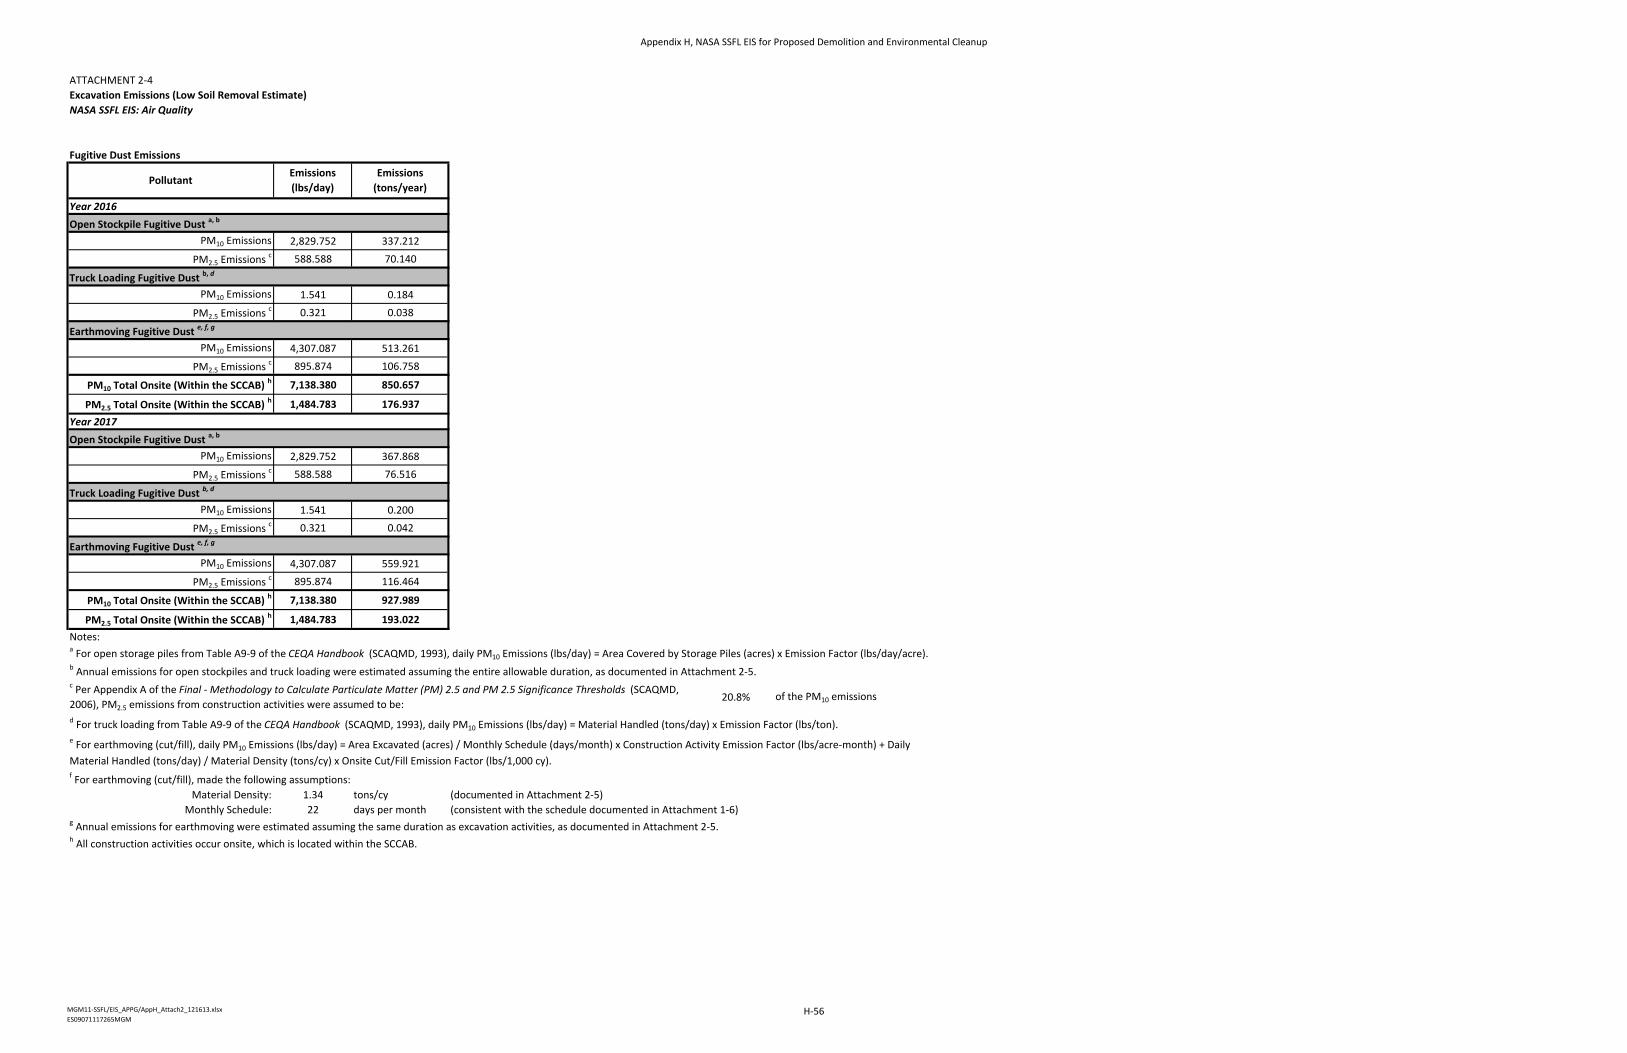
ATTACHMENT 2‐4Excavation Emissions (Low Soil Removal Estimate)
NASA SSFL EIS: Air Quality
Fugitive Dust Emissions
Year 2016Open Stockpile Fugitive Dust a, b
PM10 Emissions 2,829.752 337.212
PM2.5 Emissions c 588.588 70.140
Truck Loading Fugitive Dust b, d
PM10 Emissions 1.541 0.184
PM2.5 Emissions c 0.321 0.038
Earthmoving Fugitive Dust e, f, g
PM10 Emissions 4,307.087 513.261
PM2.5 Emissions c 895.874 106.758
PM10 Total Onsite (Within the SCCAB) h 7,138.380 850.657
PM2.5 Total Onsite (Within the SCCAB) h 1,484.783 176.937
Year 2017Open Stockpile Fugitive Dust a, b
PM10 Emissions 2,829.752 367.868
PM2.5 Emissions c 588.588 76.516
Truck Loading Fugitive Dust b, d
PM10 Emissions 1.541 0.200
PM2.5 Emissions c 0.321 0.042
Earthmoving Fugitive Dust e, f, g
PM10 Emissions 4,307.087 559.921
PM2.5 Emissions c 895.874 116.464
PM10 Total Onsite (Within the SCCAB) h 7,138.380 927.989
PM2.5 Total Onsite (Within the SCCAB) h 1,484.783 193.022
Notes:a For open storage piles from Table A9‐9 of the CEQA Handbook (SCAQMD, 1993), daily PM10 Emissions (lbs/day) = Area Covered by Storage Piles (acres) x Emission Factor (lbs/day/acre).b Annual emissions for open stockpiles and truck loading were estimated assuming the entire allowable duration, as documented in Attachment 2‐5.
20.8% of the PM10 emissions
f For earthmoving (cut/fill), made the following assumptions:Material Density: 1.34 tons/cy (documented in Attachment 2‐5)
Monthly Schedule: 22 days per month (consistent with the schedule documented in Attachment 1‐6)g Annual emissions for earthmoving were estimated assuming the same duration as excavation activities, as documented in Attachment 2‐5.h All construction activities occur onsite, which is located within the SCCAB.
c Per Appendix A of the Final ‐ Methodology to Calculate Particulate Matter (PM) 2.5 and PM 2.5 Significance Thresholds (SCAQMD, 2006), PM2.5 emissions from construction activities were assumed to be:
PollutantEmissions
(tons/year)
d For truck loading from Table A9‐9 of the CEQA Handbook (SCAQMD, 1993), daily PM10 Emissions (lbs/day) = Material Handled (tons/day) x Emission Factor (lbs/ton).e For earthmoving (cut/fill), daily PM10 Emissions (lbs/day) = Area Excavated (acres) / Monthly Schedule (days/month) x Construction Activity Emission Factor (lbs/acre‐month) + Daily Material Handled (tons/day) / Material Density (tons/cy) x Onsite Cut/Fill Emission Factor (lbs/1,000 cy).
Emissions
(lbs/day)
MGM11‐SSFL/EIS_APPG/AppH_Attach2_121613.xlsxES09071117265MGM
Appendix H, NASA SSFL EIS for Proposed Demolition and Environmental Cleanup
H-56
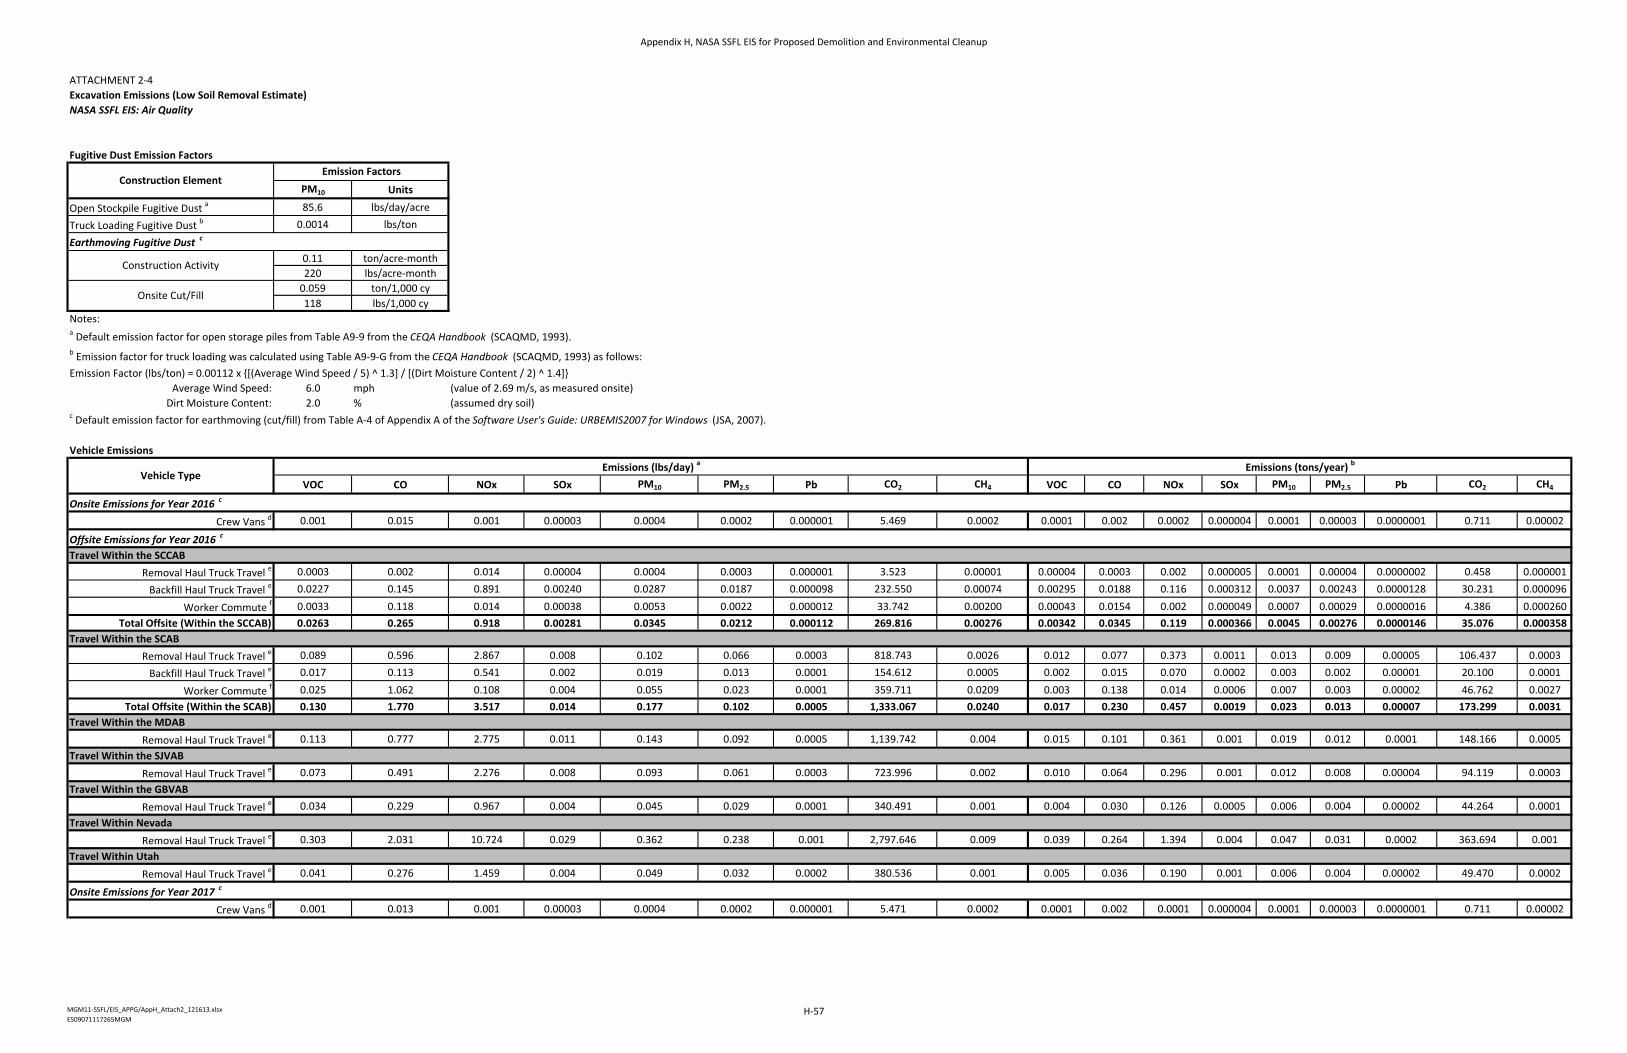
ATTACHMENT 2‐4Excavation Emissions (Low Soil Removal Estimate)
NASA SSFL EIS: Air Quality
Fugitive Dust Emission Factors
PM10 Units
Open Stockpile Fugitive Dust a 85.6 lbs/day/acre
Truck Loading Fugitive Dust b 0.0014 lbs/ton
0.11 ton/acre‐month220 lbs/acre‐month
0.059 ton/1,000 cy118 lbs/1,000 cy
Notes:a Default emission factor for open storage piles from Table A9‐9 from the CEQA Handbook (SCAQMD, 1993).b Emission factor for truck loading was calculated using Table A9‐9‐G from the CEQA Handbook (SCAQMD, 1993) as follows:Emission Factor (lbs/ton) = 0.00112 x {[(Average Wind Speed / 5) ^ 1.3] / [(Dirt Moisture Content / 2) ^ 1.4]}
Average Wind Speed: 6.0 mph (value of 2.69 m/s, as measured onsite)Dirt Moisture Content: 2.0 % (assumed dry soil)
c Default emission factor for earthmoving (cut/fill) from Table A‐4 of Appendix A of the Software User's Guide: URBEMIS2007 for Windows (JSA, 2007).
Vehicle Emissions
VOC CO NOx SOx PM10 PM2.5 Pb CO2 CH4 VOC CO NOx SOx PM10 PM2.5 Pb CO2 CH4
Onsite Emissions for Year 2016 c
Crew Vans d 0.001 0.015 0.001 0.00003 0.0004 0.0002 0.000001 5.469 0.0002 0.0001 0.002 0.0002 0.000004 0.0001 0.00003 0.0000001 0.711 0.00002
Offsite Emissions for Year 2016 c
Travel Within the SCCAB
Removal Haul Truck Travel e 0.0003 0.002 0.014 0.00004 0.0004 0.0003 0.000001 3.523 0.00001 0.00004 0.0003 0.002 0.000005 0.0001 0.00004 0.0000002 0.458 0.000001
Backfill Haul Truck Travel e 0.0227 0.145 0.891 0.00240 0.0287 0.0187 0.000098 232.550 0.00074 0.00295 0.0188 0.116 0.000312 0.0037 0.00243 0.0000128 30.231 0.000096
Worker Commute f 0.0033 0.118 0.014 0.00038 0.0053 0.0022 0.000012 33.742 0.00200 0.00043 0.0154 0.002 0.000049 0.0007 0.00029 0.0000016 4.386 0.000260Total Offsite (Within the SCCAB) 0.0263 0.265 0.918 0.00281 0.0345 0.0212 0.000112 269.816 0.00276 0.00342 0.0345 0.119 0.000366 0.0045 0.00276 0.0000146 35.076 0.000358
Travel Within the SCAB
Removal Haul Truck Travel e 0.089 0.596 2.867 0.008 0.102 0.066 0.0003 818.743 0.0026 0.012 0.077 0.373 0.0011 0.013 0.009 0.00005 106.437 0.0003
Backfill Haul Truck Travel e 0.017 0.113 0.541 0.002 0.019 0.013 0.0001 154.612 0.0005 0.002 0.015 0.070 0.0002 0.003 0.002 0.00001 20.100 0.0001
Worker Commute f 0.025 1.062 0.108 0.004 0.055 0.023 0.0001 359.711 0.0209 0.003 0.138 0.014 0.0006 0.007 0.003 0.00002 46.762 0.0027Total Offsite (Within the SCAB) 0.130 1.770 3.517 0.014 0.177 0.102 0.0005 1,333.067 0.0240 0.017 0.230 0.457 0.0019 0.023 0.013 0.00007 173.299 0.0031
Travel Within the MDAB
Removal Haul Truck Travel e 0.113 0.777 2.775 0.011 0.143 0.092 0.0005 1,139.742 0.004 0.015 0.101 0.361 0.001 0.019 0.012 0.0001 148.166 0.0005Travel Within the SJVAB
Removal Haul Truck Travel e 0.073 0.491 2.276 0.008 0.093 0.061 0.0003 723.996 0.002 0.010 0.064 0.296 0.001 0.012 0.008 0.00004 94.119 0.0003Travel Within the GBVAB
Removal Haul Truck Travel e 0.034 0.229 0.967 0.004 0.045 0.029 0.0001 340.491 0.001 0.004 0.030 0.126 0.0005 0.006 0.004 0.00002 44.264 0.0001Travel Within Nevada
Removal Haul Truck Travel e 0.303 2.031 10.724 0.029 0.362 0.238 0.001 2,797.646 0.009 0.039 0.264 1.394 0.004 0.047 0.031 0.0002 363.694 0.001Travel Within Utah
Removal Haul Truck Travel e 0.041 0.276 1.459 0.004 0.049 0.032 0.0002 380.536 0.001 0.005 0.036 0.190 0.001 0.006 0.004 0.00002 49.470 0.0002
Onsite Emissions for Year 2017 c
Crew Vans d 0.001 0.013 0.001 0.00003 0.0004 0.0002 0.000001 5.471 0.0002 0.0001 0.002 0.0001 0.000004 0.0001 0.00003 0.0000001 0.711 0.00002
Construction ElementEmission Factors
Onsite Cut/Fill
Emissions (tons/year) bVehicle Type
Emissions (lbs/day) a
Earthmoving Fugitive Dust c
Construction Activity
MGM11‐SSFL/EIS_APPG/AppH_Attach2_121613.xlsxES09071117265MGM
Appendix H, NASA SSFL EIS for Proposed Demolition and Environmental Cleanup
H-57
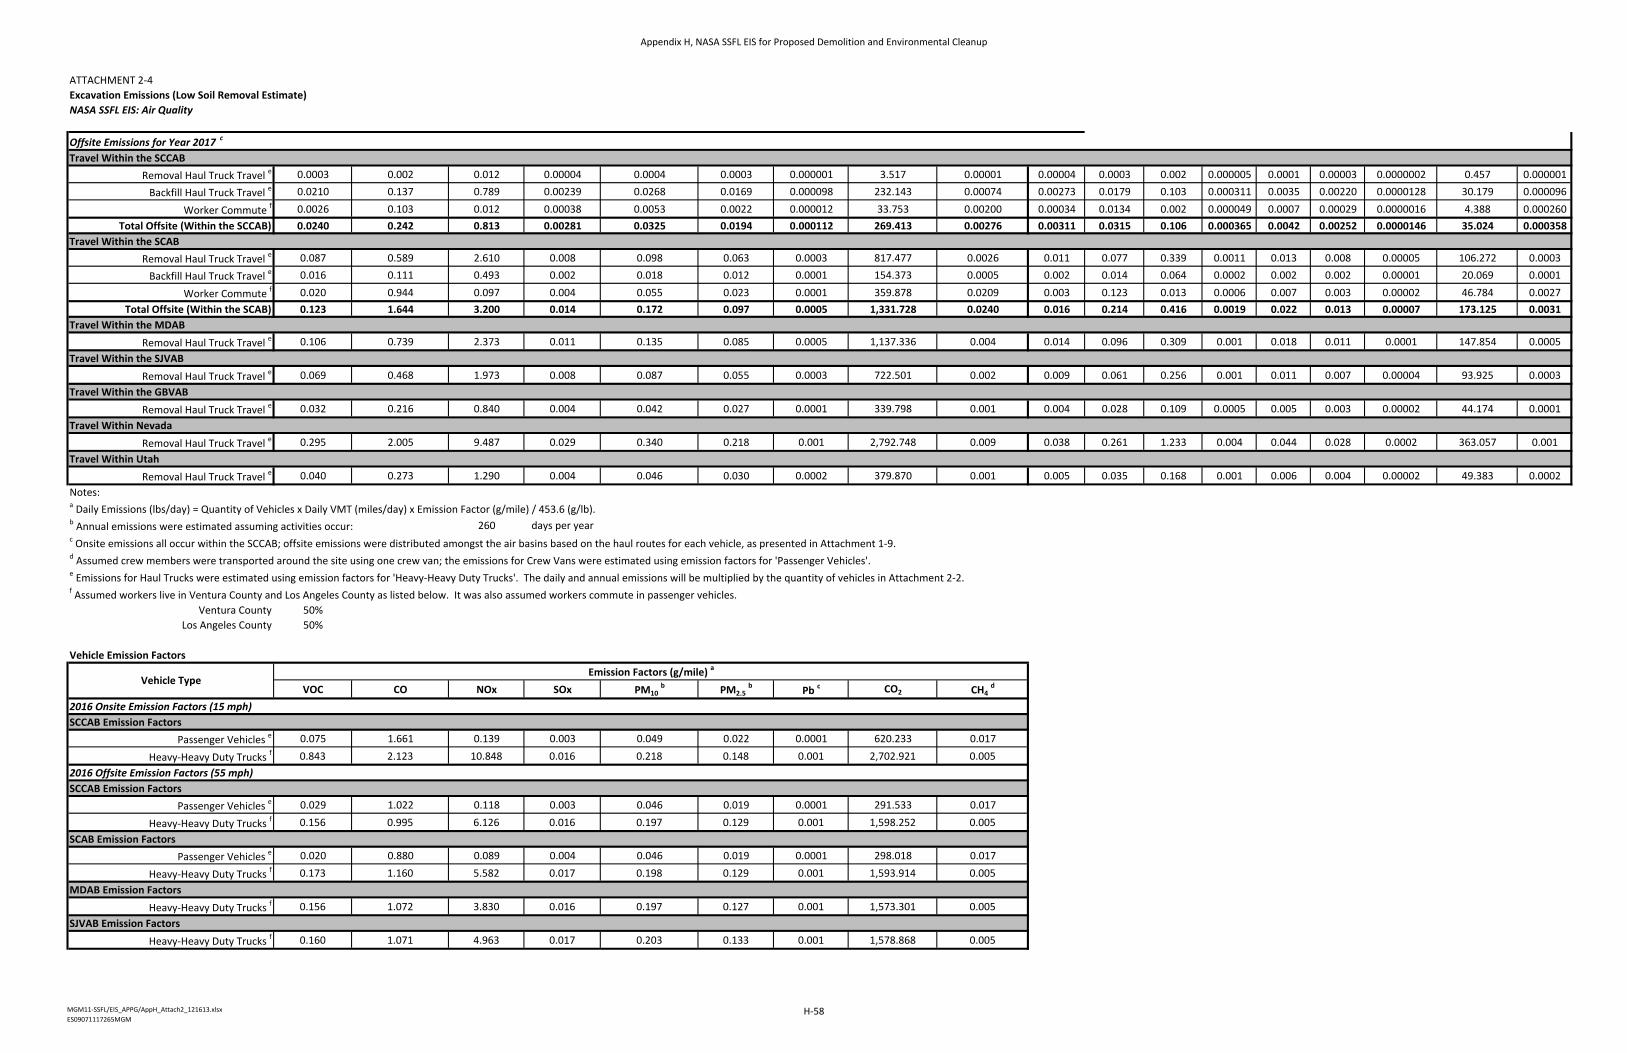
ATTACHMENT 2‐4Excavation Emissions (Low Soil Removal Estimate)
NASA SSFL EIS: Air Quality
Offsite Emissions for Year 2017 c
Travel Within the SCCAB
Removal Haul Truck Travel e 0.0003 0.002 0.012 0.00004 0.0004 0.0003 0.000001 3.517 0.00001 0.00004 0.0003 0.002 0.000005 0.0001 0.00003 0.0000002 0.457 0.000001
Backfill Haul Truck Travel e 0.0210 0.137 0.789 0.00239 0.0268 0.0169 0.000098 232.143 0.00074 0.00273 0.0179 0.103 0.000311 0.0035 0.00220 0.0000128 30.179 0.000096
Worker Commute f 0.0026 0.103 0.012 0.00038 0.0053 0.0022 0.000012 33.753 0.00200 0.00034 0.0134 0.002 0.000049 0.0007 0.00029 0.0000016 4.388 0.000260Total Offsite (Within the SCCAB) 0.0240 0.242 0.813 0.00281 0.0325 0.0194 0.000112 269.413 0.00276 0.00311 0.0315 0.106 0.000365 0.0042 0.00252 0.0000146 35.024 0.000358
Travel Within the SCAB
Removal Haul Truck Travel e 0.087 0.589 2.610 0.008 0.098 0.063 0.0003 817.477 0.0026 0.011 0.077 0.339 0.0011 0.013 0.008 0.00005 106.272 0.0003
Backfill Haul Truck Travel e 0.016 0.111 0.493 0.002 0.018 0.012 0.0001 154.373 0.0005 0.002 0.014 0.064 0.0002 0.002 0.002 0.00001 20.069 0.0001
Worker Commute f 0.020 0.944 0.097 0.004 0.055 0.023 0.0001 359.878 0.0209 0.003 0.123 0.013 0.0006 0.007 0.003 0.00002 46.784 0.0027Total Offsite (Within the SCAB) 0.123 1.644 3.200 0.014 0.172 0.097 0.0005 1,331.728 0.0240 0.016 0.214 0.416 0.0019 0.022 0.013 0.00007 173.125 0.0031
Travel Within the MDAB
Removal Haul Truck Travel e 0.106 0.739 2.373 0.011 0.135 0.085 0.0005 1,137.336 0.004 0.014 0.096 0.309 0.001 0.018 0.011 0.0001 147.854 0.0005Travel Within the SJVAB
Removal Haul Truck Travel e 0.069 0.468 1.973 0.008 0.087 0.055 0.0003 722.501 0.002 0.009 0.061 0.256 0.001 0.011 0.007 0.00004 93.925 0.0003Travel Within the GBVAB
Removal Haul Truck Travel e 0.032 0.216 0.840 0.004 0.042 0.027 0.0001 339.798 0.001 0.004 0.028 0.109 0.0005 0.005 0.003 0.00002 44.174 0.0001Travel Within Nevada
Removal Haul Truck Travel e 0.295 2.005 9.487 0.029 0.340 0.218 0.001 2,792.748 0.009 0.038 0.261 1.233 0.004 0.044 0.028 0.0002 363.057 0.001Travel Within Utah
Removal Haul Truck Travel e 0.040 0.273 1.290 0.004 0.046 0.030 0.0002 379.870 0.001 0.005 0.035 0.168 0.001 0.006 0.004 0.00002 49.383 0.0002Notes:a Daily Emissions (lbs/day) = Quantity of Vehicles x Daily VMT (miles/day) x Emission Factor (g/mile) / 453.6 (g/lb).b Annual emissions were estimated assuming activities occur: 260 days per yearc Onsite emissions all occur within the SCCAB; offsite emissions were distributed amongst the air basins based on the haul routes for each vehicle, as presented in Attachment 1‐9.d Assumed crew members were transported around the site using one crew van; the emissions for Crew Vans were estimated using emission factors for 'Passenger Vehicles'.e Emissions for Haul Trucks were estimated using emission factors for 'Heavy‐Heavy Duty Trucks'. The daily and annual emissions will be multiplied by the quantity of vehicles in Attachment 2‐2.f Assumed workers live in Ventura County and Los Angeles County as listed below. It was also assumed workers commute in passenger vehicles.
Ventura County 50%Los Angeles County 50%
Vehicle Emission Factors
VOC CO NOx SOx PM10 b PM2.5
bPb c CO2 CH4
d
2016 Onsite Emission Factors (15 mph)SCCAB Emission Factors
Passenger Vehicles e 0.075 1.661 0.139 0.003 0.049 0.022 0.0001 620.233 0.017
Heavy‐Heavy Duty Trucks f 0.843 2.123 10.848 0.016 0.218 0.148 0.001 2,702.921 0.0052016 Offsite Emission Factors (55 mph)SCCAB Emission Factors
Passenger Vehicles e 0.029 1.022 0.118 0.003 0.046 0.019 0.0001 291.533 0.017
Heavy‐Heavy Duty Trucks f 0.156 0.995 6.126 0.016 0.197 0.129 0.001 1,598.252 0.005SCAB Emission Factors
Passenger Vehicles e 0.020 0.880 0.089 0.004 0.046 0.019 0.0001 298.018 0.017
Heavy‐Heavy Duty Trucks f 0.173 1.160 5.582 0.017 0.198 0.129 0.001 1,593.914 0.005MDAB Emission Factors
Heavy‐Heavy Duty Trucks f 0.156 1.072 3.830 0.016 0.197 0.127 0.001 1,573.301 0.005SJVAB Emission Factors
Heavy‐Heavy Duty Trucks f 0.160 1.071 4.963 0.017 0.203 0.133 0.001 1,578.868 0.005
Vehicle TypeEmission Factors (g/mile) a
MGM11‐SSFL/EIS_APPG/AppH_Attach2_121613.xlsxES09071117265MGM
Appendix H, NASA SSFL EIS for Proposed Demolition and Environmental Cleanup
H-58
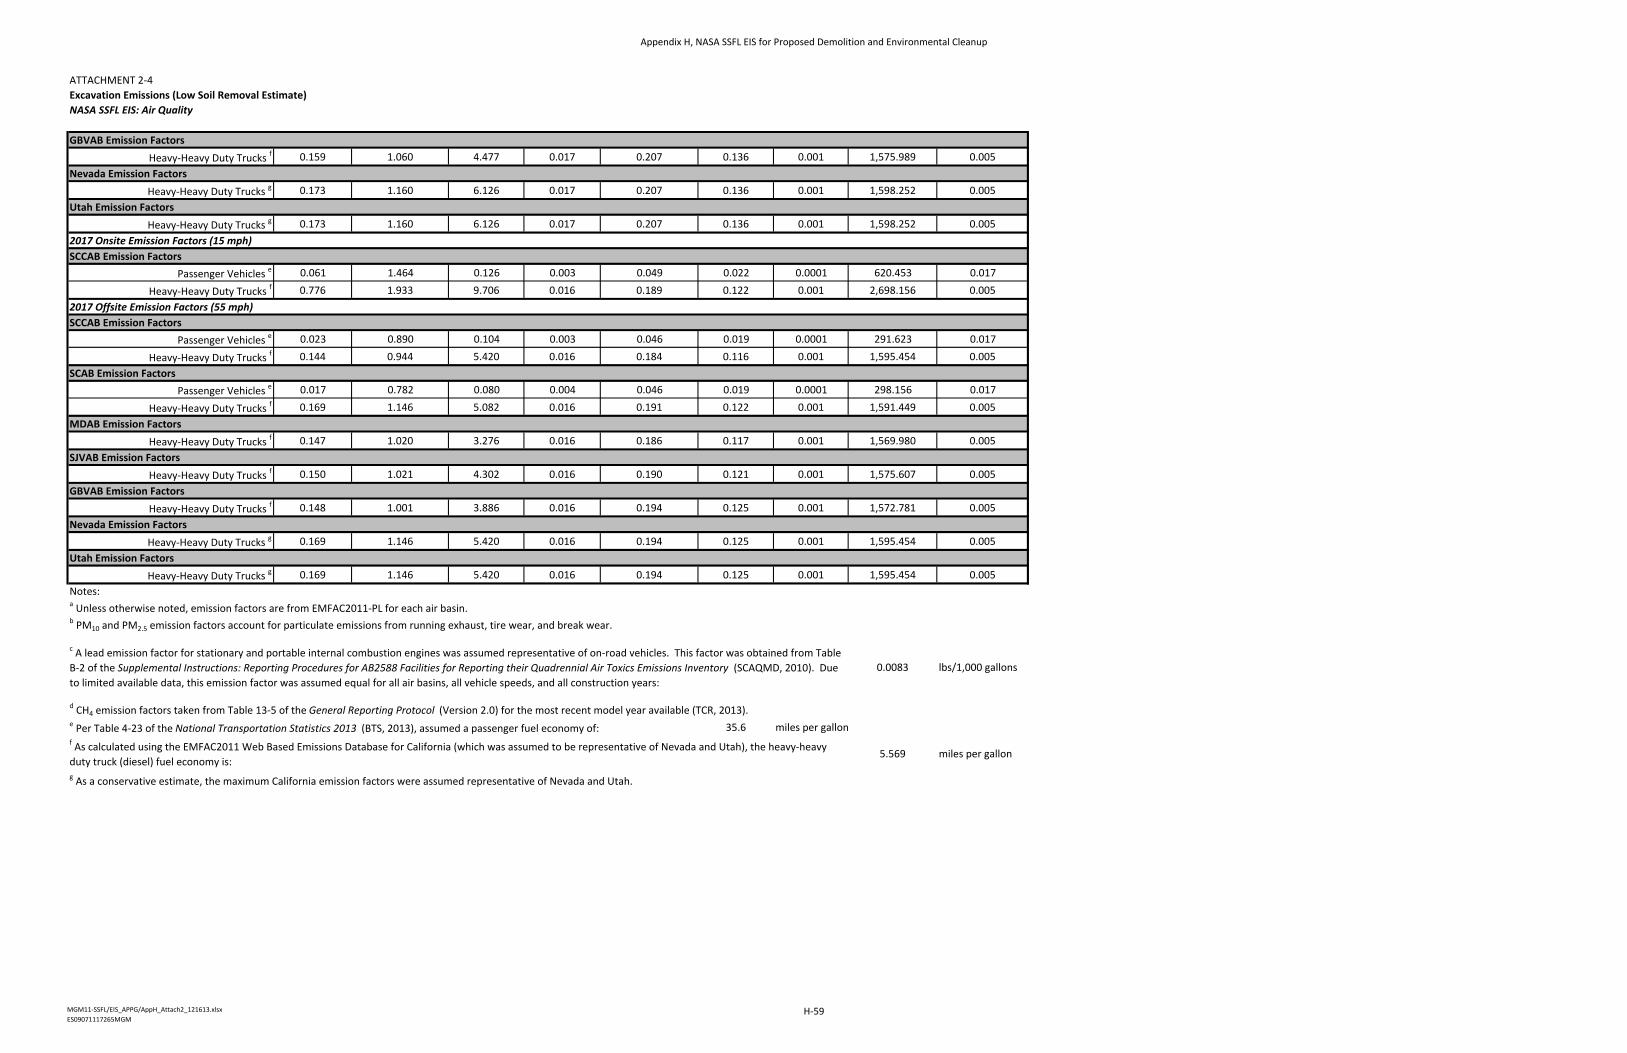
ATTACHMENT 2‐4Excavation Emissions (Low Soil Removal Estimate)
NASA SSFL EIS: Air Quality
GBVAB Emission Factors
Heavy‐Heavy Duty Trucks f 0.159 1.060 4.477 0.017 0.207 0.136 0.001 1,575.989 0.005Nevada Emission Factors
Heavy‐Heavy Duty Trucks g 0.173 1.160 6.126 0.017 0.207 0.136 0.001 1,598.252 0.005Utah Emission Factors
Heavy‐Heavy Duty Trucks g 0.173 1.160 6.126 0.017 0.207 0.136 0.001 1,598.252 0.0052017 Onsite Emission Factors (15 mph)SCCAB Emission Factors
Passenger Vehicles e 0.061 1.464 0.126 0.003 0.049 0.022 0.0001 620.453 0.017
Heavy‐Heavy Duty Trucks f 0.776 1.933 9.706 0.016 0.189 0.122 0.001 2,698.156 0.0052017 Offsite Emission Factors (55 mph)SCCAB Emission Factors
Passenger Vehicles e 0.023 0.890 0.104 0.003 0.046 0.019 0.0001 291.623 0.017
Heavy‐Heavy Duty Trucks f 0.144 0.944 5.420 0.016 0.184 0.116 0.001 1,595.454 0.005SCAB Emission Factors
Passenger Vehicles e 0.017 0.782 0.080 0.004 0.046 0.019 0.0001 298.156 0.017
Heavy‐Heavy Duty Trucks f 0.169 1.146 5.082 0.016 0.191 0.122 0.001 1,591.449 0.005MDAB Emission Factors
Heavy‐Heavy Duty Trucks f 0.147 1.020 3.276 0.016 0.186 0.117 0.001 1,569.980 0.005SJVAB Emission Factors
Heavy‐Heavy Duty Trucks f 0.150 1.021 4.302 0.016 0.190 0.121 0.001 1,575.607 0.005GBVAB Emission Factors
Heavy‐Heavy Duty Trucks f 0.148 1.001 3.886 0.016 0.194 0.125 0.001 1,572.781 0.005Nevada Emission Factors
Heavy‐Heavy Duty Trucks g 0.169 1.146 5.420 0.016 0.194 0.125 0.001 1,595.454 0.005Utah Emission Factors
Heavy‐Heavy Duty Trucks g 0.169 1.146 5.420 0.016 0.194 0.125 0.001 1,595.454 0.005Notes:a Unless otherwise noted, emission factors are from EMFAC2011‐PL for each air basin.b PM10 and PM2.5 emission factors account for particulate emissions from running exhaust, tire wear, and break wear.
0.0083 lbs/1,000 gallons
d CH4 emission factors taken from Table 13‐5 of the General Reporting Protocol (Version 2.0) for the most recent model year available (TCR, 2013).e Per Table 4‐23 of the National Transportation Statistics 2013 (BTS, 2013), assumed a passenger fuel economy of: 35.6 miles per gallon
5.569 miles per gallon
g As a conservative estimate, the maximum California emission factors were assumed representative of Nevada and Utah.
f As calculated using the EMFAC2011 Web Based Emissions Database for California (which was assumed to be representative of Nevada and Utah), the heavy‐heavy duty truck (diesel) fuel economy is:
c A lead emission factor for stationary and portable internal combustion engines was assumed representative of on‐road vehicles. This factor was obtained from Table B‐2 of the Supplemental Instructions: Reporting Procedures for AB2588 Facilities for Reporting their Quadrennial Air Toxics Emissions Inventory (SCAQMD, 2010). Due to limited available data, this emission factor was assumed equal for all air basins, all vehicle speeds, and all construction years:
MGM11‐SSFL/EIS_APPG/AppH_Attach2_121613.xlsxES09071117265MGM
Appendix H, NASA SSFL EIS for Proposed Demolition and Environmental Cleanup
H-59

This page intentionally left blank.
Appendix H, NASA SSFL EIS for Proposed Demolition and Environmental Cleanup
H-60
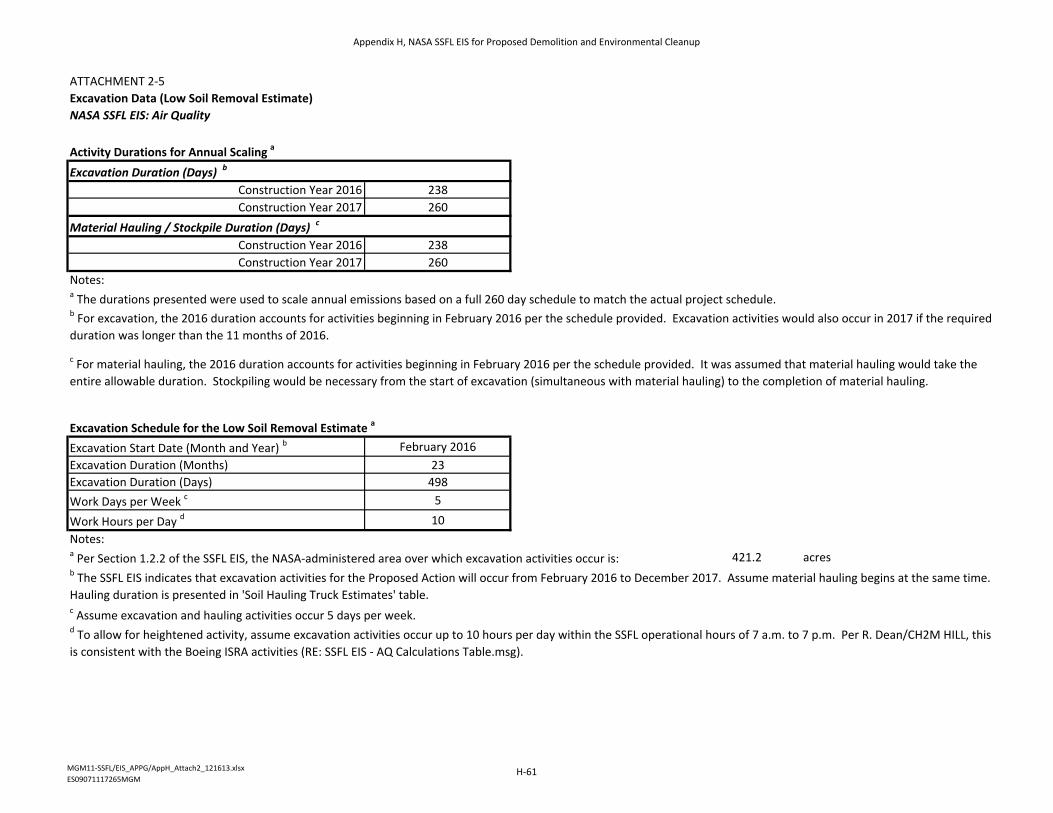
ATTACHMENT 2‐5Excavation Data (Low Soil Removal Estimate)
NASA SSFL EIS: Air Quality
Activity Durations for Annual Scaling a
Excavation Duration (Days) b
Construction Year 2016 238Construction Year 2017 260
Material Hauling / Stockpile Duration (Days) c
Construction Year 2016 238Construction Year 2017 260
Notes:a The durations presented were used to scale annual emissions based on a full 260 day schedule to match the actual project schedule.
Excavation Schedule for the Low Soil Removal Estimate a
Excavation Start Date (Month and Year) b February 2016Excavation Duration (Months) 23Excavation Duration (Days) 498Work Days per Week c 5
Work Hours per Day d 10Notes:a Per Section 1.2.2 of the SSFL EIS, the NASA‐administered area over which excavation activities occur is: 421.2 acres
c Assume excavation and hauling activities occur 5 days per week.d To allow for heightened activity, assume excavation activities occur up to 10 hours per day within the SSFL operational hours of 7 a.m. to 7 p.m. Per R. Dean/CH2M HILL, this is consistent with the Boeing ISRA activities (RE: SSFL EIS ‐ AQ Calculations Table.msg).
b For excavation, the 2016 duration accounts for activities beginning in February 2016 per the schedule provided. Excavation activities would also occur in 2017 if the required duration was longer than the 11 months of 2016.
c For material hauling, the 2016 duration accounts for activities beginning in February 2016 per the schedule provided. It was assumed that material hauling would take the entire allowable duration. Stockpiling would be necessary from the start of excavation (simultaneous with material hauling) to the completion of material hauling.
b The SSFL EIS indicates that excavation activities for the Proposed Action will occur from February 2016 to December 2017. Assume material hauling begins at the same time. Hauling duration is presented in 'Soil Hauling Truck Estimates' table.
MGM11‐SSFL/EIS_APPG/AppH_Attach2_121613.xlsxES09071117265MGM
Appendix H, NASA SSFL EIS for Proposed Demolition and Environmental Cleanup
H-61
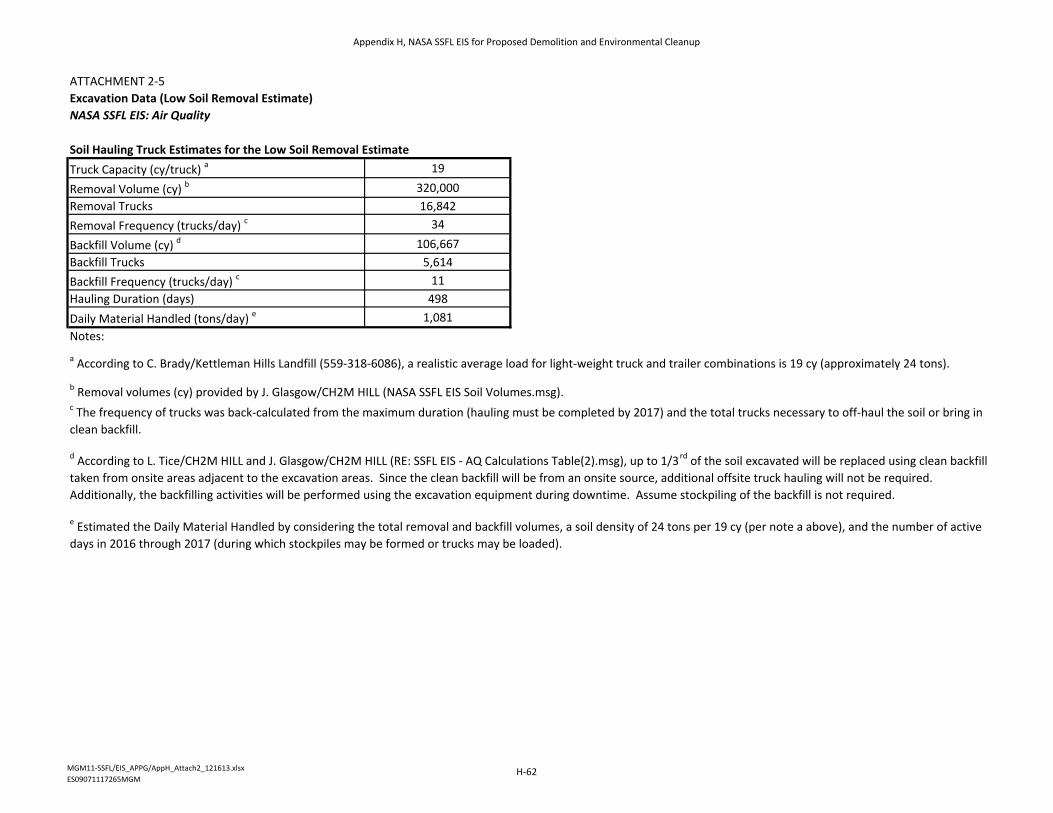
ATTACHMENT 2‐5Excavation Data (Low Soil Removal Estimate)
NASA SSFL EIS: Air Quality
Soil Hauling Truck Estimates for the Low Soil Removal Estimate
Truck Capacity (cy/truck) a 19
Removal Volume (cy) b 320,000Removal Trucks 16,842Removal Frequency (trucks/day) c 34
Backfill Volume (cy) d 106,667Backfill Trucks 5,614Backfill Frequency (trucks/day) c 11Hauling Duration (days) 498Daily Material Handled (tons/day) e 1,081Notes:
b Removal volumes (cy) provided by J. Glasgow/CH2M HILL (NASA SSFL EIS Soil Volumes.msg).c The frequency of trucks was back‐calculated from the maximum duration (hauling must be completed by 2017) and the total trucks necessary to off‐haul the soil or bring in clean backfill.
d According to L. Tice/CH2M HILL and J. Glasgow/CH2M HILL (RE: SSFL EIS ‐ AQ Calculations Table(2).msg), up to 1/3rd of the soil excavated will be replaced using clean backfill taken from onsite areas adjacent to the excavation areas. Since the clean backfill will be from an onsite source, additional offsite truck hauling will not be required. Additionally, the backfilling activities will be performed using the excavation equipment during downtime. Assume stockpiling of the backfill is not required.
e Estimated the Daily Material Handled by considering the total removal and backfill volumes, a soil density of 24 tons per 19 cy (per note a above), and the number of active days in 2016 through 2017 (during which stockpiles may be formed or trucks may be loaded).
a According to C. Brady/Kettleman Hills Landfill (559‐318‐6086), a realistic average load for light‐weight truck and trailer combinations is 19 cy (approximately 24 tons).
MGM11‐SSFL/EIS_APPG/AppH_Attach2_121613.xlsxES09071117265MGM
Appendix H, NASA SSFL EIS for Proposed Demolition and Environmental Cleanup
H-62
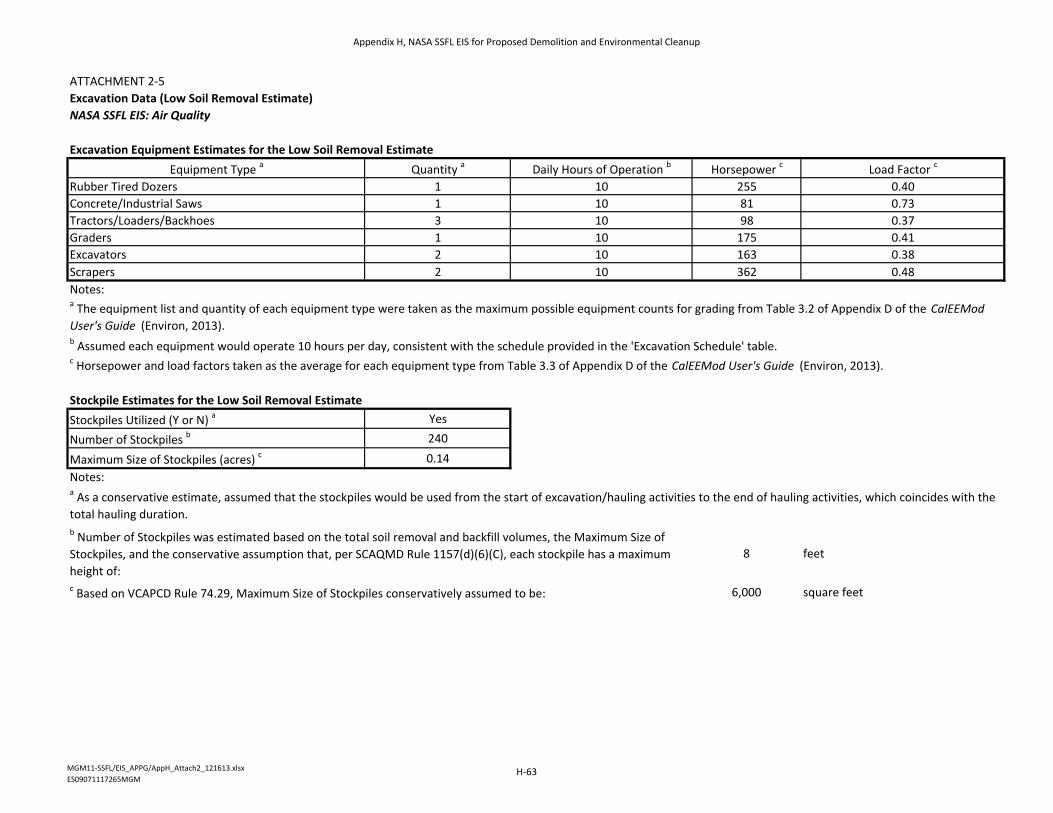
ATTACHMENT 2‐5Excavation Data (Low Soil Removal Estimate)
NASA SSFL EIS: Air Quality
Excavation Equipment Estimates for the Low Soil Removal Estimate
Equipment Type a Quantity a Daily Hours of Operation b Horsepower c Load Factor c
Rubber Tired Dozers 1 10 255 0.40Concrete/Industrial Saws 1 10 81 0.73Tractors/Loaders/Backhoes 3 10 98 0.37Graders 1 10 175 0.41Excavators 2 10 163 0.38Scrapers 2 10 362 0.48Notes:
b Assumed each equipment would operate 10 hours per day, consistent with the schedule provided in the 'Excavation Schedule' table.c Horsepower and load factors taken as the average for each equipment type from Table 3.3 of Appendix D of the CalEEMod User's Guide (Environ, 2013).
Stockpile Estimates for the Low Soil Removal Estimate
Stockpiles Utilized (Y or N) a Yes
Number of Stockpiles b 240
Maximum Size of Stockpiles (acres) c 0.14Notes:
8 feet
c Based on VCAPCD Rule 74.29, Maximum Size of Stockpiles conservatively assumed to be: 6,000 square feet
a The equipment list and quantity of each equipment type were taken as the maximum possible equipment counts for grading from Table 3.2 of Appendix D of the CalEEMod
User's Guide (Environ, 2013).
b Number of Stockpiles was estimated based on the total soil removal and backfill volumes, the Maximum Size of Stockpiles, and the conservative assumption that, per SCAQMD Rule 1157(d)(6)(C), each stockpile has a maximum height of:
a As a conservative estimate, assumed that the stockpiles would be used from the start of excavation/hauling activities to the end of hauling activities, which coincides with the total hauling duration.
MGM11‐SSFL/EIS_APPG/AppH_Attach2_121613.xlsxES09071117265MGM
Appendix H, NASA SSFL EIS for Proposed Demolition and Environmental Cleanup
H-63

ATTACHMENT 2‐5Excavation Data (Low Soil Removal Estimate)
NASA SSFL EIS: Air Quality
Crew Member Estimates for the Low Soil Removal Estimate
Round Trip Distance Traveled to Site (miles) a, b 40
Round Trip Distance Traveled Onsite (miles) a, c 4
Number of Crew Members d 15Notes:a Assumed that crew members travel to the site using personal vehicles and are transported around the site using 15‐passenger vans.
c The round trip distance crew members may travel onsite was assumed to be the same distance as that for demolition activities (see Attachment 1‐7).d Assumed 15 crew members to allow for at least one crew member per excavation equipment and a few extras.
Worker Commute from Los Angeles County
CountyRoundtrip Distance
(miles) aPercent of Trip Distance Air Basin
Los Angeles 39 98% SCABVentura 1 3% SCCABTotal 40 100%
Notes:
Worker Commute from Ventura County
CountyRoundtrip Distance
(miles) aPercent of Trip Distance Air Basin
Los Angeles 34 85% SCABVentura 6 15% SCCABTotal 40 100%
Notes:
a Per project‐specific data, the roundtrip distance (miles) for commuting is 40 miles. The distance traveled within Los Angeles and Ventura counties was estimated assuming employees travel within Los Angeles County to reach Highway 118 and travel a bit beyond the location for asphalt disposal, as described in Attachment 1‐7.
b The round trip distance crew members may travel to the site was estimated at 40 miles due to the isolated site and surrounding city locations.
a Per project‐specific data, the roundtrip distance (miles) for commuting is 40 miles. If employees live in Los Angeles County, all travel takes place in Los Angeles County once the employee crosses the Los Angeles County border, located approximately 1 mile from the facility entrance.
MGM11‐SSFL/EIS_APPG/AppH_Attach2_121613.xlsxES09071117265MGM
Appendix H, NASA SSFL EIS for Proposed Demolition and Environmental Cleanup
H-64
APPENDIX H SUPPLEMENTAL AIR QUALITY AND GREENHOUSE GAS INFORMATION AND TECHNICAL APPROACH
End of Appendix H
MGM11-SSFL/EIS/APPENDIXH/APPENDIXH.DOCX H-17 ES09071117265MGM
Appendix H, NASA SSFL EIS for Proposed Demolition and Environmental Cleanup
H-65
This page intentionally left blank.
Appendix H, NASA SSFL EIS for Proposed Demolition and Environmental Cleanup
H-66

![DDS C ,bc ]^ · 17 % cell growth DMBL 100.00 ppm DMBL 33.33 ppm DMBL 11.11 ppm control DMBL 3.70 ppm DMBL 1.23 ppm DPBL 100.00 ppm DPBL 33.33 ppm DPBL 11.11 ppm DPBL 3.70 ppmDPBL](https://img.pdfslide.net/doc/110x75/5e775a5ea36baa321a57d8d8/dds-c-bc-17-cell-growth-dmbl-10000-ppm-dmbl-3333-ppm-dmbl-1111-ppm-control.jpg)


![DDS C ,bc ]^ - NEDO · DDS ˘ˇˆ ... DSBL 3.70 ppm DSBL 1.23 ppm BC 100.00 ppm BC 33.33 ppm BC 11.11 ppm BC 3.70 ppm BC 1.23 ppm DMCBL 100.00 ppm DMCBL 33.33 ppm DMCBL 11.11 ppm](https://img.pdfslide.net/doc/110x75/5ad6c02a7f8b9a6d708e8ad8/dds-c-bc-dsbl-370-ppm-dsbl-123-ppm-bc-10000-ppm-bc-3333-ppm.jpg)