Embed Size (px)
Citation preview

1
Cell, Volume 139
Supplemental Data
Dissociation of EphB2 Signaling
Pathways Mediating Progenitor Cell
Proliferation and Tumor Suppression Maria Genander, Michael M. Halford, Nan-Jie Xu, Malin Eriksson, Zuoren Yu, Zhaozhu Qiu, Anna Martling, Gedas Greicius, Sonal Thakar, Timothy Catchpole, Michael J. Chumley, Sofia Zdunek, Chenguang Wang, Torbjörn Holm, Stephen P. Goff, Sven Pettersson, Richard G. Pestell, Mark Henkemeyer, and Jonas Frisén Supplemental Experimental Procedures Generation of mutant mice A contig was assembled in pBeloBAC11 from previously described genomic mouse DNA EphB2 lambda phage clones 5.2 and 7.2 (Henkemeyer et al., 1996) using homologous recombination in E. coli. EphB2 exon 12 (for K661R EphB2), exon 17 (for PDZ ∆VEV EphB2) or exons 12 and 17 (for K661R PDZ ∆VEV EphB2) was then targeted, again using homologous recombination in E. coli, with a pL452-based minitargeting vector (Liu et al., 2003) containing EphB2 homology arms; a wild-type 400 bp 5’-arm and an 800 bp, codon 661-mutated (AAG→AGG) 3’-arm to yield pBeloBAC11.EphB2K661R, a 1000 bp 5’-arm with a deletion of codons 992-994 and a wild-type 400 bp 3’-arm flanking a FRT-PPGK/EM7.hygro.pA-FRT cassette to yield pBeloBAC11.EphB2∆VEV994 and EphB2 homology arms flanking selectable marker expression cassettes to yield pBeloBAC11.EphB2K661R/ΔVEV994. An EphB2 targeting vector was produced by homologous recombination-mediated retrieval of the modification-containing fragment(s) from pBeloBAC11.EphB2 into pL254 (a modified form of pL253 (Liu et al., 2003) with a DT-A expression cassette and unique AscI site for linearization). All sequences and further details of DNA engineering are available upon request. R1 ES cells were electroporated with AscI-linearized targeting vector, subjected to selection with G418 and gancyclovir and then screened by Southern blotting, all as previously described (Ramirez-Solis et al., 1993). The floxed PPGK/EM7.npt.pA cassette was deleted in the mouse germline of EphB2K661R mice by crossing to Cre recombinase-expressing KCN males. The FRT-flanked PPGK/EM7.hygro.pA cassette was deleted in the mouse germline of EphB2ΔVEV994 mice by crossing to FLP recombinase-expressing males. In the EphB2K661R/ΔVEV994 mice, the floxed PPGK/EM7.npt.pA cassette was deleted in the mouse germline by crossing to Cre recombinase-expressing KCN males, while the FRT-flanked PEF1α/Ptn903.hygro.pA cassette was deleted in the germline of Flp recombinase-expressing males. Genotyping was performed using a two-allele three-primer touchdown PCR. For the EphB2 K661R mice, the oligonucleotides neoF2, (5’-TTGGCTACC CGTGATATTGCTGAA-3’); K661RgF1, (5’-GGGGCCCTACTAAAACCATCAC-3’); K661RgR1, (5’-TTCCTGTCCCATCATTCCCATTG-3’) were used. Products were

2
diagnostic of wild-type (300 bp) K661R (671 bp) and K661R∆neo (432 bp) alleles. For the EphB2ΔVEV994 mice the oligonucleotides PEF1gR1 : (5’-GCAGCTAATCCCCGCCG ACGAC-3’), dVEVgF1 (5’-GGGGCGGGACAGGCAAGAGA-3’) and dVEVgR1 (5’-CCGGTGGCAGCTGGAATGGAC-3’). Products were diagnostic of wild-type (342 bp), ∆VEV994 (598 bp) and ∆hygro (491 bp) alleles. All primers were combined in order to genotype the EphB2 K661R/ΔVEV994 mice. TOPGAL mouse analysis Tissue was fixed in 0.2% glutaraldehyde in PBS at 4º C, permeabilized in 2xpermeabilization buffer (4mM MgCl2, 0.02% NaDOX, 0.04% NP40), after which β-galactosidase was detected using X-gal at a final concentration of 1mg/ml for up to 72 hours at room temperature (He et al., 2007). The tissue was then paraffin sectioned and counterstained. The number of β-galactosidase positive cells in the small intestine was quantified using light microscopy. Administration of compounds to mice Adult male C57/Bl6 mice were used for all injection experiments. The mice received either 100 µg of ephrin-B2-Fc in PBS (repeated at day 3 for animals analyzed at day 7), administered through the tail vein, or intraperitoneal injection of Gleevec (Imatinib mesylate, Novartis, Switzerland) at a concentration of 100 mg/kg. Gleevec was administered every 12th hour to animals sacrificed after 24 hours and once a day to animals sacrificed after 72 hours. LY294002 was administered intraperitoneally once daily for either three or seven days at a concentration of 30 mg/kg. Two hours before sacrifice, animals received BrdU (100mg/kg 0.09% NaCl in PBS), after which they were transcardially perfused with 4% formaldehyde in PBS. Tissues were dissected out and postfixed over night in 4% formaldehyde before being cryoprotected in 20% sucrose in PBS and sectioned at 12 µm on a cryostat. Microarray analysis Animals were injected with either control protein (Fc) or ephrin-B2-Fc (100 µg/animal) and sacrificed 3 or 12 hours after injection (n=4 in each group). The analysis was carried out on whole colon, as the relative proportion of crypt cells to other cells is larger compared to the small intestine. Total RNA was extracted from rinsed colons using Trizol (Invitrogen) according to manufacturers protocol. Affymetrix Gene Chip Mouse Genome 430A 2.0 was used for the hybridization and all data was analyzed using GeneSifter, Panther (Thomas et al., 2003; Thomas et al., 2006) or GOTM software (http://bioinfo.vanderbilt.edu/gotm/). All samples were normalized according to the Affymetrix MAS5 method after which we applied the MultiDimentional Scaling approach in order to appreciate differences between the samples. The samples clustered into three groups, corresponding to the Fc, ephrin-B2-Fc 3 hours and ephrin-B2-Fc 12 hours respectively (Figure S14). All original data are uploaded using Tab2MAGE submission to ArrayExpress in compliance with MIAME standards (ArrayExpress accession: E-TABM-753). Quantitative PCR

3
RNA extraction was done using Trizol (Invitrogen) following the manufacturer’s protocol. RNA was stored at -80°C and cDNA was stored at -20°C. RNA quality was assessed using NanoDrop (NanoDrop Technologies Inc.): 260/280 = 1.90-2.12, 260/230 = 1.98-2.25. For the reverse transcription reaction, SuperScript III First Strand (18080-051; Invitrogen) was used. mRNA levels were measured by relative quantification using the standard curve method on a 7300 Real Time PCR System from Applied Biosystems. The standard was made from Mouse Reference Total RNA (750600; Stratagene QPCR). Melting point analysis was performed for all genes to verify that only the desired product had been amplified. β2-microglobulin was used as the internal control against which all individual samples were normalized. The mean value for each group was calculated and the experimental group was normalized against the control group. Immunohistochemical analysis Cryosections were rinsed in PBS, blocked in 5% goat serum in PBS and incubated with primary antibody at 4˚C over night, washed again in PBS and then incubated with a secondary antibody conjugated to a fluorophor (1:1000, Jackson Laboratories) or to biotin (1:250, Jackson Laboratories). Biotinylated secondary antibodies were detected using the ABC (VectorLab) and TSA-Cy3 (PerkinElmer) system. BrdU detection required 2M HCl treatment at 37˚ C for 30 minutes. Cyclin D1 levels were detected using the Unmasking Solution from Vector Laboratories (H-3300). Apoptotic cells were detected using the Apoptag Plus Peroxidase In Situ Kit (Chemicon), and the number of positive cells was quantified in each crypt. Goblet cells were detected using an Alcian Blue standard histochemical protocol. Western blot analysis Tissue taken for western blot analysis was put in ice cold lysis buffer (1M Tris pH 8, 5M NaCl, 10% NP-40, 10% SDS, 10% Na desoxycholate in H20), mixed with Complete protease inhibitor cocktail (Roche) and homogenized using a rotor. Lysates were either analyzed directly using NuPage blot system (Invitrogen) or used for immunoprecipitation using anti-EphB2 (0.2ug/100µl lysate) for 4 hours on ice and then pulled down using Protein A/G sepharose (Amersham) for 1.5 hours on ice. Normalization was performed in two steps. All samples were first normalized to either β -actin or GAPDH, after which the mean value for each group was calculated and the experimental group was normalized against the control group. Antibodies Antibodies used for immunohistochemistry were rat anti-BrdU (Trichem, Denmark, 1:200), rabbit anti-Ki67 (NeoMarkers, 1:200), goat anti-EphB2 (RnD Systems, 1:500), rabbit anti-Lysozyme (Dako, 1:200) and rabbit anti-cyclin D1 Ab-3 (Neomarkers, 1:100). Antibodies used for Western blot analysis were mouse anti-PCNA Ab-1 (Oncogene, 1:1000), mouse anti-cyclin D1 DCS-6 (NeoMarkers, 1:2000), rabbit anti-cyclin D1 (Abcam ab16663, 1:500), mouse anti-cyclin D2 (Abcam, 1:200), mouse anti-cyclin D3 DCS22 (Cell Signaling, 1:1000), mouse anti-phosphotyrosine clone 4G10 (Upstate, 1:1000), mouse anti-GAPDH (Chemicon, 1:1000), mouse anti- β-actin (Sigma Aldrich, 1:5000), goat anti-EphB2 (RnD Systems, 1:500) and rabbit anti-chromogranin A+B (Progen, 1:50).

4
Electroporation Small intestine from embryonic day 15 embryos were dissected out and expression plasmids for Abl shRNA and GFP or GFP only (10µg/ul in PBS) was injected into the lumen of a 0.5 cm intestinal segment. The tissue was submerged in PBS and electorporated using 5 pulses (50ms and 60V) using a CUY21 EDIT electroporator (Sonidel). The tissue segments were kept in hanging cultures as described (Hearn et al., 1999) and grown in DMEM:F12 with 10% FBS and 1% penicillin/streptomycin for 15 hours. Before fixation in 4% formaldehyde, BrdU (40ug/mL) was added to the cultures for 1 hour. Cell culture Non-toxic concentrations for all inhibitors were determined using dilution series. Cells were exposed to BrdU (10 µM) for 30 minutes before they were fixed using 4% formaldehyde or lysed using western blot lysis buffer. Ls174t or KM12 cells were labeled using DiD (V22889 Molecular Probes) and mixed at a 1:1 ratio with either 293t or 293t-ephrin B2-GFP expressing cells and plated in 6-well plate at a density of 5.5x10⁵ cells/cm2. At this density, cells cover the entire plate after attachment, and are forced to interact with each other. The colon carcinoma cells were FACS purified 18 hours later based on the DiD expression and put in lysis buffer for analysis. shRNA transfections shRNAs for Abl-1 were purchased from Invitrogen (K4935-00) and sub cloned into a GFP-containing backbone. Constructs were verified by transfecting 3T3 cell lines with Lipofectamine 2000 (11668-027 Invitrogen) according to manufacturer’s protocol, after which transfected and non-transfected cells were FACS purified and analyzed using qRT-PCR for Abl RNA expression. Transfection of HT-29 cells was also performed using Lipofectamine 2000 and 24 hours later, cells transfected with either GFP only or Abl shRNA GFP were FACS purified and analyzed using western blot. In vitro cell positioning assay 293t cells and 293t-ephrin-B2-GFP expressing cells were mixed at a 2:1 ratio and plated in a 24-well plate at a density of 1.3x10⁴ cells/cm2. The cells were cultured for up to 48 hours until they reached confluency. Ls174t colon carcinoma cells were labeled using DiD (V22889 Molecular Probes) according to the manufacturers protocol and then plated on top of the 293t mosaic at a density of 50 000 cells/well. LY294002 (1-5µM) was added to the cultures and the cells were fixed using 4% formaldehyde 18 hours later. Quantitative assessment of cell positioning Quantification of Paneth cell positioning was done by measuring the distance of each Paneth cell from the crypt bottom. The average distance for each crypt was calculated by dividing the total distance per crypt with the total number of Paneth cells per crypt. The positioning of neuroendocrine cells and goblet cells was assessed by quantifying the number of respective cell type within the crypt. The length occupied by Ki67+ cells in the crypt was measured to assess the distribution of proliferating progenitor cells.

5
Supplemental References He, X.C., Yin, T., Grindley, J.C., Tian, Q., Sato, T., Tao, W.A., Dirisina, R., Porter-Westpfahl, K.S., Hembree, M., Johnson, T., et al. (2007). PTEN-deficient intestinal stem cells initiate intestinal polyposis. Nat Genet 39, 189-198. Hearn, C.J., Young, H.M., Ciampoli, D., Lomax, A.E., and Newgreen, D. (1999). Catenary cultures of embryonic gastrointestinal tract support organ morphogenesis, motility, neural crest cell migration, and cell differentiation. Dev Dyn 214, 239-247. Henkemeyer, M., Orioli, D., Henderson, J.T., Saxton, T.M., Roder, J., Pawson, T., and Klein, R. (1996). Nuk controls pathfinding of commissural axons in the mammalian central nervous system. Cell 86, 35-46. Liu, P., Jenkins, N.A., and Copeland, N.G. (2003). A highly efficient recombineering-based method for generating conditional knockout mutations. Genome Research 13, 476-484. Ramirez-Solis, R., Davis, A.C., and Bradley, A. (1993). Gene targeting in embryonic stem cells. Methods in enzymology 225, 855-878. Thomas, P.D., Campbell, M.J., Kejariwal, A., Mi, H., Karlak, B., Daverman, R., Diemer, K., Muruganujan, A., and Narechania, A. (2003). PANTHER: a library of protein families and subfamilies indexed by function. Genome research 13, 2129-2141. Thomas, P.D., Kejariwal, A., Guo, N., Mi, H., Campbell, M.J., Muruganujan, A., and Lazareva-Ulitsky, B. (2006). Applications for protein sequence-function evolution data: mRNA/protein expression analysis and coding SNP scoring tools. Nucleic acids research 34, W645-650.
6
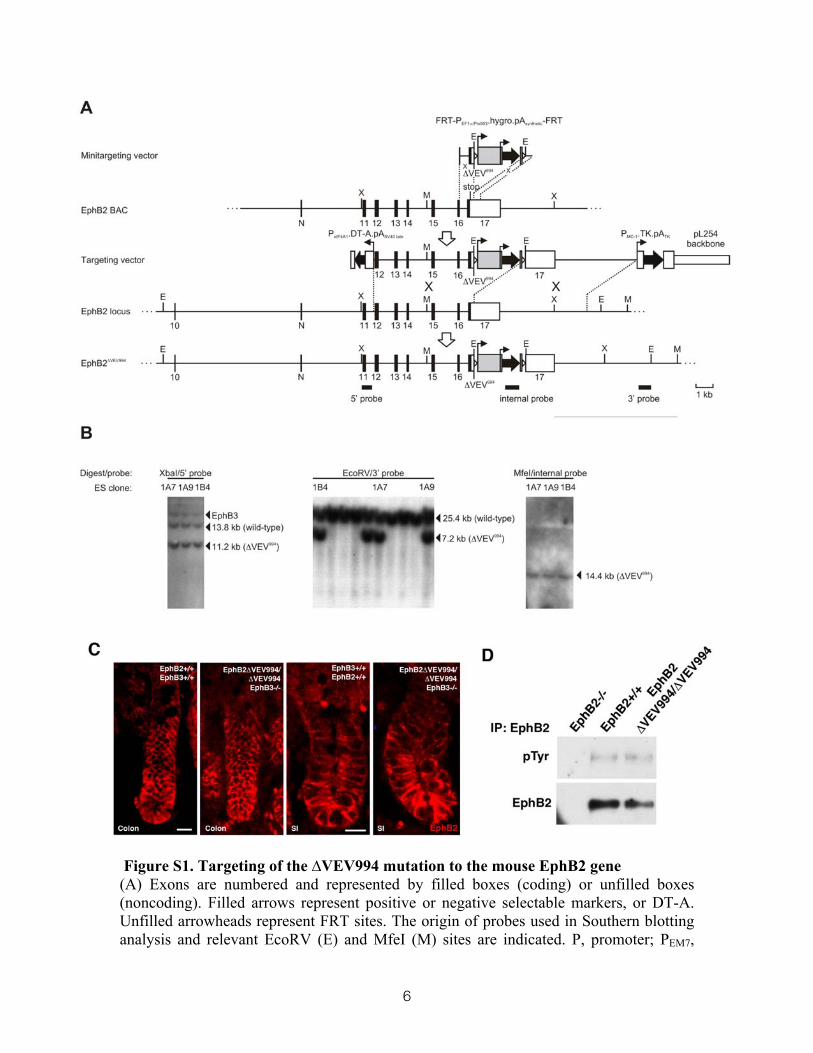
Figure S1. Targeting of the ∆VEV994 mutation to the mouse EphB2 gene (A) Exons are numbered and represented by filled boxes (coding) or unfilled boxes (noncoding). Filled arrows represent positive or negative selectable markers, or DT-A. Unfilled arrowheads represent FRT sites. The origin of probes used in Southern blotting analysis and relevant EcoRV (E) and MfeI (M) sites are indicated. P, promoter; PEM7,

7
bacterial promoter; PGK, mouse phosphoglycerate kinase; pA, polyadenylation signal; eIF4A1, mouse eukaryotic initiation factor 4A1; hygro, hygromycin phosphotransferase; DT-A, diphtheria toxin-A chain; TK, HSV thymidine kinase; N, novel exon. (B) Southern blot analysis of three targeted ES cell clones (1A7, 1A9 and 1B4) subsequently used to create chimeric mice. (C) Immunohistochemical detection of EphB2 demonstrates unaltered distribution in EphB2 ∆VEV994/∆VEV994; EphB3 -/- mice compared to wild type mice. (D) EphB2 tyrosine phosphorylation is unaltered in the colon of EphB2 ∆VEV994/∆VEV994 mice compared to wild type mice. Scale bars=10µm.
8
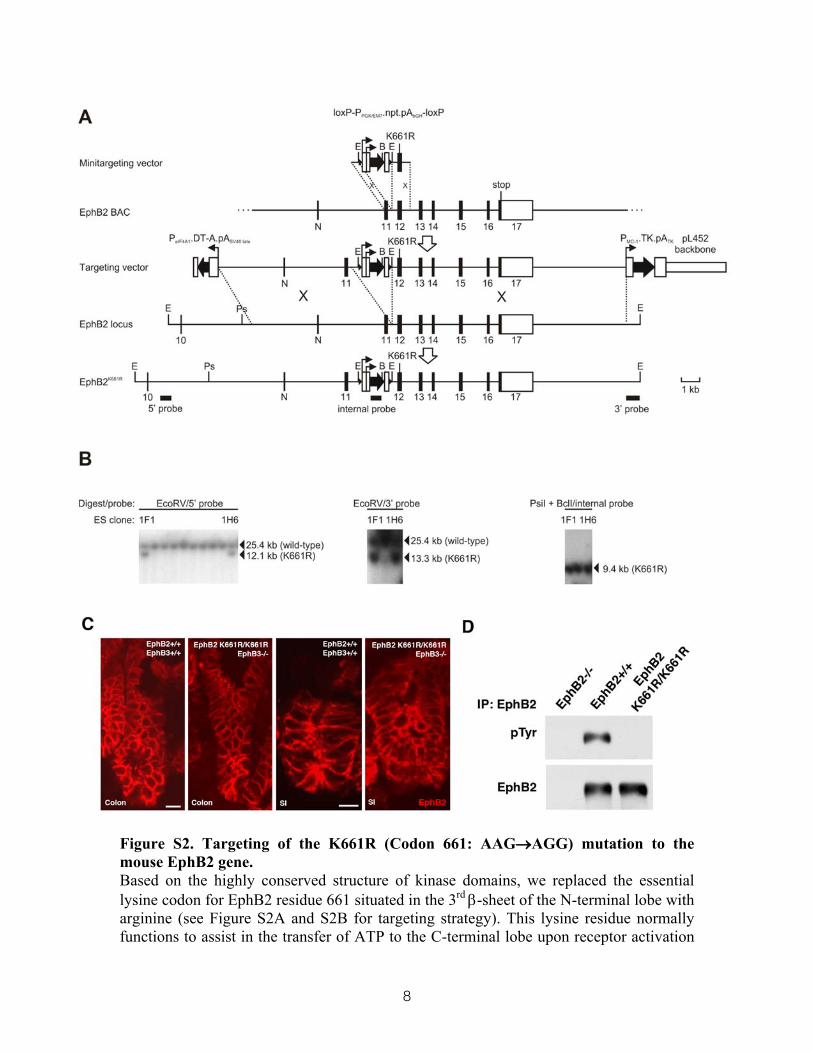
Figure S2. Targeting of the K661R (Codon 661: AAG→AGG) mutation to the mouse EphB2 gene. Based on the highly conserved structure of kinase domains, we replaced the essential lysine codon for EphB2 residue 661 situated in the 3rd β-sheet of the N-terminal lobe with arginine (see Figure S2A and S2B for targeting strategy). This lysine residue normally functions to assist in the transfer of ATP to the C-terminal lobe upon receptor activation

9
through formation of a salt bridge (Wybenga-Groot et al, Cell, 2001, 106: 745-57). Disruption of this salt bridge through the K661R substitution prevents the self-activating phosphorylation of the kinase domain and hence kinase-dependent signaling. (A) Exons are numbered and represented by filled boxes (coding) or unfilled boxes (noncoding). Filled arrows represent positive or negative selectable markers, or DT-A. Filled arrowheads represent loxP sites. The origin of probes used in Southern blot analysis and relevant EcoRV (E), PsiI (Ps) and BclI (B) sites are indicated. P, promoter; PGK, phosphoglycerate kinase; npt, neomycin phosphotransferase; pA, polyadenylation signal; eIF4A1, mouse eukaryotic initiation factor 4A1; DT-A, diphtheria toxin-A chain; PEM7, baterial promoter; TK, HSV thymidine kinase; N, novel exon. (C) Immunohistochemical detection of EphB2 demonstrates unaltered distribution in EphB2 K661R/K661R; EphB3 -/- mice compared to wild type mice. (D) EphB2 tyrosine phosphorylation is abolished in the colon of EphB2 K661R/K661R mice. Scale bars=10µm.

10
Figure S3. Targeting of the K661R/ΔVEV994 (codon 661: AAG→AGG; ∆codons 992-994) mutations to the mouse EphB2 gene (A) Targeting strategy. Exons are numbered and represented by filled boxes (coding) or unfilled boxes (non-coding). Filled arrows represent positive or negative selectable markers, or DT-A. Filled arrowheads represent loxP sites, unfilled arrowheads represent FRT sites. The origin of probes used in Southern blot analysis and relevant EcoRV (E), PsiI (Ps), MfeI (M) and BclI (B) sites are indicated. P, promoter; PGK, phosphoglycerate kinase; PEM7, bacterial promoter; npt, neomycin phosphotransferase; hygro, hygromycin phosphotransferase; pA, polyadenylation signal; eIF4A1, mouse eukaryotic initiation factor 4A1; EF1a, mouse EF1a; DT-A, diphtheria toxin-A chain; TK, HSV thymidine

11
kinase; N, novel exon. (B) Southern blotting analysis of three targeted ES cell clones (1B1, 1B7 and 1B8) subsequently used to create chimeric mice. (C) Immunohistochemical detection of EphB2 demonstrates unaltered levels and distribution in EphB2 K661R;∆VEV994/K661R;∆VEV994; EphB3 -/- mice compared to wild type mice. Scale bars=10µm.

12
Figure S4. Modulation of EphB2 dissociates proliferation from migration (A and B) Representative images of BrdU incorporation in colon (A) and distribution of Paneth cells visualized by lysozyme-immunoreactivity in the small intestine (B) of mutant mice. Representative images of mucin positive goblet (C) and neuroendocrine cells (D) distributed in small intestine and the corresponding quantifications (E and F). Measurements of the Ki67 positive domain in small intestine reveals that proliferating progenitor cells are more widely distributed in EphB2+/+:EphB3-/- , EphB2+/+; K661R/K661R and EphB2-/-;EphB3-/- as compared to wild type (G). Scale bar in (A)=20µm and (B) =10µm. Data are represented as mean+SEM.

13
Figure S5. Expression of PI3K subunits in the intestine and its regulation by EphB signaling Relative expression of mRNA for PI3K subunits. Data from the microarray analysis described in Figure 1.
Figure S6. EphB signaling does not affect β-catenin mediated transcription Analysis of expression levels for genes identified in colon as being regulated by β-catenin-mediated transcription using qRT-PCR showed that only one gene (c-jun) out of the seven genes analyzed was significantly dysregulated (p=0.03, Student’s t test) in mice 12 hours after ephrin-B2-Fc injection as compared to animals receiving control protein (Fc). Data are represented as mean+SEM.

14
Figure S7. Cell positioning in the intestine in the absence of cyclin D1 (A-D) The systemically adminstered recombinant ephrin-B2-Fc binds EphB receptors in both colon and small intestine (SI) crypts of wild type as well as cyclin D1 mutant mice in a similar pattern, as visualized by using an anti-Fc antibody.

15
(E-H) EphB2-immunoreactivity forms a similar gradient pattern in the small intestine of wild type and cyclin D1-/- mice. Injection of ephrin-B2-Fc or control Fc protein does not alter the EphB2 levels or distribution. (I-L) Lysozyme (Lys)-immunoreactive Paneth cells are situated at the bottom of the crypts in the small intestine in both wild type and cyclin D1 null mice. Paneth cells are still positioned at the crypt bottom in both wild type and cyclin D1 mutant mice 24h after inhibition of EphB signaling by an injection of ephrin-B2-Fc. Cell nuclei are labeled with DAPI and appear blue. (M) Quantification of the distribution of Paneth cells in the small intestine of cyclin D1 null mice does not reveal evidence for cell dislocation as compared to wild type littermates. Scale bar in (A) and (I)=20µm, in (E)= 10µm. Data are represented as mean+SEM.
Figure S8. EphB2 phosphorylation is not affected by Gleevec Immunoprecipitation of EphB2 from EphB2 F620D/F620D reveals increased levels of phosphorylation, whereas the EphB2 K661R/K661R mutant mice show no detectable phosphorylation in comparison with animals expressing a wild type EphB2 receptor. Administration of Gleevec to EphB2+/+ mice does not affect the level of EphB2 phosphorylation.

16
Figure S9. Effect of ephrin-B2-Fc and Gleevec on apoptosis (A-D) Labeling of apoptotic cells by TUNEL in animals injected with ephrin-B2-Fc, Gleevec or ephrin-B2-Fc and Gleevec. Cell nuclei are labeled with DAPI and appear blue. (E-F) Quantification of Tunel positive cells revealed no statistically significant difference between animals receiving ephrin-B2-Fc, Gleevec or ephrin-B2-Fc and Gleevec in either colon or small intestine. Data are represented as mean+SEM. Scale bar=20µm.

17
Figure S10. Gleevec inhibits cell proliferation in the intestinal epithelium (A-D) Gleevec administration for three consecutive days result in a statistically significant reduction in BrdU incorporation in both the small intestine and colon. Data are represented as mean+SEM. Scale bar=10µm. * = p≤0.05, ** = p≤0.01, Student’s t test.
Figure S11. Cyclin D1 regulation in response to ephrin-B2 in transformed human intestinal cells (A) EphB expressing Ls174t cells up regulate cyclin D1 when plated together with 293t cells expressing ephrin-B2 but not when plated together with wild type 293t cells. In contrast, plating KM12 cells, a colon carcinoma cell line with low EphB expression, with 293t cells expressing ephrin-B2 does not affect the level of cyclin D1 (B).

18
Figure S12. shRNA suppression of Abl expression results in reduced cyclin D1 levels Two different Abl shRNA probes were used to transfect HT-29 cells. Both give reduced Abl mRNA expression (A) and cyclin D1 protein levels (B-D, see also Figure 7). The degree of reduction of Abl mRNA correlates to the reduction of cyclin D1 protein.

19
Figure S13. EGF and IGF receptor signaling can compensate for the loss of EphB receptors in carcinomas HT-29 cells treated with the EGFR-inhibitor PD153035 displays reduced levels of cyclin D1 in a dose dependent manner (A), whereas the IGF-R1 inhibitor AEW-541 does not alter cyclin D1 levels (B). In KM12 cells, cyclin D1 levels are reduced as cells are exposed to the IGFR1, but not the EGFR inhibitor (C).

20
Figure S14. Clustering analyses of colon samples injected with control Fc protein or ephrin-B2-Fc Analysis of control and ephrin-B2-Fc injected colon reveals that the four control (Fc) replicates cluster together in a group distinct from the ephrin-B2-Fc replicates. The two different time points of ephrin-B2-Fc used for analysis (3h and 12h) also form two separate groups. Based on the clustering results, one replicate was excluded from further analysis (ephrin-B2-Fc 12 hours replicate 1).

21

22

23

24
Table S1. Analysis of differentially expressed genes 12 hours after inhibition of EphB signaling Pair-wise analysis of gene expression data comparing animals injected with ephrinB2-Fc or control protein (Fc) (n=4 in each group) reveals mRNAs up- or down regulated 12 hours after injection. The lists contain transcripts that are differentially expressed in all pair wise comparisons, i.e. 16/16. Corresponding p-values are listed.
25
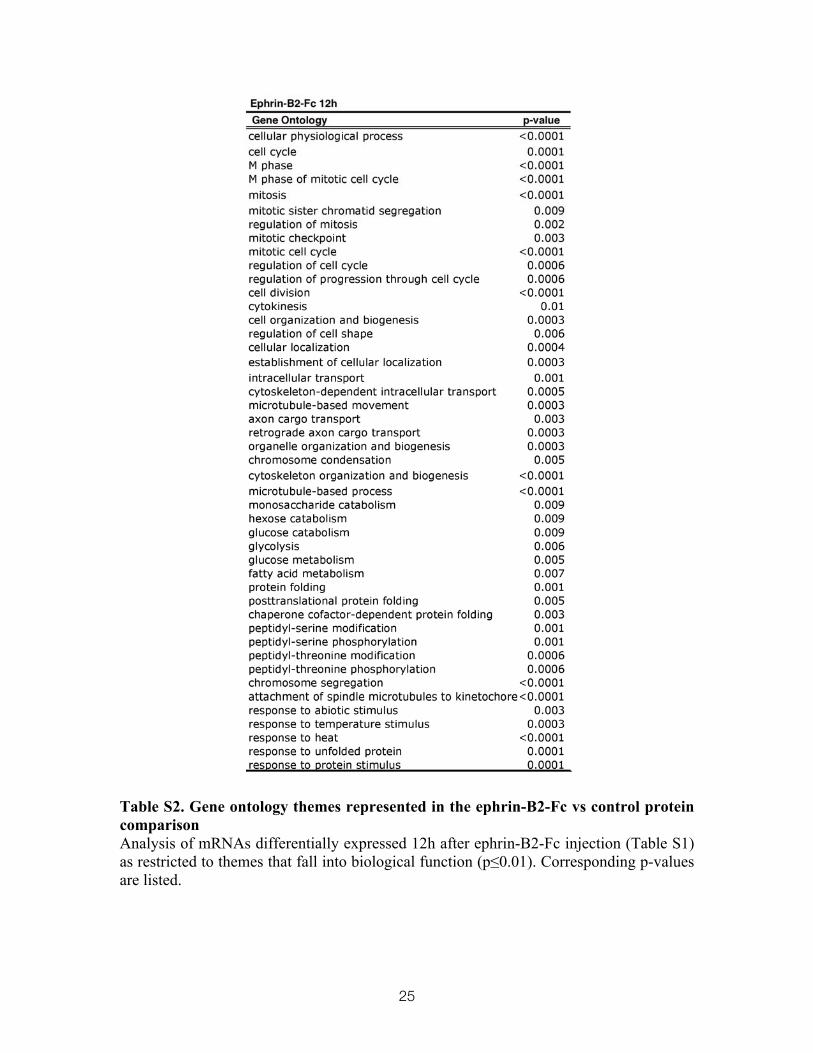
Table S2. Gene ontology themes represented in the ephrin-B2-Fc vs control protein comparison Analysis of mRNAs differentially expressed 12h after ephrin-B2-Fc injection (Table S1) as restricted to themes that fall into biological function (p≤0.01). Corresponding p-values are listed.

26
Table S3. EphB2 and cyclin D1 expression in human tumor samples Quantified levels of EphB2 and cyclin D1 in human tumors after normalization against untransformed tissue from each patient, with corresponding sample number. Average and standard error of the mean is supplied as these values are used for the graph in Figure 7H and the ratio displayed in Figure 7G.