Embed Size (px)
Citation preview

Supplemental Information and Labsfor
Chem 464LBiochemistry I Lab
Fall 2018

Table of Contents
Changes for Experiment (Chapter) 5............................................................................5
Changes for Experiment (Chapters) 1 & 2...................................................................6
Calibrating Vernier pH Probes......................................................................................7
Directions for using the Red Tide USB650 spectrometer for Experiment 3 part A...........................................................................................8
Directions for using the SpectroVis Plus Spectrometer for Experiment 3 part B...........................................................................................9
Notes on Chapter 4 Enzyme Purification Experiment 4a Purifying LDH (Comprehensive Version).................................................................................11
Modified Assay Procedure...........................................................................................12
Using Logger Pro and SpectroVis spectrometer for Tyrosinase Kinetics.....................14
Protein Structure Computer Lab...................................................................................15
Notes for Experiment 8a...............................................................................................19
Notes on running the Lambda 2 spectrometer for an assay.........................................20
Observing Mutarotation in Glucose...............................................................................21Experiment A1. Optical Rotation........................................................................24Experiment A2. Reducing Sugars......................................................................25NMR - Introduction to 2D NMR and NMR Pre-lab Questions............................26NMR - Experimental..........................................................................................36NMR - Analysis of HSQC and COSY on Bruker................................................37
Isolation of DNA from Wheat Germ .............................................................................45
Lipid Lab.......................................................................................................................49
Use of MS5973 Data Analysis program for analysis of GC/MS data............................53

Attention:Students are advised against wearing contact lenses whileobserving or participating in science laboratory activities.
While hard contact lenses do not seem to aggravatechemical splash injuries, soft contact lenses absorb vaporsand may aggravate some chemical exposures, particularly
if worn for extended periods.
Please take your contact lenses out prior to enteringthe laboratory.
Contact Lens Administrative Policy and Waiver Form
Students are advised against wearing contact lenses while observing or participating inscience laboratory activities. While hard contact lenses do not seem to aggravate
chemical splash injuries, soft contact lenses absorb vapors and may aggravate somechemical exposures, particularly if worn for extended periods. You are asked to please
remove your contact lenses prior to entering the laboratory.
If you do not wish to comply with this recommendation, you must fill out the bottomportion of this sheet, which is a waiver form.
Waiver of Liability, Indemnification and MedicalRelease
I am aware of the dangers involved in wearing contact lenses in a science laboratorysetting. On behalf of myself, my executors, administrators, heirs, next of kin,
successors, and assigns, I hereby:
a. waive, release and discharge from any and all liability for my personal injury, propertydamage, or actions of any kind, which may hereafter, accrue to me and my estate, theState of South Dakota, and its officers, agents and employees; and
b. indemnify and hold harmless the State of South Dakota, and its officers, agents andemployees from and against any and all liabilities and claims made by other individualsor entities as a result of any of my actions during this laboratory.
I hereby consent to receive any medical treatment, which may be deemed advisable inthe event of injury during this laboratory.
This release and waiver shall be construed broadly to provide a release and waiver tothe maximum extent permissible under applicable law.
I, the undersigned participant, acknowledge that I have read and understand the aboveRelease.
Name ___________________________________________ Age _________________
Signature _______________________________________ Date _________________
Is there any other medical information you would like us to know:

Changes for Chapter 5 - Experiment 5Separating and Identifying Amino Acids
Note: you are using the SAME unknown in both parts A and B!
Part A1. I will furnish you with a much smaller TLC plate.3. Make room for only 3 or 4 spots. One will be your unknown, and two or three
others will be for standards. Coordinate with another group so that between the two ofyou, you have all the standards covered.
5. As this step says, once you have started developing your TLC, start on part B,and periodically check on the TLC to see if it is done so you can go on to steps 6 and 7.
Part B5. We will use Eppendorf tubes instead of test tubes, any the already have
volume markers6. Apply 0.25 ml of unknown not 0.5. 10. Collect 1.5 ml fractions.11. When analyzing samples, wait until you have all 15 samples for a given pH.11B. Do one additional test. Use a piece of pH paper to determine the pH of
each fraction.12. Collect 15 fractions and change buffer as in step 13, again use a total of 15,
1.5ml fractions with the pH6 buffer.13. Use a total of 15, 1.5 ml fractions of pH11 buffer.
5
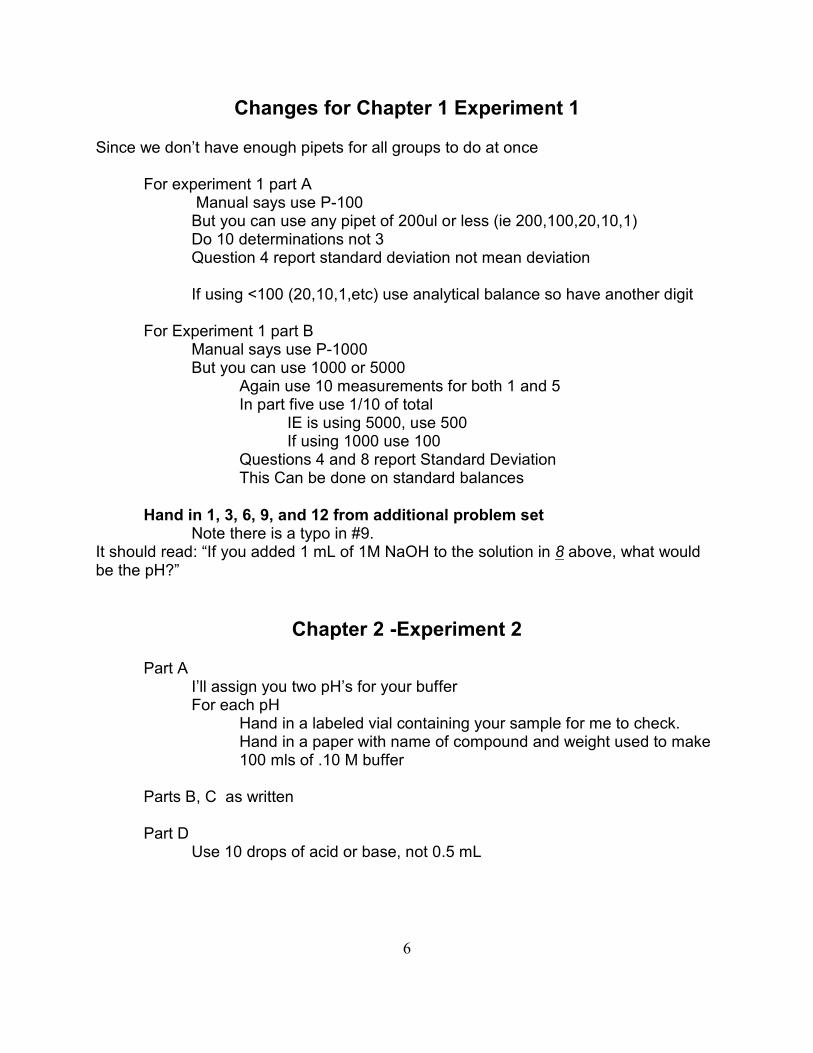
Changes for Chapter 1 Experiment 1
Since we don’t have enough pipets for all groups to do at once
For experiment 1 part A Manual says use P-100But you can use any pipet of 200ul or less (ie 200,100,20,10,1)Do 10 determinations not 3Question 4 report standard deviation not mean deviation
If using <100 (20,10,1,etc) use analytical balance so have another digit
For Experiment 1 part BManual says use P-1000But you can use 1000 or 5000
Again use 10 measurements for both 1 and 5In part five use 1/10 of total
IE is using 5000, use 500If using 1000 use 100
Questions 4 and 8 report Standard DeviationThis Can be done on standard balances
Hand in 1, 3, 6, 9, and 12 from additional problem setNote there is a typo in #9.
It should read: “If you added 1 mL of 1M NaOH to the solution in 8 above, what wouldbe the pH?”
Chapter 2 -Experiment 2
Part AI’ll assign you two pH’s for your bufferFor each pH
Hand in a labeled vial containing your sample for me to check.Hand in a paper with name of compound and weight used to make100 mls of .10 M buffer
Parts B, C as written
Part D Use 10 drops of acid or base, not 0.5 mL
6

Calibrating Vernier pH probes
1. Change from mV to pH (if needed)Touch the Sensor tab
Touch the Change Units buttonTouch the pH button
2. Calibrate the pH systemTouch the Sensor tab
Touch the Calibrate buttonThis will bring up a new windowTouch the Calibrate Now button (Near the top)
Under the Reading 1 SectionChose a buffer that has a pH below your target pHEnter the pH of this buffer using the keypadRinse the pH probe in distilled water and place in this bufferAllow the probe to equilibrate with this buffer for about 30 seconds
(Gently stirring)Touch the Keep button
Under the Reading 2 SectionChose a buffer that has a pH above your target pHEnter the pH of this buffer using the keypadRinse the pH probe in distilled water and place in this bufferAllow the probe to equilibrate with this buffer for about 30 seconds
(Gently stirring)Touch the Keep button
Touch the OK button at the bottom of the window to save yourcalibration
The pH meter is now ready to use.Remember to rinse and blot the pH probe between readings, and to not let the probeget dry.
7

Directions for using the Red Tide USB650 UV spectrometer forExperiment 3 part A (Not 3A)
Turn on LabQuest
Note: This experiment can only be done on the Red Tide Spectrometer, and not theSpectroVis Plus Spectrometer
Calibrate SpectrophotometerClickSensors
Calibrate - USB SpectrometerThis will bring up the calibration window
Do NOT skip warmupWhen the warmup finishes, the ‘Finish Calibration’ button willbecome active. At this point put the Blank containing DI water inthe cuvette, and put the cuvette in the spectrometer
Click the Finish Calibration ButtonWait a few seconds, the button will gray out and the window willread ‘Calibration Completed’
Click OK button at bottom of Window
You should now be in the regular display windowClick the Icon at the top of the screen that looks like a little data tableEmpty your cuvette and load your first sample into the cuvetteClick the green arrow at the bottom left of the screen
The spectrometer will now start reading valuesAfter the data table has filled, click the red box at the bottom left of thescreen to stop taking data.
Use the scroll button on the data table and find the absorbance of yoursample at 340 nm.
This sample is done. For a single beam spectrometer like this you shouldnot trust reading above an absorbance of 1.0. If you sample has anabsorbance above 1, calculate how much it should be diluted to get areading of about .8
Make this dilution and try the experiment again. If your absorbance isbelow 1 you are done. Record the dilution you used and your absorbancevalue in you notebook for analysis later. If your absorbance was not <1, tryagain.
When you have finished this experiment make sure you thoroughly clean the cuvette.
8

Directions for using the SpectroVis Plus spectrometer forExperiment 3 part B
Turn on LabQuest
Perform Experiment B up to step 6 Note on Step 2 DO REACTION IN TEST TUBE NOT CUVETTENote on Step 5 You are adding 3 mL using the RepipetReplace Table 3.1 with the following protocol
Tube 1 2 3 4 5 6 7BSA std (ìL) 0 25 50 75 100 - -Unknown (ìL) - - - - - 10 20Bradford (mL) 3 3 3 3 3 3 3
After your samples have reacted for 10 minutesCalibrate Spectrophotometer
ClickSensors
Calibrate - USB SpectrometerThis will bring up the calibration window
Do NOT skip warmupWhen the warmup finishes, the ‘Finish Calibration’ button willbecome active. At this point put the Blank sample in the cuvette,and put the cuvette in the spectrometer (The blank sample is theone with Bradford reagent and NO protein)
Click the Finish Calibration ButtonWait a few seconds, the button will gray out and the window willread ‘Calibration Completed’
Click OK button at bottom of Window
9

You should now be in the regular display windowClick the Icon at the top of the screen that looks like a little data tableEmpty your cuvette and load your first sample into the cuvetteClick the green arrow at the bottom left of the screen
The spectrometer will now start reading valuesAfter the data table has filled, click the red box at the bottom left of thescreen to stop taking data.
Use the scroll button on the data table and find the absorbance of yoursample at 595 nm
This sample is done. Fill the cuvette with the next sample. When you clickthe green arrow to start the reading, this time the LabQuestwill ask if youwant to overwrite the previous data. Click the’ Discard’ button andcontinue with the experiment.
Continue till all samples are done
When you have finished this experiment make sure you thoroughly clean thecuvette and you test tubes to remove all traces of the blue dye!
10

Notes on Chapter 4 Enzyme Purification Experiment 4a Purifying LDH (Comprehensive Version)
1. I prefer the long or comprehensive version of the lab, so we will be doing theExperimental procedure given in 4a (pages 109-113)
2. However the Analysis of Results for Experiment 4 is better, so do the Pre-Labquestions and the Analysis of Results for Experiment 4.
2. The amount of ammonium sulfate required to get to 40% saturation is wrong in step 4of comprehensive version. It should be .230g /mL.
3. The tables and questions for the short version of the lab are better, so use theAnalysis of Results for the short version of the lab (pages 105-108).
4. While I agree with the author that it is best to do the assay of the protein as quickly aspossible, doing the purification and assay on the same day is almost impossible unlessyou are extremely well organized. Therefore on Day 1, we will only do enzymepurification, and don’t worry about the assay.
5. One problem with the assay is that it works best on the Lambda 2 or a spec 20interfaced into a computer for time acquisition. We may have trouble getting enoughmachines so everybody can do their assays on day 2 of the lab, so I may hang up sign-up sheets for you to use these machines during the week between day 1 and day 2.
6. A second problem with the assay, is that it works better with a minor modification ofmaking a single solution that contains both CAPS and Lactate. The modifiedprocedure is given on the next page.
11

Modified Assay Procedure
Spectrophotometer will be set to 340 nmSpectrophotometer will be in a time acquisition mode, so rather than scanning
different wavelengths it will sit at one wavelength and acquire absorbance as a functionof time. You will set it up to acquire a data point every second for a total time of 100seconds.
Assay set upThe book describes an assay where you mix 1.9 ml of CAPS, 0.5 ml of NAD and+
0.5ml of Lactate. What I have done is to combine the CAPS and Lactate into a singlebuffer, so the actual solution you will mix is 2.4ml CAPS/Lactate, 0.5 mL NAD and 0.1ml+
dilute sample to give you a total of 3.0 ml. When you use this procedure 340 nm isclose enough to the UV that some plastic cuvette will absorb light more than yoursample. Your best bet is to use a standard volume quartz cuvette.
First set up the Red Tide spectrometer1. Power on Red Tide Spectrometer2. Power on Computer and log in3. Plug Red Tide USB cable into the Computer
Let the computer recognize the USB device and install drivers, this maytake a minute or two
4. Start LoggerPro5. Calibrate the spectrometer
Click ExperimentCalibrate - Spectrometer 1(You may skip warmup it the spectrometer has been on >30minutes)
When it asks to insert the blank, use the CAPS/lactate buffer for your blankWhen finished click OK
5. Set up time acquisitionClick on data collection icon(X &Y Coordinates and a clock - the icon on the far right)
Mode: Time BasedLength: 100 secondsSampling Rate: 1 sample/secondClick on Done button at bottom of screen
6. Set wavelengthClick on the configure spectrometer icon(Spectrum and rainbow, one icon to left of data collection icon)
Find 340 nm on the list of wavelengths and check its boxClick OK button on bottom
12

Running the actual experiment1. Now add the NAD+ to your CAPS/Lactate buffer in the cuvette.
Put a piece of parafilm over the top of the cuvette to seal it, and thenshake it a few times to mix the solution. Once it is well mixed place thecuvette in the spectrometer
2. Check that absorbance at 340 is low and constant (Display lower left)If is low and constant, you are ready to begin. If it is not low and is steadilyincreasing, you have an LDH contaminant in the cuvette. You need todump it out, wash it out, and start over.
3. Add protein sample, cover cuvette with parafilm, mix quickly and put inspectrometer.
4. Quickly click the green arrow collect button and let the computer collect yourdata
5. Transfer data to ExcelOpen Excel in another windowReturn to the Logger Pro Window
ClickEdit
Select AllClick
EditCopy
6. Go to Excel window and paste data into Excel.
Repeat the above steps for each of your samples. When all is complete transferthe data to your own USB drive for analysis.
13

Using Logger Pro and SpectroVis spectrometer for Tyrosinase Kinetics experiment
1. Start Logger Pro on the computer
2. Plug in SpectroVis Plus spectrometer into USB port
Wait for Logger Pro to change it’s display to show a spectrum, indicating that is hasconnected to the spectrometer.
3. Click Experiment - Calibrate - Spectrometer 1When it asks for a blank, insert your cuvette filled with phosphate buffer.Finish Calibration.
4. To set up for a kinetics run:A. Click on the spectrum icon, 2 icons to the left of the ‘Collect’ button.
On the collection mode: click on the Absorbance vs. time button.On the right find the wavelength closest to 475 and click on it.Click on OK.
B. Click on the clock icon, 1 icon to the lect of the ‘Collect’ button.Mode: should be ‘Time based’Length: 2 minutesSampling rate: either 4 samples/minute or .25 minutes/sampleClick on Done
5. You are now ready to run. A. Remove the cuvet from the spectrometer spectrometer, rinse 2x with water, 1 x
with phosphate buffer.B. Empty the cuvet and place your l-DOPA and Phosphate buffer in the cuvet.C. When ready, add the tyrosinase, seal the cuvet with a piece of parafilm, and
invert the cuvet 1 or 2 times. Place the cuvet in the spectrometer asquickly as possible and hit the collect button. The computer will nowacquire your data for the next two minutes.
D. When the run is over, click on the data table and cut and paste it into excel.E. Once the data is in excel, click on ‘Data’ - ‘Clear all data’. To remove the data
from the computer’s memory.F. You are ready to begin the next run.
Since your data is in excel, plot your data for part A before you go on to part B. Note: ifyou have lots of enzyme, the slope of this data may be high at the start, but then getlower at the experiment continues. Always try to use the initial, highest slope in yourdata analysis.
Also, since your data is already in excel, make an excel spreadsheet with data tablesand graphs that resemble the data tables given in the text, and answers all questions inthe text, then turn in the excel spreadsheet electronically. There is no need to copy thedata from the spreadsheet back into the book pages to hand in
14

Protein Structure Computer Lab
Analysis of protein structures in the Brookhaven Protein Data Bank using the Jmolgraphic program.
BackgroundUseful references -Leninger Biochemistry - Chapter 4 , Introduction to Protein Structure -Branden & Tooze Garland Publishing 1991
THE RCSB DATA BANKThe RCSB (Research Collaboratory for Structural Bioinformatics) Protein Data bank is anational repository for X-Ray and NMR structures. The data bank currently contains>105,499 different coordinates of ~98,000 proteins, ~2700 nucleic acids 1700 protein-nucleic acid complexes. 94,000 of these structure are done by X-ray crystallography,10,800 by NMR and 711 by electron microscopy. Many journals require that thecoordinates of a biomolecules be must deposited in the Data Bank before they will publish an article dealing with a new X-ray or NMR structure.
Using the RCSB data bank
1. Use a web browser to access the PDB sitehttp://www.rcsb.org/pdb/
This will bring up the PDB web site. Explore this site as much as you want. It has lots oflinks to interesting places. Once you are through exploring, start to look for a protein youwant to study. No ideas? Try looking up some proteins given as figures in yourtextbook, or in the Branden and Tooze text.From this point onward my written directions are only a rough guide, they are continuallychanging and improving this site, and I can’t keep up with the changes, so you will haveto play around.
Now let’s try to get a copy of the X-ray file for your protein. Look for the Search box inthe middle of the PDB home page. Plug the name of your protein in and let it search. With luck you will now have a page or two of proteins that fit your search request.
Look at each entry on the search list. You should blue bar, with a line of Title (Title oforiginal publication), Classification (Type of enzyme), and Compound (Specifics on theprotein in the structure) below that. The Blue bar is the most useful. On the blue baryou should see icons that will let you download the file, directly view the data in the file,and view images of the protein in the file. (The key to which icon is which is just abovethe first blue bar.)
There are a couple of good viewers on the site, JMOL and Simple Viewer/Proteinworkshop. Try them both on for size. You need to have the proper viewer downloaded
15

on you computer before you can use the interactive viewers, and the computers oncampus may not let you download the viewer, so it may be easiest to this on your owncomputer.
If you don’t have any luck with the interactive viewers, you can at least look at the staticpictures at the bottom of the page and see if the protein looks like the type you are tryingto find.
Be sure to click on some of the links on the left hand side of the page, and try to figureout what information they give you access to before you leave this page. After you arethrough exploring, hit the back arrow key and return to the main search page.
If this is a set of coordinates you want to look at in more detail, then you need todownload it. If you use the download icon, it will download the file in a compressedformat. To uncompress the file you will need to have WinZip installed on your computer. If you don’t have Winzip, you need to try a different pathway to get the uncompressedfile.
Getting an uncompressed file.Click on the icon for ‘View PDB file’. At the top of this page is a link that says ‘Save fullentry to disk’. Click on this link. One of two things will happen. Either the file willdownload, or, if you have a computer with a viewer installed, a 3-D image of the proteinwill come up for you to look at. If this happens to you, hit the back arrow, and try again. Only this time click on the ‘Save full entry to disk’ with your right mouse button. Now amenu comes up. Find the ‘Save Target As’ command. This will bypass your built inviewer and let you download the compressed file to your choice of directories.
Additional help with Jmol. One of the original molecular graphics routines was calledRASMOL, and you can still find it on the web and use it. I actually have a printedmanual on some of its bells and whistles, however is has some problems, like it doesn’twork on Macs. It has been replaced with a newer, and better program called Jmol. Inthe fall of 2017 Jeffery Cohlberg, from the Department of Chemistry and Biochemistry,California State University, Long Beach released very nice tutorial/manual on how to usethis program, and I highly recommend it. However, it is pretty long, so I can’t simply printit out here. Instead let me give you some useful links that will get you started
1. To download the most recent version of Jmol go to http://jmol.sourceforge.net/. In theupper right corner click on Download. Under Downloading Jmol click on download linkon the second line. The current version of Jmol will be downloaded to your computer.Alternatively, click on Jmol downloads page on the third line; on the next page, click onthe line ‘Looking for the latest version?’...
16

2. Cohlberg’s book “Exploring Proteins and Nucleic Acids with Jmol” is available fordownload at www.csulb.edu/~cohlberg/Jmolmanual.html. It contains self-guided exercises that enable the you to learn how to download structuresfrom the Protein Data Base and display them and manipulate them using the standaloneversion of Jmol. You gradually acquire the skills to use Jmol while proceeding to learnthe basics of protein structure in a manner that parallels the way you learned thematerial in an your biochemistry course.
EXPERIMENTIn lecture this week you are learning the basics of protein structure, things like á helices,â-sheets, etc. Proteins are commonly grouped into four major categories of structure, all á helix, all â-sheet, á/â ( the protein is a mix of the two) and á+â (a two domain proteinwhere 1 domain is primarily á, and the other domain is primarily â.
In this lab you will be working in groups. Each group is to find one protein in theBrookhaven data base to represent each general type of structure. Further, each groupwill be assigned one particular type of protein to examine more closely.
Next week each team will present an oral/multimedia presentation on their chosenprotein. I will sit down with each group and have the group show me what they found ona computer of their choice. Things to include in your presentation if you can find them:Prime reference for the Crystallographic coordinates. What is the enzyme’s function? Where does it come from? How was it purified? Look at the format of the file and seewhat you can understand about the format. What are the salient features of yourprotein’s structure. Where is the active site? How does it work? Are there any othermolecules bound to the protein? Are they a necessary part of the structure? Can youpick out any particular secondary or super secondary structures? Are there any relatedprotein files that should be examined? Any features of Jmol that helped you to visualizethe structure? Anything you wanted to do but couldn’t?
In evaluating your presentation I will be looking in three major areas. What differentthings did you find in the Protein Data Bank as a whole, what different things did you findout about your target proteins, and how well did you learn to use the Jmol program.
PROCEDUREThere is no set procedure to this lab. Use the network to get on to the protein data bank. Locate a search engine and start trying to find a likely structure. This may be particularlyhard because you don’t have a particular target for your search. Try looking in thereferences for representative proteins that could provide you with a name or referencethat you can try searching with. Once you have a structure located see if you can useJmol on-line to do a preliminary survey of the protein. If it looks good, then download
17
the complete coordinate file and start digging. Note that once you have a proteinidentified in the data bank there are several links to other useful information on theprotein.
This is a wide open lab there is no right answer or correct finding. The idea here is toexplore as much as you can to get a feel what information is available on a givenprotein. Keep careful notes on what links are useful and where you find particularpieces of information. In the presentation you may be asked to reproduce a given linkso others can see how you did something.
If you want to look at DNA or a carbohydrate go ahead and give that a try as well.
18

Notes for Experiment 8a
1. We are doing the same assy you did before, so refer back to pages 10 and 11 for theset up.
2. We only have 2 set of pipets and stock solutions so spectrometers that are closetogether need to share.
3. LDH sampleFor starters, weigh out 10 mg of your dialyzed protein and dissolve it in 1 ml of
deionized water. Do this is an eppendorf tube. Keep on ice for the rest of the period.
4. Step 1.Try the following amounts of protein: 50, 20, 10, 5, and 2 ìl of the protein stock.
After doing all 5 of these experiments, then try to find a volume that gives you a 0.2OD/minute change by choosing a volume between one of the above fixed volumes. It iseasiest to simply use different volumes of protein, but you should consider diluting if youneed to deliver <1ìl of protein to make the assay work
For Step 1we won’t worry about the few ìl’s difference in volume in each run.
5. Step 3.Once step 1 is accomplished, then you use that ‘good’ protein volume for all the
experiments in Step 3. Here you make the NAD concentration progressively lower, and+
get a lower rate. Here the volume changes will be significant, so you need to add waterto keep the total volume of the NAD aliquot a constant. (For example, if you only use+
25 ìl of NAD , you will need to add 475ìl of water so the total volume is still 2.9 ml) I+
would try cutting the volume of NAD in half each time and see how this works. In 2005+
the following volumes of NAD seemed to work pretty well: 500, 250, 125, 60, 30, 15, 10,+
and 5 ìls.
19

Notes on running the Lambda 2 spectrometer for the Assay
1. Check that the time-drive program is set for 340 nm, take data every 5 seconds, for atotal time of 1 minute.2. Have a water sample in the reference beam3. If you have a USB drive, plug it into the machine now so you can record your datadirectly on the USB drive. If you don’t, set up a folder on the D drive to put your data soyou can access it later4. Run a time experiment as you did before
A. Insert the mixed buffer&NAD without the protein to run the ‘blank’B. Add protein, mix, insert cuvet and start the experiment, writing down the nameof the file for this data Set (TDxxx.TD)
5. Once a data set is obtained we will write it to a file you can access with Excelimmediately so you can analyze it before you go on to the next experiment.
A. File the ‘File’ button - ‘Save as’ optionB. When the ‘Save as window comes up, highlight the correct file for the originaldata, C. If you have a USB drive set the window to record in Drive G:D. Change the data format to ASCII
6. Once the data had been recorded as an ASCII file, minimize the Lambda 2 window,and start up Excel
A. Have Excel open the file you just made.Note: the file you just made is NOT in Excel format, so when you arelooking for the file, set Excel to look for All files, not just Excel files
B. As Excel download the data it will show a window asking about the how youwant to format the data. Don’t try anything fancy, just hit the ‘finish’ button, andlet Excel do what it wants with the data.C. Look to the bottom of the Excel page. There should be 2 columns of numbers.The first column should start with a 0 and then have negative numbers . This isactually the time in minutes . I would simply change the negative to positives.The second column had you absorbance data in it. To get your slope you caneither plot the data and get a line of best fit (Probably the best for the good finalanalysis). Or, for experiment 1, where you are trying to get a ÄOD of .2 in 1minute, simply subtract the first value from the last value, and see what the ÄODis for the 1 minute intervalD. Save this data E. Minimize the Excel window, maximize the Lambda 2 window and start the nextexperiment.
20
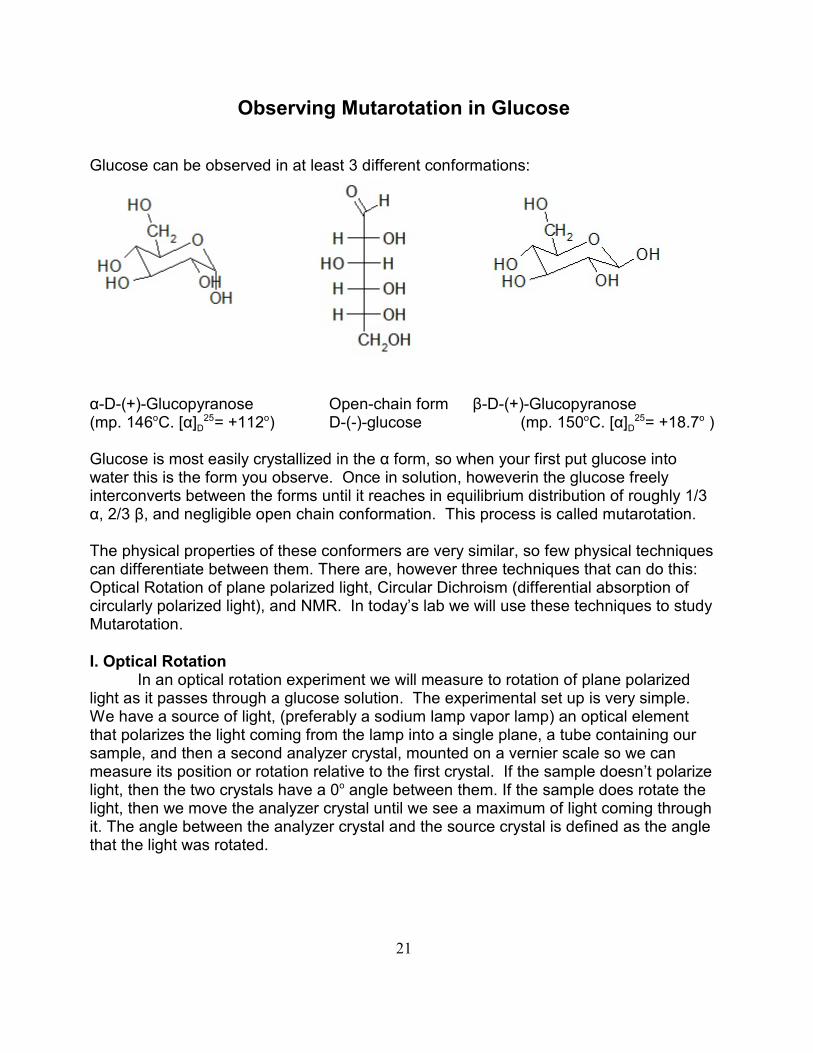
Observing Mutarotation in Glucose
Glucose can be observed in at least 3 different conformations:
á-D-(+)-Glucopyranose Open-chain form â-D-(+)-Glucopyranose
D D(mp. 146 C. [á] = +112 ) D-(-)-glucose (mp. 150 C. [á] = +18.7 )o 25 o o 25 o
Glucose is most easily crystallized in the á form, so when your first put glucose intowater this is the form you observe. Once in solution, howeverin the glucose freelyinterconverts between the forms until it reaches in equilibrium distribution of roughly 1/3á, 2/3 â, and negligible open chain conformation. This process is called mutarotation.
The physical properties of these conformers are very similar, so few physical techniquescan differentiate between them. There are, however three techniques that can do this:Optical Rotation of plane polarized light, Circular Dichroism (differential absorption ofcircularly polarized light), and NMR. In today’s lab we will use these techniques to studyMutarotation.
I. Optical RotationIn an optical rotation experiment we will measure to rotation of plane polarized
light as it passes through a glucose solution. The experimental set up is very simple. We have a source of light, (preferably a sodium lamp vapor lamp) an optical elementthat polarizes the light coming from the lamp into a single plane, a tube containing oursample, and then a second analyzer crystal, mounted on a vernier scale so we canmeasure its position or rotation relative to the first crystal. If the sample doesn’t polarizelight, then the two crystals have a 0 angle between them. If the sample does rotate theo
light, then we move the analyzer crystal until we see a maximum of light coming throughit. The angle between the analyzer crystal and the source crystal is defined as the anglethat the light was rotated.
21
The calculation of a specific rotation looks a bit odd from the modern chemical point ofview because the units were created based on measuring concentration in grams /100ml, and using pathlengths of decimeters (1/10's of a meter). We use units ofdecimeters for the pathlength because the optical rotation effect is so small you need tohave a long pathlength to observe measurable values. The actual equation is:
where is called the specific rotation, and refers to a measurement taken at 20 Co
using the sodium vapor D line (588.9nm), è is the experimental rotation, l is thepathlength in decimeters, and c is the concentration in g/100 ml. Note: this unit makesthe effect sound large, the [á] for á glucose is 112 , however, when you plug typicalo
experimental numbers in like c = 5 g/100 ml and the pathlength is 1 dm, the angle youactually measure in the polarimeter is less than 10 !o
II. Benedict and Barfoed TestsThere are several different chemical tests that can be used to characterize
carbohydrates, since the optical rotation experiment is relatively short, we will do twoadditional chemical tests on the sugars that you are analyzing with optical rotation. These are the Benedict and the Barfoed tests. Both tests rely on the ability of somesugars to reduce Cu to Cu , and are very colorful, and are the basis for the term2+ 1+
“reducing” or “non-reducing” sugar. Reducing sugars give positive tests with Cu while2+
non-reducing sugars do not.Benedict Test - Aldehydes can be reduced under mild conditions to carboxylic
2 2 2acids: RCHO(aq) + 2Cu(OH) (aq)6 RCOOH(aq) + Cu O(s) + 2H O(l)
2 2Cu(OH) solution is a pretty blue color, and the Cu O precipitate ranges fromyellow to orange to brick red, depending on conditions.
In qualitative organic texts this test is used to differentiate between aldehydes andketones, since ketones cannot be oxidized to carboxylic acids. However things aremore complicated in sugars. First of all, if the aldehyde of an aldose sugar is tied up in aglycosidic linkage it cannot react, and the test is negative. Secondly, if the ketone of aketose is next to an anomeric hydroxide, the C=O group can ‘move’, and turn into aaldyhyde and get oxidized to give a positive test as well!
Barfoed Test - This test is similar to the Benedict test, but in this case the Cu is2+
in the form of an acetate salt, and the solution itself is in an acetate buffer so the pH islower. This is important. In the Benedict test copper solution contains sodiumcarbonate and the pH is high, under these conditions the glycosidic linkages betweensugars in any sugar polymer are stable. In the lower pH conditions of the Barfoed test,the glycosidic linkages between sugars slowly hydrolyze, and sugars like disaccharideshave stronger reactions with time as the individual sugars are released.
22
III. Nuclear Magnetic Resonance (NMR) NMR or nuclear magnetic resonance is a technique where each nucleus in a
compound has a particular resonance frequency. This resonance frequency can berelated to the chemical environment around the nucleus. In á- and â- glucose thechemical environment around the anomeric carbon (the 1C in glucose) is differentenough for you see different chemical shifts for the C in a C-13 spectrum, or for the Hattached to this C in a proton spectrum.
While you are most familiar with proton NMR, obtaining a proton spectrum forglucose in a water solution is difficult because 99% of the signal you observe comesfrom the protons in the water instead of the protons in the glucose. For this reason we
2will instead dissolve the sugar in heavy water or D O so the background of protonsshould largely disappear. We will use both H and C nuclei to see the effect from two1 13
different perspectivesYou will notice at least two major differences between C and proton NMR. First,
the C chemical shift range is much larger than the chemical shift range of protons, itgoes from 0 to roughly 200 ppm. Second, since the more common isotope of C is C,12
and C is only present in <1% of the nuclei, so the C signal is much, much weaker,13
these spectra are much noisier. You will have to take about 100 scans to try to get areasonable signal, and even then the noise will be 100's of times worse than you will seein a single scan using protons.
IV. Circular Dichroism (CD)
Circular dichroism is a technique that it not used too much outside ofBiochemistry. Circular dichroism and optical rotation both derive from polarized lightinteracting in different ways with asymmetric molecules. The major differences are thatoptical rotation involves the rotation of plane polarized light, and occurs at wavelengthsnear and far away from absorbance maxima. Circular dichroism involves circularlypolarized light, and occurs only at the wavelengths where absorption occurs. When youare measuring circular dichroism you are measuring the very small difference betweenthe absorption of right- and left- circularly polarized light. A positive CD signalcorresponds to left circularly polarized light being absorbed more strongly than rightcircularly polarized light. Again the units measured on the machine, m are a bito
obscure, but have to do with the rotation of the plane of light due to the differentialabsorption. In this experiment we won’t worry about the exact value of the CD signal,we will instead simply monitor what happens to the signal over time as a method ofestimating and comparing the rate of the mutarotation reaction at different pHs.
23

Experiment A1. Optical RotationPrelab questions1. Calculate the rotation you should expect to observe for a 1.25g/100ml solution
of á glucose in a 1 dm cell.2. Calculate the rotation you should expect to see of a 1.25g/100ml solution of
glucose that is 40% á and 60% â.3. Perhaps the hardest part of this lab is interpreting the Vernier scale that you
read your rotation from. Remind me and I will send an Email out with two images of thescale for you to practice on.
Experimental Procedure1. Check the polarimeter’s zero setting. Fill the 1 dm tube with deionized water anddetermine the zero position of the polarimeter. It probably isn’t 0.00 but is slightly off.o
Getting a reading using this device takes a little work, both to figure out where the zeropoint is and how to read the vernier scale. Take time to read the manual and get thismeasurement right. Note how you need to try the measurement at least 4 times, movingthe detecting scope from both clockwise and counter-clockwise directions and then youaverage these four numbers together to get your final answer.
2. Determination specific rotation for four sugars. 12.5 g / 250 ml solutions of galactose,fructose, sucrose and maltose will be supplied to you. Place in a 1 dm cell anddetermine the optical rotation for each solution. Use the equation above and yourexperimental data to determine the [á] of your solutions.
3. Observation of mutarotation. Accurately weight about 2.5g of á-glucose and place in a50 ml volumetric flask. Fill the volumetric to the mark with a designated buffer and takea measurement of the solution’s optical rotation as quickly as possible. What is the [á]of this solution? Save the stock solution do another more determination of rotation after24 hours have past.
Since the [á] of pure â-glucose is +18.7 and the [á] of pure á-glucose is +112 ,o o
your experimental [á] value can be used to tell you how much of your glucose is in eachform. What are these values after 1 hour? after 2 hours and at 24 hours? Is the [á] ofthe solution still changing or has it stopped. If it has stopped, determine the % of yoursample in the á form and â forms.
Items to hand in for evaluation:A. Sample calculation going from raw rotation to specific rotation for GlucoseB. Table of results for Experiment 2 listing the four sugars and their specific
rotations.C. Sample calculations showing how you calculated %á and %â for at 0 and after24 hours.
24

Experiment A2. Reducing SugarsPrelab questionsDraw the structures of Fructose, Glucose, Maltose, and Sucrose
Experimental ProcedureBenedict Test - Fill a 150 mL beaker ½ full with water and place on a hot plate.
Turn hotplate on high until water is boiling, then turn the heat down to a simmer. Label 4test tubes and use a pipetor to place 2 mL of Benedict reagent in each test tube. Whenthe water is boiling add roughly 2 mL of each sugar to the different test tubes and place
in the boiling water. Time how long it takes for each sugar toreact. If a sugar does not react in 5 minutes, it is a non-reacting sugar.
Remove the test tubes from the boiling water andclean them.
Barfoed Test -Keep you water simmering. Label 4 testtubes and use a pipetor to place 2 mL of Barfoed reagent ineach test tube. Add roughly 2 mL of each sugar to the
different test tubes and place in the boiling water. Time how long it takes for each sugarto react. If a sugar does not react in 5 minutes, it is a non-reacting sugar.
Items to hand in for evaluation:Based on the structures you gave in the prelab questions for the four sugars you
tested, rationalize your results to the above tests. Why did some sugars react quickly,other more slowly, and others not at all?
Experiment B. NMR.In this experiment I an going to introduce you to a couple of advanced 2-dimensionalNMR techniques, the HSQC and the COSY.
Understanding how to analyze a two-dimensional NMR experiment can sometimes beconfusing so I have written a brief introduction to get you started on the HSQC andCOSY experiments. I will not be explaining how these experiments actually work, I mustleave that for a more advanced class.
Let’s use a small organic compound with a fairly simple NMR spectrum, 2-butanol. Thestructure of 2-butanol is shown below:
Notice I have labeled the four CH systems A, B, C, and D so we can keep track of whichone is which. The proton in the OH system is broad and weak, and will not play a part inthis analysis.
Let’s start with the standard proton experiment that you have used several times in
25

Organic chem. Below is the H NMR spectrum for 2-butanol.1
Based on what you have had in Organic, you should expect the two methyl groups (A &D) to be the farthest upfield, one at about 0.9 ppm and the other at about 1.18 ppm. You should also expect that the oxygen attached to the C in position B to deshield thatproton, so it should be the farthest downfield, about 3.7 ppm. That leaves the multipletat 1.45 ppm to correspond to the protons at position C. You can check that theseassignments are correct by looking at the integrals: The 3.7 peak has a single proton,the one at 1.45 has two protons, and the ones at 0.9 and 1.18 have three protons each.
Now comes the harder problem, which of the two methyls is A and which is D? If youremember your n+1 rule, there is a single proton at position B, so that should split theadjacent A methyl into 2 peaks, so the 1.18 methyl must be A. There are 2 protons atposition C, so that should split the methyl at D into three peaks (a triplet) so the methylat 0.9 must be D.
So that is what you already know, now lets move on to something you don’t know. Lookat the next spectrum, the C spectrum of this compound, shown below:13
26

I don’t think Dr. Dixson has you doing much C spectroscopy, but it is another useful13
NMR nucleus to look at. First notice the range on the X axis. Typical carbon chemicalshifts can range form 0 to >200 ppm. This is one reason it can be more useful thanprotons, there is a much larger range of chemical shift values. Another thing to notice isthat while all the peaks correspond to single carbons, the sizes of the peaks vary widely,this makes using integration pretty much impossible in C spectroscopy. Finally look at13
3the very small triplet at about 77 ppm, this the C of the CDCl solvent, and I will ignore itfor the rest of the analysis.
27

There is a pretty good, but not perfect, correlation between H and C chemical shifts,1 13
so you can make a good guess that the farthest downfield proton is attached to thefarthest downfield carbon (Spin System B), and farthest upfield proton attached to thefarthest upfield carbon (Spin System D), and so on. But, like I said, this is not a perfectcorrelation, so you want something more concrete to go on before you publish yourassignments.
This brings us to our first 2D experiment, the HSQC. HSQC stands for HeteronuclearSingle Quantum Coherence. The important part is the Heteronuclear , ie. differentnuclei. In this experiment we correlate two different nuclei with each other; the carbonsand their attached protons. How do we make them correlate with each other? We usecoupling. Coupling? Didn’t we just use that for the n+1 rule to figure out which methylgroup was at which end of the molecule? Yes! In that case we were looking at coupling(or energy transfer) transferred between 3 single bonds; the C-H bond of system A, theC-C bond between A and B, and the C-H bond in system B. In the HSQC experimentwe focus just on the strong coupling between the C and H that is bonded to it.
When you set up this experiment you are actually programming the NMR consol toshoot a series of different pulses of energy at the sample in the NMR tube, and then thespectrometer reads out the results. In this case you start by exciting the C nuclei. This13
energy is then transferred (via coupling) to the protons that are attached to the carbonnucleus, and then the protons give off this energy at their normal H frequency. (This is1
a great oversimplification, but it gets the point across.)
So in this experiment we display the excitation C frequencies along the Y axis and the13
final resulting H frequencies along the X axis. The HSQC spectrum of this compound1
is given on the next page.
28
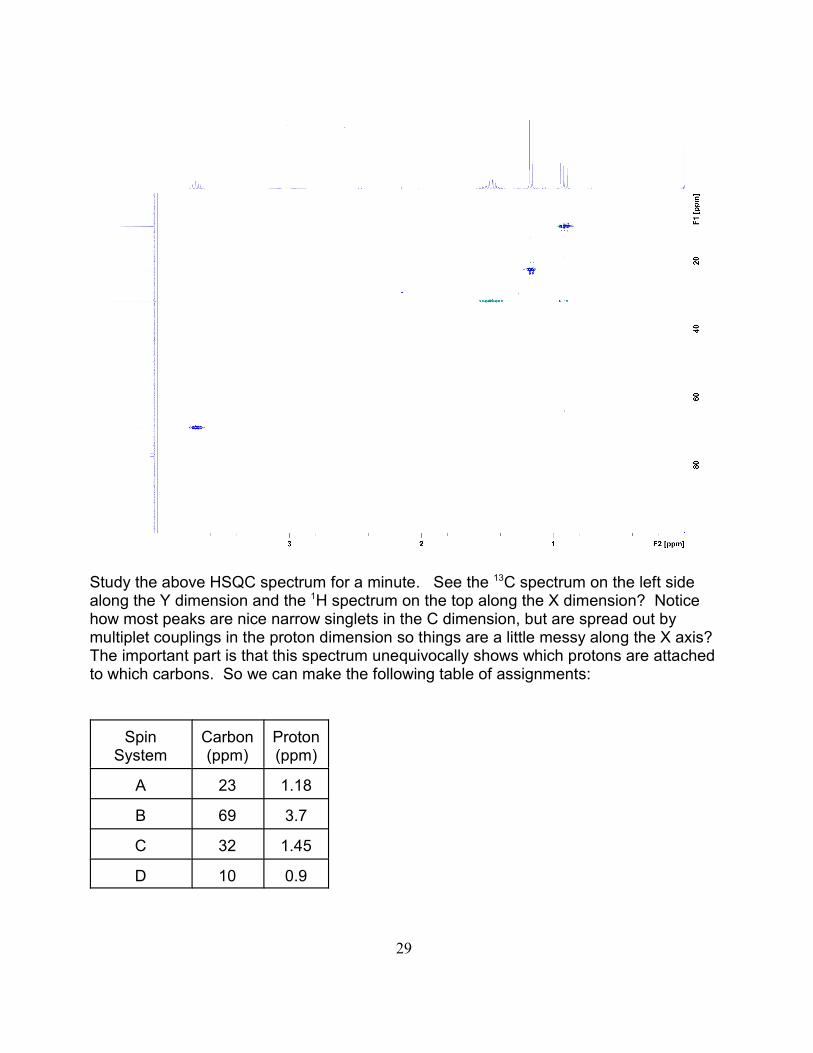
Study the above HSQC spectrum for a minute. See the C spectrum on the left side13
along the Y dimension and the H spectrum on the top along the X dimension? Notice1
how most peaks are nice narrow singlets in the C dimension, but are spread out bymultiplet couplings in the proton dimension so things are a little messy along the X axis? The important part is that this spectrum unequivocally shows which protons are attachedto which carbons. So we can make the following table of assignments:
SpinSystem
Carbon(ppm)
Proton(ppm)
A 23 1.18
B 69 3.7
C 32 1.45
D 10 0.9
29

3I’ll leave it to you to figure out why there is no peak in the H dimension for the CDCl1
solvent.
That wasn’t too bad, was it. The last 2D experiment I want you to look at is the COSY(Correlated SpectroscopY). Essentially we are doing the same thing, only this timeinstead of passing the energy from Carbons to Protons, we pass the energy from oneproton to another proton using the 3-bond coupling, the same coupling that gives us ourn+1 rule for splittings.
Essentially the spectrometer is doing the same thing it did in the last experiment. Itstarts by exciting all the protons, then depending on how strong the coupling is, some ofthis energy gets transferred to a proton on an adjacent carbon via a 3-bond couplingwhere it now resonates at a new frequency. The COSY spectrum of 2-propanol is givenbelow.
Again study the spectrum for a minute. Just like before, the Y dimension represents thedifferent excitation frequencies and the X dimension represents the frequencies that theenergy was transferred to. First locate the diagonal that runs from the lower left to theupper right. This represents energy that started and ended with the same frequency, sono 3-bond coupling occurred. Now let’s look at the off-diagonal peaks, these are theimportant peaks because they only occur when one frequency is transferred to a secondfrequency through a 3-bond coupling.
30

Let’s start with the proton on D that is at 0.9 ppm. In the COSY there are twocrosspeaks associated with this peak, one at 1.45, 0.9 and the other at 0.9,1.45. Thesecrosspeaks between 0.9 and 1.45 tell you unequivocally that the proton at 1.45 must bethree bonds away from the proton at 0.9, so 1.45 must be the C proton. Similarly the Aproton at 1.18 has two cross peaks at one at 3.7,1.18 and the other at 1.18, 3.7 andthese crosspeaks between 1.18 and 3.7 tell you that the proton at 3.7 must be adjacentto 1.18, so if 1.18 is A, 3.7 must be B. Finally the peak at 3.37,1.45 and the weak peakat 1.45, 3.37 link B and C together and allows us to walk from A to B to C to D, or to linkall the protons together.
This is the power of the COSY, when things work right you can walk from one end of themolecule to the other, linking and assigning all the protons as you go, no guessing, norelying on questionable coupling patterns.
Prelab questions:1(A). Below is a hypothetical HSQC of a compound with 5 protons linked to 5 carbons. Make a table that shows both the C and H frequencies of all CH pairs in this molecule.13 1
(Please ignore the negative signs on the chemical shifts. I had to do that to make Excelplot this correctly)
31

1(B). Below is the hypothetical COSY spectrum for the above compound. Assume thatthe methyl group at one end of the compound has a H chemical shift of 1.0. Let’s call1
this position A. Use the COSY to determine the proton frequencies of protons B, C, Dand E.
1 ( C) Finally, go back you’re the table you made in 1A and identify both the C and H13 1
for all the spin systems, A through E.
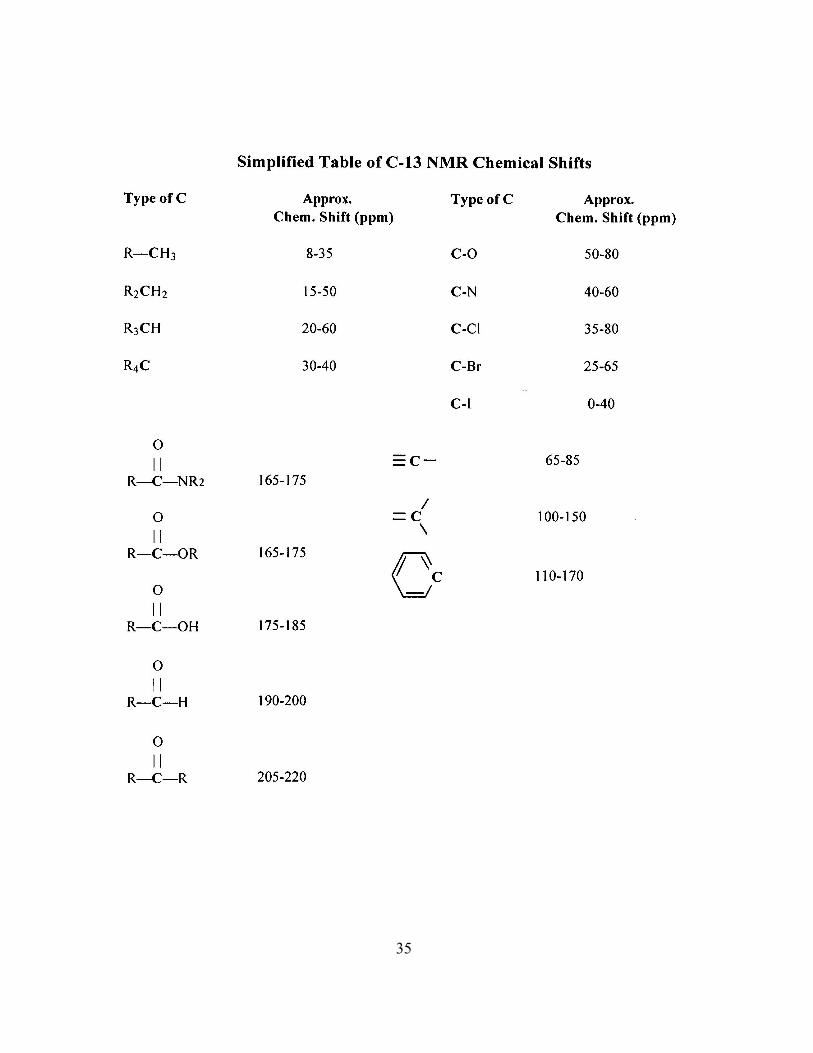
Now let’s go the other way.2(A). Below is an organic compound. Predict the H and C frequencies for all the spin1 13
systems A though E using the chemical shift tables found on the next few pages. Thesetables show a range of values so pick one value within the range for a given nucleus.
32

2(B) Use the table of values from 2(A) to predict what the HSQC spectrum of thiscompound would look like.
2 ( C). Based on the H chemical shifts you have given in 2(A), predict the COSY for this1
compound. (You may ignore the proton on the alcohol.)
33

34
35

Experiment B . NMRExperimental Procedure
1. Initial observation of H and C spectra. 1 13
Accurately weigh about 0.1 g of á-glucose and 0.02g of TSP and place in a 1.5
2mL Eppendorf tube. Add 1 ml of D O to dissolve all of the solids. When this solution iscompletely dissolved quickly place about .7 ml of this solution in an NMR tube, place thesample in the machine, and determine both the H and the C spectra of this sample. 1 13
(Find the Bruker Experiment Manual - Run 1D Proton (Experiment: PROTON, SolventD2O; 1D C-13 CPD Experiment: C13CPD32. Solvent D2O)
Determine the H and C spectra of the sample again 24 hours later.1 13
All of the C are attached to alcohols, so they will appear in the chemical shiftregion between 60 and 100 ppm. The anomeric C signal is between 90 and 100. Doyou have one or two peaks in this region? The larger of these peaks would correlate withthe á conformer that you are starting with and the smaller peak would be the âconformer. Note that the linear form of glucose would have a carbon in the aldehydeform, and C in an aldehyde has a chemical shift between 175 and 225ppm. If yousearch your spectrum in this region you won’t find any signal indicating that theconcentration of the open, linear for of glucose is negligible.
2. Assignment of chemical shift values (Do after 24 hours). You now have spectra, and aclue as to where some of the signals are coming from, but no clear assignments of whatpeaks correspond to what protons or carbons. Now that the sample has been sitting for24 hours and is closer to equilibrium we will now do some two dimensional NMR to try tomake the make these assignments. Following the directions in the NMR manual set upboth a 2D COSY and a 2D CH HSQC experiments (Experiment: COSYGPSW, SolventD2O; Experiment: HSQCEDETGP, Solvent D2O). The COSY experiment will showwhich protons are within 3 bonds of other protons, while the HETCOR experiment willshow which protons are attached to which carbons. Once the experiments arecomplete, plot the spectra and try to assign all the nuclei.
3. Items to hand in for evaluationA. Initial H and C 1D spectra.1 13
B. C spectra at 0 and 24 hours. Locate the á and â peaks for the anomoric C in13
these spectra. Determine the heights of these peaks. Calculate the ratio of the height ofthe ~98 ppm peak to the ~95 ppm peak . Do you see any evidence that the Glucosehas changed form all á, to a mixture of ~1/3á, 2/3 â?
C. COSY and HETCOR SpectraD. Table showing correlated H and C correlations observed in HETCOR. Using1 13
the proper sugar numbering system try to identify each correlation with a C in either theá or â form of the sugar. You have had the introduction in the prelab, the followingpages shows details of how to do the analysis using the Bruker software.
36

Analyzing your HSQC and COSY SpectraLet's start with the C-H HSQC (Heteronuclear Single Quantum Coherence). In thisexperiment energy is exchanged between a C nucleus and the Proton that is bonded tothe carbon. It is used to see what carbons are bonded to which protons. Bring up your HSQC experiment. It should look much like mine (shown below)
On the left hand side of the plot is the 1-D C spectrum and on the top of the plot is the 1-
D Proton spectrum. Each blob (properly called a cross-peak) in the 2D plot represents a
C and its connected proton.
Just for fun roll scroll-wheel on the mouse. See how you can make the cross peaks
larger or smaller? I am going to roll the scroll-wheel until I get the bottom left peak to
look a little cleaner.
37

Now move the mouse so the cursor is in the plot area. See how you get a crosshairthat you can move from one peak to another? Move the crosshair until it is right in themiddle of the bottom-left most peak
38
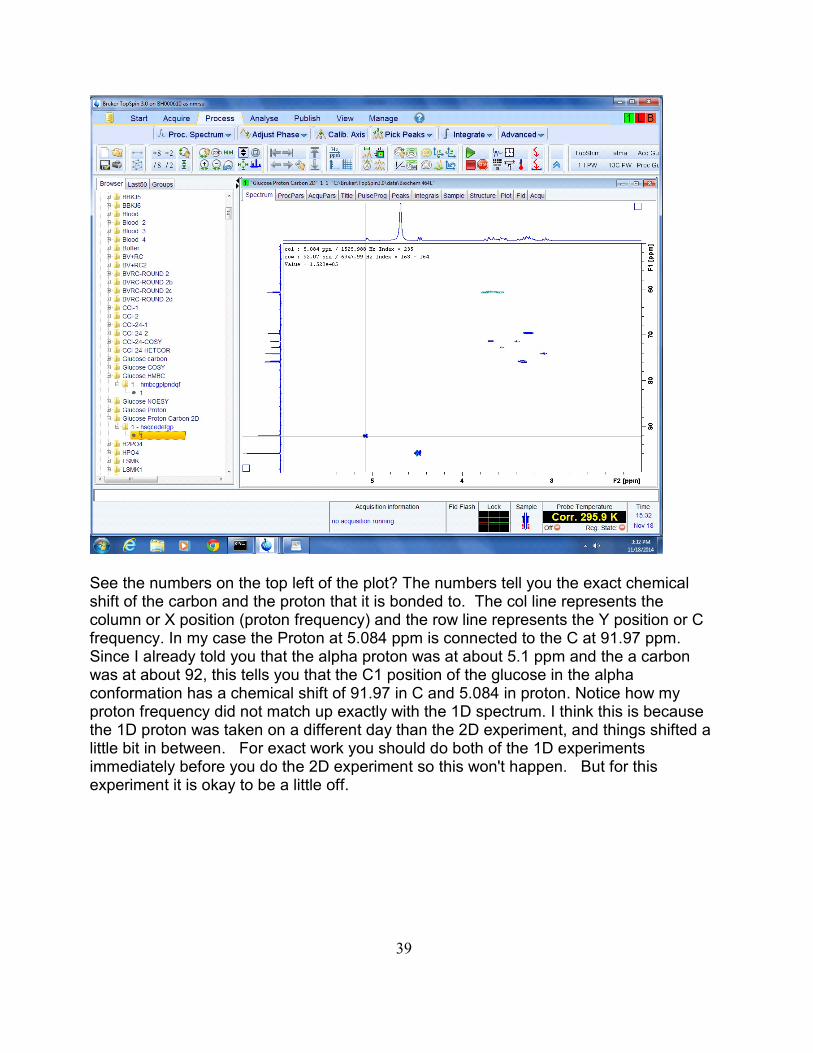
See the numbers on the top left of the plot? The numbers tell you the exact chemicalshift of the carbon and the proton that it is bonded to. The col line represents thecolumn or X position (proton frequency) and the row line represents the Y position or Cfrequency. In my case the Proton at 5.084 ppm is connected to the C at 91.97 ppm. Since I already told you that the alpha proton was at about 5.1 ppm and the a carbonwas at about 92, this tells you that the C1 position of the glucose in the alphaconformation has a chemical shift of 91.97 in C and 5.084 in proton. Notice how myproton frequency did not match up exactly with the 1D spectrum. I think this is becausethe 1D proton was taken on a different day than the 2D experiment, and things shifted alittle bit in between. For exact work you should do both of the 1D experimentsimmediately before you do the 2D experiment so this won't happen. But for thisexperiment it is okay to be a little off.
39

Now go through the rest of the experiment and find all the C’s and their correspondingH’s and make a table that looks like this:C H Assignment91.97 5.084 C1-alpha
At this point you should have a C and an H for every peak you observe in the HSQC, butonly other assignment you can make is the C1 beta. By moving the mouse up and downto change the peak width, I count about 11 different peaks that you should have in yourtable. I think there are about 3 peaks hidden in the one long bob at the top of thespectrum.
Once the table is complete you can move on to the COSY.
In the HSQC experiment we saw a correlation between the C and the proton it wasconnected to by a chemical bond. In the COSY we see a correlation between a proton,and the proton that is next to it (3 bonds away) in the glucose structure. My COSY is onthe next page.
Notice we now have the proton spectrum along both the left-hand edge and the top ofthe spectrum. Use the scroll wheel on the mouse to make peaks appear and disappear
40

just like you did before. Again, as you move your mouse over the 2D plot area you cantell your exact position in the X and Y dimensions my looking at the display on the topleft of the plot.
Since we know the proton at about 5.06 is the C1-alpha proton, move the crosshairs sothey line up on this peak in both the X and Y 1D plots. (As shown below)
Notice how the crosshairs are lined up over a blob in the 2D plot? This says that thepeak at 5.059 in the X correlates with itself at 5.059 in the Y dimension. You can seethat there is a diagonal of peaks running from the lower left to the upper right wherepeaks correlate with themselves. Nothing new here, you can think of this as having the1D proton spectrum running along the diagonal. The good stuff here are the off-diagonal peaks. See how if you go up or to the right orgo up you can see a second peak that is off the diagonal? Going up we have acrosspeak at 5.059 along the X and 3.38 along the Y. Going to the right we have just thereverse; 5.059 in the Y and 3.38 in the X. This cross peak represents the connectionbetween the C1 alpha proton and the next proton (C2) in the glucose structure. So nowyou know both the C1 and the C2 proton frequencies for the alpha conformation ofglucose. Go back to your C H table, and find an entry for a H at 3.38 and assign thatpair as the C2 alpha C,H pair.Now go to the C1beta peak at about 4.5 and make your C2 beta assignments.
41

Let's see if we can push this even further into the C3 beta. Put your mouse on the C1beta peak on the diagonal, and move the mouse up to find the C2 correlation about3.075
Follow the crosshair to the right. If you follow it all the way to the diagonal you are nowat the C2 beta proton position. But notice how there is a crosspeak 'blob' at about 3.3and 3.075
42
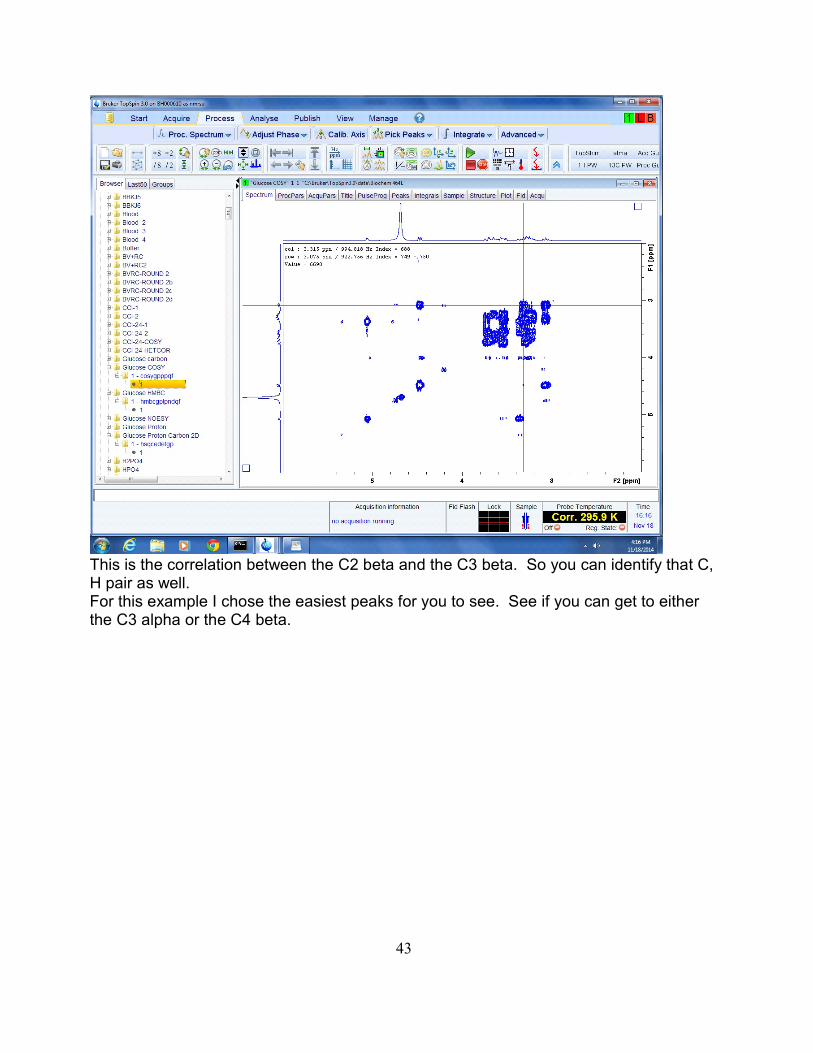
This is the correlation between the C2 beta and the C3 beta. So you can identify that C,H pair as well.For this example I chose the easiest peaks for you to see. See if you can get to eitherthe C3 alpha or the C4 beta.
43

Experiment C. Circular Dichroism - Determination of rate of mutatrotation reactionat different pH’s using Circular Dichroism.
The CD machine was not functional in 2014, but I will leave the lab procedure inthis manual just in case it gets fixed.
1. Make 100 mls of a 0.01M phosphate buffer solution. To adjust the pH of 1/3of this buffer to pH 6, 1/3 to pH 7 and 1/3 to pH 8. Turn on the water bath and set thetemperature of the bath to 25 C. (Make sure the water bath is actually hooked up too
circulate through the CD cell holder)Log in and turn the CD machine as given on sheets in the CD lab. Manually
adjust the wavelength to 202 nm. Set the sensitivity at 10 m /cm and the time constanto
at 4 seconds. Set of the computer to take data at a single wavelength for a fixed time. Set up the interface to reflect the values of wavelength, sensitivity and time constant thatthe machine has been set to. Now set the interface to record 100 points over a 40minute interval. When the machine is ready to go, start the final preparation of asample.
Accurately weigh about .5 g of sample and dissolve in mls of one of the buffers. As soon as the sample is dissolved place 3 mls in a 1 cm cylindrical CD cell. Place thecell in the CD machine and tell the computer to start acquiring data.
Once the data has been acquired, remove the CD cell, rise it with water, andprepare a another sample at a different pH and repeat the experiment, recording thedata to a different file.
Repeat with the third buffer.
Plot the three data sets. What was the initial and final reading in each data set? Did any of the sets look like they were leveling off and approaching equilibrium? Estimate the initial rate at each pH. Compare the rate of the mutatoration reaction at thedifferent pH’s.
To be handed in for evaluation1. A.Plots of m vs time for each pHo
B.Plots of log(m ) vs time for each pHo
C.Plots of 1/m vs time for each pHo
Are any of the above linear? Go back to a Freshman Chem text section onkinetics and find out what these plots mean and what they could tell you about thereaction.
2. Estimate of initial slope of this plot for each pH3. Assuming the initial slope = initial rate, plot the rate of the reaction vs pH4. If one of your plots in 1 was linear, what is the rate of the reaction, plot this rate vs pHfor your three different pH values.5. Verbally evaluate the plots 3 and 4. What do they mean?
44

Isolation of Genomic DNA from Wheat Germ
Purpose: In this lab you will extract DNA from wheat germ, and the use the UVabsorbtion spectrum of this material to roughly estimate the purity of the DNA.
Background: In theory this procedure can be used to isolate DNA from any source, andfor the past 6 years we have used bison liver as the source, so you are isolating DNAfrom the same organism as you isolated your LDH. However, we have never gottenreally good yields from liver tissue so in 2011 we will try using wheat germ as our sourceinstead of liver. First, what is wheat germ? Wheat germ is the part of the wheat kernel that contains theembryonic plant, so it should contain cells that are rich in DNA. In contrast, the bulk ofthe wheat kernel (the part we make flour from) is mostly starch that is used as a sourceof energy for the growing embryo, so it will have very little DNA.
Like many procedures used to isolate DNA, the first step is to homogenize the sourcetissue in a buffer that contains EDTA and NaCl. Tris is often used for this bufferbecause it buffers well at pH 8, and this is a pH where DNA is very stable. EDTA is achelating agent, that is, it binds divalent cations. It is included in the homogenationbuffer because many of the enzymes that degrade DNA require a divalent cation fortheir activity, and so, binding the divalent cations with EDTA we destroy the ability ofthese enzymes to degrade DNA. If we were isolated DNA from a bacterial culture, theEDTA would serve a second role because binding divalent cations weakens the outermembrane of gram negative bacteria. NaCl is included in the buffer to provide a nicemoderate ionic strength so the charge-charge interactions between DNA, and theprotein nucleosome is moderated, so the DNA is not so tightly bound to the protein.
In the next step of the procedure you add SDS (sodium duodecylsulfate) You shouldremember this compound as a detergent that is used to denature proteins to make SDSgels. It serves the same purpose here; it denatures proteins, and also helps to disruptthe membrane around the cells and the nucleus, to help release the DNA from the celland the proteins inside the cell.
Next you add 5M NaCl to the solution. This makes the ionic strength of the solutionmuch higher that it was. What will happen now is that some of the proteins will begin toprecipitate. This high ionic strength also screens out the charge-charge interactionsbetween DNA molecules making it easier to get the DNA to aggregate into long strandswhen you add ice cold ethanol in the last step of the purification.
45
Other steps frequently seen in DNA purification procedures are adding proteinase K,and doing a phenol extraction. Proteinase K is a proteolytic enzyme that helps todestroy proteins in the homogenate. This is a step I probably should add to make thisprocedure work for liver tissue, but this enzyme is extremely expensive. Phenolextraction is a step that helps to dissociate the DNA from the nuclear proteins. I haven’tincluded this step in this week’s procedure because phenol can give you a nastychemical burn, but you won’t feel it happening because it is also a local anesthetic.
Prelab Questions:1. The TES extraction buffer contains EDTA. Why?
2. In step 5 you add SDS to the cell extract. Why?
3. In step 9 you add NaCl. Why?
4. In step 12 you add ice-cold ethanol. Why?
Procedure:1. Make 100 mls of TES (Tris-EDTA-NaCl) buffer
10 mM Tris Base5 mM EDTA100 mM NaCl
Check with the instructor that you have calculated the correct amount of eachmaterial.
Adjust pH of buffer to 8.0 with NaOH
2. Get about 15 g of wheat germ.
3. Place tissue and 100ml of TES solution in blender.
4. Blend briefly until you have a homogenous suspension.
5. Add 1/10th volume of 10% SDS and gently mix the solution.
6. Immediately pour into two Oak Ridge centrifuge tubes and balance the tubes.
7. Place the homogenate/SDS solution in a 60 C water bath for 30 minutes. Gently stiro
the solution occasionally during this time period.
8. Dry the tubes and centrifuge for 10 minutes at 8,000 x g at 10 C.o
46

9. Discard the pellet of cellular debris.
10. Pour the supernatant into a beaker and add 1/10 volume of 5M NaCl and mix.
11. Place in a refrigerator for 24 hours so protein will precipitate.
12. Place in two 55 ml Oak Ridge tubes, balance, and centrifuge at 8,000 x g for 10minutes at 10 C.o
13. Again discard the pellet
14. Transfer the supernatant to a pre-chilled beaker (probably use two 50 ml beakers).
15. Slowly add about 10 ml of 100% ice-cold ethanol by pouring gently down the side ofeach beaker so it layers on top of the water with minimal mixing.
16. The DNA will begin to form a glop at the ethanol-water interface. Let this solution sitfor a few minutes, then carefully spool the DNA onto a modified Pasteur pipette.
17. Wash the DNA on the pipette with 70% ethanol. Then allow to dry at RT for about 1hour.
18. Place 3 ml of TE buffer in a test tube, and place the Pasteur pipette with the DNAinto the test tube so the DNA dissolves into the buffer. This make take several minutesor you can let it sit in the refrigerator overnight. You may gently swirl the DNA during thisprocess.
19. After the DNA has re-dissolved in the TE buffer, obtain a UV spectrum of thematerial between 350 and 220 nm using quartz cuvettes. Before you actually run thespectrometer, take a look at your sample. Is it cloudy? If it is cloudy, place it in anEppendorf tube and centrifuge in a microfuge at high speed for 2 minutes to clarify thesolution. You will have to use trial and error to find the right dilution so that the 260nmpeak has an absorbance of about 1.0. Analyze the purity of your DNA using theinformation given below.
Spectrophotometric Analysis :Both DNA and RNA have an absorbance maximum at 260 nm. If you have a pure DNA
260sample, a solution that has a concentration of 50 ìg/mL will have an A of 1.0. This willvary slightly depending on the %GC in the DNA, but not enough to make a difference into day’s analysis.
47
The most common problem observed in DNA isolated by this procedure is that someparticulate matter is suspended in the final DNA sample. This can either be DNA thathas not fully dissolved in the TE buffer, or it might be protein precipitate that has notbeen completely removed from the sample. The easiest way to check for this problem isto look at your absorbance at 330 nm. With a properly dissolved DNA sample that does
330 260not contain any protein precipitate, the A should be less than 5% of the A value. If itis higher, then you have a problem. The problem may not be the sample either. Oneother factor that can cause a high reading at 330 nm is a dirty cuvette. So if you havean anomalously high reading at 330 nm check that your cuvette is clean before you giveup on your sample.
Proteins have an absorbance peak at 280 nm, so this is another wavelength we can
260 280examine. A pure DNA sample should have an A :A ratio between 1.8 - 1.9. If theratio is higher than 1.9, then you probably have RNA as a contaminant. If the ratio islower than 1.8 then you probably have a protein contaminant.
The final wavelength to examine is 234 nm. This is a wavelength where DNA should
234 260have an absorbance minimum, and the A : A ratio for DNA should be about .5, if it ishigher, that would indicate either phenol or protein contamination.Fill in the following table:
330 280 260 234Dilution A A A A 260 280 234 260A /A A /A [DNA](Dilute
solution)
[DNA] (Original)
Attach a copy of your spectrum and use the above data to evaluate the purity of yourDNA.
48

Lipid Lab
Prelab questions:Among the compounds you will isolate today should be Palmitic, Stearic and Oleic acids,cholesterol, and stigmasterol. Give the structure of these compounds
Synopsis:Common fats or oils will be subjected to basic conditions in a methanol solvent. Theseconditions will serve to cleave fatty acid-glycerol ester bonds, but will leave other lipidslike cholesterol intact. Since the fatty acids are now in the acid form, they are slightlysoluble in water and so they can be separated from other lipids by solvent extraction.The fatty acids are then derivatized to make then non-polar and they will be injected onthe GC/MS to try to identify the different fatty acids found in the sample, and get a roughestimate of the amount of each fatty acid found in the sample. The non-hydrolyzablelipid sample may also be subject to GC/MS to try to identify other lipid components.
Day 1 Isolation of lipid components and derivatization
Obtain 0.5 g of fat or oil and try to dissolve it in 40 mLs of a 2:1 mixture of ethylalcohol and ether. (Do this in a fume hood.) Use your stir rod to break up the largerchunks, but do not heat the solution. After 10 minutes, gravity filter the solution usingfilter paper in a short stem glass funnel. Wash the solid material with an addition 10 mLof the alcohol ether solution. Discard the solid, and place the liquid your glassevaporating dish and heat on a hot plate in the hood until the solvent is evaporated.(Note, in some cases you may end up with an oil, rather than a solid!)
Once the beaker has cooled add 25 ml of 10% methanolic KOH and heat thissolution to boiling and keep it simmering for about 30 minutes. Add additional methanolas needed to keep the volume constant. Record any observations.
At this point the fatty acids have been converted to their potassium salts and areno longer soluble in the cold methanol, while other components like cholesterol are stillsoluble in the solvent. Cool the solution on ice and note if any precipitate forms oncooling. Gravity filter the solution using a stemless funnel and filter paper. The liquid willcontain cholesterol or stigmasterol and other non-hydrolyzable lipids, while the solidcontains the potassium salts of the fatty acids. SAVE BOTH.
Liquid:Put the liquid in glass evaporating dish, and place on a hot plate. On low heat
evaporate the solvent. Note: as the solution get more concentrated, it will get thickerand start to ‘pop’ and get very messy. When this begins to happen, put a watch glassover the top of the evaporating dish to keep the mess to a minimum. Try to take thesample to dryness. If this takes more than 15-20 minutes, see your instructor. Is thereanything there? Scrape a single spatula full of this solid and attempt to dissolve it in 50mL of ether. After it is looks like it has dissolved, place it in a 125 mL separatory funneland add 50 mL of saturated NaCl. Gently swirl these two liquids together. If it looks like
49
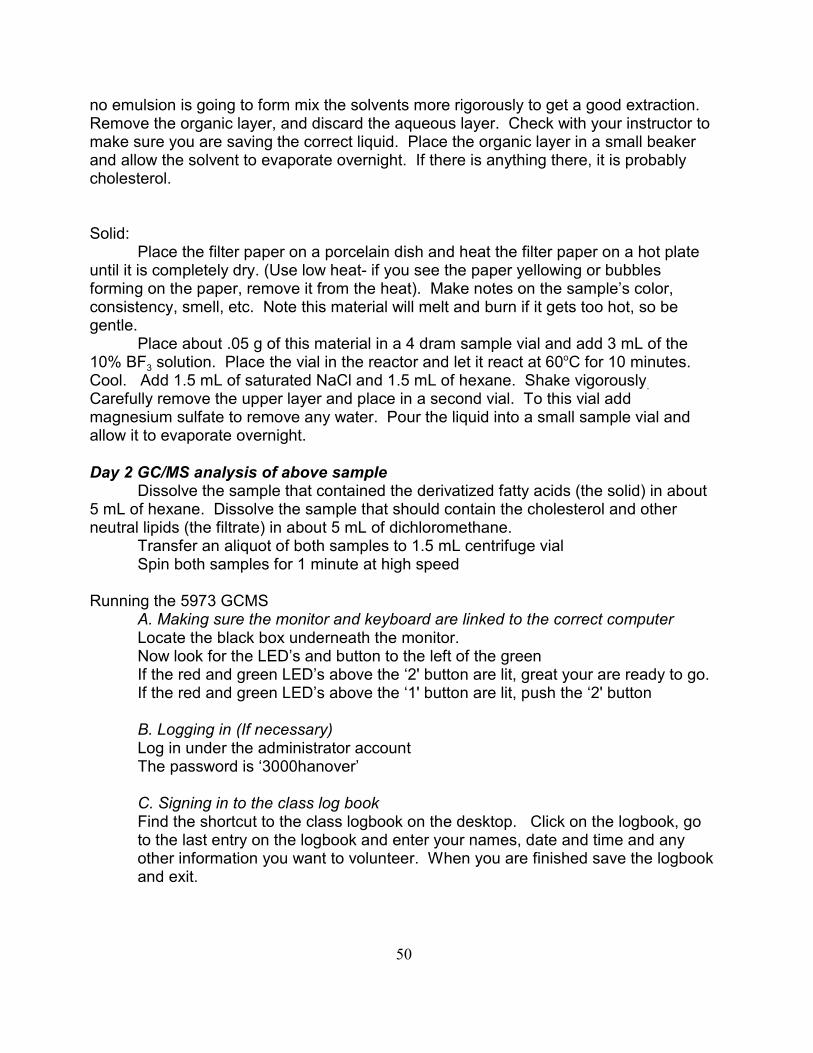
no emulsion is going to form mix the solvents more rigorously to get a good extraction. Remove the organic layer, and discard the aqueous layer. Check with your instructor tomake sure you are saving the correct liquid. Place the organic layer in a small beakerand allow the solvent to evaporate overnight. If there is anything there, it is probablycholesterol.
Solid:Place the filter paper on a porcelain dish and heat the filter paper on a hot plate
until it is completely dry. (Use low heat- if you see the paper yellowing or bubblesforming on the paper, remove it from the heat). Make notes on the sample’s color,consistency, smell, etc. Note this material will melt and burn if it gets too hot, so begentle.
Place about .05 g of this material in a 4 dram sample vial and add 3 mL of the
310% BF solution. Place the vial in the reactor and let it react at 60 C for 10 minutes. o
. Cool. Add 1.5 mL of saturated NaCl and 1.5 mL of hexane. Shake vigorouslyCarefully remove the upper layer and place in a second vial. To this vial addmagnesium sulfate to remove any water. Pour the liquid into a small sample vial andallow it to evaporate overnight.
Day 2 GC/MS analysis of above sample
Dissolve the sample that contained the derivatized fatty acids (the solid) in about5 mL of hexane. Dissolve the sample that should contain the cholesterol and otherneutral lipids (the filtrate) in about 5 mL of dichloromethane.
Transfer an aliquot of both samples to 1.5 mL centrifuge vialSpin both samples for 1 minute at high speed
Running the 5973 GCMSA. Making sure the monitor and keyboard are linked to the correct computerLocate the black box underneath the monitor.Now look for the LED’s and button to the left of the greenIf the red and green LED’s above the ‘2' button are lit, great your are ready to go.If the red and green LED’s above the ‘1' button are lit, push the ‘2' button
B. Logging in (If necessary)Log in under the administrator accountThe password is ‘3000hanover’
C. Signing in to the class log bookFind the shortcut to the class logbook on the desktop. Click on the logbook, goto the last entry on the logbook and enter your names, date and time and anyother information you want to volunteer. When you are finished save the logbookand exit.
50

D. Starting 5973 systemClick on the 5973 GCMS iconAs the program comes up, look to see that is says: C:\MSDCHEM\1\METHODS\LIPIDS1.M is loaded
on the green line along the bottom of the 5973 GCMS window. If itdoesn’t, contact Dr. Z. to load in the correct method.
Now look for the icon that has a small box that is either red or green in the upperright hand corner of the icon. This tells you the status of the machine. If the boxis green you are ready to go, if it is red, then you are waiting for something.
Let’s assume the box just turned green so the machine is ready to go.Find the large box in the top middle center that has a green arrow, and the words‘Sample name:’ & ‘Data file:’ in it. Click anywhere in this box.Fill in at least the operator name and the data file name. Any of the other boxesare optional.When you fill in the data file name, make sure you only have eight characters inthe first part of the name. There is a glitch in the software that will get you later ifthe data file name has more than eight characters. Also be sure to include the .Dextension, so the computer knows this is a data file
Once you have filled in the window, click on the ‘Start Run’ Button at the bottomof the window. The window will disappear and in about a minute a window willappear on the computer.
While you are waiting you should start preparing your sample for injection.The usual technique is to rinse the syringe and needle with solvent at least threetimes to clean out any ka-ka left over from the previous user. Next rinse thesyringe and needle with your sample at least 3 times. Finally, fill the needle with1-2 ìL of your sample and inject the sample into the GC by inserting the needlecompletely into the injection port, then depressing the plunger on the syringe, andthen press the start button on the GC to tell the computer to acquire data. Finallyremove the needle from the injection port. Immediately wash the needle andsyringe with pure solvent another three times.
By now you should have noticed that the computer is displaying a message aboutoverriding the solvent delay. Essentially the solvent delay tells the computer notto acquire any data in the first 5 minutes, because this is when the solvent blowsthrough the column, and when the mass of solvent hits the detector it can gunk itup. NEVER OVERIDE the solvent delay. So Hit the NO button, (Better yet, don’tdo anything and all, that is just as good)
51

The computer is now acquiring your data, and there is not much you can do. Ifthis is your second run, you can start to analyze your first run, but other than that,the machine is now on autopilot. At the end of the run, the machine willautomatically cycle itself back to the ready state. You can tell when it is ready foryour next injection by watching the little box on the upper right hand corner of theoven icon. If it is red, the machine is not ready, if it is green - you are good to go.
52

Use of MS5973 Data Analysis program for analysis ofGC/MS data
Double Click on 5973 GCMS Data Analysis icon What comes up is the last chromatogram analyzed, so you must first load your
chromatogramClick on File – Load data file – Find your file on the list and hit OKYou will have 2 data sets displayed.
The upper set is the TIC or Total Ion Chromatogram or the sum ofall the mass spec signals as a function of time
The Lower is the FID or Flame Ionization Detector signal. Since thisdetector was turned off during your run, all it shows is a lot of garbage, soyou may close that window.
The TIC window shows where the different compounds come off during your run,but it doesn’t show the mass spectrum of any particular peak. To get the massspectrum of a component peak you need to tell the computer which peak to use.
Move the cursor to one edge of a peak. Now press the right mouse button andhold it down while you move the cursor to the other side of the peak. When you releasethe mouse button the mass spectra will of that peak will appear in the lower windowlabeled average of … where the two numbers listed are the start and end times of thepeak you are analyzing.
The mass spectrum itself is not terribly useful because in the ionization processthe molecule was decomposed into anywhere between 10 and 100 fragments, and themass of each different fragment appears in the spectrum. However, because theionization conditions are fairly well standardized, each compound usually yields thesame pattern of fragments when it is ionized, so the overall pattern you see can bematched into a library of compounds and their fragments. The Analysis routine canaccess the NIST library and can math the pattern of fragments in your compound to1000’s of other compounds.
To do thisClick on Spectrum – NIST Search
The NIST search window that comes up is pretty busyTop center is your spectrumBottom Center is the best match that the computer could find for your spectrumIn between is a figure that is supposed to show the differences between the two.Right bottom is a screen that shows the general information about the match,
including such useful items as the name (or names) and the molecular weightLeft bottom is a window that shows the different matches and how good they areMove your cursor over to that screen and click on a few different matches. See
how the other screens change as a different spectrum and compound is matched toyour sample? Also note that some of the entries are labels M, which means the mean oraverage of several different spectra form different sources, while others are labeled with
53

an R (?original) for a single spectrum
The best match found by the computer may NOT by your compound. Go up anddown the list of matches and look for names that look familiar. Use your own judgmentto see if you think some of these other compounds look better or worse than the ‘best’match. Also use some chemical logic, should the proposed match be in your sample?
Once you have identified all of the peaks in the chromatogram, next try toquantitate how much is in each peak. This is done by going to the upper bar and findingthe chromatogram tab. This opens a short menu and the bottom part of this menu dealswith integrating the area in each peak and reporting it. If you simply click on the%Report it will give you a table with the % of total of each peak. If you look carefully youwill probably see come blue lines on each peak showing how the computer chose thepeaks and the baselines used for each area. You can play with some of the otherchoices under the chromatogram tab to see if you can improve your results.
There are a lot of options from this window, and I haven’t figured them out, feelfree to play around a bit. Once you are tired of this window simply hit the X in the upperright corner to kill the window. You should now be back on your chromatogram. Findanother peak and investigate it. Have fun. When you are finished you can either loadanother data file, or kill the window by hitting the X. At his point a bell will chime and youwill be told to save the changes. Ignore this – hit Yes for exit and you are done.
Post lab analysis:For this lab I have decided to have you submit a formal lab report. See the website:www.mhhe.com/biosci/genbio/maderinquiry/writing.html
For a nice concise description of the standard format for a lab report. These lab reportsare to be individual efforts not group efforts. I want to see your writing, not your group’swriting.
54
More information on GC/MSRunning the GC/Mass spec gets you exposed to two instruments, the GasChromatograph and the Mass Spectrometer. Since this is a Biochemistry Class, I can’tspend time describing the details of these instruments other, than the brief overview thatI give you in the lab. I’m sure, however, that some of you are curious as to how thesething work, so I want to give you some alternate resources to look at if you areinterested. For an explanation of Gas Chromotagraphy try the following web site
http://www.shu.ac.uk/schools/sci/chem/tutorials/
Go to the lower part of the page, ‘Resources for Analytical Science’ and underchromatography hit the gas chromatography link
For more information on the mass spec part of the machine go the shelves in by thedoor, and find a rack of CD’s. Find the CD entitled ‘MSD Reference Collection’. Put it inthe CD ROM of the GC/MS computer, then double click on the HP5973 MSD ReferenceIcon. This will bring up an HP instruments page on the computer. On the left side clickon the MS Fundamentals link. You now will have a page with several additional links. The one you want to look at is ‘MS Hardware’ This has information and several shortmovies in it that will take you through the MS instrument part-by-part. Read as much asyou like. When you are finished , get out of the window and put the CD back where youfound it
55


![[CHEM] Chem Nomenclature](https://img.pdfslide.net/doc/110x75/577dabac1a28ab223f8ccaec/chem-chem-nomenclature.jpg)


