Embed Size (px)
Citation preview

1
Cancer Cell, Volume 23
Supplemental Information
Itraconazole and Arsenic Trioxide Inhibit Hedgehog
Pathway Activation and Tumor Growth Associated
with Acquired Resistance to Smoothened Antagonists
James Kim, Blake T. Aftab, Jean Y. Tang, Daniel Kim, Alex H. Lee, Melika Rezaee, Jynho Kim, Baozhi Chen, Emily M. King, Alexandra Borodovsky, Gregory J. Riggins, Ervin H. Epstein, Jr., Philip A. Beachy, and Charles M. Rudin
Inventory of Supplemental Information Supplemental Data
Figure S1 – Related to Figure 2
Figure S2 – Related to Figure 3
Table S1 – Related to Figure 3
Figure S3 – Related to Figure 4
Table S2 – Related to Figure 4
Table S3 – Related to Figure 4
Figure S4 – Related to Figure 6
Table S4 – Related to Figure 6
Figure S5 – Related to Figure 7 Supplemental Experimental Procedures
1
Supplemental Data
Figure S1. Related to Figure 2. (A) 8×-GLI-luciferase signaling assay with Smo-/- cells transfected with either SmoWT (blue) or SmoD477G (red) and stimulated with SHH-N conditioned medium, KAAD-cyclopamine IC50 is 69 nM for SMOD477G and 10 nM for SMOWT. Data represent mean of triplicates ± SD. (B) Relative Gli1 transcription in murine medulloblastoma neurospheres expressing endogenous SMOD477G (orange) or SMOWT (blue), in the presence of indicated concentrations of the cyclopamine-competitive inhibitor HhAntag.
2
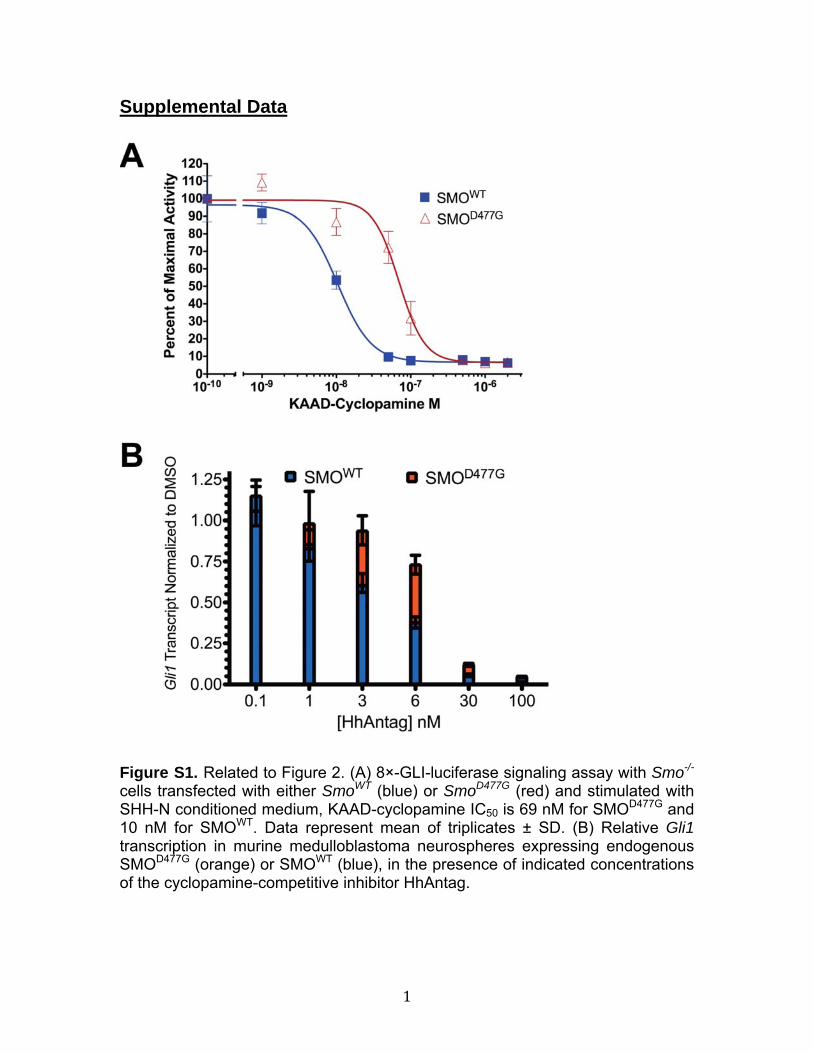
Figure S2. Related to Figure 3. Same data set as Figure 3C represented as percent of maximal pathway activity. Data represent mean of triplicates ± SD. See Table S1.
3
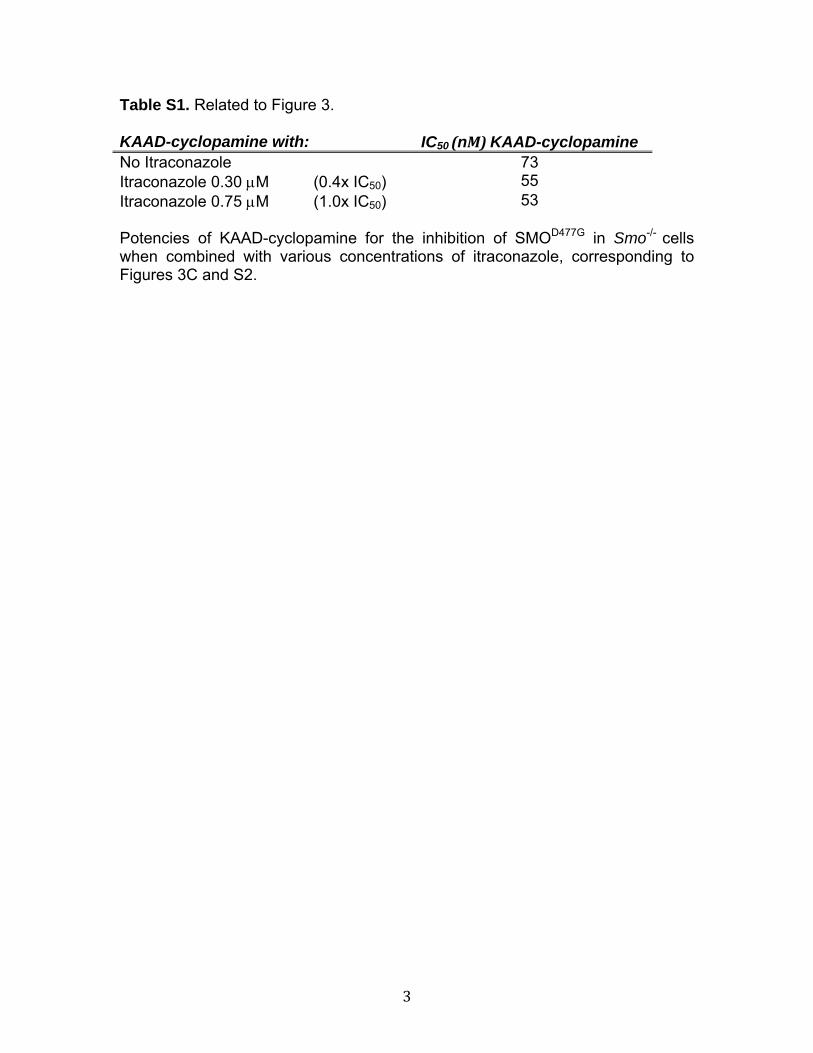
Table S1. Related to Figure 3. KAAD-cyclopamine with: IC50 (nM) KAAD-cyclopamine No Itraconazole 73 Itraconazole 0.30 M (0.4x IC50) 55 Itraconazole 0.75 M (1.0x IC50) 53 Potencies of KAAD-cyclopamine for the inhibition of SMOD477G in Smo-/- cells when combined with various concentrations of itraconazole, corresponding to Figures 3C and S2.
4
5
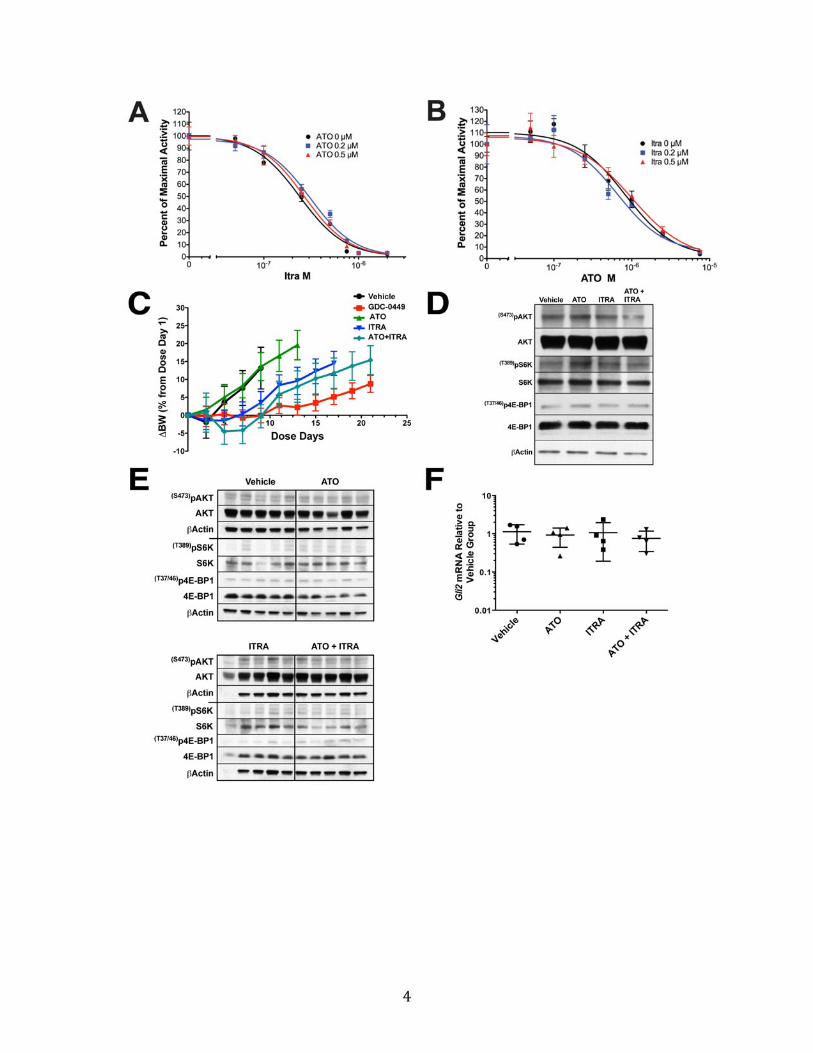
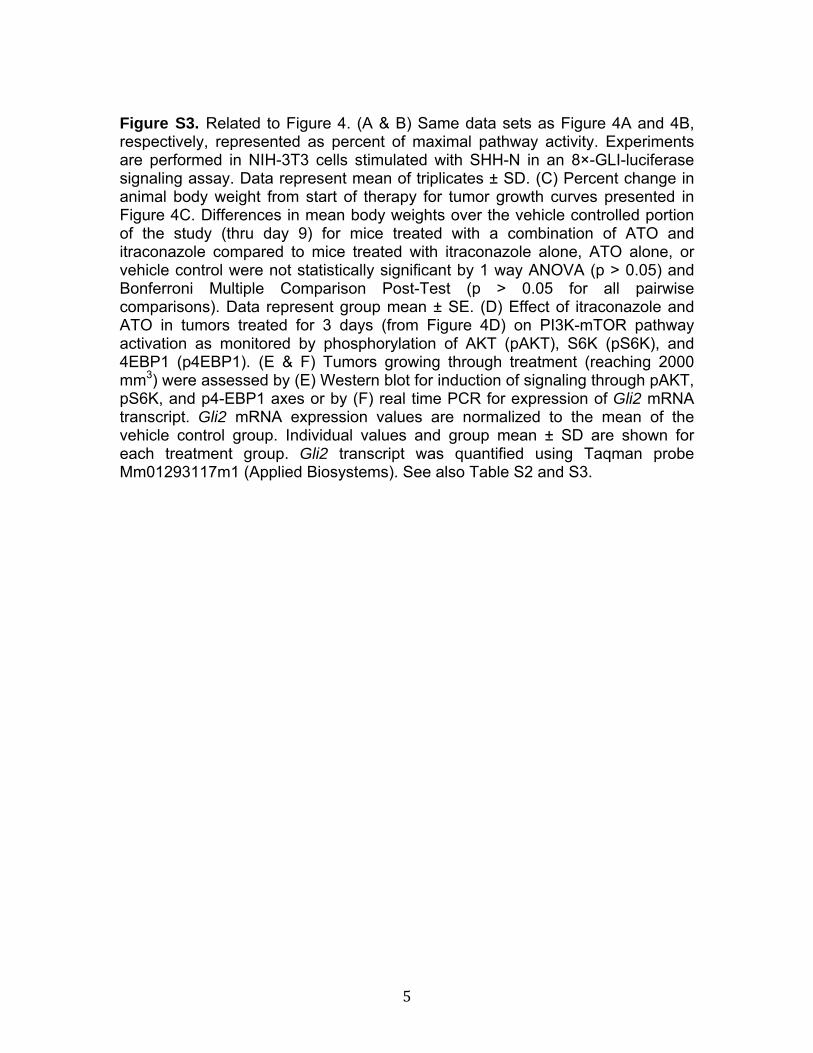
Figure S3. Related to Figure 4. (A & B) Same data sets as Figure 4A and 4B, respectively, represented as percent of maximal pathway activity. Experiments are performed in NIH-3T3 cells stimulated with SHH-N in an 8×-GLI-luciferase signaling assay. Data represent mean of triplicates ± SD. (C) Percent change in animal body weight from start of therapy for tumor growth curves presented in Figure 4C. Differences in mean body weights over the vehicle controlled portion of the study (thru day 9) for mice treated with a combination of ATO and itraconazole compared to mice treated with itraconazole alone, ATO alone, or vehicle control were not statistically significant by 1 way ANOVA (p > 0.05) and Bonferroni Multiple Comparison Post-Test (p > 0.05 for all pairwise comparisons). Data represent group mean ± SE. (D) Effect of itraconazole and ATO in tumors treated for 3 days (from Figure 4D) on PI3K-mTOR pathway activation as monitored by phosphorylation of AKT (pAKT), S6K (pS6K), and 4EBP1 (p4EBP1). (E & F) Tumors growing through treatment (reaching 2000 mm3) were assessed by (E) Western blot for induction of signaling through pAKT, pS6K, and p4-EBP1 axes or by (F) real time PCR for expression of Gli2 mRNA transcript. Gli2 mRNA expression values are normalized to the mean of the vehicle control group. Individual values and group mean ± SD are shown for each treatment group. Gli2 transcript was quantified using Taqman probe Mm01293117m1 (Applied Biosystems). See also Table S2 and S3.
6
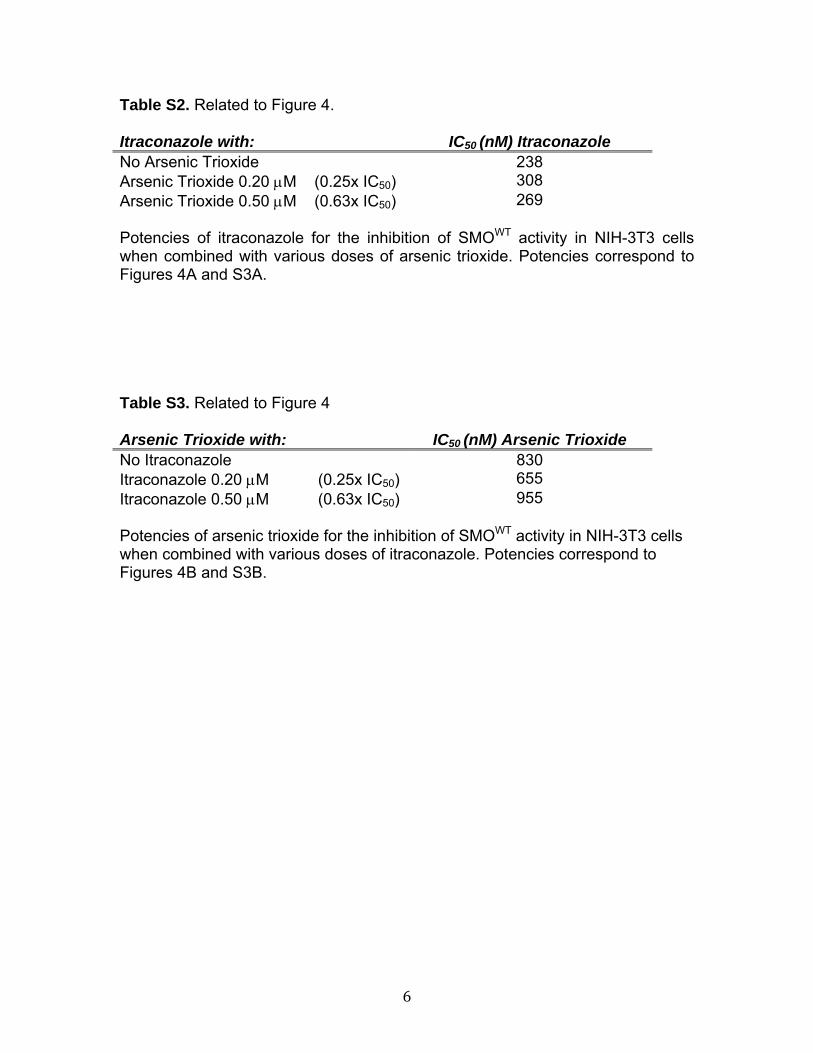
Table S2. Related to Figure 4. Itraconazole with: IC50 (nM) Itraconazole No Arsenic Trioxide 238 Arsenic Trioxide 0.20 M (0.25x IC50) 308 Arsenic Trioxide 0.50 M (0.63x IC50) 269 Potencies of itraconazole for the inhibition of SMOWT activity in NIH-3T3 cells when combined with various doses of arsenic trioxide. Potencies correspond to Figures 4A and S3A. Table S3. Related to Figure 4 Arsenic Trioxide with: IC50 (nM) Arsenic Trioxide No Itraconazole 830 Itraconazole 0.20 M (0.25x IC50) 655 Itraconazole 0.50 M (0.63x IC50) 955 Potencies of arsenic trioxide for the inhibition of SMOWT activity in NIH-3T3 cells when combined with various doses of itraconazole. Potencies correspond to Figures 4B and S3B.
7
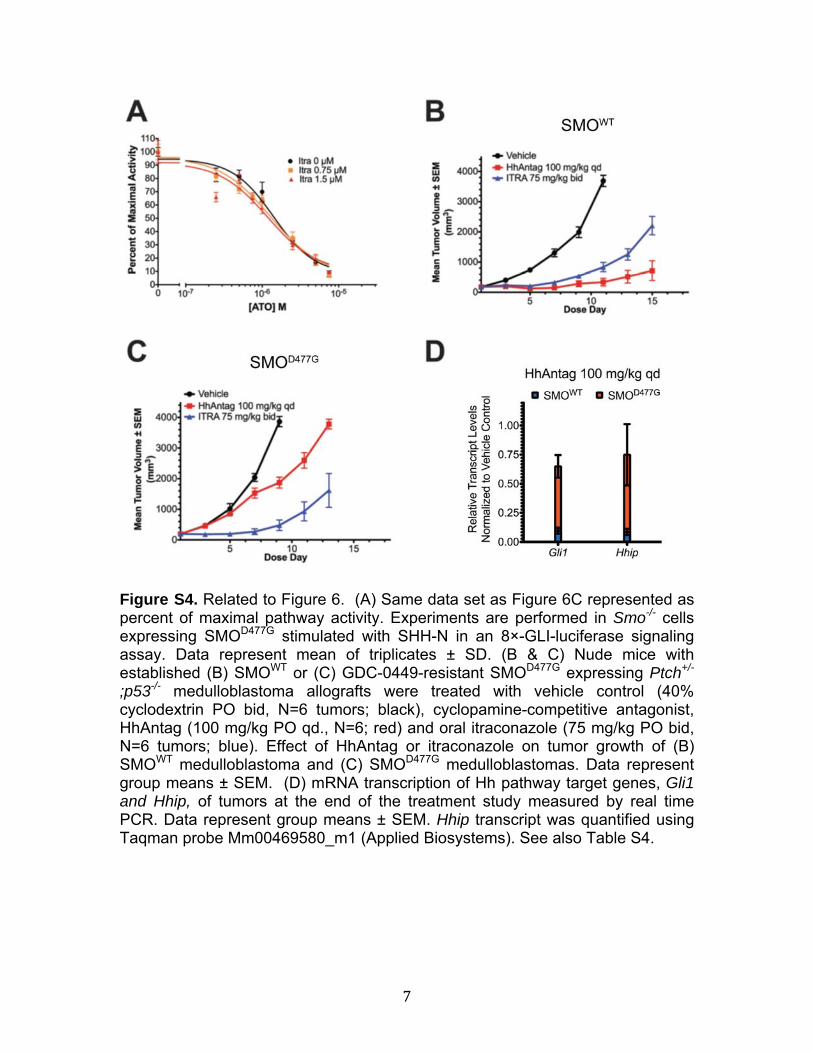
Figure S4. Related to Figure 6. (A) Same data set as Figure 6C represented as percent of maximal pathway activity. Experiments are performed in Smo-/- cells expressing SMOD477G stimulated with SHH-N in an 8×-GLI-luciferase signaling assay. Data represent mean of triplicates ± SD. (B & C) Nude mice with established (B) SMOWT or (C) GDC-0449-resistant SMOD477G expressing Ptch+/-
;p53-/- medulloblastoma allografts were treated with vehicle control (40% cyclodextrin PO bid, N=6 tumors; black), cyclopamine-competitive antagonist, HhAntag (100 mg/kg PO qd., N=6; red) and oral itraconazole (75 mg/kg PO bid, N=6 tumors; blue). Effect of HhAntag or itraconazole on tumor growth of (B) SMOWT medulloblastoma and (C) SMOD477G medulloblastomas. Data represent group means ± SEM. (D) mRNA transcription of Hh pathway target genes, Gli1 and Hhip, of tumors at the end of the treatment study measured by real time PCR. Data represent group means ± SEM. Hhip transcript was quantified using Taqman probe Mm00469580_m1 (Applied Biosystems). See also Table S4.
8
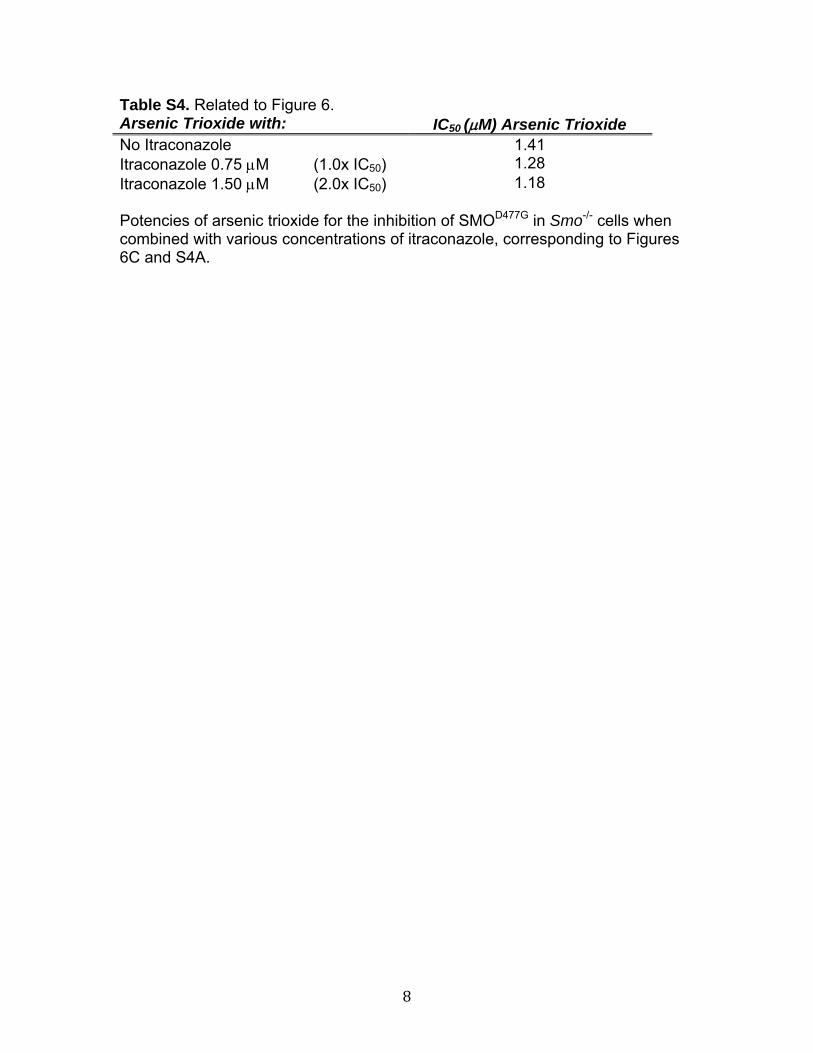
Table S4. Related to Figure 6. Arsenic Trioxide with: IC50 (M) Arsenic Trioxide No Itraconazole 1.41 Itraconazole 0.75 M (1.0x IC50) 1.28 Itraconazole 1.50 M (2.0x IC50) 1.18 Potencies of arsenic trioxide for the inhibition of SMOD477G in Smo-/- cells when combined with various concentrations of itraconazole, corresponding to Figures 6C and S4A.
9
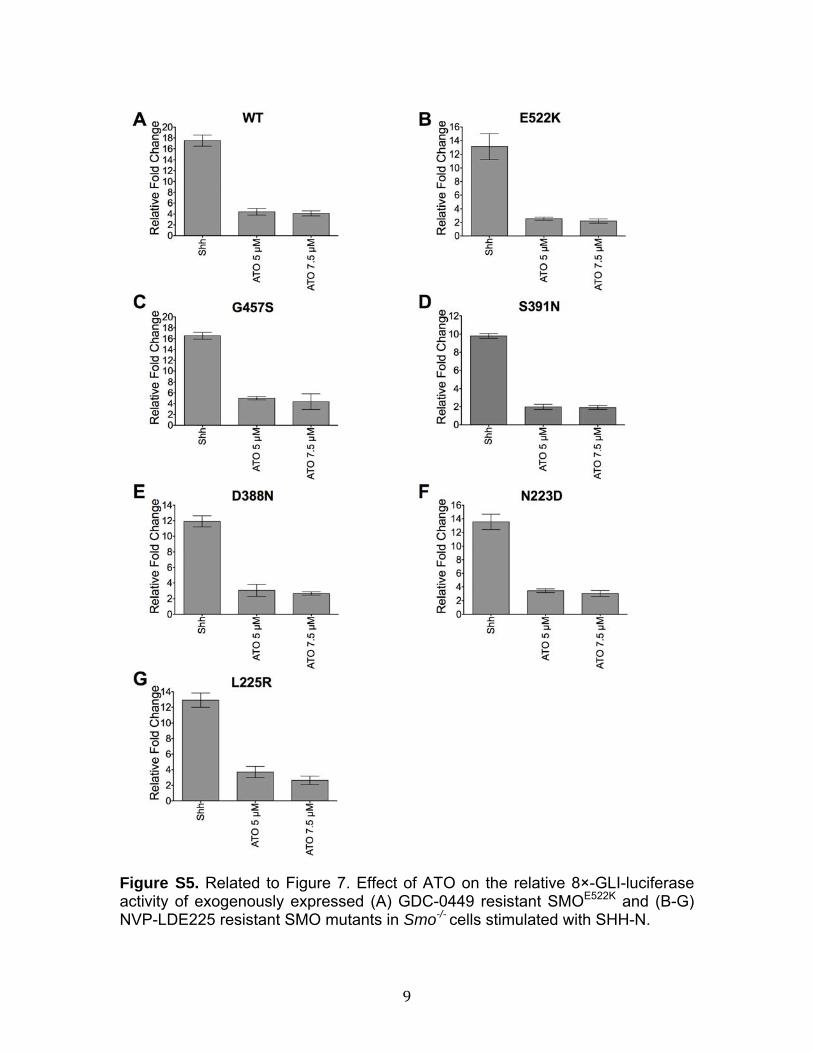
Figure S5. Related to Figure 7. Effect of ATO on the relative 8×-GLI-luciferase activity of exogenously expressed (A) GDC-0449 resistant SMOE522K and (B-G) NVP-LDE225 resistant SMO mutants in Smo-/- cells stimulated with SHH-N.
10
Supplemental Experimental Procedures Reagents For in vitro experiments, itraconazole (Sigma), vismodegib (GDC-0449; LC Laboratories) and NVP-LDE225 (LC Laboratories) were dissolved in DMSO. ATO solution (Trisenox; Cephalon Inc) or ATO powder (Sigma) was used for in vitro experiments. ATO powder was formulated as previously described (Zhu et al., 2002). Briefly, ATO was dissolved at a 250 mM concentration in 1N NaOH and then diluted 1:50 in PBS with adjustment to pH 8.0. For in vivo experiments, itraconazole oral solution (Sporanox, Ortho Biotech) and ATO (Trisenox; Cephalon Inc.) were obtained from the pharmacies of The Johns Hopkins and Stanford Cancer Centers and diluted as necessary with 40% hydroxypropyl-cyclodextrin in water or phosphate buffered saline, respectively. HhAntag was a kindly provided by Genentech, Inc. For in vivo studies, GDC-0449 was formulated in 0.5% hydroxypropyl methylcellulose with 0.2% Tween 80 in water and dosed 100 mg/kg PO bid. ATO was administered 7.5mg/kg IP qd and itraconazole was administered 75 mg/kg PO bid, both as single-agents and in combination. HhAntag was kindly provided by Genentech, Inc. Cell Based Signaling Assays NIH-3T3 cell line was obtained from ATCC and maintained in DMEM media containing 10%(v/v) calf serum, penicillin, streptomycin, L-glutamine supplemented with Geneticin (Invitrogen) 400 g/ml, and Zeocin (Invitrogen) 100 g/ml. Smo-/- fibroblast cell line (Varjosalo et al., 2006) were maintained in DMEM media containing 10%(v/v) fetal bovine serum, penicillin, streptomycin, L-glutamine. SHH-N conditioned medium (CM) was prepared as previously described (Maity et al., 2005). Control HEK 293 CM was prepared in the same manner as SHH-N CM. Stock SHH-N CM and HEK 293 CM (for control) were diluted 20-fold with the appropriate media for various Hh pathway signaling assays. Plasmid constructs for SmoWT or SmoD477G, Gli2 (Kim et al., 2010), GFP, GLI dependent firefly luciferase reporter, and TK-Renilla luciferase reporter (Taipale et al., 2000) have been described previously. Constructs for other Smo resistance mutants were constructed using standard site mutagenesis techniques to the pCEFL-SmoWT and verified by DNA sequencing. Fugene 6 (Roche Applied Science) or TransIT (Mirus Bio) transfection reagents were used for all transient transfections. For SMO experiments, a ratio of 4 l:1.5 g (transfection reagent:DNA) was used. Each well of a 24 well multi-well plate was transfected with 375 ng of total DNA with 1% SmoWT or mutant construct, 49% GFP, 49.5% firefly luciferase and 0.5% TK-Renilla. For GLI2 experiments, a ratio of 3 l:1.0 g (transfection reagent:DNA) was used. Each well of a 24 well multi-well plate was transfected with 250 ng of total DNA with 2% Gli2, 48% GFP, 49.5% firefly luciferase and 0.5% TK-Renilla.
11
All assays for Hh pathway activation were performed in 24 well tissue culture plates. Cells were grown in 10% (v/v) serum media until completely confluent. 293 CM and SHH-N CM were diluted in DMEM media containing 0.5% (v/v) serum, penicillin, streptomycin, L-glutamine and HEPES 2.5 mM. Cells were incubated for ~40 hrs with drug treatments. Relative luciferase (fold induction) units were obtained by normalization of Hh pathway stimulated cells with unstimulated cells (all other conditions being equal) grown on a separate plate in parallel. All luminescence assays were performed on a Fluostar Optima (BMG Labtech) or Centro (Berthold Technologies). Luminescence assays were performed according to manufacturer’s instructions using Dual Luciferase Assay Reporter System (Promega). Dose response curves and IC50 values were determined by fitting the data with four parameter logarithmic nonlinear regression analysis using GraphPad Prism software. In Vivo Studies Mice were housed in a barrier facility at and kept at standard conditions: fluorescent lighting 12 hours per day, room temperature 25C, and relative humidity 45-55%. All studies were approved by and conformed to the policies and regulations of the respective Institutional Animal Care and Use Committees at The Johns Hopkins University and the Children's Hospital Oakland Research Institute. Basal Cell Carcinoma Allograft Model Endogenous BCC tumors from Ptch1+/-;K14-CreER/+;p53fl/fl mice (Tang et al., 2011) were aseptically removed and placed in HBSS (Invitrogen), minced with 15-blade, and digested with Collagenase I (Invitrogen) for 1-2 hours in a 37°C water bath. Following digestion, calcium-free DMEM containing 10% chelexed fetal bovine serum was added to neutralize the sample and the sample was filtered through 70µm cell strainers (BD Bioscience). Single cell suspensions were washed in DMEM and cells were spun at 800rpm for 5 minutes. Tumor suspensions were mixed 1:1 with Matrigel (BD Biosciences) and 2.0 x 10⁶ cells were subcutaneously injected into three sites: left and right lateral sides and the back of NOD/SCID mice (Jackson Laboratories). Engrafted mice were enrolled in the study when visible tumors reached 5mm in diameter. Cyclodextrin vehicle control or 75 mg/kg itraconazole was administered by oral gavage twice-daily on weekdays and once-daily on weekends. Phosphate buffered saline (PBS) vehicle control or ATO at 7.5mg/kg was administered via intraperitoneal injection on a once-daily schedule. Tumor growth was monitored twice-weekly by caliper measurements. Medulloblastoma Allograft Models Briefly, freshly isolated allografts were mechanically dissociated into single-cell suspensions by two passages through a 70 µm nylon filter. For hind-flank
12
xenografts 2 × 10⁶ viable cells were suspended in equal volumes of PBS and Matrigel (BD Pharmingen) and implanted as a subcutaneous bolus in adult athymic nude mice (Charles River Laboratories). Once tumors reached ≥150 mm3, calculated as V = L × W2 / 2, mice were treated with oral hydroxypropyl cyclodextrin and intraperitoneal PBS vehicle controls, GDC-0449 [100 mg/kg PO bid], itraconazole [75 mg/kg PO bid], ATO [7.5 mg/kg IP qd] or a combination of itraconazole and ATO. Tumors were measured using calipers every other day from the start of treatment. All treatments were administered in 10 ml/kg volumes with 11 to 13 h separation between twice-daily treatments. Growth patterns were summarized graphically by plotting the mean and SEM for each treatment group over time. A one-way analysis of variance was used to compare all treatment arms using GraphPad Prism software (v5.0a). Tumor growth inhibition was calculated as a percent change demonstrated by the comparator arms, calculated as (1-(Yd-X0)/(Xd-X0))•100; where X0 is the mean tumor volume for all groups on day 1 of treatment, Yd is the mean tumor volume for the experimental arm on day d, and Xd is the mean tumor volume for the comparator group on day d. Percent regression is calculated as 100•(X0-Yd)/X0 for treatment arms with mean tumor volumes below the initial values. For orthotopic models, 5x10⁵ SG274 cells were suspended in Neurobasal Media-A supplemented with retinoic acid deficient B-27 extract (NBMedia; Invitrogen). Cells were delivered in a 3 l volume to the cerebrum 2.5 mm below the dura at a location 3 mm anterior of the bregma and 2 mm left of the midline with the aid of a stereotactic frame and a 5 l Hamilton syringe affixed with a 25 gauge needle. Animals were randomized and treatment initiated 36 h post inoculation. Study events were recorded and analyzed using GraphPad Prism software (v5.0a) and presented by Kaplan-Meier analysis with p values determined for pairwise group comparisons using Gehan-Breslow-Wilcoxon test. MB Culture and Proliferation Assays MB neurosphere cultures were derived from either parental or SG274 hind-flank allografts using previously described methods(Shi et al., 2011). Briefly, following mechanical dissociation and viable cell fractioning, MB cells were cultured in NBMedia for three passages prior to assays, with “neurospheres” disaggregated with Accumax (Innovative Cell Technologies) between passages. MB cultures, derived from either parental or SG274 allografts, were seeded 1x10⁴ into wells of a 96-well assay plate in NBMedia for proliferation assays and exposed to GDC-0449 or itraconazole. Relative cell numbers, following a 96-h incubation, were quantified by CellTiter 96 AQueous One Solution Cell Proliferation Assay (Promega) per manufacturer’s recommendations using a SpectraMax M2e spectrophotometer and SoftMax Pro software (Molecular Devices). qPCR of Gli1 & Gli2 Transcripts in MB Systems.
13
MB cells were cultured in NB Media to confluence in 25 cm3 culture flasks and exposed for 24 h to various concentrations of GDC-0449, HhAntag, or itraconazole. Following drug exposure, cells were washed in PBS and pelleted by centrifugation at 300x g. Cell pellets were then lysed in Trizol reagent (Invitrogen). For allograft models, tumor bearing mice were treated for 3-days. MB allograft tissue was resected 4 h post-last dose and mechanically lysed in 50-100x Trizol reagent (w:v). Total RNA was extracted from lysates, purified, reverse transcribed, and quantified using Taqman gene probes for Actin, Gli1, and Gli2 as previously described (Shi et al., 2011). Relative expression is reported as fold induction relative to control samples using the ∆∆Ct (2−∆∆Ct) method with actin as an internal control. Immunoblot Analysis Briefly, tumor lysates were prepared from MB allografts, resolved by SDS-PAGE on a 4-12% Bis-Tris NuPage Gel (Life Technologies), and electrophoretically transferred to polyvinylidene fluoride membranes. Membranes were blocked with 5% powdered milk (w:v) in Tris-buffered saline (20 mM Tris-HCl and 150 mM NaCl; pH 7.6) containing 0.1% (v:v) Tween 80 (TBST). Membranes were incubated at 4º C overnight with primary antibodies (Cell Signaling Technology) against pAKTS473 (#9271), AKT (#9691), pS6KT389 (#9205), S6K (#9202), p4EBP1T37/46 (#9459), or 4EBP1 (#9644) diluted 1:1000 in TBST containing 5% bovine serum albumin (BSA; w:v). Western blots were developed using ECL Detection Reagents (GE Healthcare) following and incubation in 1:1000 horseradish peroxidase-linked donkey anti-rabbit IgG (NA934V, GE Healthcare).