Embed Size (px)
Citation preview

Supplemental material for the paper “Discriminative learning of DeepConvolutional Feature Point Descriptors”
Edgar Simo-Serra∗,1,5, Eduard Trulls∗,2,5, Luis Ferraz3
Iasonas Kokkinos4, Pascal Fua2, Francesc Moreno-Noguer51 Waseda University, Tokyo, Japan, [email protected]
2 CVLab, Ecole Polytechnique Federale de Lausanne, Switzerland, {eduard.trulls,pascal.fua}@epfl.ch3 Catchoom Technologies, Barcelona, Spain, [email protected]
4 CentraleSupelec and INRIA-Saclay, Chatenay-Malabry, France, [email protected] Institut de Robotica i Informatica Industrial (CSIC-UPC), Barcelona, Spain, {esimo,etrulls,fmoreno}@iri.upc.edu
The contents can be summarized by the following:
• Results for multiple architectures, including different numbers of convolutional layers, fully connectedlayers, different rectifiers, etc. We studied a large number of strategies exhaustively, and settled on thesolution used throghout the submission: fully convolutional models with three layers, i.e. CNN3 (seeSec. 3.1 for details). These experiments were not included in the paper due to space constraints.
• Results for multiple metrics. As we argue in Sec. 4, Precision-Recall (PR) curves are the most appro-priate metric for this problem; however, we also consider Receiving Operator Characteristics (ROC)and Cumulative Match Curves (CMC). For the experiments of Sec. 4.2 we also include the numericalresults for each test fold separately (see Sec. F). Please note that these results do not include everybaseline considered in the final version of the paper.
A. MetricsAs we argue in Sec. 4, PR curves are the most appropriate metric for this problem. We also consider ROC
and CMC curves. ROC curves are created by plotting the true positive rate TPR as a function of the truenegative rate TNR, where:
TPR =TP
PTNR = 1− FP
N(1)
Alternatively, the CMC curve is created by plotting the Rank against the Ratio of correct matches. Thatis, CMC(k) is the fraction of correct matches that have rank≤k. In particular CMC(1) is the percentage ofexamples in which the ground truth match is retrieved in the first position.
We report these results for either metric in terms of the curves (plots) and their AUC (tables), for thebest-performing iteration.
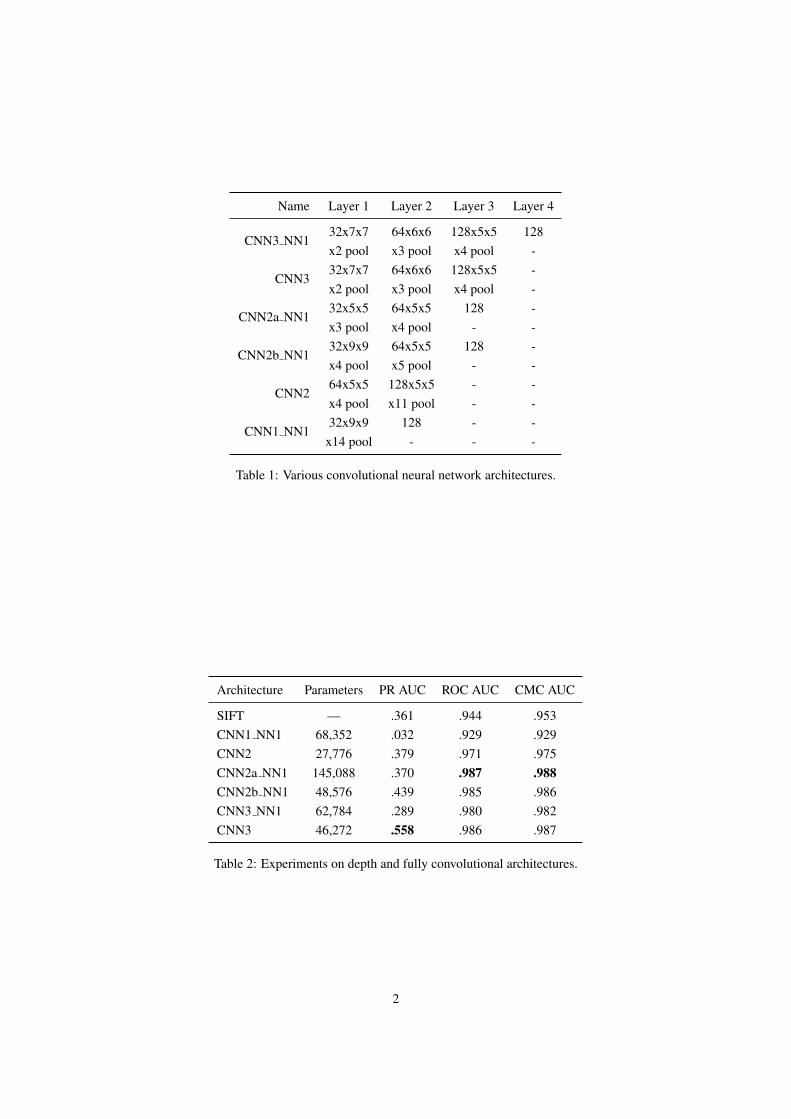
B. Depth and Fully Convolutional ArchitecturesThe network depth is constrained by the size of the patch. We consider only up to 3 convolutional layers
(CNN{1-3}). Additionally, we consider adding a single fully-connected layer at the end (NN1). Fully-connected layers increase the number of parameters by a large factor, which increases the difficulty of learningand can lead to overfitting.
An overview of the architectures we consider is given in Table 1. We choose a set of six networks, from2 up to 4 layers. Deeper networks outperform shallower ones, and architectures with a fully-connected layerat the end do worse than fully convolutional architectures. We settled on CNN3 and used it for the rest ofexperiments in this supplemental material, as well as the experiments reported in the submission.
Table 2 lists the results, and Figs. 1, 2 and 3 show the PR, ROC and CMC curves respectively.
1
Name Layer 1 Layer 2 Layer 3 Layer 4
CNN3 NN132x7x7 64x6x6 128x5x5 128x2 pool x3 pool x4 pool -
CNN332x7x7 64x6x6 128x5x5 -x2 pool x3 pool x4 pool -
CNN2a NN132x5x5 64x5x5 128 -x3 pool x4 pool - -
CNN2b NN132x9x9 64x5x5 128 -x4 pool x5 pool - -
CNN264x5x5 128x5x5 - -x4 pool x11 pool - -
CNN1 NN132x9x9 128 - -
x14 pool - - -
Table 1: Various convolutional neural network architectures.
Architecture Parameters PR AUC ROC AUC CMC AUC
SIFT — .361 .944 .953CNN1 NN1 68,352 .032 .929 .929CNN2 27,776 .379 .971 .975CNN2a NN1 145,088 .370 .987 .988CNN2b NN1 48,576 .439 .985 .986CNN3 NN1 62,784 .289 .980 .982CNN3 46,272 .558 .986 .987
Table 2: Experiments on depth and fully convolutional architectures.
2

Recall0 0.1 0.2 0.3 0.4 0.5 0.6 0.7 0.8 0.9 1
Pre
cis
ion
0
0.1
0.2
0.3
0.4
0.5
0.6
0.7
0.8
0.9
1PR curve, validation set
SIFTCNN1_NN1CNN2CNN2a_NN1CNN2b_NN1CNN3_NN1CNN3
Figure 1: PR curves for the experiments on depth and architectures.
True negative rate0.7 0.75 0.8 0.85 0.9 0.95 1
Tru
e p
ositiv
e r
ate
0.7
0.75
0.8
0.85
0.9
0.95
1ROC curve, validation set
SIFTCNN1_NN1CNN2CNN2a_NN1CNN2b_NN1CNN3_NN1CNN3
Figure 2: ROC curves for the experiments on depth and architectures.
Rank50 100 150 200 250
Ratio o
f corr
ect m
atc
hes
0.4
0.5
0.6
0.7
0.8
0.9
1CMC curve, validation set
SIFTCNN1_NN1CNN2CNN2a_NN1CNN2b_NN1CNN3_NN1CNN3
Figure 3: CMC curves for the experiments on depth and architectures.
3
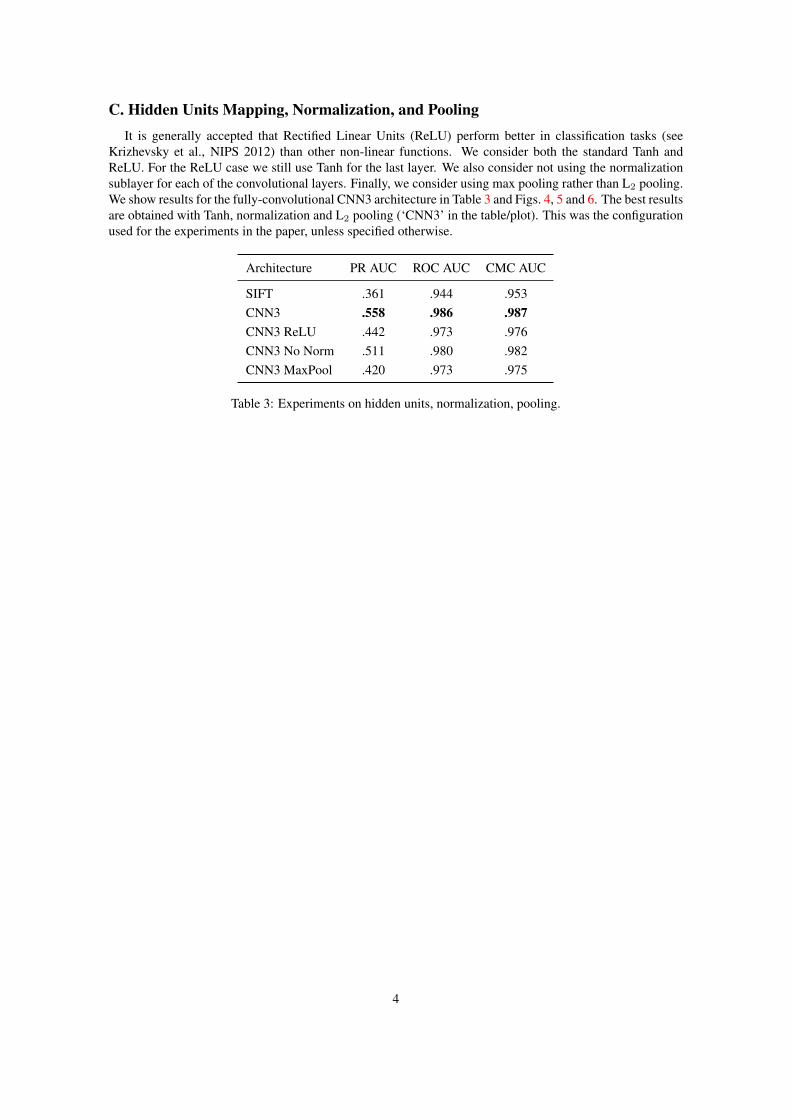
C. Hidden Units Mapping, Normalization, and PoolingIt is generally accepted that Rectified Linear Units (ReLU) perform better in classification tasks (see
Krizhevsky et al., NIPS 2012) than other non-linear functions. We consider both the standard Tanh andReLU. For the ReLU case we still use Tanh for the last layer. We also consider not using the normalizationsublayer for each of the convolutional layers. Finally, we consider using max pooling rather than L2 pooling.We show results for the fully-convolutional CNN3 architecture in Table 3 and Figs. 4, 5 and 6. The best resultsare obtained with Tanh, normalization and L2 pooling (‘CNN3’ in the table/plot). This was the configurationused for the experiments in the paper, unless specified otherwise.
Architecture PR AUC ROC AUC CMC AUC
SIFT .361 .944 .953CNN3 .558 .986 .987CNN3 ReLU .442 .973 .976CNN3 No Norm .511 .980 .982CNN3 MaxPool .420 .973 .975
Table 3: Experiments on hidden units, normalization, pooling.
4

Recall0 0.1 0.2 0.3 0.4 0.5 0.6 0.7 0.8 0.9 1
Pre
cis
ion
0
0.1
0.2
0.3
0.4
0.5
0.6
0.7
0.8
0.9
1PR curve, validation set
SIFTCNN3CNN3_ReLUCNN3_NoNormCNN3_MaxPool
Figure 4: PR curves for the experiments on hidden units, normalization, pooling.
True negative rate0.75 0.8 0.85 0.9 0.95 1
Tru
e p
ositiv
e r
ate
0.75
0.8
0.85
0.9
0.95
1ROC curve, validation set
SIFTCNN3CNN3_ReLUCNN3_NoNormCNN3_MaxPool
Figure 5: ROC curves for the experiments on hidden units, normalization, pooling.
Rank50 100 150 200 250
Ratio o
f corr
ect m
atc
hes
0.5
0.55
0.6
0.65
0.7
0.75
0.8
0.85
0.9
0.95
1CMC curve, validation set
SIFTCNN3CNN3_ReLUCNN3_NoNormCNN3_MaxPool
Figure 6: CMC curves for the experiments on hidden units, normalization, pooling.
5

D. Mining ‘hard’ positives and negativesHere we extend the results of Sec. 4.1, including all the metrics, which are summarized in Table 4. Figs. 7,
8 and 9 show the PR, ROC and CMC curves respectively.
BP
BMP
BN
BMN
PR AUC ROC AUC CMC AUC
1 1 .366 .977 .9791 2 .558 .986 .9872 2 .596 .988 .9894 4 .703 .993 .9938 8 .746 .994 .994
16 16 .538 .983 .986
Table 4: Extended table for the experiments of Sec. 4.1.
6

Recall0 0.1 0.2 0.3 0.4 0.5 0.6 0.7 0.8 0.9 1
Pre
cis
ion
0
0.1
0.2
0.3
0.4
0.5
0.6
0.7
0.8
0.9
1PR curve, validation set
SIFTCNN3, no miningCNN3, mined 1/2CNN3, mined 2/2CNN3, mined 4/4CNN3, mined 8/8CNN3, mined 16/16
Figure 7: PR curves for the experiments of Sec. 4.1 (equivalent to Fig. 6 in the paper).
True negative rate0.8 0.82 0.84 0.86 0.88 0.9 0.92 0.94 0.96 0.98 1
Tru
e p
ositiv
e r
ate
0.8
0.82
0.84
0.86
0.88
0.9
0.92
0.94
0.96
0.98
1ROC curve, validation set
SIFTCNN3, no miningCNN3, mined 1/2CNN3, mined 2/2CNN3, mined 4/4CNN3, mined 8/8CNN3, mined 16/16
Figure 8: ROC curves for the experiments of Sec. 4.1.
Rank50 100 150 200 250
Ratio o
f corr
ect m
atc
hes
0.75
0.8
0.85
0.9
0.95
1CMC curve, validation set
SIFTCNN3, no miningCNN3, mined 1/2CNN3, mined 2/2CNN3, mined 4/4CNN3, mined 8/8CNN3, mined 16/16
Figure 9: CMC curves for the experiments of Sec. 4.1.
7

E. Number of filters and descriptor dimensionWe analyze increasing the number of filters in the CNN3 model, and adding a fully-connected layer that
can be used to decrease the dimensionality of the descriptor. We consider increasing the number of filtersin layers 1 and 2 from 32 and 64 to 64 and 96, respectively. Additionally, we double the number of internalconnections between layers. This more than doubles the number of parameters in this network. To analyzedescriptor dimensions we consider the CNN3 NN1 model and change the number of outputs in the last fully-connected layer from 128 to 32. In this case we consider positive mining with BP = 256 (i.e. 2/2).
Numerical results are given in Table 5, and Figs. 10, 11 and 12 show the PR, ROC and CMC curvesrepectively. The best results are obtained with smaller filters and fully-convolutional networks.
Architecture Output Parameters PR AUC ROC AUC CMC AUC
SIFT 128D — .361 .944 .953CNN3 128D 46,272 .596 .988 .989CNN3 Wide 128D 110,496 .552 .987 .988CNN3 NN1 128D 62,784 .456 .988 .988CNN3 NN1 32D 50,400 .389 .986 .987
Table 5: AUC results for the experiments on number of filters and descriptor dimension.
8

Recall0 0.1 0.2 0.3 0.4 0.5 0.6 0.7 0.8 0.9 1
Pre
cis
ion
0
0.1
0.2
0.3
0.4
0.5
0.6
0.7
0.8
0.9
1PR curve, validation set
SIFTCNN3 (mined 2/2)CNN3 Wide (mined 2/2)CNN3_NN1 128D (mined 2/2)CNN3_NN1 32D (mined 2/2)
Figure 10: PR curves for the experiments on number of filters and descriptor dimension.
True negative rate0.8 0.82 0.84 0.86 0.88 0.9 0.92 0.94 0.96 0.98 1
Tru
e p
ositiv
e r
ate
0.8
0.82
0.84
0.86
0.88
0.9
0.92
0.94
0.96
0.98
1ROC curve, validation set
SIFTCNN3 (mined 2/2)CNN3 Wide (mined 2/2)CNN3_NN1 128D (mined 2/2)CNN3_NN1 32D (mined 2/2)
Figure 11: ROC curves for the experiments on number of filters and descriptor dimension.
Rank50 100 150 200 250
Ratio o
f corr
ect m
atc
hes
0.75
0.8
0.85
0.9
0.95
1CMC curve, validation set
SIFTCNN3 (mined 2/2)CNN3 Wide (mined 2/2)CNN3_NN1 128D (mined 2/2)CNN3_NN1 32D (mined 2/2)
Figure 12: CMC curves for the experiments on number of filters and descriptor dimension.
9

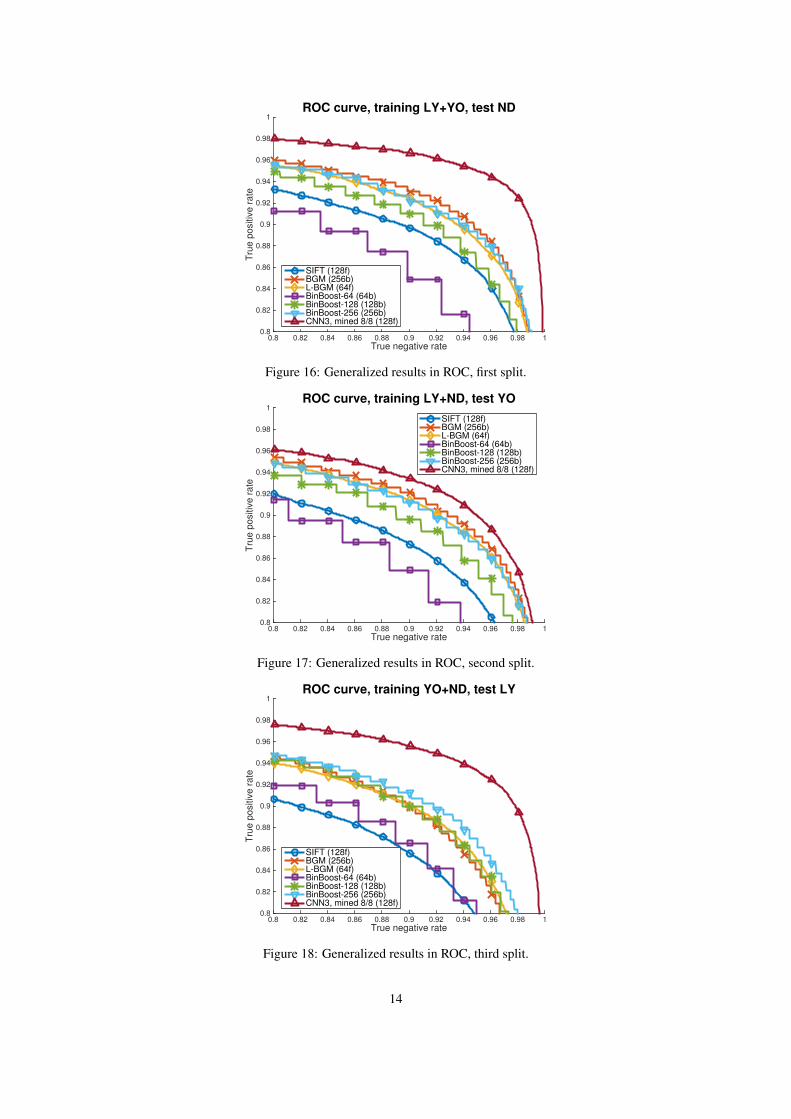
F. Generalization & Comparisons with the state of the artIn this section we extend the results of Sec. 4.2. We summarize the results over three different dataset
splits, each with ten test folds of 10,000 randomly sampled positives and 1,000 randomly sampled negatives.We show the PR results in Tables 6-8, and Figs. 13-15, the ROC results in Tables 9-11, and Figs. 16-18, andthe CMC results in Tables 12-14, and Figs. 19-21.
Precision-Recall AUC, Train: LY+YOS, Test: ND (10 folds)Model F1 F2 F3 F4 F5 F6 F7 F8 F9 F10 Avg.
SIFT .364 .352 .345 .343 .349 .350 .350 .351 .341 .348 .349BGM .490 .490 .487 .487 .496 .481 .490 .488 .483 .480 .487
LBGM .498 .499 .489 .492 .505 .489 .501 .498 .490 .490 .495BinBoost-64 .273 .261 .267 .266 .276 .270 .265 .262 .266 .260 .267BinBoost-128 .456 .449 .447 .447 .465 .449 .452 .452 .451 .445 .451BinBoost-256 .549 .548 .546 .544 .560 .551 .551 .552 .548 .542 .549
CNN3, mine 8/8 .667 .658 .669 .667 .678 .659 .672 .667 .662 .666 .667
Table 6: Generalized results in Precision-Recall. Models trained over LY+YOS and tested on ND.
Precision-Recall AUC, Train: LY+ND, Test: YOS (10 folds)Model F1 F2 F3 F4 F5 F6 F7 F8 F9 F10 Avg.
SIFT .428 .419 .413 .416 .414 .427 .429 .442 .432 .430 .425BGM .498 .495 .481 .492 .475 .497 .508 .511 .497 .492 .495
LBGM .521 .519 .504 .512 .499 .524 .530 .530 .511 .519 .517BinBoost-64 .286 .286 .274 .280 .273 .288 .291 .285 .280 .288 .283BinBoost-128 .459 .463 .447 .457 .436 .463 .468 .467 .451 .456 .457BinBoost-256 .537 .538 .519 .535 .514 .543 .545 .545 .529 .530 .533
CNN3, mine-8/8 .547 .547 .528 .551 .528 .559 .556 .561 .546 .530 .545
Table 7: Generalized results in Precision-Recall. Models trained over LY+ND and tested on YOS.
Precision-Recall AUC, Train: YOS+ND, Test: LY (10 folds)Model F1 F2 F3 F4 F5 F6 F7 F8 F9 F10 Avg.
SIFT .223 .226 .229 .228 .226 .222 .233 .235 .219 .223 .226BGM .269 .265 .280 .255 .272 .261 .281 .267 .272 .258 .268
LBGM .353 .354 .364 .343 .360 .352 .361 .352 .361 .352 .355BinBoost-64 .201 .198 .211 .194 .205 .201 .208 .201 .204 .200 .202BinBoost-128 .351 .338 .351 .335 .348 .345 .353 .349 .351 .346 .346Binboost-256 .411 .405 .416 .399 .411 .407 .411 .418 .410 .409 .410
CNN3, mine-8/8 .607 .611 .610 .604 .603 .604 .606 .615 .612 .608 .608
Table 8: Generalized results in Precision-Recall. Models trained over YOS+ND and tested on LY.
10

ROC AUC, Train: LY+YOS, Test: ND (10 folds)Model F1 F2 F3 F4 F5 F6 F7 F8 F9 F10 Avg.
SIFT .956 .954 .955 .958 .957 .955 .955 .955 .956 .955 .956BGM .973 .972 .973 .976 .974 .972 .974 .973 .974 .973 .973
LBGM .969 .968 .970 .972 .971 .969 .971 .969 .970 .969 .970BinBoost-64 .948 .950 .951 .954 .951 .950 .952 .949 .951 .951 .951BinBoost-128 .965 .966 .966 .969 .968 .966 .968 .965 .967 .967 .967BinBoost-256 .970 .971 .971 .974 .972 .971 .973 .970 .971 .971 .971
CNN3, mine-8/8 .986 .985 .986 .988 .987 .986 .989 .986 .986 .986 .987
Table 9: Generalized results in ROC. Models trained over LY+YOS and tested on ND.
ROC AUC, Train: LY+ND, Test: YOS (10 folds)Model F1 F2 F3 F4 F5 F6 F7 F8 F9 F10 Avg.
SIFT .949 .947 .948 .949 .949 .950 .949 .950 .950 .950 .949BGM .970 .970 .972 .970 .972 .972 .971 .971 .972 .972 .971
LBGM .966 .966 .967 .966 .969 .969 .967 .968 .969 .969 .968BinBoost-64 .944 .943 .943 .944 .946 .943 .944 .943 .943 .944 .944BinBoost-128 .961 .960 .961 .961 .963 .962 .963 .962 .962 .962 .962BinBoost-256 .967 .966 .968 .967 .969 .968 .968 .968 .968 .968 .968
CNN3, mine-8/8 .974 .972 .975 .974 .976 .975 .975 .975 .976 .974 .975
Table 10: Generalized results in ROC. Models trained over LY+ND and tested on YOS.
ROC AUC, Train: YOS+ND, Test: LY (10 folds)Model F1 F2 F3 F4 F5 F6 F7 F8 F9 F10 Avg.
SIFT .938 .939 .936 .938 .933 .935 .936 .938 .937 .936 .937BGM .962 .962 .963 .961 .960 .961 .961 .962 .963 .962 .962
LBGM .961 .961 .961 .960 .960 .960 .960 .960 .962 .961 .961BinBoost-64 .951 .948 .950 .949 .949 .948 .948 .950 .949 .949 .949BinBoost-128 .962 .962 .961 .961 .961 .960 .960 .963 .962 .962 .961BinBoost-256 .965 .965 .965 .965 .964 .964 .964 .966 .966 .965 .965
CNN3, mine-8/8 .983 .983 .983 .981 .983 .982 .982 .984 .983 .982 .982
Table 11: Generalized results in ROC. Models trained over YOS+ND and tested on LY.
11

CMC AUC, Train: LY+YOS, Test: ND (10 folds)Model F1 F2 F3 F4 F5 F6 F7 F8 F9 F10 Avg.
SIFT .964 .962 .963 .966 .965 .963 .964 .963 .964 .962 .963BGM .974 .973 .974 .977 .976 .974 .976 .974 .975 .975 .975
LBGM .972 .971 .972 .975 .974 .971 .974 .972 .973 .972 .973BinBoost-64 .956 .956 .958 .961 .958 .957 .960 .957 .958 .958 .958BinBoost-128 .969 .968 .969 .971 .971 .969 .971 .968 .970 .970 .970BinBoost-256 .972 .972 .973 .975 .974 .973 .975 .972 .973 .973 .973
CNN3, mine-8/8 .988 .988 .988 .990 .989 .988 .990 .989 .989 .989 .989
Table 12: Generalized results in CMC. Models trained over LY+YOS and tested on ND.
CMC AUC, Train: LY+ND, Test: YOS (10 folds)Model F1 F2 F3 F4 F5 F6 F7 F8 F9 F10 Avg.
SIFT .956 .955 .956 .956 .956 .958 .956 .957 .956 .958 .956BGM .971 .971 .973 .972 .973 .973 .972 .973 .973 .974 .972
LBGM .969 .969 .970 .969 .970 .971 .969 .971 .971 .971 .970BinBoost-64 .952 .952 .952 .953 .954 .952 .953 .953 .952 .954 .953BinBoost-128 .965 .965 .966 .966 .967 .966 .967 .967 .966 .967 .966BinBoost-256 .969 .968 .971 .970 .971 .971 .971 .971 .971 .970 .970
CNN3, mine-8/8 .980 .979 .981 .981 .982 .982 .980 .982 .982 .982 .981
Table 13: Generalized results in CMC. Models trained over LY+ND and tested on YOS.
CMC AUC, Train: YOS+ND, Test: LY (10 folds)Model F1 F2 F3 F4 F5 F6 F7 F8 F9 F10 Avg.
SIFT .948 .949 .947 .948 .945 .945 .948 .949 .948 .947 .948BGM .967 .967 .967 .966 .966 .966 .967 .967 .968 .967 .967
LBGM .965 .965 .965 .964 .965 .964 .965 .965 .966 .965 .965BinBoost-64 .954 .952 .954 .953 .952 .952 .952 .954 .952 .952 .953BinBoost-128 .965 .964 .964 .964 .963 .963 .963 .965 .964 .964 .964BinBoost-256 .968 .968 .968 .967 .967 .967 .967 .969 .969 .968 .968
CNN3, mine-8/8 .985 .985 .985 .984 .985 .984 .985 .986 .986 .985 .985
Table 14: Generalized results in CMC. Models trained over YOS+ND and tested on LY.
12

Recall0 0.1 0.2 0.3 0.4 0.5 0.6 0.7 0.8 0.9 1
Pre
cis
ion
0
0.1
0.2
0.3
0.4
0.5
0.6
0.7
0.8
0.9
1PR curve, training LY+YO, test ND
SIFT (128f)BGM (256b)L-BGM (64f)BinBoost-64 (64b)BinBoost-128 (128b)BinBoost-256 (256b)CNN3, mined 8/8 (128f)
Figure 13: Generalized results in PR, first split.
Recall0 0.1 0.2 0.3 0.4 0.5 0.6 0.7 0.8 0.9 1
Pre
cis
ion
0
0.1
0.2
0.3
0.4
0.5
0.6
0.7
0.8
0.9PR curve, training LY+ND, test YO
SIFT (128f)BGM (256b)L-BGM (64f)BinBoost-64 (64b)BinBoost-128 (128b)BinBoost-256 (256b)CNN3, mined 8/8 (128f)
Figure 14: Generalized results in PR, second split.
Recall0 0.1 0.2 0.3 0.4 0.5 0.6 0.7 0.8 0.9 1
Pre
cis
ion
0
0.1
0.2
0.3
0.4
0.5
0.6
0.7
0.8
0.9
1PR curve, training YO+ND, test LY
SIFT (128f)BGM (256b)L-BGM (64f)BinBoost-64 (64b)BinBoost-128 (128b)BinBoost-256 (256b)CNN3, mined 8/8 (128f)
Figure 15: Generalized results in PR, third split.
13
True negative rate0.8 0.82 0.84 0.86 0.88 0.9 0.92 0.94 0.96 0.98 1
Tru
e p
ositiv
e r
ate
0.8
0.82
0.84
0.86
0.88
0.9
0.92
0.94
0.96
0.98
1ROC curve, training LY+YO, test ND
SIFT (128f)BGM (256b)L-BGM (64f)BinBoost-64 (64b)BinBoost-128 (128b)BinBoost-256 (256b)CNN3, mined 8/8 (128f)
Figure 16: Generalized results in ROC, first split.
True negative rate0.8 0.82 0.84 0.86 0.88 0.9 0.92 0.94 0.96 0.98 1
Tru
e p
ositiv
e r
ate
0.8
0.82
0.84
0.86
0.88
0.9
0.92
0.94
0.96
0.98
1ROC curve, training LY+ND, test YO
SIFT (128f)BGM (256b)L-BGM (64f)BinBoost-64 (64b)BinBoost-128 (128b)BinBoost-256 (256b)CNN3, mined 8/8 (128f)
Figure 17: Generalized results in ROC, second split.
True negative rate0.8 0.82 0.84 0.86 0.88 0.9 0.92 0.94 0.96 0.98 1
Tru
e p
ositiv
e r
ate
0.8
0.82
0.84
0.86
0.88
0.9
0.92
0.94
0.96
0.98
1ROC curve, training YO+ND, test LY
SIFT (128f)BGM (256b)L-BGM (64f)BinBoost-64 (64b)BinBoost-128 (128b)BinBoost-256 (256b)CNN3, mined 8/8 (128f)
Figure 18: Generalized results in ROC, third split.
14

Rank50 100 150 200 250
Ratio o
f corr
ect m
atc
hes
0.75
0.8
0.85
0.9
0.95
1CMC curve, training LY+YO, test ND
SIFT (128f)BGM (256b)L-BGM (64f)BinBoost-64 (64b)BinBoost-128 (128b)BinBoost-256 (256b)CNN3, mined 8/8 (128f)
Figure 19: Generalized results in CMC, first split.
Rank50 100 150 200 250
Ratio o
f corr
ect m
atc
hes
0.75
0.8
0.85
0.9
0.95
1CMC curve, training LY+ND, test YO
SIFT (128f)BGM (256b)L-BGM (64f)BinBoost-64 (64b)BinBoost-128 (128b)BinBoost-256 (256b)CNN3, mined 8/8 (128f)
Figure 20: Generalized results in CMC, second split.
Rank50 100 150 200 250
Ratio o
f corr
ect m
atc
hes
0.75
0.8
0.85
0.9
0.95
1CMC curve, training YO+ND, test LY
SIFT (128f)BGM (256b)L-BGM (64f)BinBoost-64 (64b)BinBoost-128 (128b)BinBoost-256 (256b)CNN3, mined 8/8 (128f)
Figure 21: Generalized results in CMC, third split.
15