Embed Size (px)
Citation preview
1
Supplemental material for Zhuang et al. report
The conformations of loops A and B of the hairpin ribozyme change along the reaction
pathway.
See Fig. S1.
Docking and undocking kinetics of ribozyme-S(O’MeA-1) complexes.
From FRET time trajectories, the dwell times in the docked and undocked states were measured.
The number of docking and undocking events (N) with dwell times shorter than t were
determined. Two separate experiments, A with a lower time resolution (2 s) and photobleaching
rate (0.001 s-1) and B with a higher time resolution (0.1 s) at the expense of a higher
photobleaching rate (~0.02 s-1), were carried out to obtain these data. Dwell times of the
undocked state from experiment A are shown in Fig. S2A. The line is a single exponential fit that
gives the rate constant for docking, kdock = 0.008 s-1. Dwell times of the docked state from
experiment A are shown in Fig. 4. Dwell times of the docked state from experiment B are shown
in Fig. S2B. The line is a triple exponential fit with kundock,2 = 0.06 s-1, kundock,3 = 0.5 s-1, and
kundock,4 = 3 s-1.
Docking and undocking kinetics of the ribozyme-5’P and ribozyme 3’P complexes.
Using FRET, we measured the docking kinetics of the hairpin ribozyme in the presence of 5 µM
3’P and no 5’P. The ribozyme docks briefly with 6.13Pdock =k s-1 and 643P
undock =k s-1. In the
presence of 5 µM 5’P and no 3’P, no docking event was observed.
Memory effect of the undocking kinetics.
We found that the enzyme displays a “memory” effect where the docking time of an event is
highly correlated with the docking time of the previous event. A correlation analysis of the ith
time versus the (i+1)th time spent in the docked state is shown in Fig. S3. Strong correlation
between adjacent docking events is unambiguously revealed in this two-dimensional histogram
that shows a pronounced high occurrence frequency along the diagonal line

2
Dissociation equilibrium and rate constants of 3’P and 5’P in the undocked state.
Binding of 5’P alone to the ribozyme causes the FRET value to decrease from the S-free value of
0.38. At saturating concentration of 5’P (5 µM), the FRET value decreases to 0.18. At sub-
saturation concentrations, the average FRET value is between 0.18 and 0.38, and the FRET time
trajectories show fluctuations. The cross-correlation function of the donor and the acceptor
( )( ) ( )ttttt
tItItItItItIf )()()()()()()( ADAADD −τ+−=τ was determined at a number
of different concentrations of 5’P, giving the dissociation equilibrium constant 15P =dK µM and
rate constant 25Poff =k s-1.
To determine the dissociation equilibrium and rate constants of 3’P, the universal fluorescence
quencher dabcyl was attached to the 3’ end of 3’P (3’P-D). In the absence of 3’P-D, the FRET
value between donor and acceptor on the ribozyme is ~0.38, leading to a sizable acceptor signal.
The binding of 3’P-D brings dabcyl very close to the acceptor and quenches its fluorescence
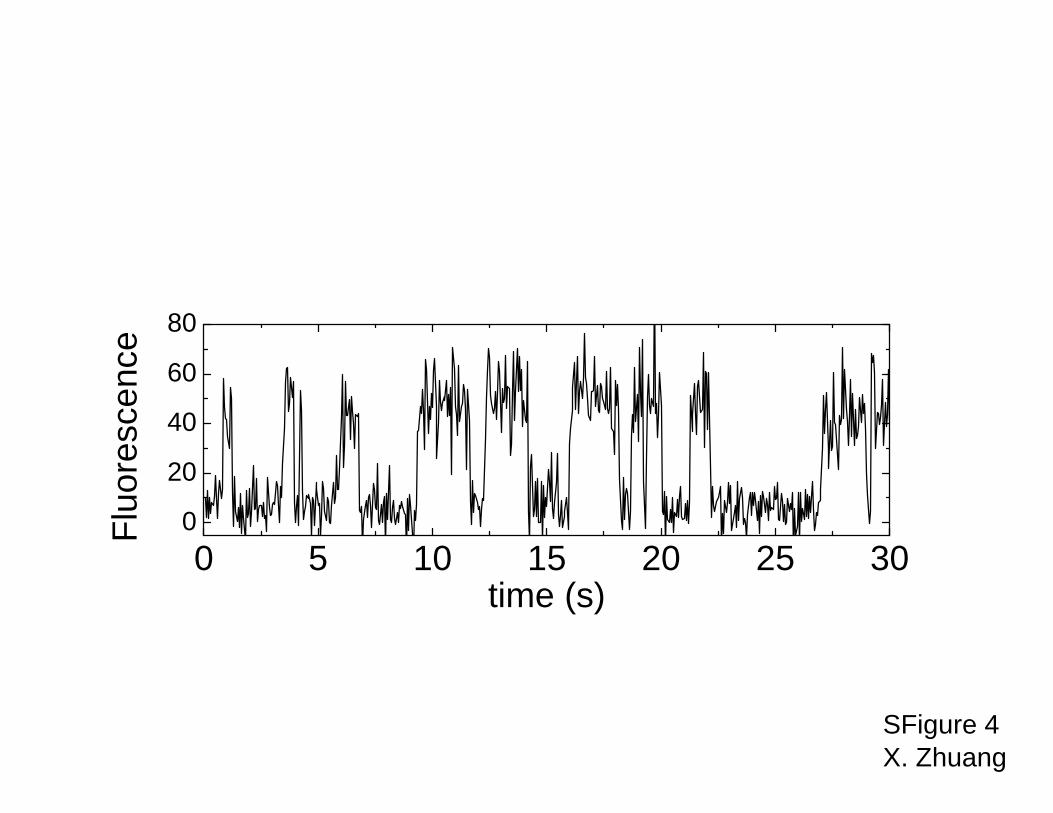
significantly. At a sub-saturating concentration of 3’P-D, the binding and releasing of 3’P-D
causes the acceptor fluorescence to fluctuate (See Fig. S4). From the on- and off-times of the
acceptor fluorescence, dissociation equilibrium and rate constants for 3’P were determined to be
2.03Pd =K µM and 3.13P
off =k s-1, respectively.
Coupled differential equations for the enzymatic reaction of the hairpin ribozyme.
The set of coupled differential equations that describes the reactions given in Fig. 1B is as
follows:
.
,
,
,
,
3P5Pundockoff
diss
3P5Pundockoff
3P5Pundock
3P5Pdock
3P5Pdock
3P5Pundock
3P5Pundock
3P5Pundock
3P5Pdock
3P5Pdock
3P5Pundock
3P5Pdocklig
Sdockcleav
3P5Pdock
Sdockcleav
Sdockundock
3P5Pdocklig
Sundockdock
Sdock
Sundockdock
Sdockundock
Sundock
Nkdt
dN
NkNkNkdt
dN
NkNkNkNkdt
dN
NkNkNkNkdt
dN
NkNkdt
dN
=
−−=
+−−=
−−+=
−=
3
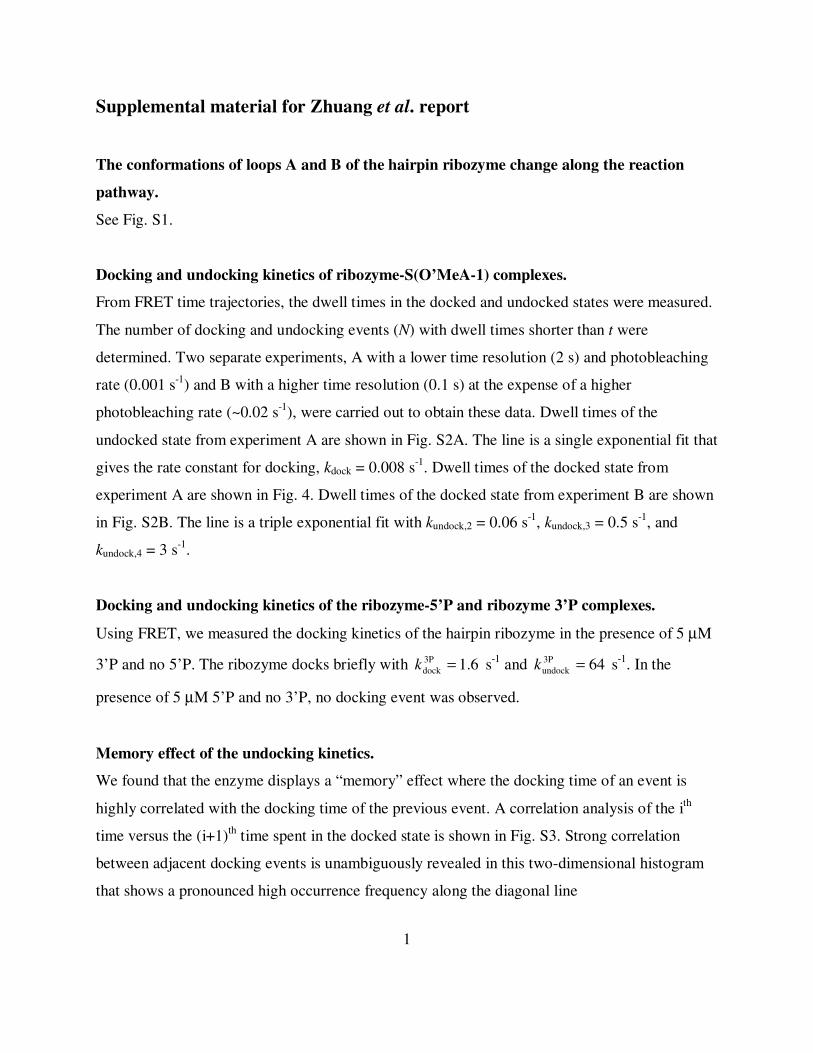
Here, SundockN = the number of enzymes in the undocked state with S bound, S
dockN = the number
of enzymes in the docked state with S bound, 3P5PdockN = the number of enzymes in the docked state
with products bound, 3P5PundockN = the number of enzymes in the undocked state with products
bound, dissN = the number of enzymes with products dissociated, undockk = undocking rate
constant with S bound, dockk = docking rate constant with S bound, 3P5Pundockk = undocking rate
constant with products bound, 3P5Pdockk = docking rate constant with products bound, ligk = the
chemical ligation rate constant, cleavk = the chemical cleavage rate constant, offk = the effective
(average) dissociation rate constant of 3’P and 5’P, measured at 1.6 s-1 (Changing this number to
1.3 s-1 or 2 s-1 do not change the conclusion). A lower limit for the chemical ligation rate constant
of 2.0lig ≥k s-1 was derived from the fact that the observed overall ligation rate is limited by
docking at ~0.02 s-1 (Fig. 1B) (1), which means that the chemistry rate constant klig must be at
least an order of magnitude faster than this value, or ≥ 0.2 s-1.
The initial boundary conditions are that at 0=t , 1Sundock =N , and all other states are
unpopulated. The solution was obtained using Mathematica. The ratio (chemistry equilibrium
constant) of 5.0ligcleav =kk gives a good fit. Altering this ratio by 30% produces distinctly
worse fits, even if the background of not active ribozyme is allowed to vary, as shown in Fig.
S5A. The fits also determine an upper limit of 8.0lig ≤k s-1. Fig. S5B shows the results of the set
of equations with 8.0lig =k s-1 while keeping 5.0ligcleav =kk .
4
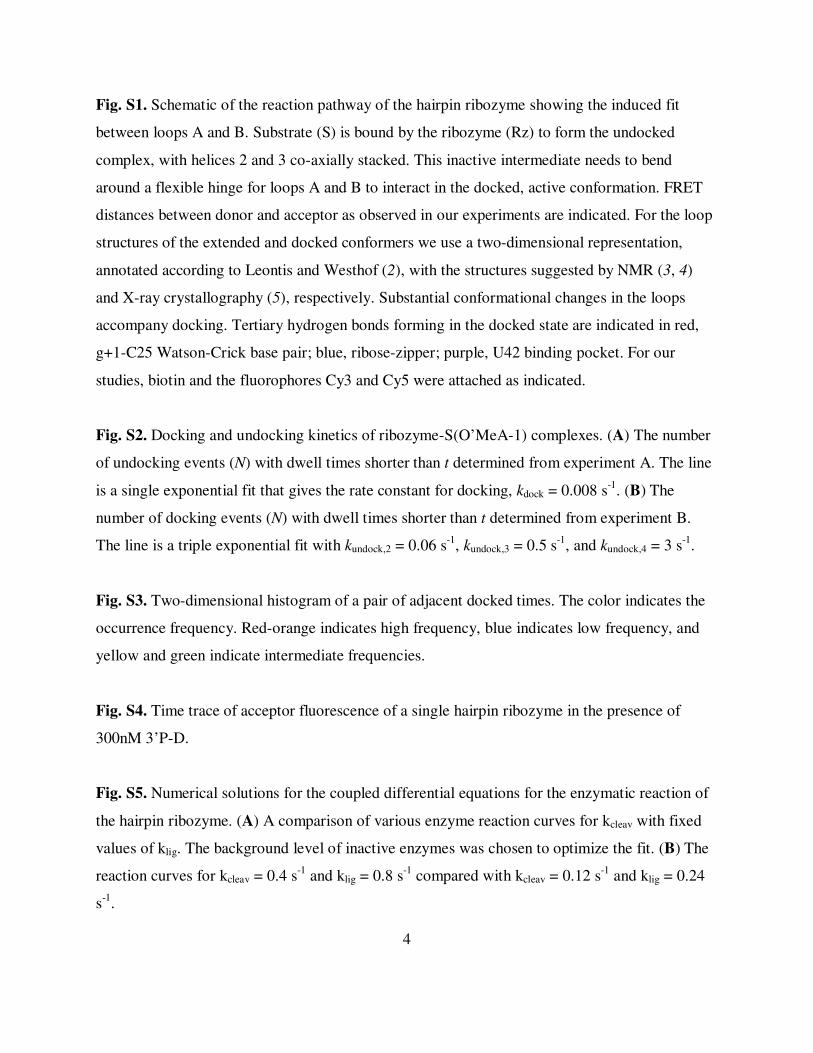
Fig. S1. Schematic of the reaction pathway of the hairpin ribozyme showing the induced fit
between loops A and B. Substrate (S) is bound by the ribozyme (Rz) to form the undocked
complex, with helices 2 and 3 co-axially stacked. This inactive intermediate needs to bend
around a flexible hinge for loops A and B to interact in the docked, active conformation. FRET
distances between donor and acceptor as observed in our experiments are indicated. For the loop
structures of the extended and docked conformers we use a two-dimensional representation,
annotated according to Leontis and Westhof (2), with the structures suggested by NMR (3, 4)
and X-ray crystallography (5), respectively. Substantial conformational changes in the loops
accompany docking. Tertiary hydrogen bonds forming in the docked state are indicated in red,
g+1-C25 Watson-Crick base pair; blue, ribose-zipper; purple, U42 binding pocket. For our
studies, biotin and the fluorophores Cy3 and Cy5 were attached as indicated.
Fig. S2. Docking and undocking kinetics of ribozyme-S(O’MeA-1) complexes. (A) The number
of undocking events (N) with dwell times shorter than t determined from experiment A. The line
is a single exponential fit that gives the rate constant for docking, kdock = 0.008 s-1. (B) The
number of docking events (N) with dwell times shorter than t determined from experiment B.
The line is a triple exponential fit with kundock,2 = 0.06 s-1, kundock,3 = 0.5 s-1, and kundock,4 = 3 s-1.
Fig. S3. Two-dimensional histogram of a pair of adjacent docked times. The color indicates the
occurrence frequency. Red-orange indicates high frequency, blue indicates low frequency, and
yellow and green indicate intermediate frequencies.
Fig. S4. Time trace of acceptor fluorescence of a single hairpin ribozyme in the presence of
300nM 3’P-D.
Fig. S5. Numerical solutions for the coupled differential equations for the enzymatic reaction of
the hairpin ribozyme. (A) A comparison of various enzyme reaction curves for kcleav with fixed
values of klig. The background level of inactive enzymes was chosen to optimize the fit. (B) The
reaction curves for kcleav = 0.4 s-1 and klig = 0.8 s-1 compared with kcleav = 0.12 s-1 and klig = 0.24
s-1.

5
References
1. N. G. Walter, K. J. Hampel, K. M. Brown, J. M. Burke, EMBO J. 17, 2378 (1998).
2. N. B. Leontis, E. Westhof, RNA 7, 499 (2001).
3. Z. Cai, I. Tinoco, Biochemistry 35, 6026 (1996).
4. S. E. Butcher, F. H. Allain, J. Feigon, Nature Struct. Biol. 6, 212 (1999).
5. P. B. Rupert, A. R. Ferre-D’Amare, Nature 410, 780 (2001).

kon
koff
Substrate-free
A
A
AU
A U
C
G AC
AUCG
·
·
·A
A
3'H3
H2
45·20
35
·50
· 40
·25
30
H4
Lo
op
B
a
Au
c
gAG
AG
3'5'
10
··
H15
·
+5
-5·
Lo
op
A
+1
·
FRET(8 nm)
B
+
Rz
S
FRET(6 nm)
+
5´P3´P
BA
FRET(3 nm)
Docked (Active)
FRET(3 nm)
AAUA
U
C
G AC
AUC
G
·
·
·A
A
3'
H3
45·20
35
·50
· 40
·25
30H4
Lo
op
B
H2
a
A c
AG
AG
3'5'
10
··
H15 · +5
-5·
Lo
op
A
+1
gA
·
3'
u
Figure S1X. Zhuang
5’Biotin3'
Cy3
5’Biotin
Biotin
Docked (Active)
Cy5
Cy3
Cy5
Cy3
Cy5
Cy3
Cy5
Undocked (Inactive)
Biotin
Substrate-free
BRz
FRET(6 nm)
BiotinCy3
Cy5B
A
Cy3
Cy5
Biotin
Legendtrans Hoogsteen/Sugar Edge
trans Watson-Crick/Sugar Edge
trans Watson-Crick/Hoogsteen
trans Hoogsteen/Hoogsteen
cis Watson-Crick/Watson-Crickcis Sugar Edge/Sugar Edge
syn conformation
Reversal of strand directionStandard Watson-Crick basepair
Single H-bond interaction
FRET(8 nm)
Undocked (Inactive)
kdock
kundock
kcleav
klig
kundock
kdock
3P5P
3P5P
k’off
k’on
5'

0 200 400 600 800 1000
0
500
1000
1500
2000
2500
SFigure 2AX. Zhuang
N(t
)
t (s)

0 10 20 30 40 50 60 70
0
200
400
600
800
SFigure 2BX. Zhuang
N(t
)
t (s)

SFigure 3
X. Zhuang
0 5 10 15 20 25 300
20
40
60
80
SFigure 4X. Zhuang
Flu
ores
cenc
e
time (s)

0 50 100 150 200
0.0
0.2
0.4
0.6
0.8
1.0
kcleave
= 0.16 s-1, klig
= 0.24 s-1, bkgnd = 9%
kcleave
= 0.12 s-1, klig
= 0.24 s-1, bkgnd = 7%
kcleave
= 0.10 s-1, klig
= 0.24 s-1, bkgnd = 7%
experimental data
SFigure 5AX. Zhuang
Fra
ctio
n cl
eave
d
time (min)

0 50 100 150 200
0.0
0.2
0.4
0.6
0.8
1.0
kcleave
= 0.40 s-1, klig = 0.8 s-1, background = 12%
kcleave
= 0.12 s-1, klig = 0.24 s-1, background = 7%
experimental data
SFigure 5BX. Zhuang
Fra
ctio
n cl
eave
d
time (min)