Embed Size (px)
Citation preview

Environmental Health Perspectives doi:10.1289/ehp.1308038
Supplemental Material
Risks and Benefits of Green Spaces for Children: A Cross-Sectional
Study of Associations with Sedentary Behavior, Obesity, Asthma,
and Allergy
Payam Dadvand, Cristina M. Villanueva, Laia Font-Ribera, David Martinez, Xavier Basagaña,
Jordina Belmonte, Martine Vrijheid, Regina Gražulevičienė, Manolis Kogevinas, Mark J.
Nieuwenhuijsen.
1

2
Table S1. Median (interquartile range) of average NDVI across buffers of 100 m, 250 m, 500 m, and 1000 m
around home addresses separately for participants living within and further than 300 m of a park or forest.
Buffer Parks ≤ 300 m Parks > 300 m p-valuea Forests ≤ 300 m Forests > 300 m p-valuea
100 m 0.061 (0.090) 0.028 (0.057) < 0.001 0.174 (0.137) 0.033 (0.061) < 0.001 250 m 0.096 (0.090) 0.034 (0.078) < 0.001 0222 (0.111) 0.050 (0.082) < 0.001 500 m 0.118 (0.075) 0.052 (0.122) < 0.001 0.259 (0.091) 0.086 (0.104) < 0.001 1000 m 0.145 (0.080) 0.104 (0.114) < 0.001 0.284 (0.092) 0.114 (0.085) < 0.001 ap-value for Mann–Whitney U test for difference.

Table S2. Adjusted odds ratios (95% confidence intervals (CI)) of binary outcomes and
regression coefficients (95% CI) for the continuous outcome associated with one inter-quartile
range increasea in average Normalized Vegetation Difference Index (NDVI) across network
buffers of 250 m and 500 m around participants’ home addresses, Sabadell, 2006 (N=3,178).
Outcome 250 m buffer 500 m buffer Binary
Current asthmab 1.01 (0.83, 1.23) 1.02 (0.82, 1.27) Current allergic rhinoconjunctivitisb 0.96 (0.87, 1.07) 1.00 (0.89, 1.12) Excessive screen timec 0.86 (0.77, 0.95)** 0.83 (0.74, 0.94)** Overweight/obesityd 0.82 (0.73, 0.92)** 0.84 (0.75, 0.95)**
Continuous BMI z-scoresd -0.06 (-0.11, -0.01)** -0.03 (-0.09, 0.02)
a0.065 for 250 m buffer and 0.069 for 500 m buffer. bAdjusted for child’s sex and age, exposure to
environmental tobacco smoke at home, having older siblings, type of school (public vs. private),
parental education, and parental history of asthma. cAdjusted for child’s sex and age, parental
education, type of school, and having siblings. dAdjusted for parental education, type of school,
sport activity, and having siblings.
*p-value <0.10. **p-value <0.05.
3
Figure S1. NDVI map of Sabadell, 18th May 2007. Source: Landsat 5 TM. 4

Figure S2. Urban green spaces (Parks) and forests across Sabadell. Source: Urban Atlas (2007).
5

Figure S3. Population density (Person/km2) at census tracts (Census 2001) across Sabadell. 6

Figure S4. Urban Vulnerability index at census tracts (Census 2001) across Sabadell. 7
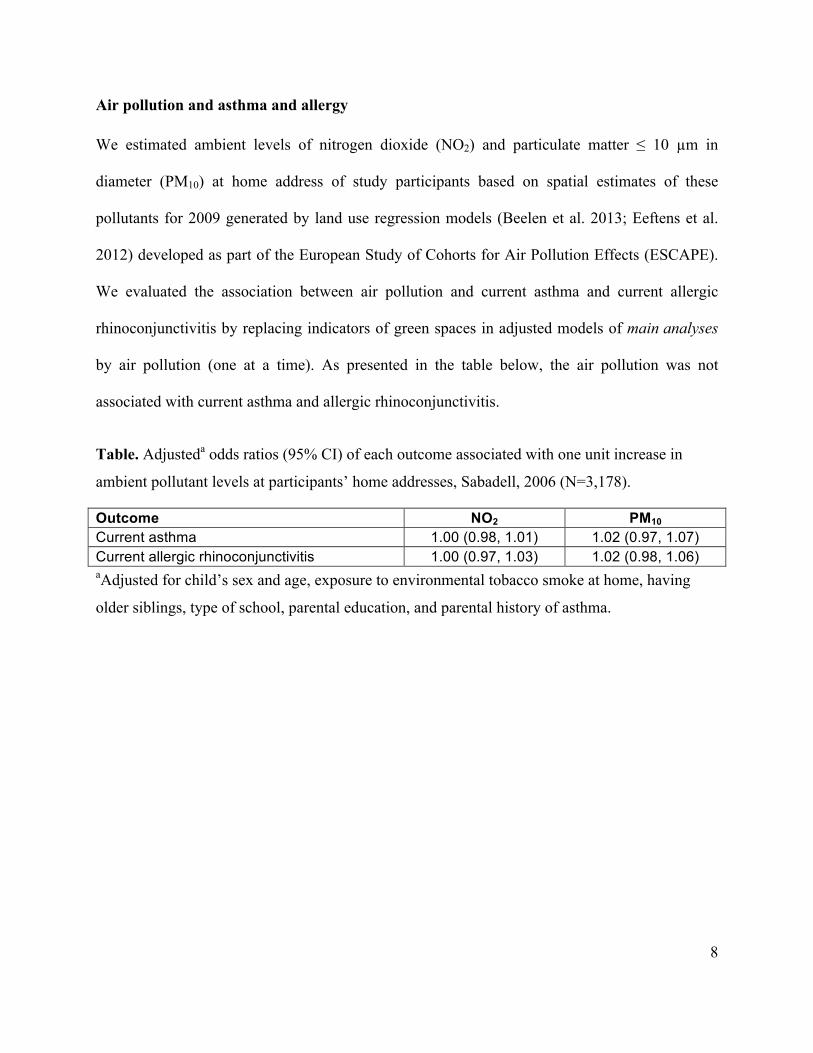
Air pollution and asthma and allergy
We estimated ambient levels of nitrogen dioxide (NO2) and particulate matter ≤ 10 µm in
diameter (PM10) at home address of study participants based on spatial estimates of these
pollutants for 2009 generated by land use regression models (Beelen et al. 2013; Eeftens et al.
2012) developed as part of the European Study of Cohorts for Air Pollution Effects (ESCAPE).
We evaluated the association between air pollution and current asthma and current allergic
rhinoconjunctivitis by replacing indicators of green spaces in adjusted models of main analyses
by air pollution (one at a time). As presented in the table below, the air pollution was not
associated with current asthma and allergic rhinoconjunctivitis.
Table. Adjusteda odds ratios (95% CI) of each outcome associated with one unit increase in
ambient pollutant levels at participants’ home addresses, Sabadell, 2006 (N=3,178).
Outcome NO2 PM10
Current asthma 1.00 (0.98, 1.01) 1.02 (0.97, 1.07) Current allergic rhinoconjunctivitis 1.00 (0.97, 1.03) 1.02 (0.98, 1.06) aAdjusted for child’s sex and age, exposure to environmental tobacco smoke at home, having
older siblings, type of school, parental education, and parental history of asthma.
8

References
Beelen R, Hoek G, Vienneau D, Eeftens M, Dimakopoulou K, Pedeli X, et al. 2013.
Development of NO2 and NOx land use regression models for estimating air pollution
exposure in 36 study areas in Europe – the ESCAPE project. Atmos Environ 72:10-23.
Eeftens M, Beelen R, de Hoogh K, Bellander T, Cesaroni G, Cirach M, et al. 2012. Development
of land use regression models for PM2.5, PM2.5 absorbance, PM10 and PMcoarse in 20
European study areas; results of the ESCAPE project. Environ Sci Technol 46(20):11195-
11205.
9