Embed Size (px)
Citation preview

Supplemental Material
Title: Heart Rate Variability in Association with Frequent Use of Household Sprays and Scented Products in SAPALDIA
Authors: Amar J Mehta, Martin Adam, Emmanuel Schaffner, Jean-Claude Barthélémy , David Carballo, Jean-Michel Gaspoz, Thierry Rochat, Christian Schindler, Joel Schwartz, Jan-Paul Zock, Nino Künzli, Nicole Probst-Hensch, and SAPALDIA-Team
Table of Contents 1. Acknowledgements (page 2) 2. Results (page 3):
• Supplemental Material, Figure 1 (page 3)
• Supplemental Material, Table 1 (page 4)
• Supplemental Material, Table 2 (page 5)
• Supplemental Material, Table 3 (page 6)
• Supplemental Material, Table 4 (page 7)
• Supplemental Material, Figure 2 (page 8)
• Supplemental Material, Figure 3 (page 9)
• Supplemental Material, Figure 4 (page 10)
• Supplemental Material, Table 5 (page 11)
• Supplemental Material, Table 6 (page 12)
1
ACKNOWLEDGEMENTS
The SAPALDIA team:
Study directorate: T Rochat (p), JM Gaspoz (c), N Künzli (e/exp), LJS Liu (exp), NM Probst Hensch (e/g), C Schindler (s). Scientific team: U Ackermann-Liebrich (e), JC Barthélémy (c), W Berger (g), R Bettschart (p), A Bircher (a), G Bolognini (p), O Brändli (p), C Brombach (n), M Brutsche (p), L Burdet (p), M Frey (p), U Frey (pd), MW Gerbase (p), D Gold (e/c/p), E de Groot (c), W Karrer (p), R Keller (p), B Knöpfli (p), B Martin (pa), D Miedinger (o), U Neu (exp), L Nicod (p), M Pons (p), F Roche (c), T Rothe (p), E Russi (p), P Schmid-Grendelmeyer (a), M Tamm (P), A Schmidt-Trucksäss (pa), A Turk (p), J Schwartz (e), D. Stolz (p), P Straehl (exp), JM Tschopp (p), A von Eckardstein (cc), JP Zellweger (p), E Zemp Stutz (e).
Scientific team at coordinating centers: M Adam (e/g), E Boes (g), PO Bridevaux (p), D Carballo (c), E Corradi (e), I Curjuric (e), J Dratva (e), A Di Pasquale (s), L Grize (s), D Keidel (s), S Kriemler (pa), A Kumar (g), M Imboden (g), N Maire (s), A Mehta (e), F Meier (e), H Phuleria (exp), E Schaffner (s), GA Thun (g) A Ineichen (exp), M Ragettli (e), M Ritter (exp), T Schikowski (e), G Stern (pd), M Tarantino (s), M Tsai (e), M Wanner (pa) (a) allergology, (c) cardiology, (cc) clinical chemistry, (e) epidemiology, (exp) exposure, (g) genetic and molecular biology, (m) meteorology, (n) nutrition, (o) occupational health, (p) pneumology, (pa) physical activity, (pd) pediatrics, (s) statistics
Local fieldworkers: Aarau: S Brun, G Giger, M Sperisen, M Stahel, Basel: C Bürli, C Dahler, N Oertli, I Harreh, F Karrer, G Novicic, N Wyttenbacher, Davos: A Saner, P Senn, R Winzeler, Geneva: F Bonfils, B Blicharz, C Landolt, J Rochat, Lugano: S Boccia, E Gehrig, MT Mandia, G Solari, B Viscardi, Montana: AP Bieri, C Darioly, M Maire, Payerne: F Ding, P Danieli A Vonnez, Wald: D Bodmer, E Hochstrasser, R Kunz, C Meier, J Rakic, U Schafroth, A Walder.
Administrative staff: C Gabriel, R Gutknecht.
2
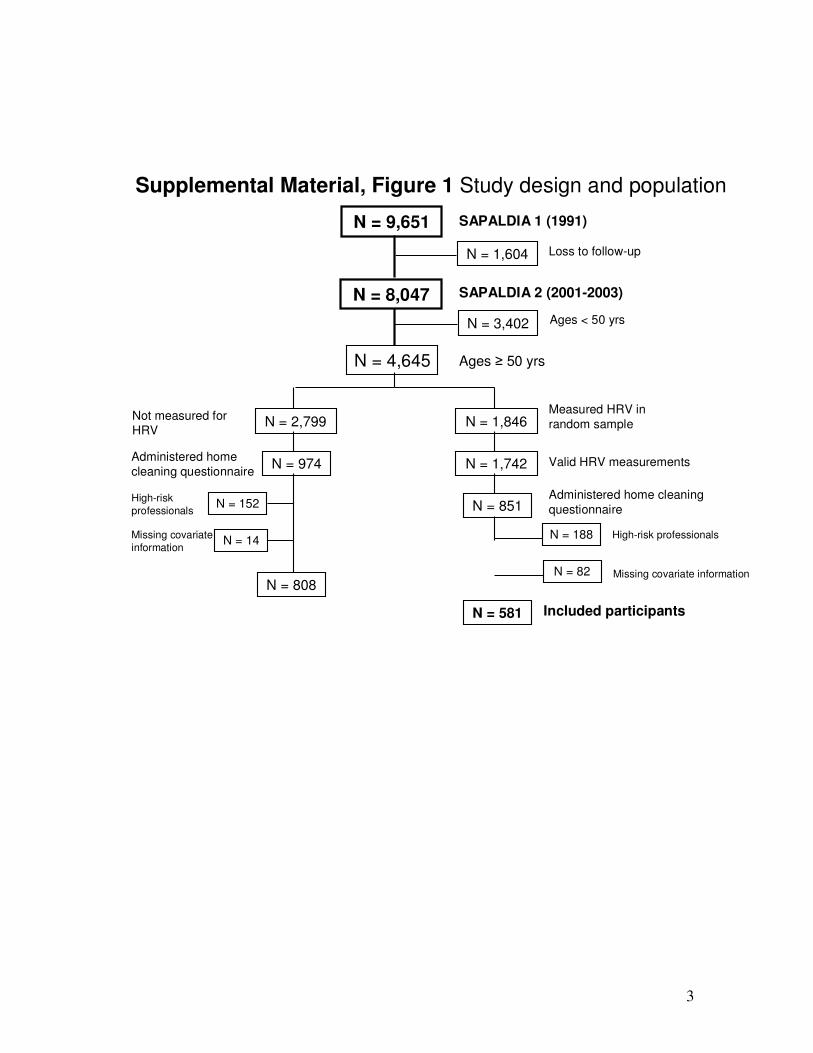
Supplemental Material, Figure 1 Study design and population
N = 9,651
N = 1,604
SAPALDIA 1 (1991)
Loss to follow-up
Administered home cleaning questionnaire
N = 8,047
N = 1,846
SAPALDIA 2 (2001-2003)
N = 3,402 Ages < 50 yrs
N = 4,645 Ages 50 yrs
N = 1,742
Measured HRV in random sample
Valid HRV measurements
N = 851 Administered home cleaning questionnaire
N = 188 High-risk professionals
N = 581
N = 82 Missing covariate information
N = 2,799
N = 974
Not measured for HRV
N = 152
N = 14
High-risk professionals
Included participants
Missing covariate information
N = 808
3

Supplemental Material, Table 1 Comparison of characteristics between selected study participants with heart rate variability measurements and non-selected participants who also reported cleaning activities in their home *
Selected participants Non-selected participants Characteristics (n=581) (n=808)
Age, yrs, median (IQR) 59.9 (54.7, 65.8) 60.6 (55.3, 66.8)
Male, (%) 59 (10.2) 89 (11.0)
Body mass index, kg/m2, median (IQR) 25.8 (22.9, 28.7) 25.5 (22.8, 29.1)
Smoking status, n (%)
Never 316 (54.4) 425 (52.6)
Former 174 (30.0) 228 (28.2)
Current 91 (15.7) 155 (19.2)
ETS exposure, hours/day, n (%)
0 471 (81.1) 661 (81.8)
< 3 75 (12.9) 82 (10.2)
3 35 (6.0) 65 (8.0)
Alcohol consumption, n (%)
< 1 drink/day 384 (66.1) 513 (63.5)
1 drink/day 197 (33.9) 295 (36.5)
Physical activity, hrs/week, n (%)
< 0.5 269 (46.3) 402 (49.8)
0.5 – 2.0 200 (34.4) 241 (29.8)
> 2.0 112 (19.3) 165 (20.4)
Tertiary education level, n (%)
Low 68 (11.7) 92 (11.4)
Medium 407 (70.1) 593 (73.4)
High 106 (18.2) 123 (15.2)
Taking cardiac medication, n (%) Symptoms of chronic obstruction, n (%)
# 136 (23.4) 246 (53.4)
199 (24.6) 332 (54.3)
Used any spray or scented product, n (%)
Yes 515 (88.6) 698 (89.9)
No 66 (11.4) 78 (10.1) * Non-participants who reported cleaning in their home, being equal or older than 50 years of age, and not being in high risk occupations. #
Symptoms of chronic obstruction was defined as having either pre-bronchodilator FEV1/FVC less than 0.70, or chronic bronchitis, or shortness of breath, and in absence of ever having asthma or taking respiratory medication; percentages are expressed relative to the 461 selected and 612 nonparticipants who completed pre-bronchodilator spirometry and did not report ever having asthma or taking respiratory medication.
4
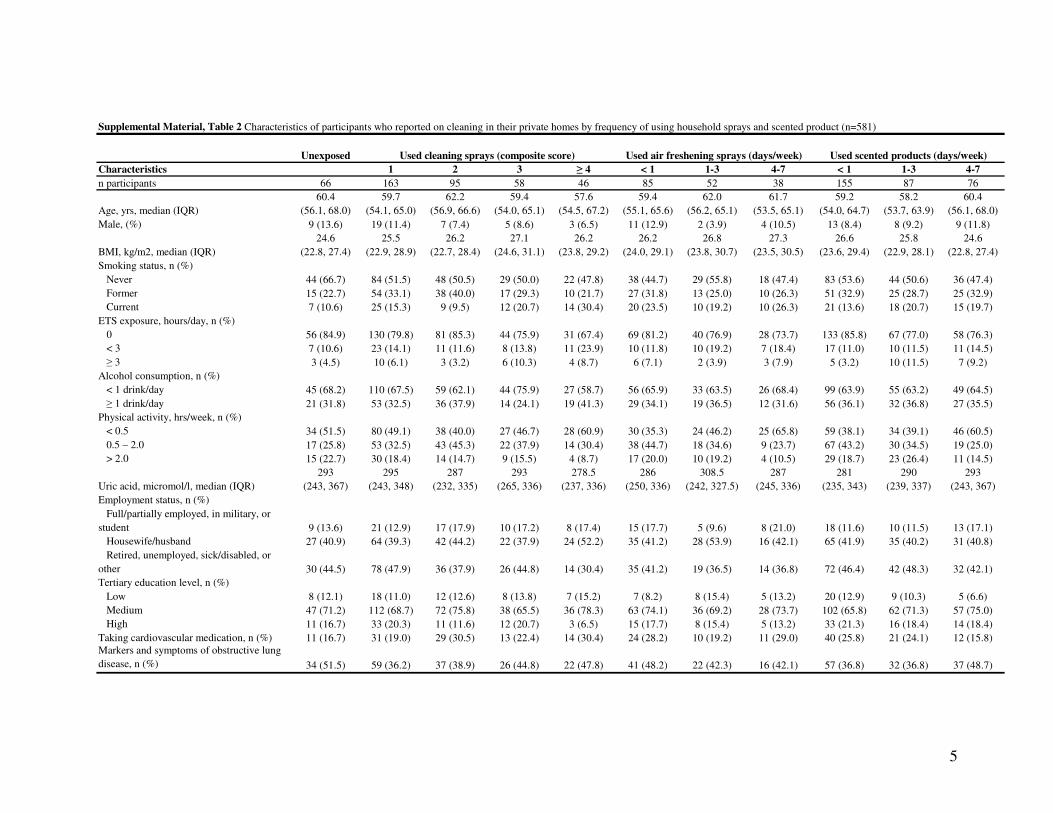
Supplemental Material, Table 2 Characteristics of participants who reported on cleaning in their private homes by frequency of using household sprays and scented product (n=581)
Unexposed Used cleaning sprays (composite score) Used air freshening sprays (days/week) Used scented products (days/week)
Characteristics 1 2 3 4 < 1 1-3 4-7 < 1 1-3 4-7
n participants 66 163 95 58 46 85 52 38 155 87 76
60.4 59.7 62.2 59.4 57.6 59.4 62.0 61.7 59.2 58.2 60.4
Age, yrs, median (IQR) (56.1, 68.0) (54.1, 65.0) (56.9, 66.6) (54.0, 65.1) (54.5, 67.2) (55.1, 65.6) (56.2, 65.1) (53.5, 65.1) (54.0, 64.7) (53.7, 63.9) (56.1, 68.0)
Male, (%) 9 (13.6) 19 (11.4) 7 (7.4) 5 (8.6) 3 (6.5) 11 (12.9) 2 (3.9) 4 (10.5) 13 (8.4) 8 (9.2) 9 (11.8)
24.6 25.5 26.2 27.1 26.2 26.2 26.8 27.3 26.6 25.8 24.6
BMI, kg/m2, median (IQR) (22.8, 27.4) (22.9, 28.9) (22.7, 28.4) (24.6, 31.1) (23.8, 29.2) (24.0, 29.1) (23.8, 30.7) (23.5, 30.5) (23.6, 29.4) (22.9, 28.1) (22.8, 27.4)
Smoking status, n (%)
Never 44 (66.7) 84 (51.5) 48 (50.5) 29 (50.0) 22 (47.8) 38 (44.7) 29 (55.8) 18 (47.4) 83 (53.6) 44 (50.6) 36 (47.4)
Former 15 (22.7) 54 (33.1) 38 (40.0) 17 (29.3) 10 (21.7) 27 (31.8) 13 (25.0) 10 (26.3) 51 (32.9) 25 (28.7) 25 (32.9)
Current 7 (10.6) 25 (15.3) 9 (9.5) 12 (20.7) 14 (30.4) 20 (23.5) 10 (19.2) 10 (26.3) 21 (13.6) 18 (20.7) 15 (19.7)
ETS exposure, hours/day, n (%)
0 56 (84.9) 130 (79.8) 81 (85.3) 44 (75.9) 31 (67.4) 69 (81.2) 40 (76.9) 28 (73.7) 133 (85.8) 67 (77.0) 58 (76.3)
< 3 7 (10.6) 23 (14.1) 11 (11.6) 8 (13.8) 11 (23.9) 10 (11.8) 10 (19.2) 7 (18.4) 17 (11.0) 10 (11.5) 11 (14.5)
3 3 (4.5) 10 (6.1) 3 (3.2) 6 (10.3) 4 (8.7) 6 (7.1) 2 (3.9) 3 (7.9) 5 (3.2) 10 (11.5) 7 (9.2)
Alcohol consumption, n (%)
< 1 drink/day 45 (68.2) 110 (67.5) 59 (62.1) 44 (75.9) 27 (58.7) 56 (65.9) 33 (63.5) 26 (68.4) 99 (63.9) 55 (63.2) 49 (64.5)
1 drink/day 21 (31.8) 53 (32.5) 36 (37.9) 14 (24.1) 19 (41.3) 29 (34.1) 19 (36.5) 12 (31.6) 56 (36.1) 32 (36.8) 27 (35.5)
Physical activity, hrs/week, n (%)
< 0.5 34 (51.5) 80 (49.1) 38 (40.0) 27 (46.7) 28 (60.9) 30 (35.3) 24 (46.2) 25 (65.8) 59 (38.1) 34 (39.1) 46 (60.5)
0.5 – 2.0 17 (25.8) 53 (32.5) 43 (45.3) 22 (37.9) 14 (30.4) 38 (44.7) 18 (34.6) 9 (23.7) 67 (43.2) 30 (34.5) 19 (25.0)
> 2.0 15 (22.7) 30 (18.4) 14 (14.7) 9 (15.5) 4 (8.7) 17 (20.0) 10 (19.2) 4 (10.5) 29 (18.7) 23 (26.4) 11 (14.5)
293 295 287 293 278.5 286 308.5 287 281 290 293
Uric acid, micromol/l, median (IQR) (243, 367) (243, 348) (232, 335) (265, 336) (237, 336) (250, 336) (242, 327.5) (245, 336) (235, 343) (239, 337) (243, 367)
Employment status, n (%)
Full/partially employed, in military, or
student 9 (13.6) 21 (12.9) 17 (17.9) 10 (17.2) 8 (17.4) 15 (17.7) 5 (9.6) 8 (21.0) 18 (11.6) 10 (11.5) 13 (17.1)
Housewife/husband 27 (40.9) 64 (39.3) 42 (44.2) 22 (37.9) 24 (52.2) 35 (41.2) 28 (53.9) 16 (42.1) 65 (41.9) 35 (40.2) 31 (40.8)
Retired, unemployed, sick/disabled, or
other 30 (44.5) 78 (47.9) 36 (37.9) 26 (44.8) 14 (30.4) 35 (41.2) 19 (36.5) 14 (36.8) 72 (46.4) 42 (48.3) 32 (42.1)
Tertiary education level, n (%)
Low 8 (12.1) 18 (11.0) 12 (12.6) 8 (13.8) 7 (15.2) 7 (8.2) 8 (15.4) 5 (13.2) 20 (12.9) 9 (10.3) 5 (6.6)
Medium 47 (71.2) 112 (68.7) 72 (75.8) 38 (65.5) 36 (78.3) 63 (74.1) 36 (69.2) 28 (73.7) 102 (65.8) 62 (71.3) 57 (75.0)
High 11 (16.7) 33 (20.3) 11 (11.6) 12 (20.7) 3 (6.5) 15 (17.7) 8 (15.4) 5 (13.2) 33 (21.3) 16 (18.4) 14 (18.4)
Taking cardiovascular medication, n (%) 11 (16.7) 31 (19.0) 29 (30.5) 13 (22.4) 14 (30.4) 24 (28.2) 10 (19.2) 11 (29.0) 40 (25.8) 21 (24.1) 12 (15.8) Markers and symptoms of obstructive lung
disease, n (%) 34 (51.5) 59 (36.2) 37 (38.9) 26 (44.8) 22 (47.8) 41 (48.2) 22 (42.3) 16 (42.1) 57 (36.8) 32 (36.8) 37 (48.7)
5
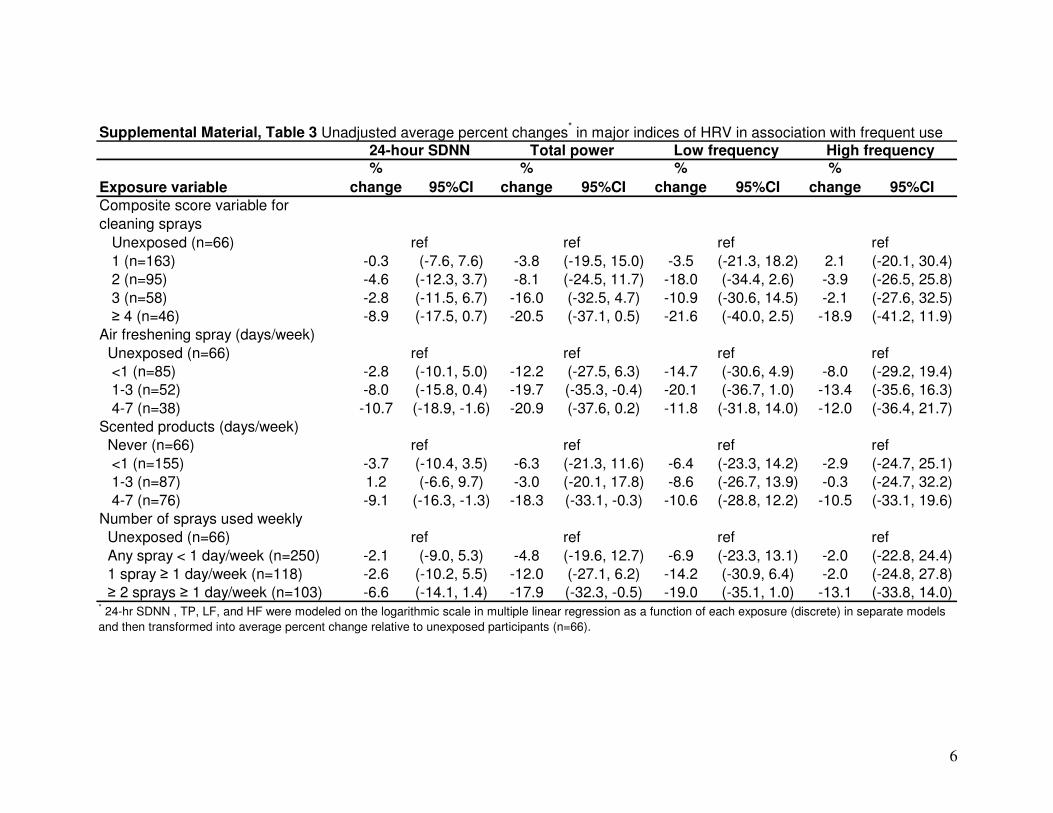
Supplemental Material, Table 3 Unadjusted average percent changes * in major indices of HRV in association with frequent use
24-hour SDNN Total power Low frequency High frequency % % % %
Exposure variable change 95%CI change 95%CI change 95%CI change 95%CI Composite score variable for cleaning sprays
Unexposed (n=66) ref ref ref ref 1 (n=163) -0.3 (-7.6, 7.6) -3.8 (-19.5, 15.0) -3.5 (-21.3, 18.2) 2.1 (-20.1, 30.4) 2 (n=95) -4.6 (-12.3, 3.7) -8.1 (-24.5, 11.7) -18.0 (-34.4, 2.6) -3.9 (-26.5, 25.8) 3 (n=58) -2.8 (-11.5, 6.7) -16.0 (-32.5, 4.7) -10.9 (-30.6, 14.5) -2.1 (-27.6, 32.5) 4 (n=46) -8.9 (-17.5, 0.7) -20.5 (-37.1, 0.5) -21.6 (-40.0, 2.5) -18.9 (-41.2, 11.9)
Air freshening spray (days/week) Unexposed (n=66) ref ref ref ref <1 (n=85) -2.8 (-10.1, 5.0) -12.2 (-27.5, 6.3) -14.7 (-30.6, 4.9) -8.0 (-29.2, 19.4)
1-3 (n=52) -8.0 (-15.8, 0.4) -19.7 (-35.3, -0.4) -20.1 (-36.7, 1.0) -13.4 (-35.6, 16.3) 4-7 (n=38) -10.7 (-18.9, -1.6) -20.9 (-37.6, 0.2) -11.8 (-31.8, 14.0) -12.0 (-36.4, 21.7)
Scented products (days/week) Never (n=66) ref ref ref ref
<1 (n=155) -3.7 (-10.4, 3.5) -6.3 (-21.3, 11.6) -6.4 (-23.3, 14.2) -2.9 (-24.7, 25.1) 1-3 (n=87) 1.2 (-6.6, 9.7) -3.0 (-20.1, 17.8) -8.6 (-26.7, 13.9) -0.3 (-24.7, 32.2) 4-7 (n=76) -9.1 (-16.3, -1.3) -18.3 (-33.1, -0.3) -10.6 (-28.8, 12.2) -10.5 (-33.1, 19.6)
Number of sprays used weekly Unexposed (n=66) ref ref ref ref
Any spray < 1 day/week (n=250) -2.1 (-9.0, 5.3) -4.8 (-19.6, 12.7) -6.9 (-23.3, 13.1) -2.0 (-22.8, 24.4) 1 spray 1 day/week (n=118) -2.6 (-10.2, 5.5) -12.0 (-27.1, 6.2) -14.2 (-30.9, 6.4) -2.0 (-24.8, 27.8) 2 sprays 1 day/week (n=103) -6.6 (-14.1, 1.4) -17.9 (-32.3, -0.5) -19.0 (-35.1, 1.0) -13.1 (-33.8, 14.0)
* 24-hr SDNN , TP, LF, and HF were modeled on the logarithmic scale in multiple linear regression as a function of each exposure (discrete) in separate models
and then transformed into average percent change relative to unexposed participants (n=66).
6
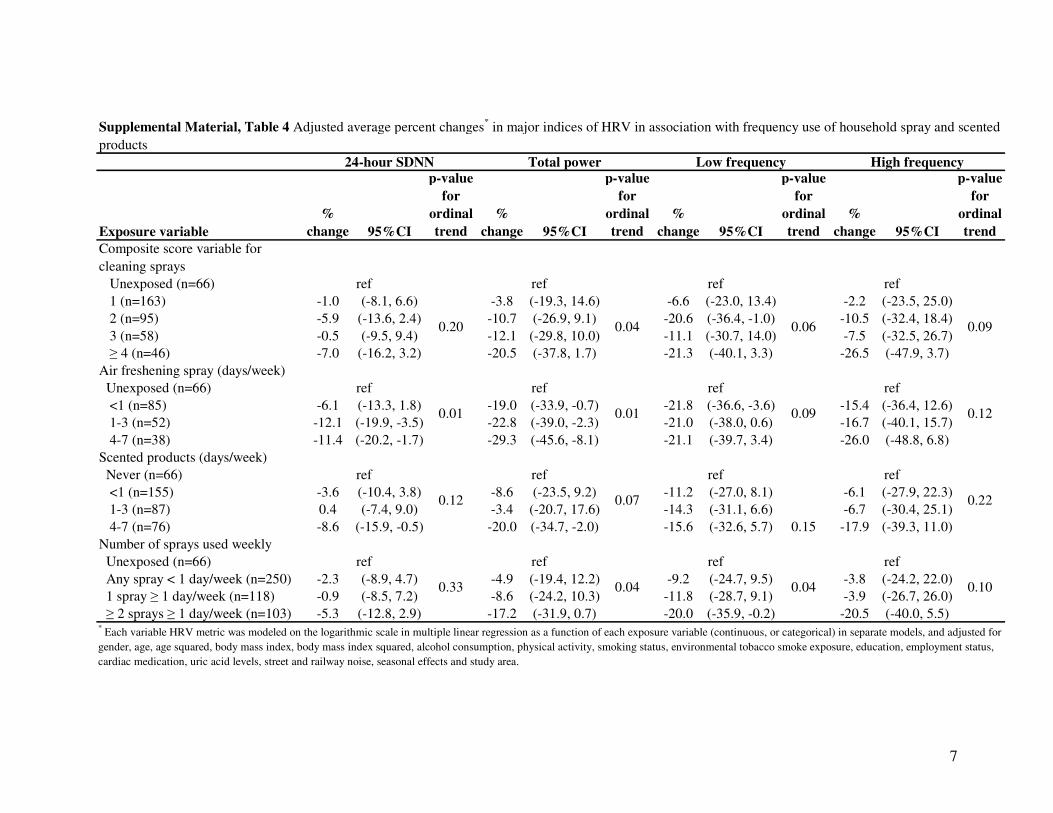
Supplemental Material, Table 4 Adjusted average percent changes * in major indices of HRV in association with frequency use of household spray and scented
products
24-hour SDNN Total power Low frequency High frequency p-value p-value p-value p-value
for for for for
% ordinal % ordinal % ordinal % ordinal
Exposure variable change 95%CI trend change 95%CI trend change 95%CI trend change 95%CI trend
Composite score variable for
cleaning sprays
Unexposed (n=66) ref ref ref ref
1 (n=163) -1.0 (-8.1, 6.6) -3.8 (-19.3, 14.6) -6.6 (-23.0, 13.4) -2.2 (-23.5, 25.0)
2 (n=95) -5.9 (-13.6, 2.4) -10.7 (-26.9, 9.1) -20.6 (-36.4, -1.0) -10.5 (-32.4, 18.4)0.20 0.04 0.06 0.09
3 (n=58) -0.5 (-9.5, 9.4) -12.1 (-29.8, 10.0) -11.1 (-30.7, 14.0) -7.5 (-32.5, 26.7)
4 (n=46) -7.0 (-16.2, 3.2) -20.5 (-37.8, 1.7) -21.3 (-40.1, 3.3) -26.5 (-47.9, 3.7)
Air freshening spray (days/week)
Unexposed (n=66) ref ref ref ref
<1 (n=85) -6.1 (-13.3, 1.8) -19.0 (-33.9, -0.7) -21.8 (-36.6, -3.6) -15.4 (-36.4, 12.6)0.01 0.01 0.09 0.12
1-3 (n=52) -12.1 (-19.9, -3.5) -22.8 (-39.0, -2.3) -21.0 (-38.0, 0.6) -16.7 (-40.1, 15.7)
4-7 (n=38) -11.4 (-20.2, -1.7) -29.3 (-45.6, -8.1) -21.1 (-39.7, 3.4) -26.0 (-48.8, 6.8)
Scented products (days/week)
Never (n=66) ref ref ref ref
<1 (n=155) -3.6 (-10.4, 3.8) -8.6 (-23.5, 9.2) -11.2 (-27.0, 8.1) -6.1 (-27.9, 22.3)0.12 0.07 0.22
1-3 (n=87) 0.4 (-7.4, 9.0) -3.4 (-20.7, 17.6) -14.3 (-31.1, 6.6) -6.7 (-30.4, 25.1)
4-7 (n=76) -8.6 (-15.9, -0.5) -20.0 (-34.7, -2.0) -15.6 (-32.6, 5.7) 0.15 -17.9 (-39.3, 11.0)
Number of sprays used weekly
Unexposed (n=66) ref ref ref ref
Any spray < 1 day/week (n=250) -2.3 (-8.9, 4.7) -4.9 (-19.4, 12.2) -9.2 (-24.7, 9.5) -3.8 (-24.2, 22.0) 0.33 0.04 0.04 0.10
1 spray 1 day/week (n=118) -0.9 (-8.5, 7.2) -8.6 (-24.2, 10.3) -11.8 (-28.7, 9.1) -3.9 (-26.7, 26.0)
2 sprays 1 day/week (n=103) -5.3 (-12.8, 2.9) -17.2 (-31.9, 0.7) -20.0 (-35.9, -0.2) -20.5 (-40.0, 5.5) * Each variable HRV metric was modeled on the logarithmic scale in multiple linear regression as a function of each exposure variable (continuous, or categorical) in separate models, and adjusted for
gender, age, age squared, body mass index, body mass index squared, alcohol consumption, physical activity, smoking status, environmental tobacco smoke exposure, education, employment status,
cardiac medication, uric acid levels, street and railway noise, seasonal effects and study area.
7
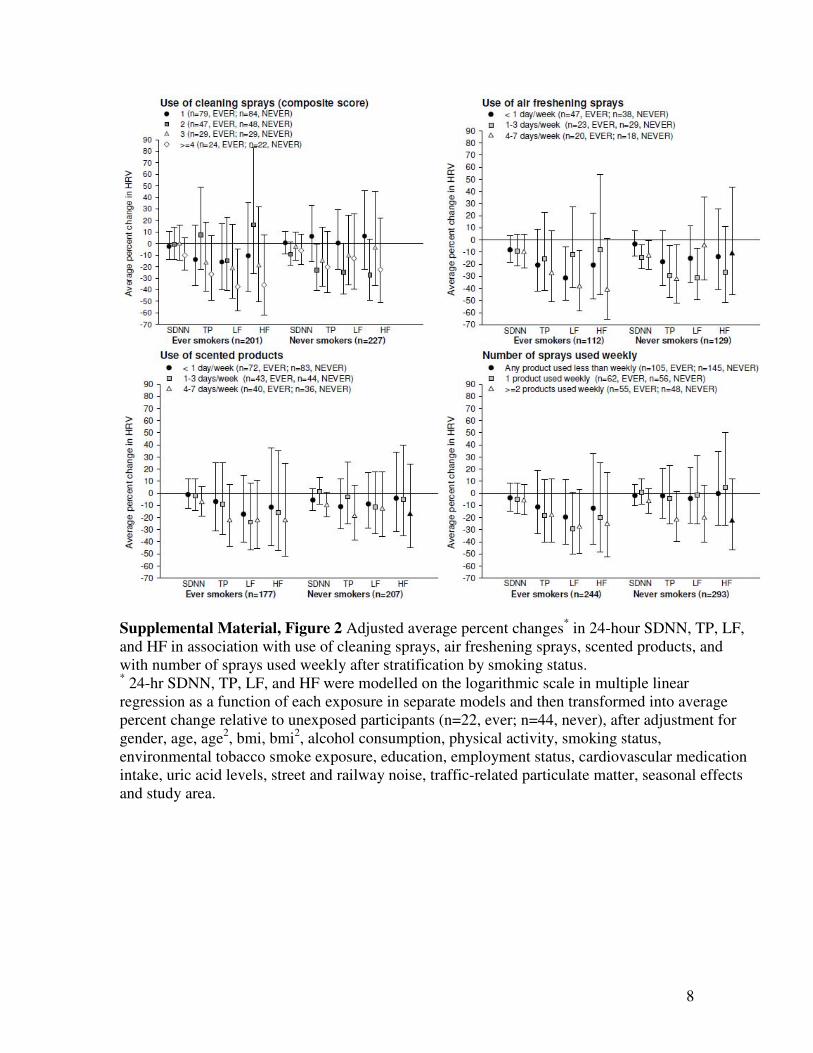
Supplemental Material, Figure 2 Adjusted average percent changes * in 24-hour SDNN, TP, LF, and HF in association with use of cleaning sprays, air freshening sprays, scented products, and with number of sprays used weekly after stratification by smoking status. * 24-hr SDNN, TP, LF, and HF were modelled on the logarithmic scale in multiple linear regression as a function of each exposure in separate models and then transformed into average percent change relative to unexposed participants (n=22, ever; n=44, never), after adjustment for gender, age, age2, bmi, bmi2, alcohol consumption, physical activity, smoking status, environmental tobacco smoke exposure, education, employment status, cardiovascular medication intake, uric acid levels, street and railway noise, traffic-related particulate matter, seasonal effects and study area.
8
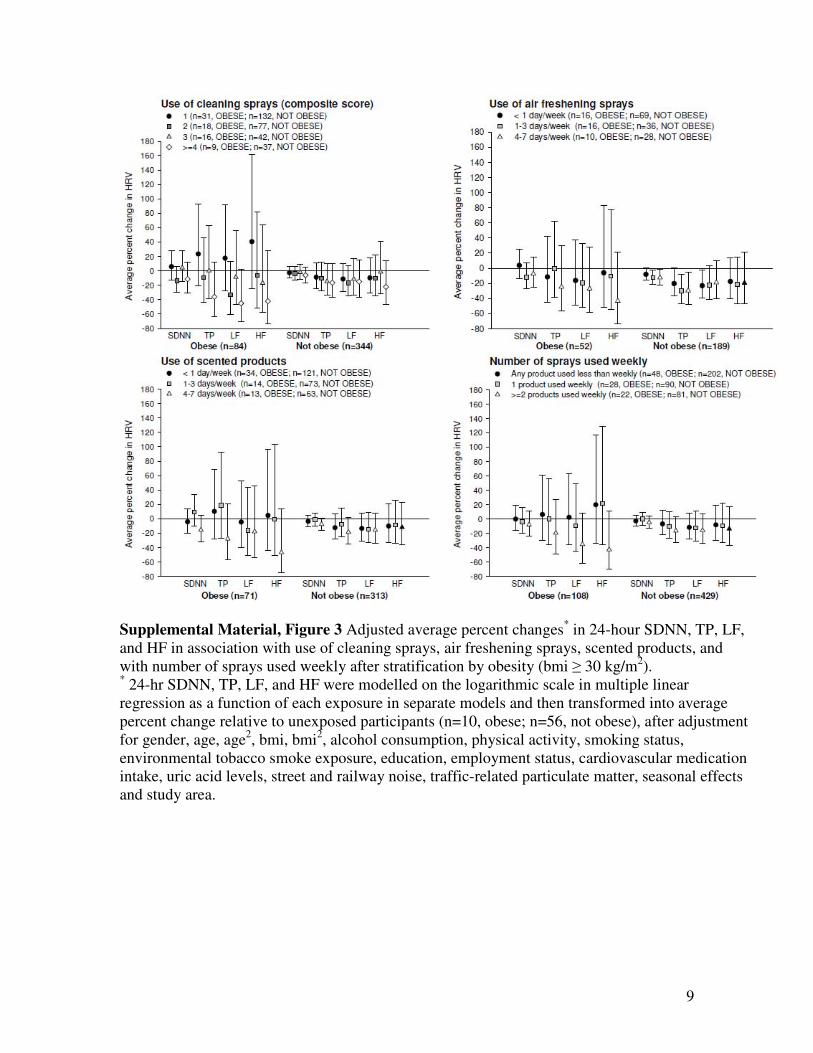
Supplemental Material, Figure 3 Adjusted average percent changes * in 24-hour SDNN, TP, LF, and HF in association with use of cleaning sprays, air freshening sprays, scented products, and with number of sprays used weekly after stratification by obesity (bmi 30 kg/m2). * 24-hr SDNN, TP, LF, and HF were modelled on the logarithmic scale in multiple linear regression as a function of each exposure in separate models and then transformed into average percent change relative to unexposed participants (n=10, obese; n=56, not obese), after adjustment for gender, age, age2, bmi, bmi2, alcohol consumption, physical activity, smoking status, environmental tobacco smoke exposure, education, employment status, cardiovascular medication intake, uric acid levels, street and railway noise, traffic-related particulate matter, seasonal effects and study area.
9
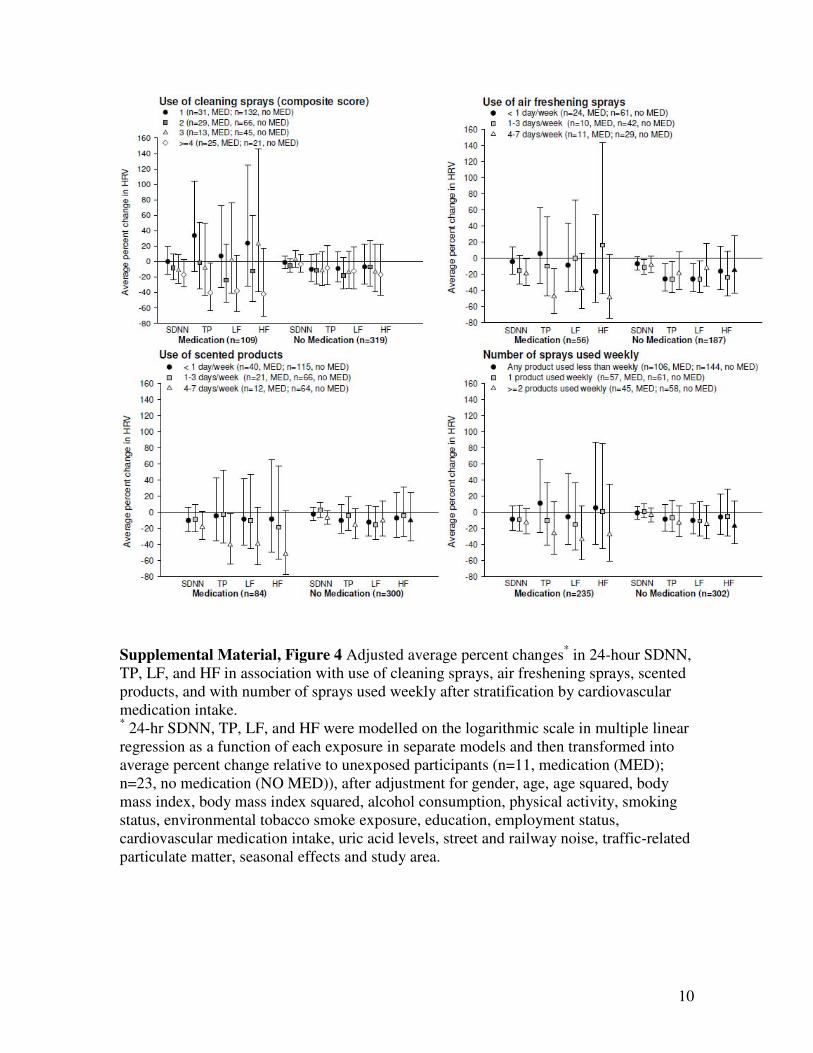
Supplemental Material, Figure 4 Adjusted average percent changes * in 24-hour SDNN, TP, LF, and HF in association with use of cleaning sprays, air freshening sprays, scented products, and with number of sprays used weekly after stratification by cardiovascular medication intake. * 24-hr SDNN, TP, LF, and HF were modelled on the logarithmic scale in multiple linear regression as a function of each exposure in separate models and then transformed into average percent change relative to unexposed participants (n=11, medication (MED); n=23, no medication (NO MED)), after adjustment for gender, age, age squared, body mass index, body mass index squared, alcohol consumption, physical activity, smoking status, environmental tobacco smoke exposure, education, employment status, cardiovascular medication intake, uric acid levels, street and railway noise, traffic-related particulate matter, seasonal effects and study area.
10

Supplemental Material, Table 5 Adjusted average percent changes * in major indices of nighttime HRV in association with frequency use of household spray and scented products
24-hour SDNN Total power p-value p-value
for for
% ordinal % ordinal
Exposure variable change 95%CI trend change 95%CI trend Composite score variable for cleaning sprays Unexposed (n=66) ref ref 1 (n=163) -3.9 (-11.3, 4.1) -2.0 (-17.3, 16.2) 2 (n=95) -10.4 (-18.1, -2.0) -13.1 (-28.1, 4.1)
0.31 0.27 3 (n=58) -3.9 (-13.1, 7.3) 1.0 (-18.9, 25.9) 4 (n=46) -4.9 (-15.6, 6.2) -14.8 (-32.3, 8.3)
Air freshening spray (days/week) Unexposed (n=66) ref ref <1 (n=85) -9.5 (-18.1, 0.2) -9.5 (-26.7, 10.2)
0.17 0.18 1-3 (n=52) -10.4 (-20.5, 0.6) -16.5 (-33.6, 5.9) 4-7 (n=38) -11.3 (-21.3, 1.2) -13.9 (-33.6, 11.6) Scented products (days/week) Never (n=66) ref ref <1 (n=155) -5.8 (-13.1, 3.0) -3.0 (-18.1, 15.0)
0.28 0.20 1-3 (n=87) -3.0 (-11.3, 6.2) -5.8 (-22.1, 13.9) 4-7 (n=76) -6.8 (-15.6, 2.0) -11.3 (-26.7, 8.3) Number of sprays used weekly Unexposed (n=66) ref ref Any spray < 1 day/week (n=250) -4.9 (-12.2, 3.0) -3.9 (-18.9, 12.7)
0.54 0.42 1 spray 1 day/week (n=118) -2.0 (-10.4, 7.3) -3.0 (-19.7, 17.4) 2 sprays 1 day/week (n=103) -5.8 (-13.9, 3.0) -8.6 (-25.2, 10.5)
* Each variable HRV metric was modeled on the logarithmic scale in multiple linear regression as a function of each exposure variable (continuous, or categorical) in separate models, and adjusted for gender, age, age squared, body mass index, body mass index squared, alcohol consumption, physical activity, smoking status, environmental tobacco smoke exposure, education, employment status, cardiac medication, uric acid levels, street and railway noise, seasonal effects and study area.
11
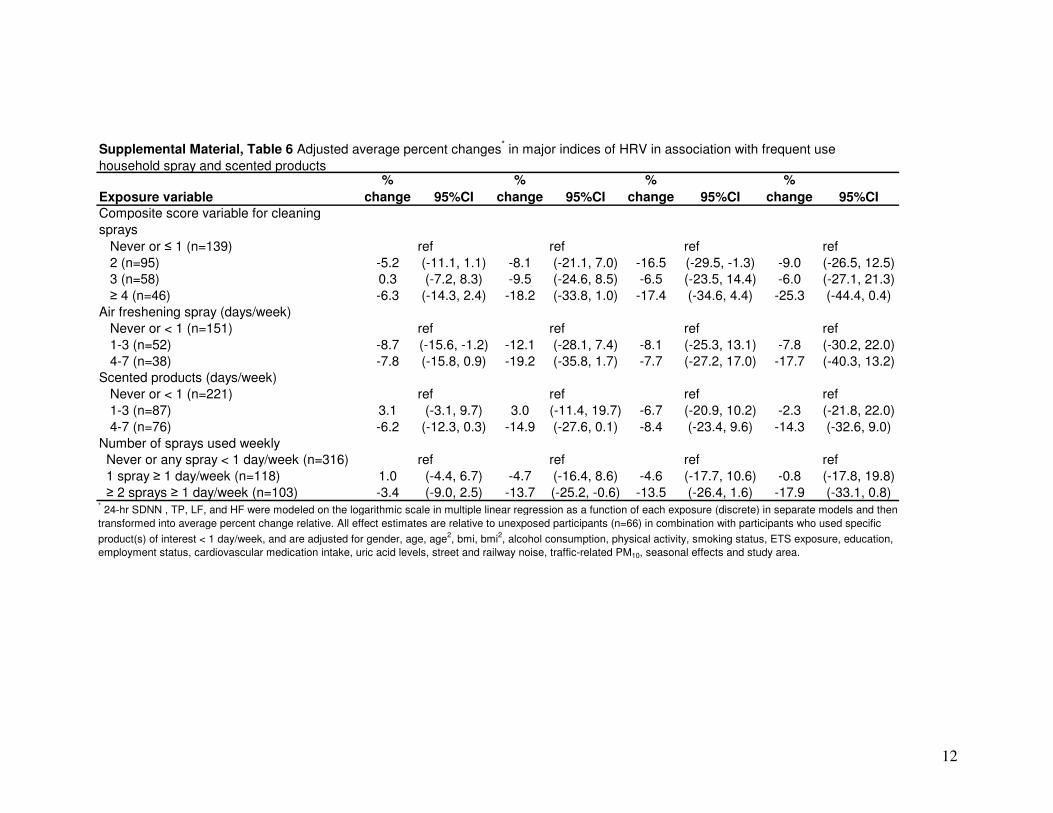
Supplemental Material, Table 6 Adjusted average percent changes * in major indices of HRV in association with frequent use household spray and scented products
% % % %
Exposure variable change 95%CI change 95%CI change 95%CI change 95%CI Composite score variable for cleaning sprays Never or 1 (n=139) ref ref ref ref 2 (n=95) -5.2 (-11.1, 1.1) -8.1 (-21.1, 7.0) -16.5 (-29.5, -1.3) -9.0 (-26.5, 12.5) 3 (n=58) 0.3 (-7.2, 8.3) -9.5 (-24.6, 8.5) -6.5 (-23.5, 14.4) -6.0 (-27.1, 21.3) 4 (n=46) -6.3 (-14.3, 2.4) -18.2 (-33.8, 1.0) -17.4 (-34.6, 4.4) -25.3 (-44.4, 0.4)
Air freshening spray (days/week) Never or < 1 (n=151) ref ref ref ref 1-3 (n=52) -8.7 (-15.6, -1.2) -12.1 (-28.1, 7.4) -8.1 (-25.3, 13.1) -7.8 (-30.2, 22.0) 4-7 (n=38) -7.8 (-15.8, 0.9) -19.2 (-35.8, 1.7) -7.7 (-27.2, 17.0) -17.7 (-40.3, 13.2) Scented products (days/week) Never or < 1 (n=221) ref ref ref ref 1-3 (n=87) 3.1 (-3.1, 9.7) 3.0 (-11.4, 19.7) -6.7 (-20.9, 10.2) -2.3 (-21.8, 22.0) 4-7 (n=76) -6.2 (-12.3, 0.3) -14.9 (-27.6, 0.1) -8.4 (-23.4, 9.6) -14.3 (-32.6, 9.0) Number of sprays used weekly Never or any spray < 1 day/week (n=316) ref ref ref ref 1 spray 1 day/week (n=118) 1.0 (-4.4, 6.7) -4.7 (-16.4, 8.6) -4.6 (-17.7, 10.6) -0.8 (-17.8, 19.8) 2 sprays 1 day/week (n=103) -3.4 (-9.0, 2.5) -13.7 (-25.2, -0.6) -13.5 (-26.4, 1.6) -17.9 (-33.1, 0.8)
* 24-hr SDNN , TP, LF, and HF were modeled on the logarithmic scale in multiple linear regression as a function of each exposure (discrete) in separate models and then transformed into average percent change relative. All effect estimates are relative to unexposed participants (n=66) in combination with participants who used specific
product(s) of interest < 1 day/week, and are adjusted for gender, age, age2, bmi, bmi2, alcohol consumption, physical activity, smoking status, ETS exposure, education, employment status, cardiovascular medication intake, uric acid levels, street and railway noise, traffic-related PM10, seasonal effects and study area.
12