Embed Size (px)
Citation preview
Supplemental Materials and Methods
Isolation of liposarcoma cells and establishment of liposarcoma cell lines/strains
This procedure was conducted with approval from the Institutional Review Board at The
University of Texas M.D. Anderson Cancer Center and patients’ informed consent. Tumor cell
isolation was conducted as previously described. Each of the 7 cell lines/strains used in this
study were derived from tumors independent of those represented on the liposarcoma TMA.
Lipo224a, 224b, 247b, 445a, and 863b were derived from WDLPS and DDLPS tumors obtained
from patients independent of those represented on the liposarcoma TMA. Briefly, fresh sterile
samples from surgically resected tumors were minced in culture medium and digested via
incubation with collagenase type I (3%), DNase I (0.02%), and hyaluronidase (1.5mg/mL) at
37oC for 2-4 h. Samples were strained through wire mesh screens and undigested tissue was
discarded. After centrifugation, washes, and resuspension in PBS, samples were gently
transferred to Histopaque tubes containing 10mL Histopaque (100%, Sigma) overlayed with
15mL of Histopaque (75%). The tubes were then centrifuged at 4oC for 30 min at 1200 g. After
centrifugation, tumor cells located in the top interface (over the 75% Ficoll) were collected and
plated (high fat containing cells have been discarded). Cells were cultured and passaged in
DMEM supplemented with 10% FBS.
MDM2 FISH analysis
FISH was performed on fixed cultured cells with a laboratory-developed BAC probe
cocktail using BAC clones RP11- RP11-185H13, RP11-450G15, RP11-816C9, RP11-630N19,
RP11-717F7, RP11-1104N20 and RP11-426B12 (purchased from the Children’s Hospital
Oakland research Institute, Oakland, CA, USA) specific for the 12q15 region (spectrum orange)
and a probe specific for the centromeric region of chromosome 12 (spectrum green; Abbott
Molecular, DesPlaines, IL, USA). A minimum of 100 nuclei per slide were analyzed. The
average number of MDM2 and CEP12 signals was then determined and a MDM2/CEP12 ratio

was calculated for each case. A ratio ≥2 was considered amplified for the MDM2 gene,
whereas a ratio <2.0 was considered nonamplified. A ratio of <2.0 with >2 signals of both
probes was considered polysomic for CEP12. The established DDLPS cell line LPS-141 and
normal adipocytes were used as positive and negative controls, respectively.

Variable n (% or range) WD (n=101) DD (n=50) p-value
Median Age at Initial Surgery 60.5 (22.3-85.5) 60.2 (22.3-85.5) 61.1 (34.7-82.4) 0.404
Gender 0.086
Female 60 (39.7) 45 (44.6) 15 (30)
Male 91 (60.3) 56 (55.4) 35 (70)
Location of Initial Surgery 0.633
MDACC 141 (93.4) 95 (94.1) 46 (92)
Other Institution 10 (6.6) 6 (5.9) 4 (8)
Ethnicity 0.191
White 118 (78.1) 76 (75.2) 42 (84)
Black 8 (5.3) 5 (5) 3 (6)
Hispanic 20 (13.2) 16 (15.8) 4 (8)
Asian 5 (3.3) 4 (4) 1 (2)
Median Tumor Size (cm) 24.25 (2.5-100) 24.25 (2.5-100) 24 (4.5-68) 0.948
Primary Tumor Histology
WD 101 (66.9) - - -
DD or WD and DD 50 (33.1) - - -
Tumor Site <0.001
Retroperitoneum/abdomen/pelvis 109 (72.2) 61 (60.4) 48 (96)
Extremity 33 (21.9) 33 (32.7) 0 (0)
Buttock 5 (3.3) 4 (4) 1 (2)
Inguinal, scrotal only 2 (1.3) 1 (1) 1 (2)
Chest/mediastinum 1 (0.7) 1 (1) 0 (0)
Chest/abdominal wall 1 (0.7) 1 (1) 0 (0)
Multifocality 0.007
Unifocal 123 (81.5) 88 (87.1) 35 (70)
Multifocal 27 (17.9) 12 (11.9) 15 (30)
Unknown 1 (0.7) 1 (1) 0 (0)
Completeness of Resection 0.046
R0/R1 (Macroscopically Complete) 137 (90.7) 95 (94.1) 42 (84)
R2 (Macroscopically Incomplete) 14 (9.3) 6 (5.9) 8 (16)
Tumor Integrity 0.615
Intact Tumor 136 (90.1) 93 (92.1) 43 (86)
Tumor Rupture or Transection 13 (8.6) 8 (7.9) 5 (10)
Unknown 2 (1.3) 0 (0) 2 (4)
Chemotherapy <0.001
No 127 (84.1) 94 (93.1) 33 (66)
Yes 23 (15.2) 6 (5.9) 17 (34)
Unknown 1 (0.7) 1 (1) 0 (0)
Radiation therapy 0.863
No 131 (86.8) 87 (86.1) 44 (88)
Yes 19 (12.6) 13 (12.9) 6 (12)
Unknown 1 (0.7) 1 (1) 0 (0)
Number of Recurrences 0.027
0 76 (50.3) 58 (57.4) 18 (36)
1 40 (26.5) 23 (22.8) 17 (24)
2 17 (11.3) 9 (8.9) 8 (16)
3 14 (9.3) 7 (6.9) 7 (14)
4 or more 4 (2.7) 4 (4) 0 (0)
Distant metastasis 18 (11.9) 7 (6.9) 11 (22) 0.007
Median Length of Followup (months) 75.37 (0.33-236.77) 91.1 (6.3-236.77) 37.58 (0.33-158.63) <0.001
Status at Last Followup <0.001
Dead of Disease 47 (31.1) 18 (17.8) 29 (58)
Dead of Other Cause/Cause Unknown 9 (6) 9 (8.9) 12 (24)
Alive with Disease 33 (21.9) 21 (20.8) 9 (18)
Alive No Evidence of Disease 62 (41.1) 53 (52.5) 0 (0)
Last Known Status <0.001
Dead of Disease 62 (41.1) 24 (23.8) 38 (76)
Dead of Other Cause/Cause Unknown 16 (10.6) 15 (14.9) 1 (2)
Alive with Disease 18 (11.9) 145 (14.9) 3 (6)
Alive No Evidence of Disease 55 (36.5) 46 (45.5) 8 (16)
5 year Overall Survival (%) 62.8 77.0 33.0
Median Overall Survival (months) 88.97 (6.3-244.5) 97.43 (6.3-244.5) 40 (6.87-158.63) <0.001
Median Local Recurrence-Free Survival (months) 65.33 (2.33-243.27) 91.83 (2.53-243.27) 14 (2.33-220) <0.001
Median Distant Recurrence-Free Survival (months) 252.83 (1.63-244.5) 120.8 (31.07-277.77) 99.97 (1.23-283.9) <0.035
Supp Figure 1
Supplemental Figure 1. Clinicopathologic characteristics of patients with primary WDLPS and DDLPS represented
on tissue microarray (n=151). Discrete data were analyzed using a Fisher exact comparison, and continuous data were
analyzed using a t test.
SuppFigure 2
A 0
1
2
3
0
1
2
3
B
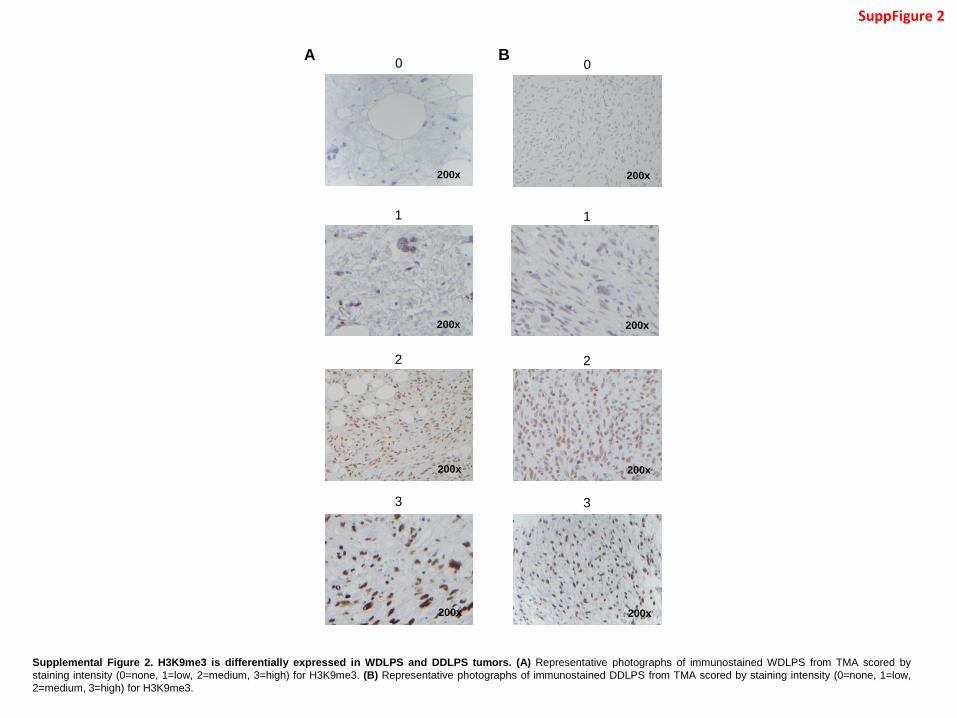
Supplemental Figure 2. H3K9me3 is differentially expressed in WDLPS and DDLPS tumors. (A) Representative photographs of immunostained WDLPS from TMA scored by
staining intensity (0=none, 1=low, 2=medium, 3=high) for H3K9me3. (B) Representative photographs of immunostained DDLPS from TMA scored by staining intensity (0=none, 1=low,
2=medium, 3=high) for H3K9me3.
200x 200x
200x 200x
200x 200x
200x 200x

A
B
C
224a 224b 863b
247b
246
029b 445a
Designated
Name
Patient
Age
Patient
Gender
Primary/Recurrent
Tumor
Tumor
Location Histology
% Cells with
MDM2
Amplification
Lipo224a Female 81 Primary Pelvis DDLPS 98
Lipo224b Female 81 Recurrent Pelvis DDLPS 98
Lipo246 Male 57 Recurrent RPS DDLPS 99
Lipo247b Male 67 Recurrent RPS WDLPS 64
Lipo029b Female 46 Recurrent RPS WDLPS 61
Lipo445a Female 66 Primary RPS WDLPS 90
Lipo863b Male 73 Recurrent RPS DDLPS 91
224a 224b 863b
247b
246
029b 445a
Supp Figure 3
Supplemental Figure 3. WDLPS and DDLPS cell lines. (A) Characteristics of WDLPS and DDLPS cell lines and tumors from which cell
lines were derived. (B) H+E staining of original tissue/tumor from which cell lines were derived. (C) Confirmation of MDM2 amplification by
FISH analysis.
100x 100x
100x 100x
100x 100x
100x

B C
D E
0.1
0.2
0.3
0.4
Genomic Region (5' −> 3')
Rea
d c
ou
nt P
er
Mill
ion m
app
ed r
eads
−5000 5'End 33% 66% 3'End 5000
224a (DD)
224b (DD)
247b (WD)
029b (WD)
0.1
0.2
0.3
0.4
0.5
0.6
Genomic Region (5' −> 3')
Rea
d c
ou
nt P
er
Mill
ion m
app
ed r
eads
−5000 5'End 33% 66% 3'End 5000
224a (DD)
224b (DD)
247b (WD)
029b (WD)
Supp Figure 4
Supplemental Figure 4. Number of H3K9me3 regions differentially enriched among WDLPS and DDLPS cell lines. (A) Overview and
quality metrics of ChIP-sequencing and data analysis. (B) Number of regions preferentially enriched in DDLPS cell lines. (C) Number of regions
preferentially enriched in WDLPS cell lines. (D) Aggregate plots showing profiles of H3K9me3 around identified peaks specific to DDLPS cell
lines. (E) Aggregate plots showing profiles of H3K9me3 around identified peaks specific to WDLPS cell lines.
A

Supp Figure 5
Supplemental Figure 5. Heatmap of differentially expressed genes
among DDLPS and WDLPS cell lines on microarray analysis. Each
sample performed in triplicate.

A
B
224a (DD)
224b (DD)
246 (DD)
863b (DD)
029b (WD)
247b (WD)
445a (WD)
all DDLPS cell lines all WDLPS cell lines
Supp Figure 6
Supplemental Figure 6. KLF6 is epigenetically silenced in DDLPS. (A) Histograms of ChIP
fragments across the KLF6 locus for each LPS cell line. H3K9me3 is enriched at the regulatory
region of KLF6 in multiple DDLPS cell lines compared to WDLPS cell lines. Each track is normalized
to 10 million reads with same track height and vertical viewing range. (B) Box plot showing KLF6
expression in DDLPS cell lines (224a, 224b, 246, 863b) compared to WDLPS (029b, 247b, 445a)
cell lines by microarray analysis (n=3).

A
B
Supp Figure 7
Re
lati
ve K
LF6
-wt
exp
ress
ion
(m
RN
A)
DD Normal Fat WD
Re
lati
ve K
LF6
-sv1
exp
ress
ion
(m
RN
A)
DD Normal Fat WD
Supplemental Figure 7. Wild type KLF6 (KLF6-wt) and KLF6 splice variant 1 (KLF6-sv1)
are underexpressed in human DDLPS tumors compared to WDLPS tumors. (A) KLF6-wt
expression among human DDLPS tumors (n=17) compared to WDLPS tumors (n=13) and
normal fat (n=6) assessed by RT-qPCR normalized to GAPDH (mean +/- SD; n=3). (B) KLF6-
sv1 expression among human DDLPS tumors (n=17) compared to WDLPS tumors (n=13) and
normal fat (n=6) assessed by RT-qPCR normalized to GAPDH (mean +/- SD; n=3). Mann-
Whitney U and Kruskal-Wallis tests were used. These data are representative of 2
experiments.

Supplemental Figure 8. Relative KLF6 copy number in WDLPS and DDLPS cell lines and tumors. (A) Relative KLF6 copy number of WDLPS (n=3) and DDLPS (n=4) cell lines assessed by
Taqman copy number variation assay (RNaseP reference) (mean +/- SD; n=3). (B) Relative KLF6 copy number of WDLPS (n=15) and DDLPS (n=19) tumors assessed by Taqman copy number
variation assay (RNaseP reference) (mean +/- SD; n=3). (C) Relative KLF6 copy number and protein expression among normal fat, WDLPS, and DDLPS samples show poor correlation between
copy number and protein expression between and within tissue/tumor types. These data are representative of 2 experiments.
C
Sample Specimen Histology Relative KLF6 Gene Copy
Number Relative KLF6 Protein Expression1
N58 Normal fat 3.1 33.95
N73 Normal fat 2.3 130.23
N66 Normal fat 2.1 0.82
N74 Normal fat 2.0 0.11
N51 Normal fat 2.0 Below detection
N44 Normal fat 1.3 2.39
T68 DD 2.8 0.65
T88 DD 2.8 Below detection
T50b DD 2.6 Below detection
T61b DD 2.3 9.59
T71 DD 2.3 0.14
T7 DD 2.2 0.80
T65 DD 2.2 1.08
T49 DD 2.1 Below detection
T9a DD 2.0 28.21
T64 DD 2.0 0.15
T80 DD 1.9 0.88
T57 DD 1.8 Below detection
T83 DD 1.8 86.56
T25 DD 1.7 1.00
T67b DD 1.7 0.07
T12a DD 1.6 1.08
T33 DD 1.6 0.28
T90 DD 1.3 2.34
T1 DD 1.2 Below detection
T47 WD 3.1 23.13
T53 WD 3.1 17.29
T85 WD 2.9 1.58
T43b WD 2.8 4.19
T86 WD 2.8 80.59
T63 WD 2.7 5.38
T66a WD 2.7 10.94
T51 WD 2.4 16.72
T20 WD 2.2 179.17
T28 WD 2.0 7.51
T9b WD 1.9 5.71
T76b WD 1.9 Below detection
T12b WD 1.8 11.35
T36 WD 1.2 76.59
1Relative to sample T25 A
B
Re
lati
ve K
LF6
co
py
nu
mb
er
Re
lati
ve K
LF6
co
py
nu
mb
er
Supp Figure 8

A B C
F
SuppFigure 9 R
ela
tive
KLF
6 e
xpre
ssio
n (m
RN
A)
Control KLF6
Control
KLF6
p < 0.001
KLF
6
Co
ntr
ol
D
% C
on
flu
en
ce
Hours
KLF
6
C
on
tro
l
G
Control
KLF6
* p<0.05
Re
lati
ve e
xpre
ssio
n (
mR
NA
)
CEBPA CEBPB PPARG
Supplemental Figure 9. KLF6 overexpression inhibits DDLPS cell proliferation, induces expression of adipogenesis differentiation
markers, and results in cellular senescence. (A) KLF6 overexpression in DDLPS cell line 224b assessed by RT-qPCR normalized to GAPDH
(mean +/- SD; n=3). Student’s t test. (B) Cellular proliferation of DDLPS cell line 224b overexpressing KLF6 versus control (mean +/- SEM; n=10).
Mann-Whitney U test. (C) Image of invasive cells from Boyden chamber assay on DDLPS cell line 224b cells stably expressing KLF6 or control.
(D) Quantification of invaded cells from Boyden chamber assay in DDLPS 224b cells expressing control or KLF6. Plot shows relative absorbance
from crystal violet stain of invaded cells (mean +/- SEM; n=3). (E) Image of invasive cells from Boyden chamber assay on DDLPS 246 cell line
cells stably expressing KLF6 or control. (F) Image of invasive cells from Boyden chamber assay on DDLPS 224a cell line cells stably expressing
KLF6 or control. (G) B-galactosidase staining assaying for cellular senescence in DDLPS cell line 224b overexpressing KLF6 versus control. (H)
Relative expression of adipogenesis associated markers CEBPA, CEBPB and PPARG in DDLPS cell line 224b overexpressing KLF6 versus
control as assessed by RT-qPCR normalized to GAPDH (mean +/- SD; n=3). Student’s t test. These data are representative of 2 experiments.
E
H
KLF
6
Co
ntr
ol
KLF
6
Co
ntr
ol
DDLPS 246 DDLPS 224a
DDLPS 224b
0 .0 0
0 .0 5
0 .1 0
0 .1 5
0 .2 0
0 .2 5
Re
lati
ve A
bso
rban
ce
(Cry
stal
Vio
let,
59
0n
M) DDLPS 224b
Control KLF6
DDLPS 224b DDLPS 224b

Supplemental Figure 10. Chaetocin, an inhibitor of SUV39H1, inhibits DDLPS proliferation, inhibits H3K9 trimethylation globally and at the KLF6 locus, and induces upregulation of
KLF6 and proadipogenesis factors PPARG, CEBPA, and CEBPB. (A) Proliferation of DDLPS cell line 224b upon chaetocin treatment (mean +/- SEM; n=6). (B) Global levels of H3K9me3 by
western blot analysis in DDLPS cell line 224b following chaetocin treatment (30nM). 2-way ANOVA test. (C) KLF6 expression by RT-qPCR analysis in DDLPS cell line 224b following chaetocin
treatment (30nM) normalized to GAPDH (mean +/- SD, n=3). (D) ChIP-qPCR analysis of H3K9me3 enrichment at the KLF6 locus in DDLPS 224b cells treated with vehicle vs chaetocin 30nM for
24hrs (mean +/- SD, n=3). Student’s t test. (E) Relative expression of PPARG, CEBPA, and CEBPB by RT-qPCR in DDLPS cell line 224b following chaetocin treatment (30nM) normalized to
GAPDH (mean +/- SD, n=3). Student’s t test. These data are representative of 2 experiments.
B A
% C
on
flu
en
ce
Co
ntr
ol
24
hrs
H3
H3K9me3
Hours Following Chaetocin Treatment
p < 0.001
C
Control 24hrs 48hrs Re
lati
ve K
LF6
exp
ress
ion
(m
RN
A)
D
Re
lati
ve e
xpre
ssio
n (
mR
NA
)
CEBPA CEBPB PPARG
E
SuppFigure 10
Supp Figure 11
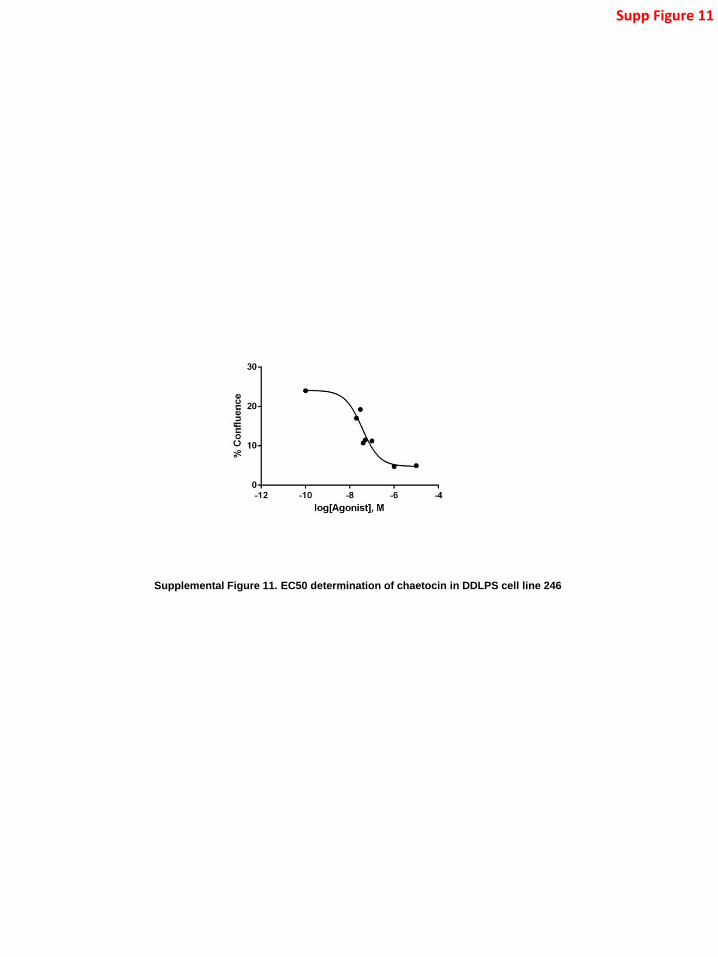
Supplemental Figure 11. EC50 determination of chaetocin in DDLPS cell line 246

Re
lati
ve S
UV
39
H1
exp
ress
ion
A B
Supp Figure 12
Re
lati
ve S
UV
39
H1
exp
ress
ion
(mR
NA
)
DD Normal Fat WD
Supplemental Figure 12. DDLPS and WDLPS do not differ in SUV39H1 gene expression. (A) Relative SUV39H1 gene
expression among DDLPS and WDLPS cell lines by RT-qPCR analysis normalized to GAPDH (mean +/- SD, n=3). (B-K)
Relative mRNA expression of SUV39H1 (B, Mann-Whitney U and Kruskal-Wallis tests), SUV39H2, (C), SETDB1 (D), SETDB2
(E), EHMT1 (F), EHMT2 (G), JMJD2A (H, Student’s t test), JMJD2B (I), JMJD2C (J) and JMJD2D (K) among DDLPS and
WDLPS tumors by RT-qPCR analysis normalized to GAPDH (mean +/- SD, n=3). These data are representative of 2
experiments.
DD Normal Fat WD DD Normal Fat WD
JMJD2B JMJD2C JMJD2D I J K
P =0.045
P =0.037
DD Normal Fat WD
DD Normal Fat WD DD Normal Fat WD
EHMT1 EHMT2 JMJD2A F G H
DD Normal Fat WD
DD Normal Fat WD DD Normal Fat WD
SUV39H2 SETDB1 SETDB2 C D E
DD Normal Fat WD