Embed Size (px)
Citation preview

1
SUPPLEMENTAL METHODS
aCGH Analysis
STS39 and SKLMS1 cell lines were analysed for copy number variation using array comparative
genomic hybridization on the Genome-Wide Human SNP Array 6.0, and mapped using STR
analysis (TCAG, Sick Kids, Toronto, CA). aCGH analysis was performed using the oligo
package (v.1.12.2), in the R statistical environment (v.2.11.1), and data visualization performed
using the lattice (v.0.20-24), and latticeExtra (v.0.6-26) packages in the R statistical environment
(v.3.0.2).
Annexin V assay
The ability of BEZ235 or Dox to induce apoptosis in LMS cell lines was determined with an
Annexin V-PE detection kit, used according to the manufacturer's instructions (Affymetrix
eBioscience, San Diego, USA). Briefly, SKLMS1 and STS39 cells were treated with BEZ235
(500nM) and/or Dox (500nM) for72h, cells were then harvested and stained with Annexin V-PE
and 7-Aminoactinomycin D (7-AAD) Viability Staining Solution. Analysis was performed on a
LSR II flow cytometer (BD). Relative numbers of Annexin V–positive and 7-AAD-positive or
negative cells were obtained for each cell line and analyzed using FlowJo vX.
2
ADDITIONAL FILE LEGENDS:
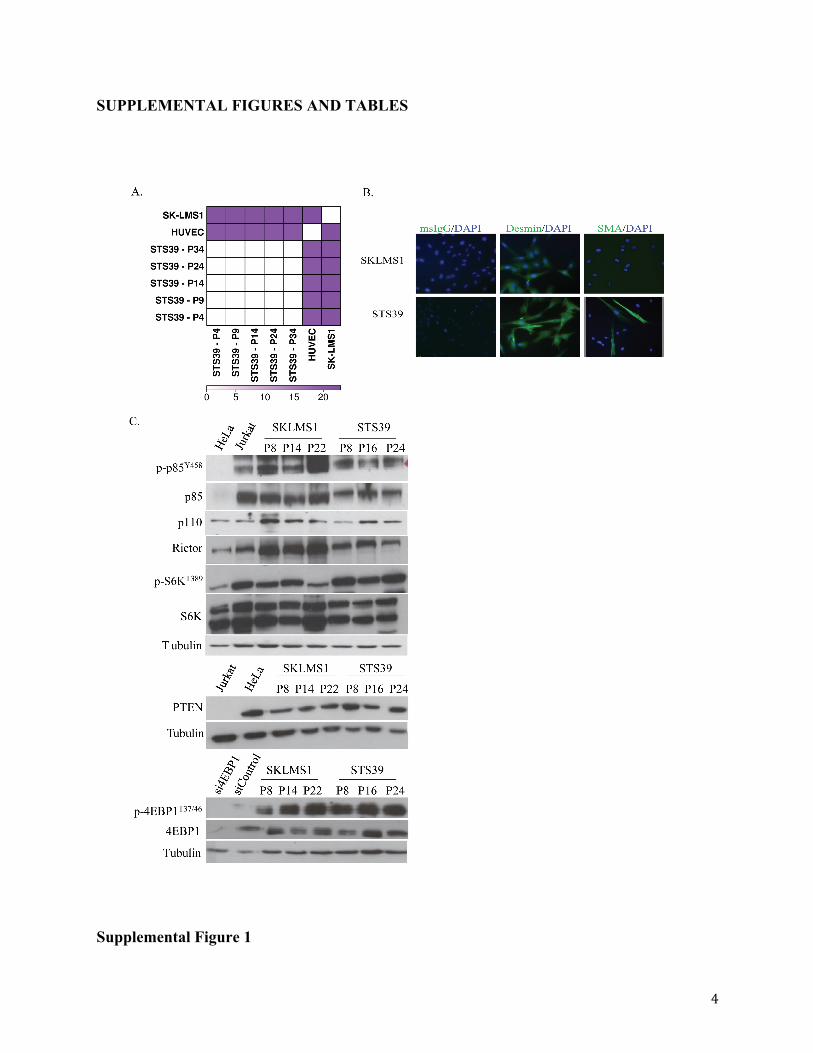
Additional file 1: Figure S1. Characterisation of LMS cell lines: A. Heat map of copy number
variations between STS39 tumor, STS39 cell lines passages 4, 9, 14, 24, 34, SKLMS1 and
HUVEC (Human umbilical vein endothelial cells) as a control, showing genomic stability of cell
lines over time. The scale represents the percentage of genetic differences, where white
represents minimal to no genetic change and dark purple represents maximum genetic change.
For example, the genetic difference between HUVEC and STS39 is 23%. B.
Immunocytochemistry of both cell lines using DAPI, Desmin, Smooth Muscle Actin (SMA) and
mouse IgG (msIgG) as an isotype control. SKLMS1 demonstrates focally positive SMA staining,
while STS39 shows focal positivity for Desmin and SMA (n=3). C. Immunoblot analysis
showing protein stability of PI3K pathway proteins with serial passaging of STS39 and SKLMS1
cells. Increased phosphorylation of p85, a subunit of the PI3K receptor, was seen in SKLMS1
cells. In addition, elevated levels of RICTOR, a binding partner of mTOR, were observed. Both
of these modifications can potentially lead to increased pathway activation. HeLa and Jurkat cell
lines were used as controls for protein expression. siRNA against 4EBP1 was used to create a
negative control for 4EBP1 and p-4EBP1 antibodies.
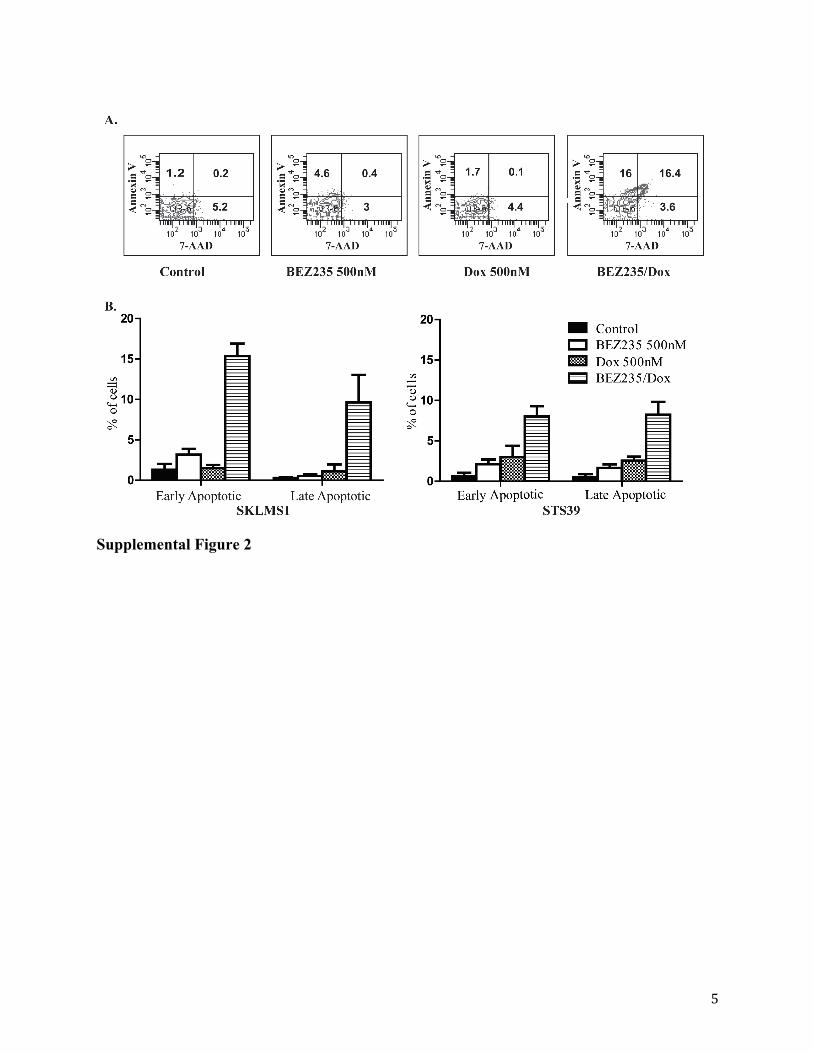
Figure S2. Treatment with BEZ235 and/or Dox induces cell death via apoptosis.
A. Cells were treated with BEZ235 (500nM), Dox (500nM) and BEZ/Dox for 72h and then
analysed for apoptosis by flow cytometry for Annexin V and 7-ADD staining. Combination of
BEZ235 and Dox significantly induced apoptosis in SKLMS1 and STS-39 cells (data not
shown). B. Quantification of apoptotic cells at 72h post-treatment of SKLMS1 cells (n=3) and
STS39 cells (n=3).
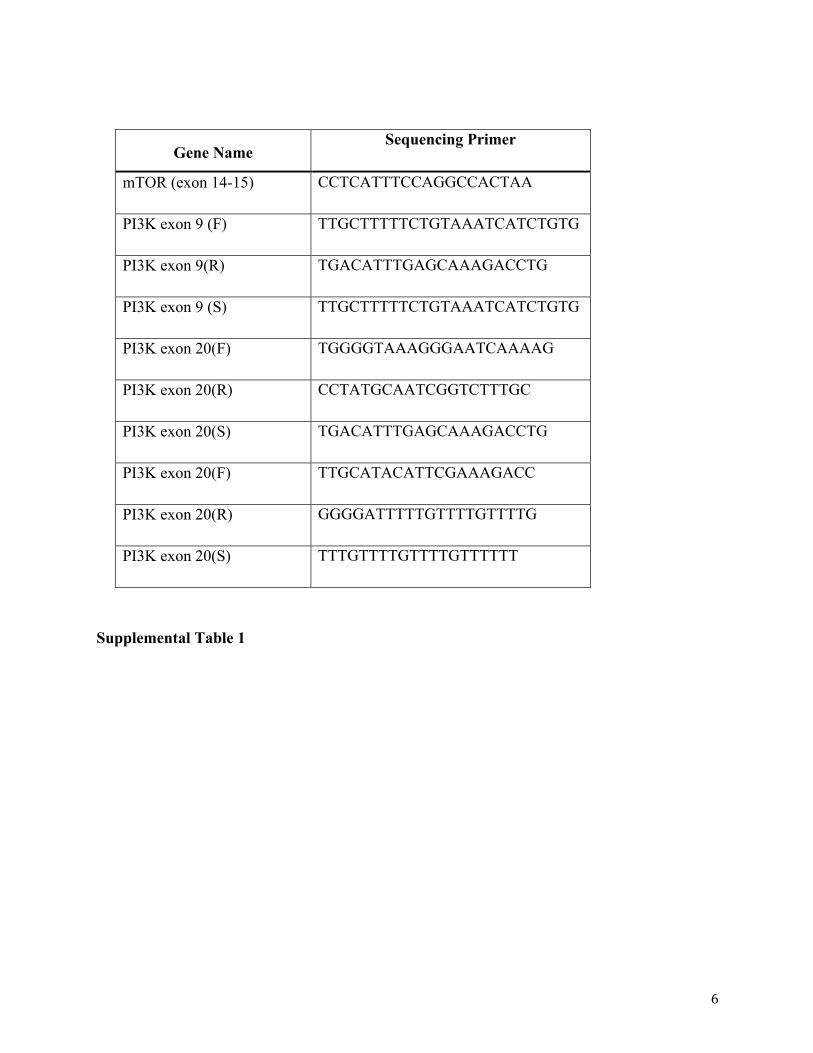
Table S1. Sequencing primers (5ʹ′-3ʹ′) used to determine the presence of mutations in mTOR and
in exon 9 and 20 of the kinase domain of PI3K.
Table S2. Combination Index (CI) tables with BEZ235, BKM120 and/or Dox at 3 dosing
schedules. Viability was determined using an ATPlite assay and analysed using CalcuSyn

3
software. Treatment with BEZ235 (15-240nM) and Dox (125-2000nM) showed synergy in all 3
schedules (CI<0.9), while the combination of BKM120 and Dox was not synergistic (n=3).
4
SUPPLEMENTAL FIGURES AND TABLES
Supplemental Figure 1
5
Supplemental Figure 2
6
Gene Name Sequencing Primer
mTOR (exon 14-15) CCTCATTTCCAGGCCACTAA
PI3K exon 9 (F) TTGCTTTTTCTGTAAATCATCTGTG
PI3K exon 9(R) TGACATTTGAGCAAAGACCTG
PI3K exon 9 (S) TTGCTTTTTCTGTAAATCATCTGTG
PI3K exon 20(F) TGGGGTAAAGGGAATCAAAAG
PI3K exon 20(R) CCTATGCAATCGGTCTTTGC
PI3K exon 20(S) TGACATTTGAGCAAAGACCTG
PI3K exon 20(F) TTGCATACATTCGAAAGACC
PI3K exon 20(R) GGGGATTTTTGTTTTGTTTTG
PI3K exon 20(S) TTTGTTTTGTTTTGTTTTTT
Supplemental Table 1

7
SKLMS1 drug dose CI For experimental values CI For experimental values
Dox(nm) Bez(nm) Dox/Bez
72h Bez 72h/Dox
48h Dox 72h/BEZ
48h Dox/BKM
72h BKM 72h/Dox
48h Dox 72h/BKM
48h 125 15 0.871 0.977 0.676 1.046 1.122 1.971 250 30 0.601 0.594 0.632 1.192 0.987 1.258 500 60 0.62 0.436 0.424 0.869 0.837 1.051 1000 120 0.399 0.235 0.428 0.8 0.983 1.237 2000 240 0.835 0.591 1.041 0.817 1.116 1.325
STS39 drug dose CI For experimental values CI For experimental values
Dox(nm) Bez(nm) Dox/Bez
72h Bez 72h/Dox
48h Dox 72h/BEZ
48h Dox/BKM
72h BKM 72h/Dox
48h Dox 72h/BKM
48h 125 15 0.598 0.997 0.789 1.155 0.982 0.807 250 30 0.563 0.885 0.635 2.642 1.068 1.11 500 60 0.62 0.688 0.643 1.418 0.902 1.002 1000 120 0.68 0.838 0.839 1.504 0.997 1.127 2000 240 0.376 1.123 0.537 1.046 0.872 1.13
Supplemental Table 2