Embed Size (px)
Citation preview
Supplementary appendixThis appendix formed part of the original submission and has been peer reviewed. We post it as supplied by the authors.
Supplement to: Anderson DJ, Chen LF, Weber DJ, et al. Enhanced terminal room disinfection and acquisition and infection caused by multidrug-resistant organisms and Clostridium difficile (the Benefits of Enhanced Terminal Room Disinfection study): a cluster-randomised, multicentre, crossover study. Lancet 2017; published online Jan 16. http://dx.doi.org/10.1016/S0140-6736(16)31588-4.
Web Extra Material for the Benefits of Enhanced Terminal Room (BETR) Disinfection Study 1
Supplement to the Methods 2
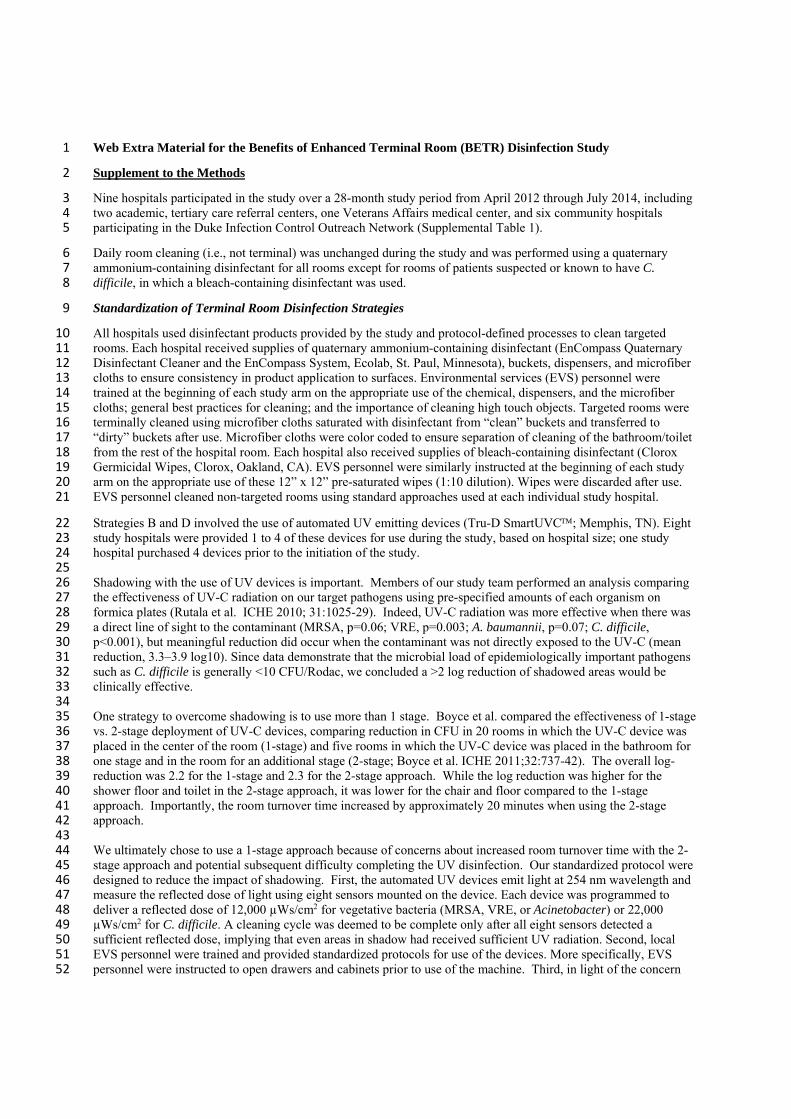
Nine hospitals participated in the study over a 28-month study period from April 2012 through July 2014, including 3 two academic, tertiary care referral centers, one Veterans Affairs medical center, and six community hospitals 4 participating in the Duke Infection Control Outreach Network (Supplemental Table 1). 5
Daily room cleaning (i.e., not terminal) was unchanged during the study and was performed using a quaternary 6 ammonium-containing disinfectant for all rooms except for rooms of patients suspected or known to have C. 7 difficile, in which a bleach-containing disinfectant was used. 8
Standardization of Terminal Room Disinfection Strategies 9
All hospitals used disinfectant products provided by the study and protocol-defined processes to clean targeted 10 rooms. Each hospital received supplies of quaternary ammonium-containing disinfectant (EnCompass Quaternary 11 Disinfectant Cleaner and the EnCompass System, Ecolab, St. Paul, Minnesota), buckets, dispensers, and microfiber 12 cloths to ensure consistency in product application to surfaces. Environmental services (EVS) personnel were 13 trained at the beginning of each study arm on the appropriate use of the chemical, dispensers, and the microfiber 14 cloths; general best practices for cleaning; and the importance of cleaning high touch objects. Targeted rooms were 15 terminally cleaned using microfiber cloths saturated with disinfectant from “clean” buckets and transferred to 16 “dirty” buckets after use. Microfiber cloths were color coded to ensure separation of cleaning of the bathroom/toilet 17 from the rest of the hospital room. Each hospital also received supplies of bleach-containing disinfectant (Clorox 18 Germicidal Wipes, Clorox, Oakland, CA). EVS personnel were similarly instructed at the beginning of each study 19 arm on the appropriate use of these 12” x 12” pre-saturated wipes (1:10 dilution). Wipes were discarded after use. 20 EVS personnel cleaned non-targeted rooms using standard approaches used at each individual study hospital. 21
Strategies B and D involved the use of automated UV emitting devices (Tru-D SmartUVC; Memphis, TN). Eight 22 study hospitals were provided 1 to 4 of these devices for use during the study, based on hospital size; one study 23 hospital purchased 4 devices prior to the initiation of the study. 24 25 Shadowing with the use of UV devices is important. Members of our study team performed an analysis comparing 26 the effectiveness of UV-C radiation on our target pathogens using pre-specified amounts of each organism on 27 formica plates (Rutala et al. ICHE 2010; 31:1025-29). Indeed, UV-C radiation was more effective when there was 28 a direct line of sight to the contaminant (MRSA, p=0.06; VRE, p=0.003; A. baumannii, p=0.07; C. difficile, 29 p<0.001), but meaningful reduction did occur when the contaminant was not directly exposed to the UV-C (mean 30 reduction, 3.3–3.9 log10). Since data demonstrate that the microbial load of epidemiologically important pathogens 31 such as C. difficile is generally <10 CFU/Rodac, we concluded a >2 log reduction of shadowed areas would be 32 clinically effective. 33 34 One strategy to overcome shadowing is to use more than 1 stage. Boyce et al. compared the effectiveness of 1-stage 35 vs. 2-stage deployment of UV-C devices, comparing reduction in CFU in 20 rooms in which the UV-C device was 36 placed in the center of the room (1-stage) and five rooms in which the UV-C device was placed in the bathroom for 37 one stage and in the room for an additional stage (2-stage; Boyce et al. ICHE 2011;32:737-42). The overall log-38 reduction was 2.2 for the 1-stage and 2.3 for the 2-stage approach. While the log reduction was higher for the 39 shower floor and toilet in the 2-stage approach, it was lower for the chair and floor compared to the 1-stage 40 approach. Importantly, the room turnover time increased by approximately 20 minutes when using the 2-stage 41 approach. 42 43 We ultimately chose to use a 1-stage approach because of concerns about increased room turnover time with the 2-44 stage approach and potential subsequent difficulty completing the UV disinfection. Our standardized protocol were 45 designed to reduce the impact of shadowing. First, the automated UV devices emit light at 254 nm wavelength and 46 measure the reflected dose of light using eight sensors mounted on the device. Each device was programmed to 47 deliver a reflected dose of 12,000 µWs/cm2 for vegetative bacteria (MRSA, VRE, or Acinetobacter) or 22,000 48 µWs/cm2 for C. difficile. A cleaning cycle was deemed to be complete only after all eight sensors detected a 49 sufficient reflected dose, implying that even areas in shadow had received sufficient UV radiation. Second, local 50 EVS personnel were trained and provided standardized protocols for use of the devices. More specifically, EVS 51 personnel were instructed to open drawers and cabinets prior to use of the machine. Third, in light of the concern 52
regarding shadowing in the bathroom described above, EVS personnel were also instructed to place the UV device 53 approximately in the center of the targeted room while ensuring that light from at least 3 bulbs was emitted into the 54 room’s bathroom. If this requirement could not be achieved with the machine close to the center of the room, the 55 UV device was preferentially placed in front of the bathroom door to ensure UV radiation in the bathroom. 56 57 Protocol Implementation 58
The study team visited each participating hospital prior to the beginning of each study arm to explain strategies for 59 protocol implementation. Local personnel typically included hospital administration, bed control, infection 60 preventionists, nursing staff, and EVS directors and supervisors. Each hospital developed local protocols and 61 systems for 1) identification of eligible rooms, 2) use of the appropriate disinfectant chemicals, and 3) deployment 62 of the UV device. As an example, hospitals used a redundant system for identification of eligible targeted rooms that 63 included use of door signs, rounding by infection preventionists, bed control notification, and environmental rounds 64 to identify and communicate eligible rooms. As part of this process, each hospital identified an EVS champion for 65 the execution of the study. All hospitals ultimately used the same strategy for deployment and use of the UV 66 devices. EVS supervisor(s) were assigned this responsibility each shift. Study hospitals used different strategies for 67 delivery of the appropriate disinfectant chemicals, including providing study disinfectants to all housekeepers, 68 identifying housekeepers to clean study rooms, and/or direct assignment of a housekeeper and receipt of the 69 appropriate disinfectant immediately prior to terminal clean for each individual targeted room. 70
The study team held regular “collaborative” calls with EVS champions, EVS supervisors, and infection 71 preventionists at each study hospitals. These calls were used to provide study updates, feedback on protocol 72 compliance, and were used to discuss problems that occurred at study hospitals and collectively devise strategies to 73 overcome these problems. These collaborative calls occurred weekly during the wash-in periods and initial 1 to 2 74 months of each study arm and biweekly thereafter. 75
Protocol Fidelity 76
Each hospital monitored compliance with the study protocols as follows: EVS supervisors randomly sampled five or 77 more study rooms each week using a pH pen to document use of the appropriate disinfectant. Supervisors marked 78 the bedside table with a pH pen following terminal clean to determine if a quaternary ammonium- (pH=7) or bleach- 79 (pH=10) containing disinfectant was used. Supervisors recorded the results of these tests on a standardized form to 80 send to the study team. Each time a UV device was deployed, EVS supervisors completed a data collection card that 81 recorded the room number, date, start and stop time, type of cycle, if the cycle was completed, and if not, the reason 82 the cycle was aborted. Uses of the UV device were then compared to lists of patients on contact precautions in order 83 to calculate compliance. 84
The study team provided feedback on pH pen compliance and UV device use compliance data to each hospital via 85 weekly emails and during the collaborative calls. If compliance with either compliance measure was low or 86 declining, the study team contacted the local study personnel to develop strategies to improve compliance. 87 Compliance goals were set at ≥90% for each protocol component. 88
ITT vs. PP Populations 89
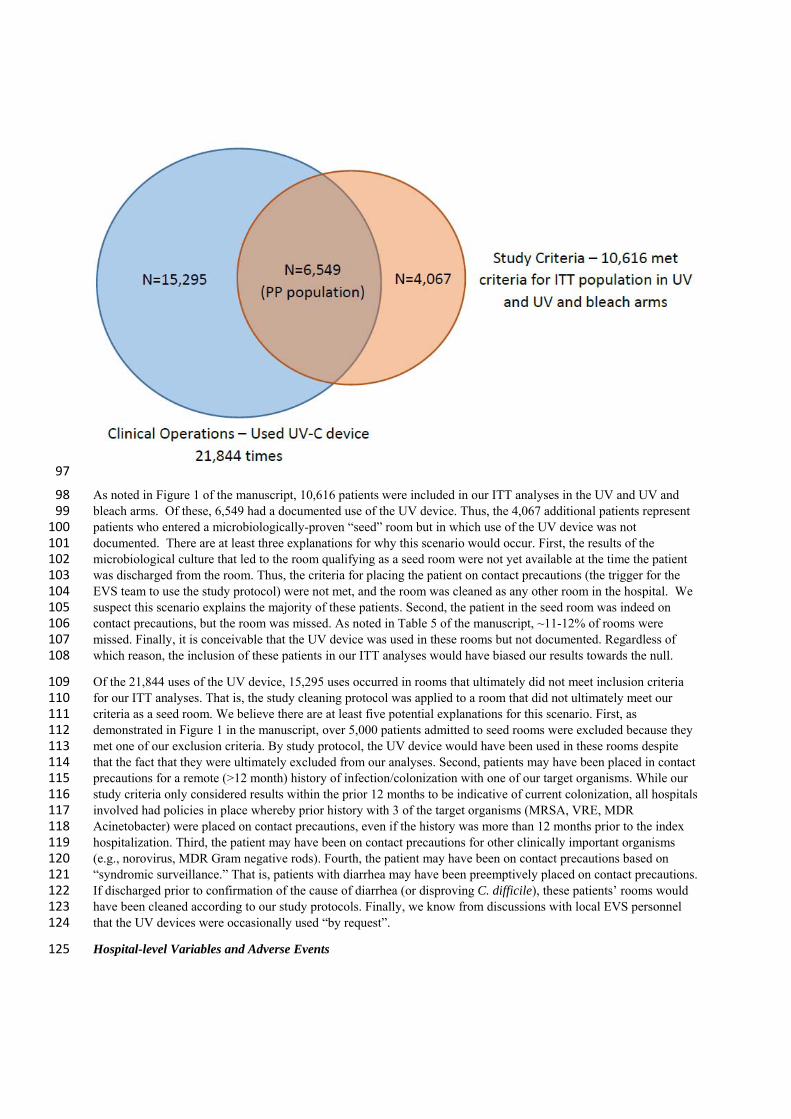
Differences in the number of patients included in the ITT analyses and PP analyses were expected. At its core, the 90 reason for the discrepancy between the two populations was related to our pragmatic approach to implementation 91 (EVS to use if “contact precautions”) vs. our rigorous, microbiologically-based inclusion criteria (documented 92 positive cultures). The clinical operations-approach was constructed to cast a “wide net” in order to capture the 93 majority of patient who would meet study inclusion/exclusion criteria. The specific analyses to identify qualifying 94 patients were not completed until the end of each arm. After comparing the populations captured by the clinical 95 operations-approach and the study inclusion-approach, the following Venn diagram can be constructed: 96
97
As noted in Figure 1 of the manuscript, 10,616 patients were included in our ITT analyses in the UV and UV and 98 bleach arms. Of these, 6,549 had a documented use of the UV device. Thus, the 4,067 additional patients represent 99 patients who entered a microbiologically-proven “seed” room but in which use of the UV device was not 100 documented. There are at least three explanations for why this scenario would occur. First, the results of the 101 microbiological culture that led to the room qualifying as a seed room were not yet available at the time the patient 102 was discharged from the room. Thus, the criteria for placing the patient on contact precautions (the trigger for the 103 EVS team to use the study protocol) were not met, and the room was cleaned as any other room in the hospital. We 104 suspect this scenario explains the majority of these patients. Second, the patient in the seed room was indeed on 105 contact precautions, but the room was missed. As noted in Table 5 of the manuscript, ~11-12% of rooms were 106 missed. Finally, it is conceivable that the UV device was used in these rooms but not documented. Regardless of 107 which reason, the inclusion of these patients in our ITT analyses would have biased our results towards the null. 108
Of the 21,844 uses of the UV device, 15,295 uses occurred in rooms that ultimately did not meet inclusion criteria 109 for our ITT analyses. That is, the study cleaning protocol was applied to a room that did not ultimately meet our 110 criteria as a seed room. We believe there are at least five potential explanations for this scenario. First, as 111 demonstrated in Figure 1 in the manuscript, over 5,000 patients admitted to seed rooms were excluded because they 112 met one of our exclusion criteria. By study protocol, the UV device would have been used in these rooms despite 113 that the fact that they were ultimately excluded from our analyses. Second, patients may have been placed in contact 114 precautions for a remote (>12 month) history of infection/colonization with one of our target organisms. While our 115 study criteria only considered results within the prior 12 months to be indicative of current colonization, all hospitals 116 involved had policies in place whereby prior history with 3 of the target organisms (MRSA, VRE, MDR 117 Acinetobacter) were placed on contact precautions, even if the history was more than 12 months prior to the index 118 hospitalization. Third, the patient may have been on contact precautions for other clinically important organisms 119 (e.g., norovirus, MDR Gram negative rods). Fourth, the patient may have been on contact precautions based on 120 “syndromic surveillance.” That is, patients with diarrhea may have been preemptively placed on contact precautions. 121 If discharged prior to confirmation of the cause of diarrhea (or disproving C. difficile), these patients’ rooms would 122 have been cleaned according to our study protocols. Finally, we know from discussions with local EVS personnel 123 that the UV devices were occasionally used “by request”. 124
Hospital-level Variables and Adverse Events 125
Hospital-level variables and adverse events were measured at each study hospital. Local hospital personnel 126 monitored hand hygiene compliance throughout the study. Hospitals were not instructed on specific methods for 127 hand hygiene monitoring, but were asked to maintain the same approach throughout the study. EVS supervisors also 128 objectively monitored room cleaning throughout the study. Hospitals were provided fluorescent markers and 129 electronic handheld devices to enter data for room monitoring (DAZO and EnCompass System, Ecolab, St. Paul, 130 Minnesota). EVS supervisors measured cleaning compliance by marking a minimum of five locations in seed rooms 131 after discharge of the patient but prior to cleaning by the housekeeper. Monitoring was performed in a minimum of 132 five seed rooms each week. Compliance was defined as the number of areas wiped by the housekeeper per number 133 of locations marked by the supervisor per room. Supervisors were instructed to rotate the locations each week. Most 134 hospitals used summary information available through the EnCompass portal for regular data review and 135 presentation at administrative meetings. Colonization pressure was measured as the proportion of patients with a 136 positive culture for one of the target organisms admitted to a study hospital per month. 137
Room turnover time was measured two ways: the time from the room being declared dirty to being declared clean 138 and ready for the next patient (the “total turnover time”) and the time from the initiation of room cleaning to the 139 room being declared clean and ready for the next patient (the “cleaning time”). Patient wait time in the emergency 140 room was measured as the amount of time between the ED physician’s decision to admit the patient and departure 141 from the ED. Several hospitals were not able to provide these data and instead provided the amount of time from 142 arrival to the ED to departure from the ED for admitted patients. Finally, diversion was calculated as the number of 143 hours the study hospital was on any form of diversion during each study arm. Two hospitals had policies whereby 144 they were not allowed to go on diversion and were excluded from this analysis. 145
Microbiological Analysis 146
We performed a microbiological analysis of randomly selected seed rooms at two study hospitals to determine the 147 total and average number of colony forming units (CFU) of the four target organisms that remained in the hospital 148 room following terminal room disinfection (Web Extra Supplemental Materials). We evaluated 10 environmental 149 locations (i.e., bathroom floor, bed rail, chair, overbed table, side counter, shower floor, sink, toilet, linen hamper 150 lid, and medicine cart) in the rooms; each location was sampled repeatedly using 10 replicate organism detection 151 and counting (RODAC) plates (5 aerobic and 5 anaerobic) to enhance microbiological yield and reduce sampling 152 error. Five Rodac plates sample 125 cm2. A total of 92 rooms were sampled, including 21 during the reference arm, 153 28 during the UV arm, 23 during the bleach arm, and 20 during the bleach and UV arm. 154
Supplement to the Results Section 155
Use of UV Devices 156
A UV device was used a total of 21,844 times at study hospitals. A vegetative cycle was used 16,313 (75%) times; a 157 spore cycle was used 3,651 (17%) times. The type of cycle was not documented 1,880 (9%) times. Of 21,431 cycles 158 with documented time, the cycle completed 21,189 times (97%; range per hospital 90·8% to 98·8%). The median 159 cycle time was 33 minutes (IQR 25 to 46). The vegetative cycle took a median of 30 minutes (IQR 24 to 41), and the 160 spore cycle took a median of 55 minutes (IQR 41 to 71). 161
Protocol Compliance and Hospital-level Variables 162
Infection prevention teams at each hospital led hand hygiene observations in study hospitals. A total of 283,777 163 hand hygiene observations were performed during the study (median observations per study hospital=19,001 164 [13,558-34,396]); HCP performed hand hygiene during 258,435 (91%) of the observations. The median hand 165 hygiene compliance per hospital was 89·8% (IQR 83·3 to 94·1). 166
EVS supervisors objectively monitored cleaning compliance in 20,436 rooms during the study (median number of 167 rooms monitored per study hospital=1,691, IQR [575 to 2,623]; 247,850 (92%) of 269,841 specific locations in the 168 monitored rooms were cleaned. The median compliance per room was 93% (IQR 85 to 94·5). Cleaning compliance 169 was highest during the reference period. Hospital-level for each hospital is provided in Supplemental Table 4. 170
Finally, colonization pressure was equivalent between the different study arms; the prevalence of patients admitted 171 to study hospitals with a target organism was generally similar across study arms. 172
Time to Outcomes 173
A total of 390 (92%) outcomes were identified after the exposed patient was discharged from the seed room. The 174 median time from discharge from the seed room to the outcome was 12 days for C. difficile (range 1 to 26), 28.5 175 days for VRE (range 1 to 89.6), and 37 days for MRSA (range 1 to 90). 176
Additional Details regarding Culture Data 177
The source of the cultures and the proportion of cultures representative of infection or colonization for each study 178 period are provided in Supplemental Table 5. 179
Adverse Events 180
A total of 421,759 total room turnover times were analyzed during the study (median=44,309, IQR 33,143 to 181 66,708). The median total turnover time during the study was 85 minutes (IQR 62·6 to 151). The median total room 182 turnover time was approximately 7 minutes higher when the UV device was employed (Table 4). 183
548,494 room cleaning times were analyzed during the study period (median number of documented room cleanings 184 per hospital=44,587, IQR 37,250 to 87,187). The overall median room cleaning time during the study was 38 185 minutes (9 hospitals; IQR 28·1 to 89·4). The median room cleaning time was approximately 4 minutes higher when 186 the UV device was employed in target rooms. 187
Seven hospitals provided data on the total amount of time 129,426 patients spent in the emergency department (ED) 188 prior to transfer to a hospital room. The total wait time in the ED was essentially unchanged across cleaning arms 189 (Table 4). Four hospitals provided data on the amount of time 87,766 patients spent in the ED after the decision to 190 admit was made. Patients spent approximately 10-20 minutes longer in the ED after the decision to admit was made 191 during the three intervention arms. 192
Study hospitals were on diversion a total of 202·3 days during the study. The median number of days on diversion 193 per month for all hospitals was 0·28 (IQR 0 to 1·21). Overall, the median number of days on diversion per hospital 194 during the intervention arms was similar to or lower than the time on diversion per hospital during the reference arm 195 (Table 4). 196
One hospital reported a single UV exposure event during the course of the study. A charge nurse attempted to turn 197 off the UV device while it was being used in a room. She could not find the remote control for the unit, so she 198 entered the room to unplug the machine. She subsequently reported to occupational health with headaches and 199 seeing “sun spots.” She was evaluated and given symptomatic therapy and had no permanent complaints. This 200 event, however, led to the cessation of the use of the UV device in this hospital for approximately 6 weeks while 201 safety concerns were evaluated and additional precautionary steps were developed and implemented. 202
203
204
205

Supplemental Table 1. Hospitals participating in the Benefits of Enhanced Terminal Room (BETR) Disinfection Study
Hospital Location Bed Size Type Alamance Regional Medical Center Burlington, NC 218 Community Chesapeake Regional Medical Center Chesapeake, VA 310 Community Duke Raleigh Hospital Raleigh, NC 148 Community Duke Regional Hospital Durham, NC 202 Community Duke University Hospital Durham, NC 950 Tertiary Durham Veterans Affairs Medical Center Durham, NC 271 Veterans Affairs High Point Regional Health System High Point, NC 335 Community Rex Hospital Raleigh, NC 660 Community University of North Carolina Hospitals Chapel Hill, NC 853 Tertiary
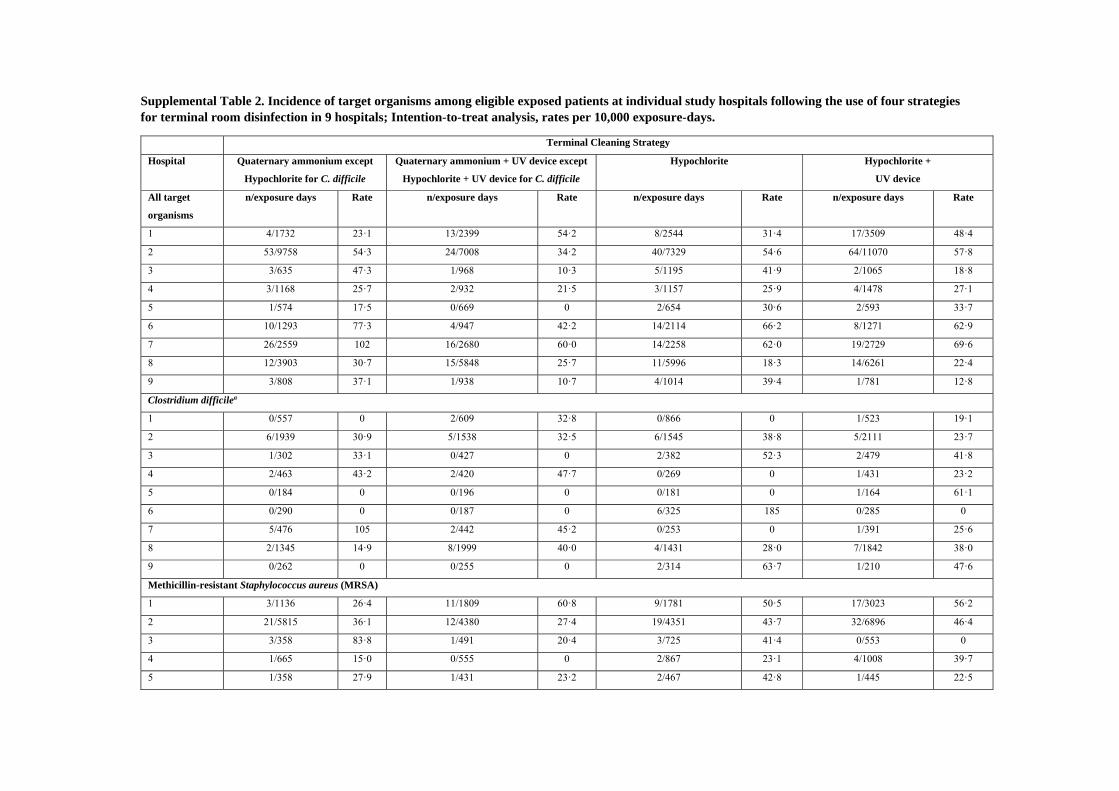
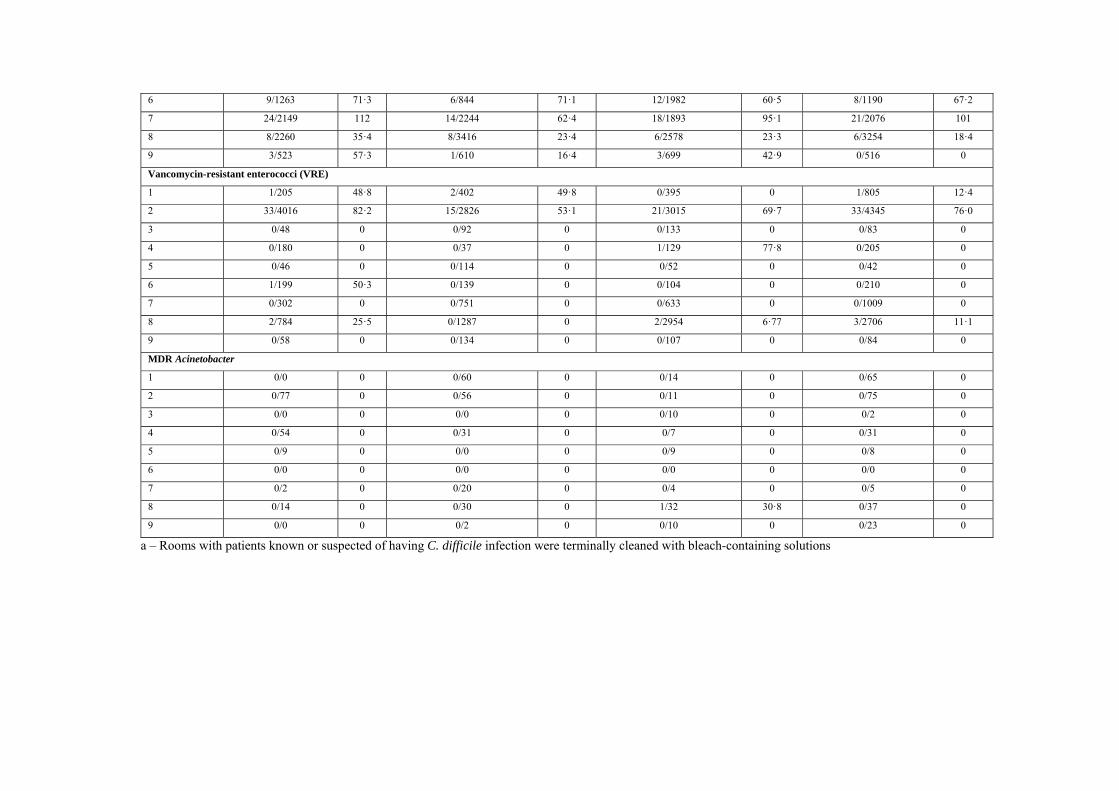
Supplemental Table 2. Incidence of target organisms among eligible exposed patients at individual study hospitals following the use of four strategies for terminal room disinfection in 9 hospitals; Intention-to-treat analysis, rates per 10,000 exposure-days.
Terminal Cleaning Strategy
Hospital Quaternary ammonium except
Hypochlorite for C. difficile
Quaternary ammonium + UV device except
Hypochlorite + UV device for C. difficile
Hypochlorite Hypochlorite +
UV device
All target
organisms
n/exposure days Rate n/exposure days Rate n/exposure days Rate n/exposure days Rate
1 4/1732 23·1 13/2399 54·2 8/2544 31·4 17/3509 48·4
2 53/9758 54·3 24/7008 34·2 40/7329 54·6 64/11070 57·8
3 3/635 47·3 1/968 10·3 5/1195 41·9 2/1065 18·8
4 3/1168 25·7 2/932 21·5 3/1157 25·9 4/1478 27·1
5 1/574 17·5 0/669 0 2/654 30·6 2/593 33·7
6 10/1293 77·3 4/947 42·2 14/2114 66·2 8/1271 62·9
7 26/2559 102 16/2680 60·0 14/2258 62·0 19/2729 69·6
8 12/3903 30·7 15/5848 25·7 11/5996 18·3 14/6261 22·4
9 3/808 37·1 1/938 10·7 4/1014 39·4 1/781 12·8
Clostridium difficilea
1 0/557 0 2/609 32·8 0/866 0 1/523 19·1
2 6/1939 30·9 5/1538 32·5 6/1545 38·8 5/2111 23·7
3 1/302 33·1 0/427 0 2/382 52·3 2/479 41·8
4 2/463 43·2 2/420 47·7 0/269 0 1/431 23·2
5 0/184 0 0/196 0 0/181 0 1/164 61·1
6 0/290 0 0/187 0 6/325 185 0/285 0
7 5/476 105 2/442 45·2 0/253 0 1/391 25·6
8 2/1345 14·9 8/1999 40·0 4/1431 28·0 7/1842 38·0
9 0/262 0 0/255 0 2/314 63·7 1/210 47·6
Methicillin-resistant Staphylococcus aureus (MRSA)
1 3/1136 26·4 11/1809 60·8 9/1781 50·5 17/3023 56·2
2 21/5815 36·1 12/4380 27·4 19/4351 43·7 32/6896 46·4
3 3/358 83·8 1/491 20·4 3/725 41·4 0/553 0
4 1/665 15·0 0/555 0 2/867 23·1 4/1008 39·7
5 1/358 27·9 1/431 23·2 2/467 42·8 1/445 22·5
6 9/1263 71·3 6/844 71·1 12/1982 60·5 8/1190 67·2
7 24/2149 112 14/2244 62·4 18/1893 95·1 21/2076 101
8 8/2260 35·4 8/3416 23·4 6/2578 23·3 6/3254 18·4
9 3/523 57·3 1/610 16·4 3/699 42·9 0/516 0
Vancomycin-resistant enterococci (VRE)
1 1/205 48·8 2/402 49·8 0/395 0 1/805 12·4
2 33/4016 82·2 15/2826 53·1 21/3015 69·7 33/4345 76·0
3 0/48 0 0/92 0 0/133 0 0/83 0
4 0/180 0 0/37 0 1/129 77·8 0/205 0
5 0/46 0 0/114 0 0/52 0 0/42 0
6 1/199 50·3 0/139 0 0/104 0 0/210 0
7 0/302 0 0/751 0 0/633 0 0/1009 0
8 2/784 25·5 0/1287 0 2/2954 6·77 3/2706 11·1
9 0/58 0 0/134 0 0/107 0 0/84 0
MDR Acinetobacter
1 0/0 0 0/60 0 0/14 0 0/65 0
2 0/77 0 0/56 0 0/11 0 0/75 0
3 0/0 0 0/0 0 0/10 0 0/2 0
4 0/54 0 0/31 0 0/7 0 0/31 0
5 0/9 0 0/0 0 0/9 0 0/8 0
6 0/0 0 0/0 0 0/0 0 0/0 0
7 0/2 0 0/20 0 0/4 0 0/5 0
8 0/14 0 0/30 0 1/32 30·8 0/37 0
9 0/0 0 0/2 0 0/10 0 0/23 0
a – Rooms with patients known or suspected of having C. difficile infection were terminally cleaned with bleach-containing solutions
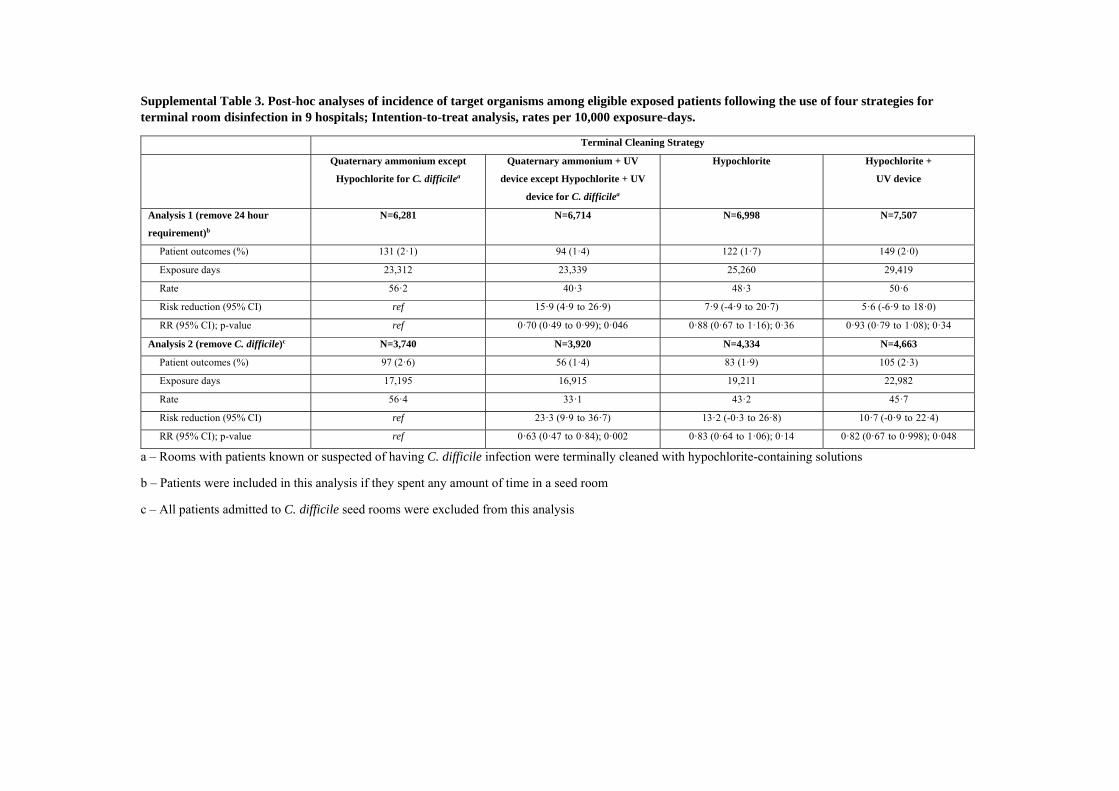
Supplemental Table 3. Post-hoc analyses of incidence of target organisms among eligible exposed patients following the use of four strategies for terminal room disinfection in 9 hospitals; Intention-to-treat analysis, rates per 10,000 exposure-days.
Terminal Cleaning Strategy
Quaternary ammonium except
Hypochlorite for C. difficilea
Quaternary ammonium + UV
device except Hypochlorite + UV
device for C. difficilea
Hypochlorite Hypochlorite +
UV device
Analysis 1 (remove 24 hour
requirement)b
N=6,281 N=6,714 N=6,998 N=7,507
Patient outcomes (%) 131 (2·1) 94 (1·4) 122 (1·7) 149 (2·0)
Exposure days 23,312 23,339 25,260 29,419
Rate 56·2 40·3 48·3 50·6
Risk reduction (95% CI) ref 15·9 (4·9 to 26·9) 7·9 (-4·9 to 20·7) 5·6 (-6·9 to 18·0)
RR (95% CI); p-value ref 0·70 (0·49 to 0·99); 0·046 0·88 (0·67 to 1·16); 0·36 0·93 (0·79 to 1·08); 0·34
Analysis 2 (remove C. difficile)c N=3,740 N=3,920 N=4,334 N=4,663
Patient outcomes (%) 97 (2·6) 56 (1·4) 83 (1·9) 105 (2·3)
Exposure days 17,195 16,915 19,211 22,982
Rate 56·4 33·1 43·2 45·7
Risk reduction (95% CI) ref 23·3 (9·9 to 36·7) 13·2 (-0·3 to 26·8) 10·7 (-0·9 to 22·4)
RR (95% CI); p-value ref 0·63 (0·47 to 0·84); 0·002 0·83 (0·64 to 1·06); 0·14 0·82 (0·67 to 0·998); 0·048
a – Rooms with patients known or suspected of having C. difficile infection were terminally cleaned with hypochlorite-containing solutions
b – Patients were included in this analysis if they spent any amount of time in a seed room
c – All patients admitted to C. difficile seed rooms were excluded from this analysis
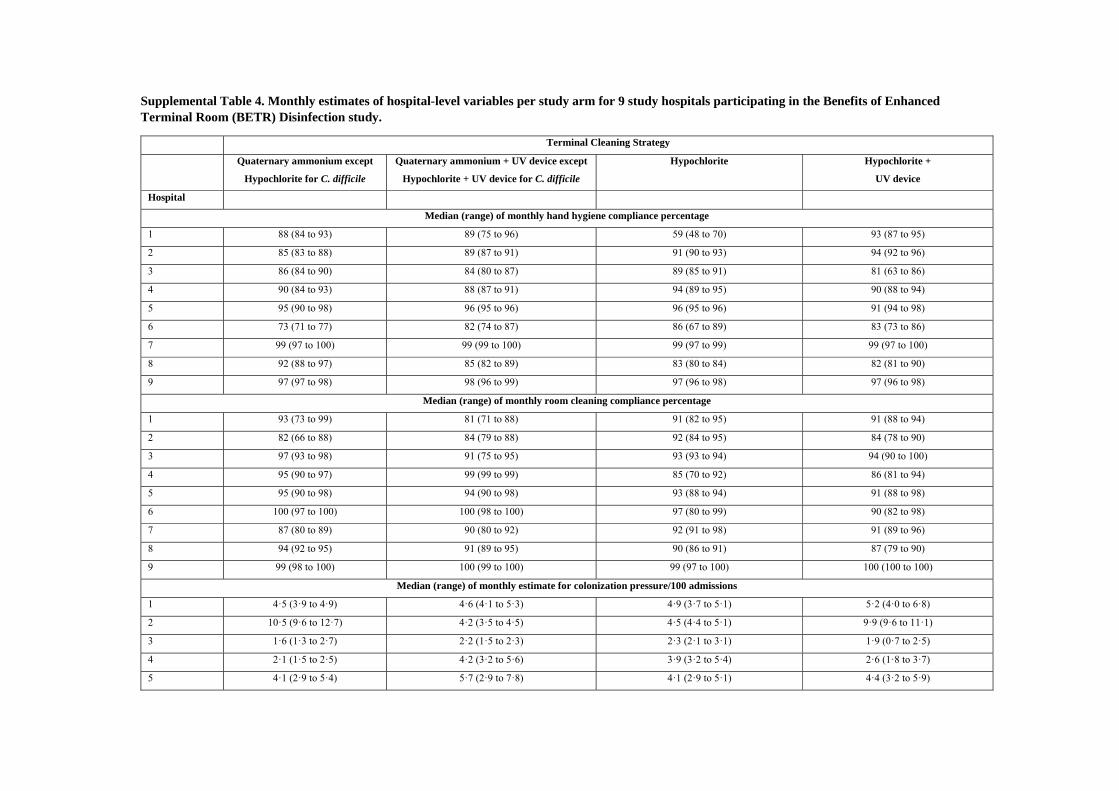
Supplemental Table 4. Monthly estimates of hospital-level variables per study arm for 9 study hospitals participating in the Benefits of Enhanced Terminal Room (BETR) Disinfection study.
Terminal Cleaning Strategy
Quaternary ammonium except
Hypochlorite for C. difficile
Quaternary ammonium + UV device except
Hypochlorite + UV device for C. difficile
Hypochlorite Hypochlorite +
UV device
Hospital
Median (range) of monthly hand hygiene compliance percentage
1 88 (84 to 93) 89 (75 to 96) 59 (48 to 70) 93 (87 to 95)
2 85 (83 to 88) 89 (87 to 91) 91 (90 to 93) 94 (92 to 96)
3 86 (84 to 90) 84 (80 to 87) 89 (85 to 91) 81 (63 to 86)
4 90 (84 to 93) 88 (87 to 91) 94 (89 to 95) 90 (88 to 94)
5 95 (90 to 98) 96 (95 to 96) 96 (95 to 96) 91 (94 to 98)
6 73 (71 to 77) 82 (74 to 87) 86 (67 to 89) 83 (73 to 86)
7 99 (97 to 100) 99 (99 to 100) 99 (97 to 99) 99 (97 to 100)
8 92 (88 to 97) 85 (82 to 89) 83 (80 to 84) 82 (81 to 90)
9 97 (97 to 98) 98 (96 to 99) 97 (96 to 98) 97 (96 to 98)
Median (range) of monthly room cleaning compliance percentage
1 93 (73 to 99) 81 (71 to 88) 91 (82 to 95) 91 (88 to 94)
2 82 (66 to 88) 84 (79 to 88) 92 (84 to 95) 84 (78 to 90)
3 97 (93 to 98) 91 (75 to 95) 93 (93 to 94) 94 (90 to 100)
4 95 (90 to 97) 99 (99 to 99) 85 (70 to 92) 86 (81 to 94)
5 95 (90 to 98) 94 (90 to 98) 93 (88 to 94) 91 (88 to 98)
6 100 (97 to 100) 100 (98 to 100) 97 (80 to 99) 90 (82 to 98)
7 87 (80 to 89) 90 (80 to 92) 92 (91 to 98) 91 (89 to 96)
8 94 (92 to 95) 91 (89 to 95) 90 (86 to 91) 87 (79 to 90)
9 99 (98 to 100) 100 (99 to 100) 99 (97 to 100) 100 (100 to 100)
Median (range) of monthly estimate for colonization pressure/100 admissions
1 4·5 (3·9 to 4·9) 4·6 (4·1 to 5·3) 4·9 (3·7 to 5·1) 5·2 (4·0 to 6·8)
2 10·5 (9·6 to 12·7) 4·2 (3·5 to 4·5) 4·5 (4·4 to 5·1) 9·9 (9·6 to 11·1)
3 1·6 (1·3 to 2·7) 2·2 (1·5 to 2·3) 2·3 (2·1 to 3·1) 1·9 (0·7 to 2·5)
4 2·1 (1·5 to 2·5) 4·2 (3·2 to 5·6) 3·9 (3·2 to 5·4) 2·6 (1·8 to 3·7)
5 4·1 (2·9 to 5·4) 5·7 (2·9 to 7·8) 4·1 (2·9 to 5·1) 4·4 (3·2 to 5·9)
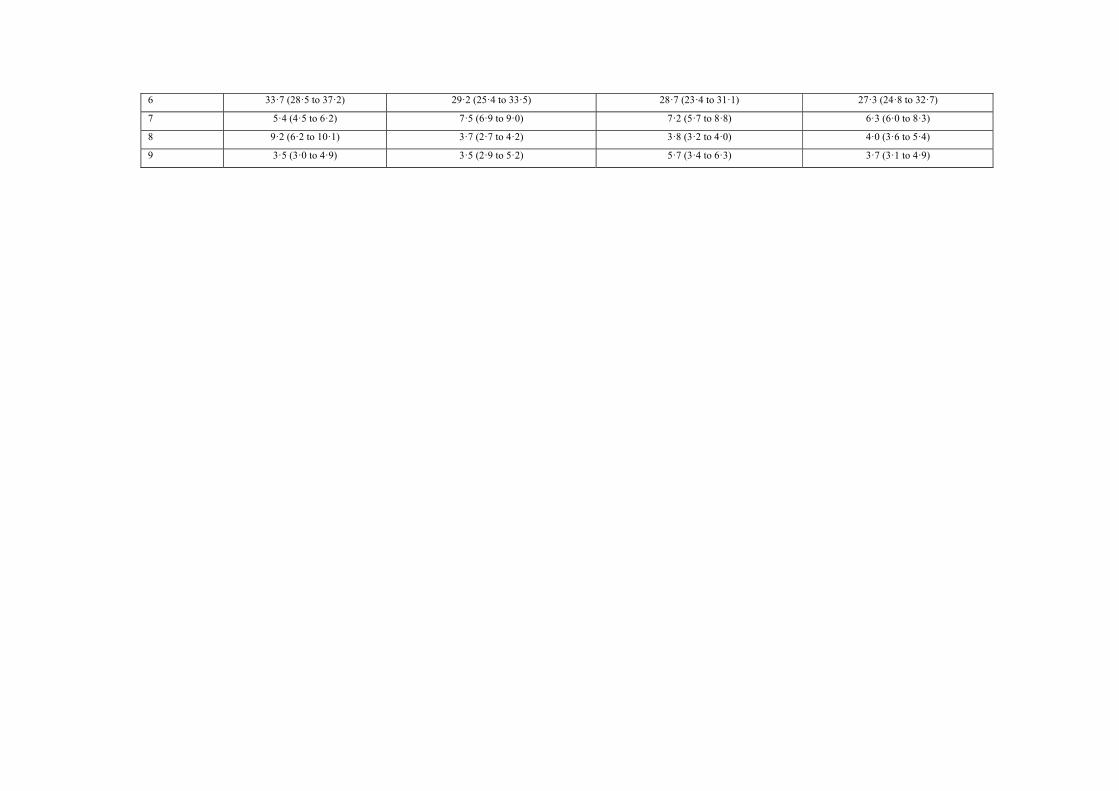
6 33·7 (28·5 to 37·2) 29·2 (25·4 to 33·5) 28·7 (23·4 to 31·1) 27·3 (24·8 to 32·7)
7 5·4 (4·5 to 6·2) 7·5 (6·9 to 9·0) 7·2 (5·7 to 8·8) 6·3 (6·0 to 8·3)
8 9·2 (6·2 to 10·1) 3·7 (2·7 to 4·2) 3·8 (3·2 to 4·0) 4·0 (3·6 to 5·4)
9 3·5 (3·0 to 4·9) 3·5 (2·9 to 5·2) 5·7 (3·4 to 6·3) 3·7 (3·1 to 4·9)
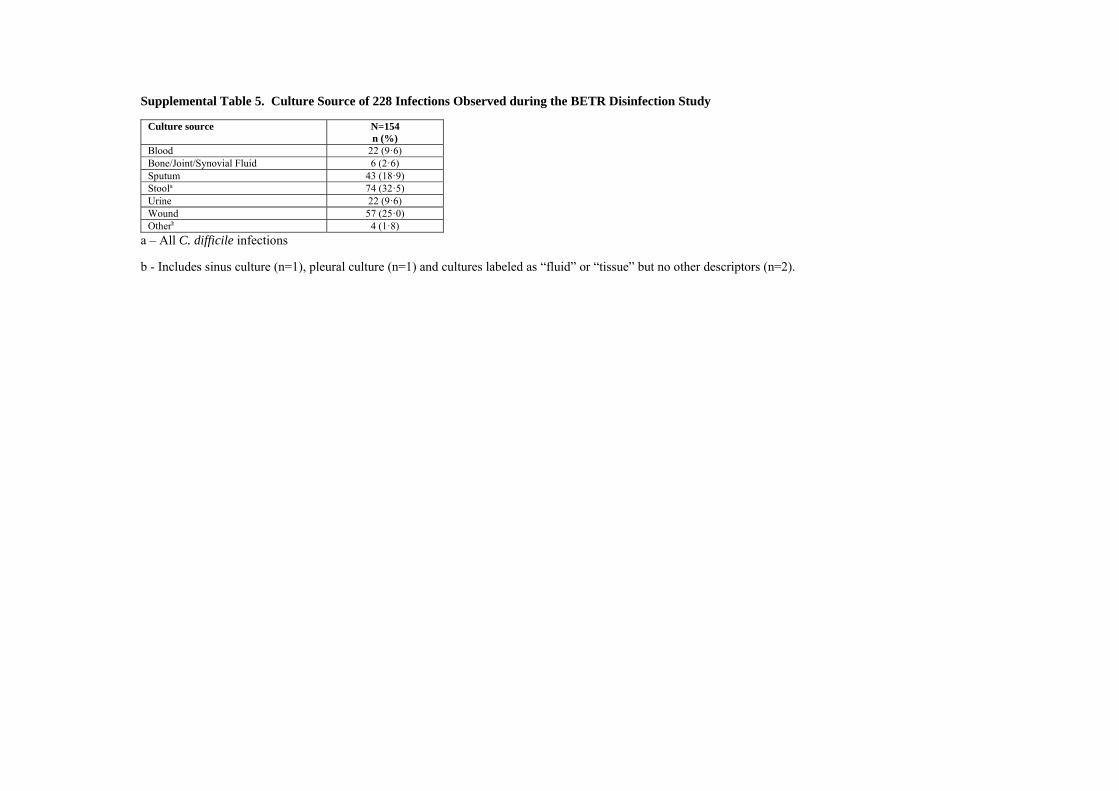
Supplemental Table 5. Culture Source of 228 Infections Observed during the BETR Disinfection Study
Culture source N=154 n (%)
Blood 22 (9·6) Bone/Joint/Synovial Fluid 6 (2·6) Sputum 43 (18·9) Stoola 74 (32·5) Urine 22 (9·6) Wound 57 (25·0) Otherb 4 (1·8)
a – All C. difficile infections
b - Includes sinus culture (n=1), pleural culture (n=1) and cultures labeled as “fluid” or “tissue” but no other descriptors (n=2).
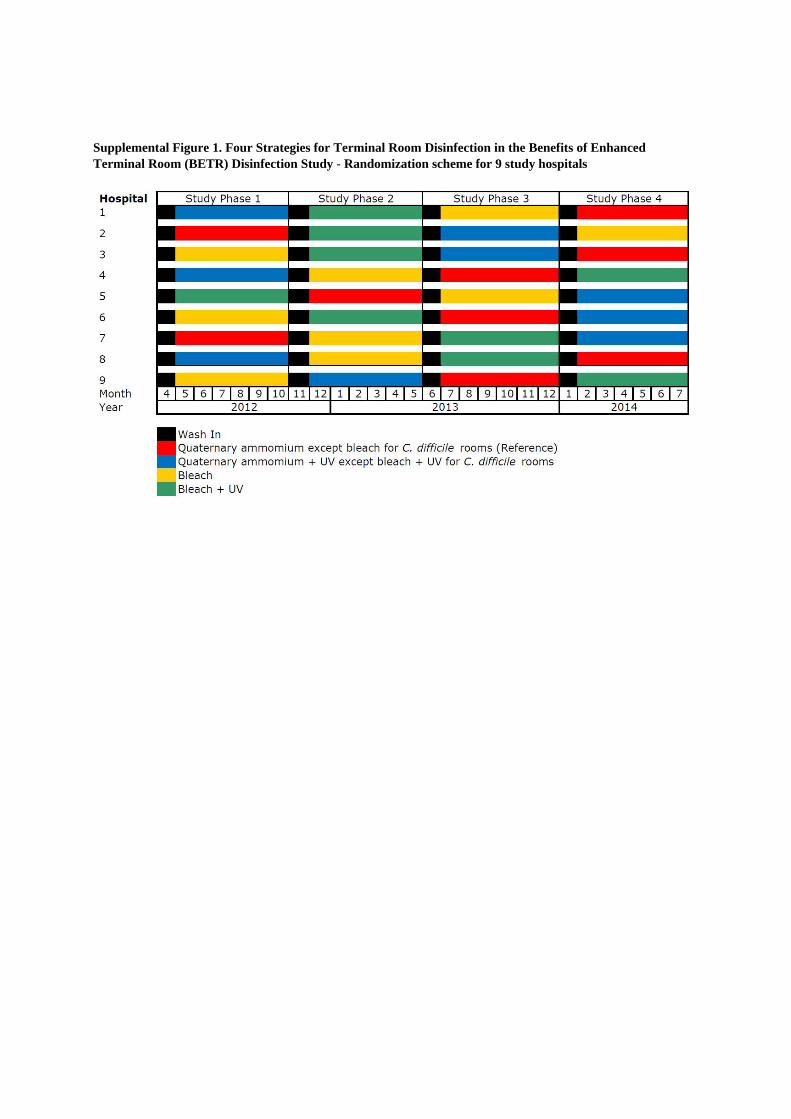
Supplemental Figure 1. Four Strategies for Terminal Room Disinfection in the Benefits of Enhanced Terminal Room (BETR) Disinfection Study - Randomization scheme for 9 study hospitals
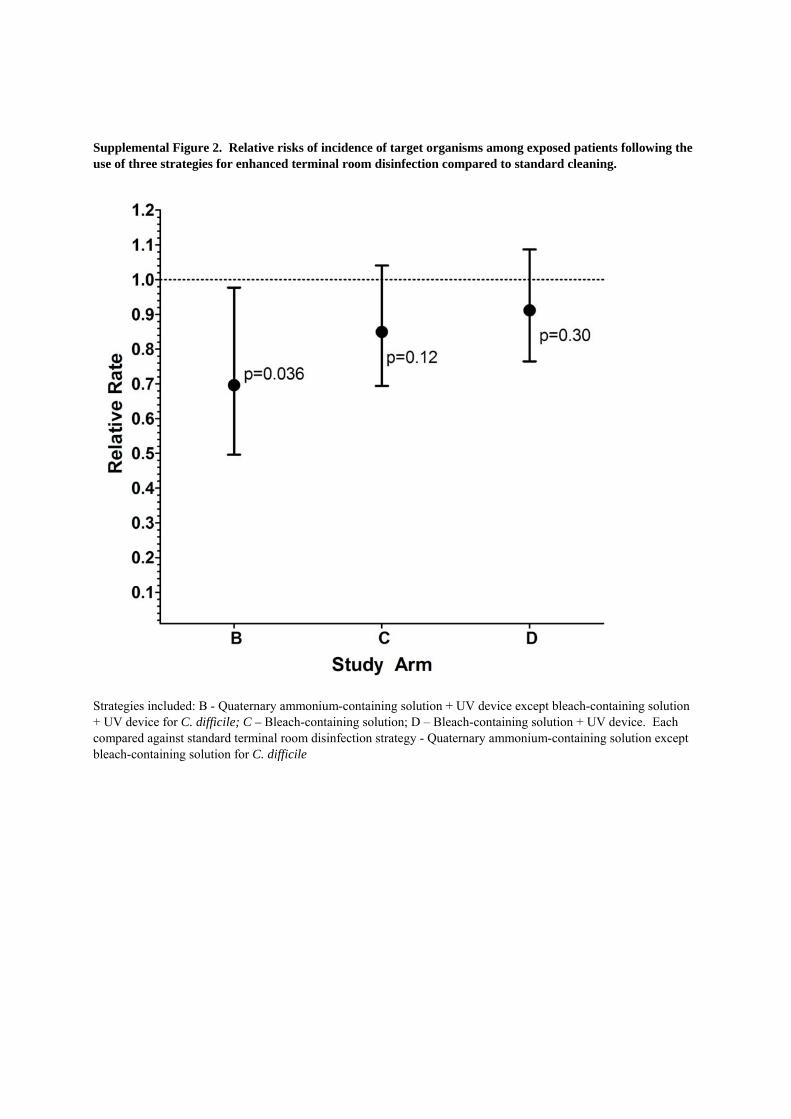
Supplemental Figure 2. Relative risks of incidence of target organisms among exposed patients following the use of three strategies for enhanced terminal room disinfection compared to standard cleaning.
Strategies included: B - Quaternary ammonium-containing solution + UV device except bleach-containing solution + UV device for C. difficile; C – Bleach-containing solution; D – Bleach-containing solution + UV device. Each compared against standard terminal room disinfection strategy - Quaternary ammonium-containing solution except bleach-containing solution for C. difficile
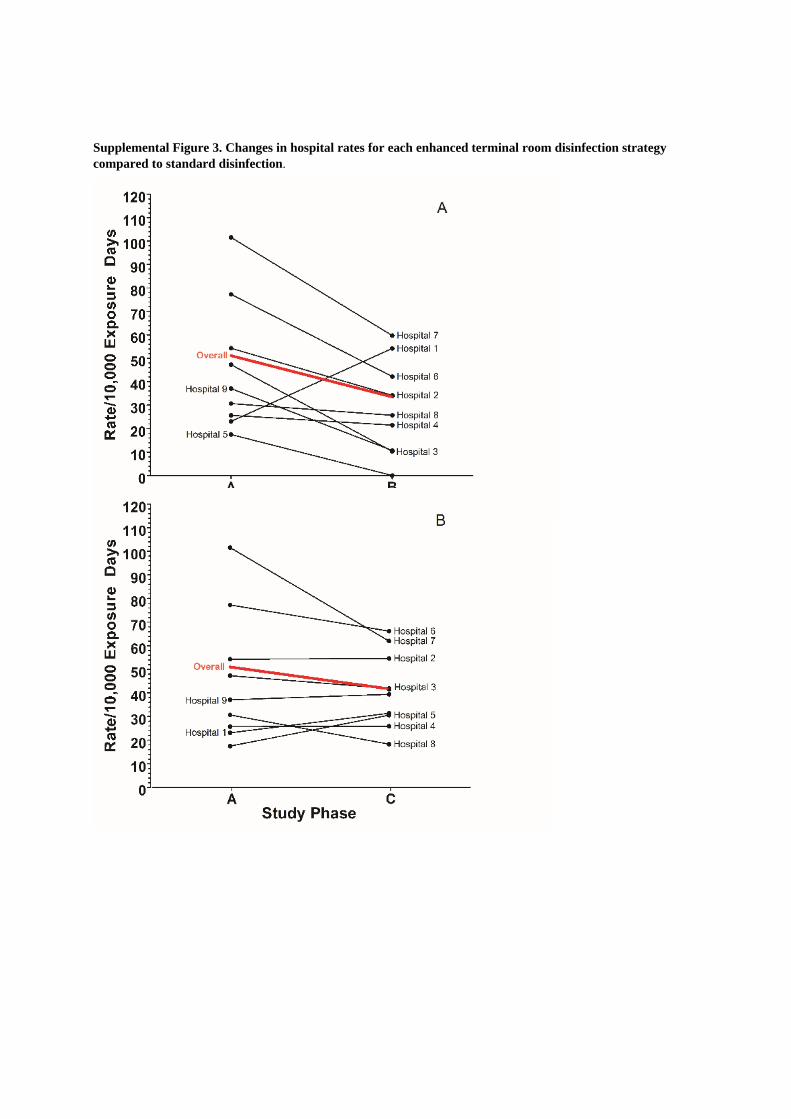
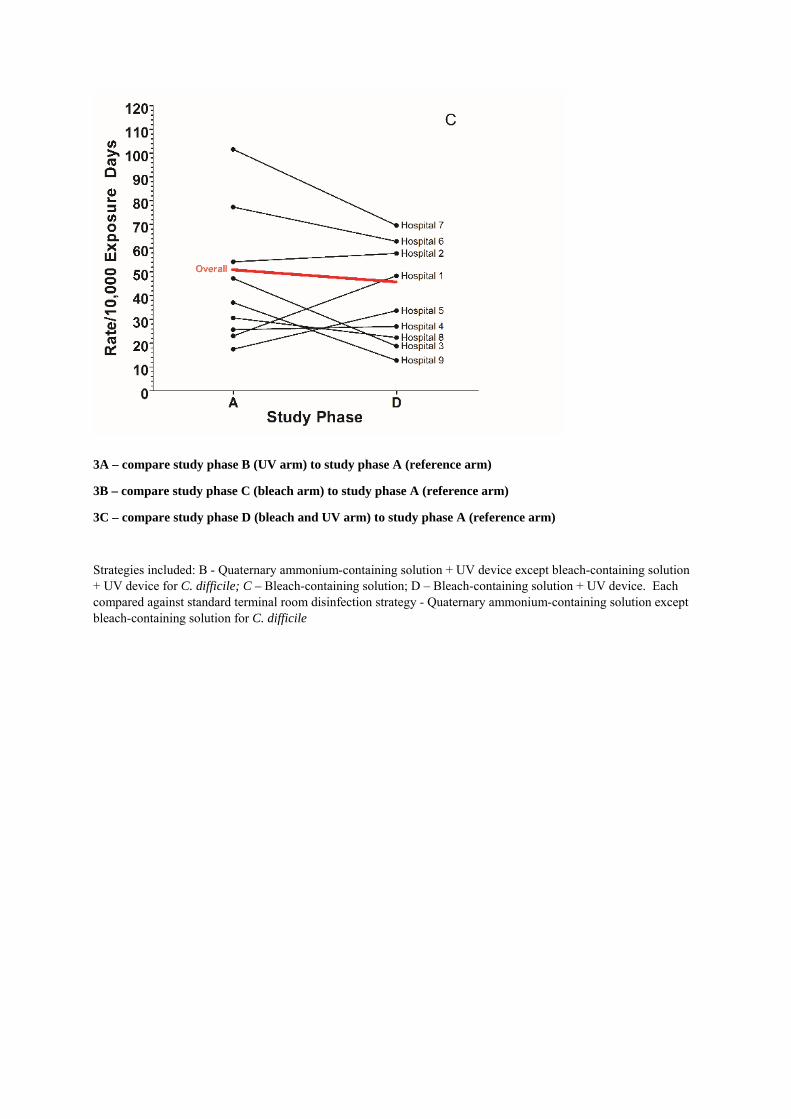
Supplemental Figure 3. Changes in hospital rates for each enhanced terminal room disinfection strategy compared to standard disinfection.
3A – compare study phase B (UV arm) to study phase A (reference arm)
3B – compare study phase C (bleach arm) to study phase A (reference arm)
3C – compare study phase D (bleach and UV arm) to study phase A (reference arm)
Strategies included: B - Quaternary ammonium-containing solution + UV device except bleach-containing solution + UV device for C. difficile; C – Bleach-containing solution; D – Bleach-containing solution + UV device. Each compared against standard terminal room disinfection strategy - Quaternary ammonium-containing solution except bleach-containing solution for C. difficile