Embed Size (px)
Citation preview
Supplementary content - Assessment of a 1H high-resolution magic angle spinning NMR spectroscopy procedure for free sugars quantification in intact plant tissue
Teresa Delgado-Goñi1,2, Sonia Campo3, Juana Martín-Sitjar1,2, Miquel E. Cabañas2,4, Blanca San
Segundo3, Carles Arús1,2,5
1Dept. Bioquímica i Biologia Molecular, Universitat Autònoma de Barcelona, Unitat de Biociències, Edifici C, 08193
Cerdanyola del Vallès, Spain. 2Centro de Investigación Biomédica en Red en Bioingeniería, Biomateriales y
Nanomedicina (CIBER-BBN, Cerdanyola del Vallès, Spain. 3Centre de Recerca en Agrigenòmica (CRAG) CSIC-IRTA-
UAB-UB, Departamento de Genética Molecular, Edifici CRAG, Campus UAB, Bellaterra 08193 Cerdanyola del Vallès,
Spain. 4Servei de RMN, Universitat Autònoma de Barcelona, Edifici C, 08193 Cerdanyola del Vallès, Spain. 5Institut de
Biotecnologia i de Biomedicina, Universitat Autònoma de Barcelona, Edifici C, 08193 Cerdanyola del Vallès, Spain.
Summary of sugar content data
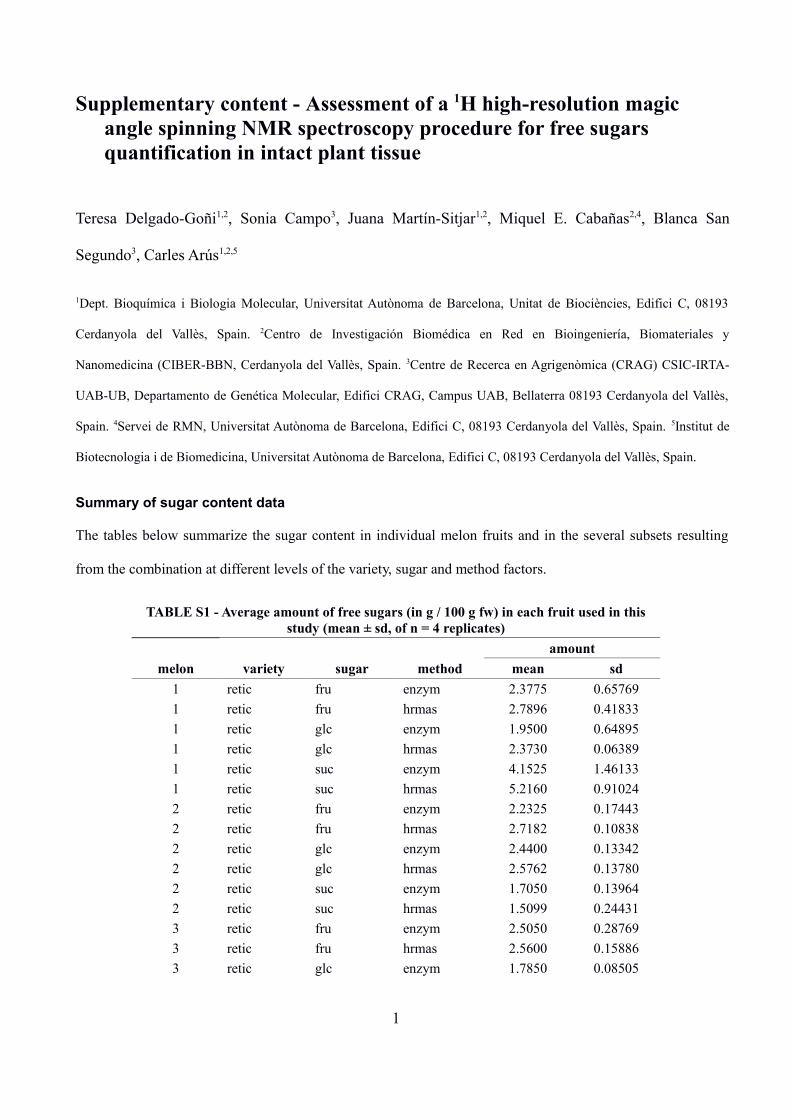
The tables below summarize the sugar content in individual melon fruits and in the several subsets resulting
from the combination at different levels of the variety, sugar and method factors.
TABLE S1 - Average amount of free sugars (in g / 100 g fw) in each fruit used in this study (mean ± sd, of n = 4 replicates)
amount
melon variety sugar method mean sd
1 retic fru enzym 2.3775 0.65769
1 retic fru hrmas 2.7896 0.41833
1 retic glc enzym 1.9500 0.64895
1 retic glc hrmas 2.3730 0.06389
1 retic suc enzym 4.1525 1.46133
1 retic suc hrmas 5.2160 0.91024
2 retic fru enzym 2.2325 0.17443
2 retic fru hrmas 2.7182 0.10838
2 retic glc enzym 2.4400 0.13342
2 retic glc hrmas 2.5762 0.13780
2 retic suc enzym 1.7050 0.13964
2 retic suc hrmas 1.5099 0.24431
3 retic fru enzym 2.5050 0.28769
3 retic fru hrmas 2.5600 0.15886
3 retic glc enzym 1.7850 0.08505
1
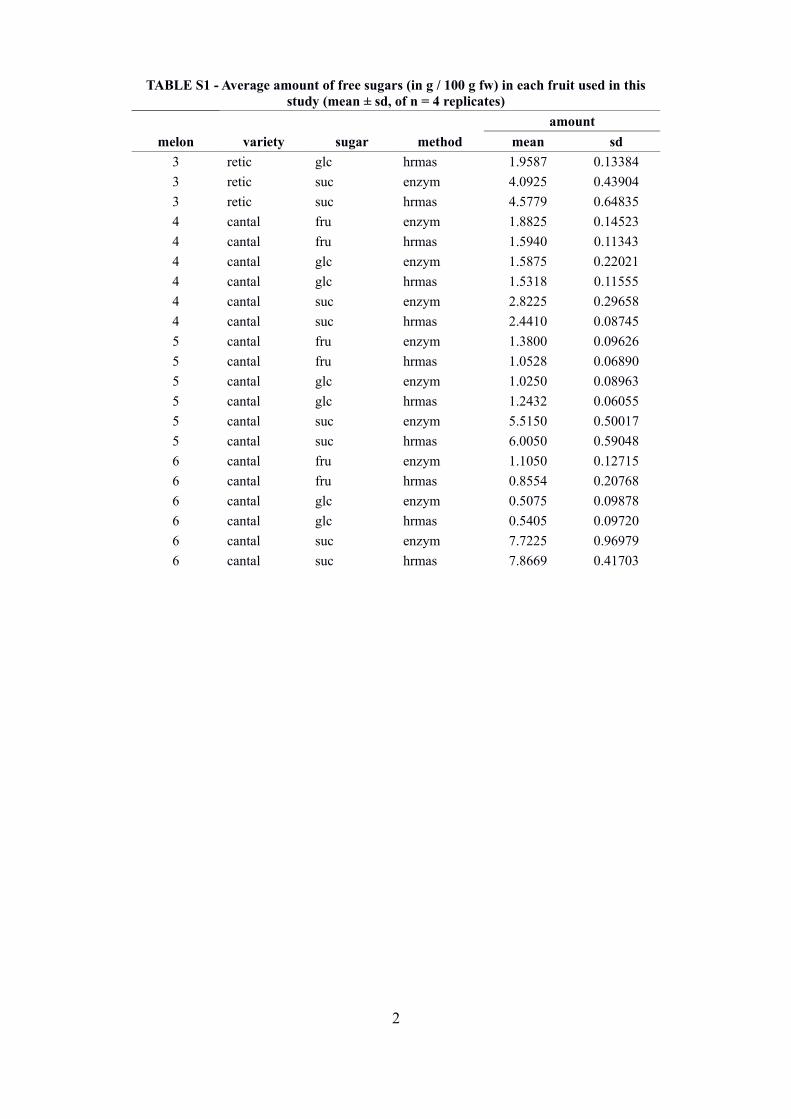
TABLE S1 - Average amount of free sugars (in g / 100 g fw) in each fruit used in this study (mean ± sd, of n = 4 replicates)
amount
melon variety sugar method mean sd
3 retic glc hrmas 1.9587 0.13384
3 retic suc enzym 4.0925 0.43904
3 retic suc hrmas 4.5779 0.64835
4 cantal fru enzym 1.8825 0.14523
4 cantal fru hrmas 1.5940 0.11343
4 cantal glc enzym 1.5875 0.22021
4 cantal glc hrmas 1.5318 0.11555
4 cantal suc enzym 2.8225 0.29658
4 cantal suc hrmas 2.4410 0.08745
5 cantal fru enzym 1.3800 0.09626
5 cantal fru hrmas 1.0528 0.06890
5 cantal glc enzym 1.0250 0.08963
5 cantal glc hrmas 1.2432 0.06055
5 cantal suc enzym 5.5150 0.50017
5 cantal suc hrmas 6.0050 0.59048
6 cantal fru enzym 1.1050 0.12715
6 cantal fru hrmas 0.8554 0.20768
6 cantal glc enzym 0.5075 0.09878
6 cantal glc hrmas 0.5405 0.09720
6 cantal suc enzym 7.7225 0.96979
6 cantal suc hrmas 7.8669 0.41703
2
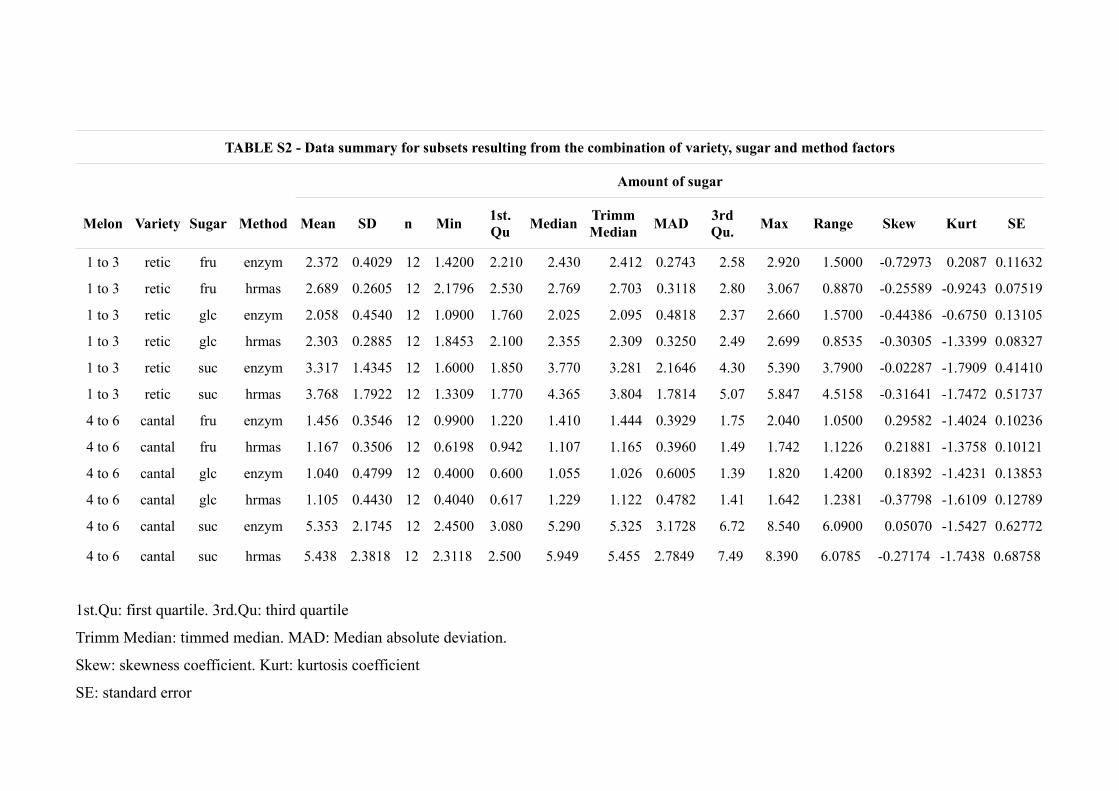
TABLE S2 - Data summary for subsets resulting from the combination of variety, sugar and method factors
Amount of sugar
Melon Variety Sugar Method Mean SD n Min1st. Qu
MedianTrimm Median
MAD3rd Qu.
Max Range Skew Kurt SE
1 to 3 retic fru enzym 2.372 0.4029 12 1.4200 2.210 2.430 2.412 0.2743 2.58 2.920 1.5000 -0.72973 0.2087 0.11632
1 to 3 retic fru hrmas 2.689 0.2605 12 2.1796 2.530 2.769 2.703 0.3118 2.80 3.067 0.8870 -0.25589 -0.9243 0.07519
1 to 3 retic glc enzym 2.058 0.4540 12 1.0900 1.760 2.025 2.095 0.4818 2.37 2.660 1.5700 -0.44386 -0.6750 0.13105
1 to 3 retic glc hrmas 2.303 0.2885 12 1.8453 2.100 2.355 2.309 0.3250 2.49 2.699 0.8535 -0.30305 -1.3399 0.08327
1 to 3 retic suc enzym 3.317 1.4345 12 1.6000 1.850 3.770 3.281 2.1646 4.30 5.390 3.7900 -0.02287 -1.7909 0.41410
1 to 3 retic suc hrmas 3.768 1.7922 12 1.3309 1.770 4.365 3.804 1.7814 5.07 5.847 4.5158 -0.31641 -1.7472 0.51737
4 to 6 cantal fru enzym 1.456 0.3546 12 0.9900 1.220 1.410 1.444 0.3929 1.75 2.040 1.0500 0.29582 -1.4024 0.10236
4 to 6 cantal fru hrmas 1.167 0.3506 12 0.6198 0.942 1.107 1.165 0.3960 1.49 1.742 1.1226 0.21881 -1.3758 0.10121
4 to 6 cantal glc enzym 1.040 0.4799 12 0.4000 0.600 1.055 1.026 0.6005 1.39 1.820 1.4200 0.18392 -1.4231 0.13853
4 to 6 cantal glc hrmas 1.105 0.4430 12 0.4040 0.617 1.229 1.122 0.4782 1.41 1.642 1.2381 -0.37798 -1.6109 0.12789
4 to 6 cantal suc enzym 5.353 2.1745 12 2.4500 3.080 5.290 5.325 3.1728 6.72 8.540 6.0900 0.05070 -1.5427 0.62772
4 to 6 cantal suc hrmas 5.438 2.3818 12 2.3118 2.500 5.949 5.455 2.7849 7.49 8.390 6.0785 -0.27174 -1.7438 0.68758
1st.Qu: first quartile. 3rd.Qu: third quartile
Trimm Median: timmed median. MAD: Median absolute deviation.
Skew: skewness coefficient. Kurt: kurtosis coefficient
SE: standard error
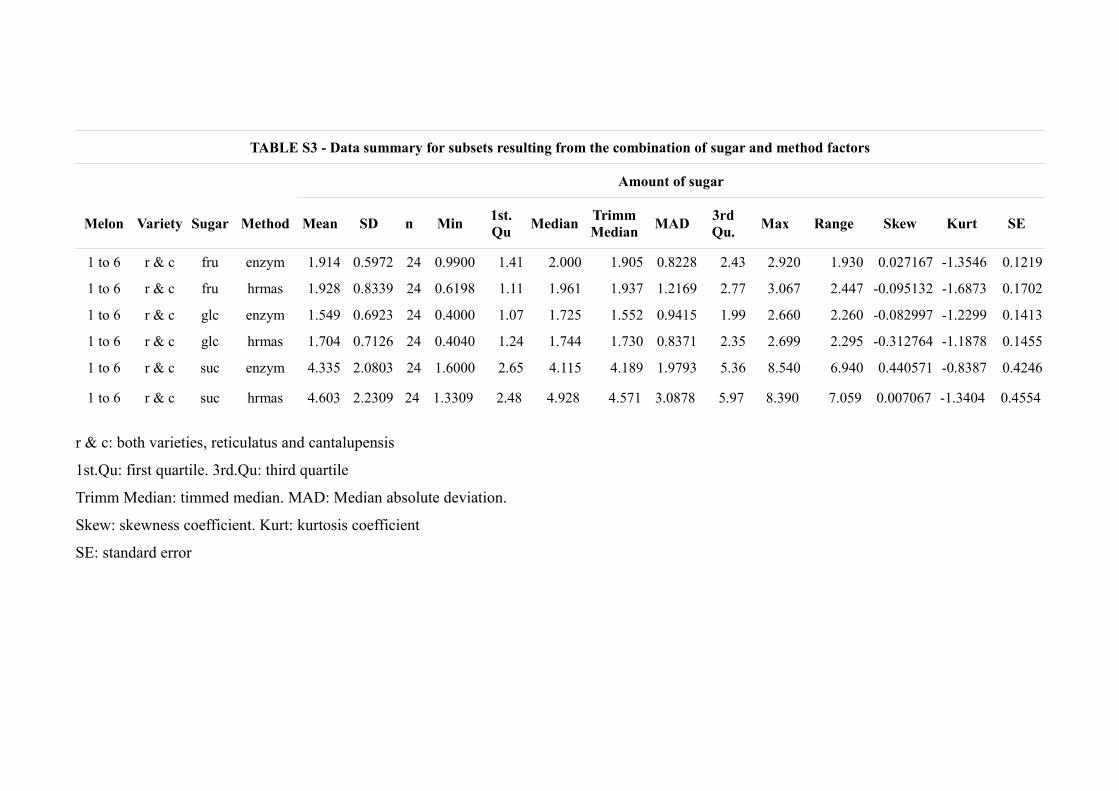
TABLE S3 - Data summary for subsets resulting from the combination of sugar and method factors
Amount of sugar
Melon Variety Sugar Method Mean SD n Min1st. Qu
MedianTrimm Median
MAD3rd Qu.
Max Range Skew Kurt SE
1 to 6 r & c fru enzym 1.914 0.5972 24 0.9900 1.41 2.000 1.905 0.8228 2.43 2.920 1.930 0.027167 -1.3546 0.1219
1 to 6 r & c fru hrmas 1.928 0.8339 24 0.6198 1.11 1.961 1.937 1.2169 2.77 3.067 2.447 -0.095132 -1.6873 0.1702
1 to 6 r & c glc enzym 1.549 0.6923 24 0.4000 1.07 1.725 1.552 0.9415 1.99 2.660 2.260 -0.082997 -1.2299 0.1413
1 to 6 r & c glc hrmas 1.704 0.7126 24 0.4040 1.24 1.744 1.730 0.8371 2.35 2.699 2.295 -0.312764 -1.1878 0.1455
1 to 6 r & c suc enzym 4.335 2.0803 24 1.6000 2.65 4.115 4.189 1.9793 5.36 8.540 6.940 0.440571 -0.8387 0.4246
1 to 6 r & c suc hrmas 4.603 2.2309 24 1.3309 2.48 4.928 4.571 3.0878 5.97 8.390 7.059 0.007067 -1.3404 0.4554
r & c: both varieties, reticulatus and cantalupensis
1st.Qu: first quartile. 3rd.Qu: third quartile
Trimm Median: timmed median. MAD: Median absolute deviation.
Skew: skewness coefficient. Kurt: kurtosis coefficient
SE: standard error
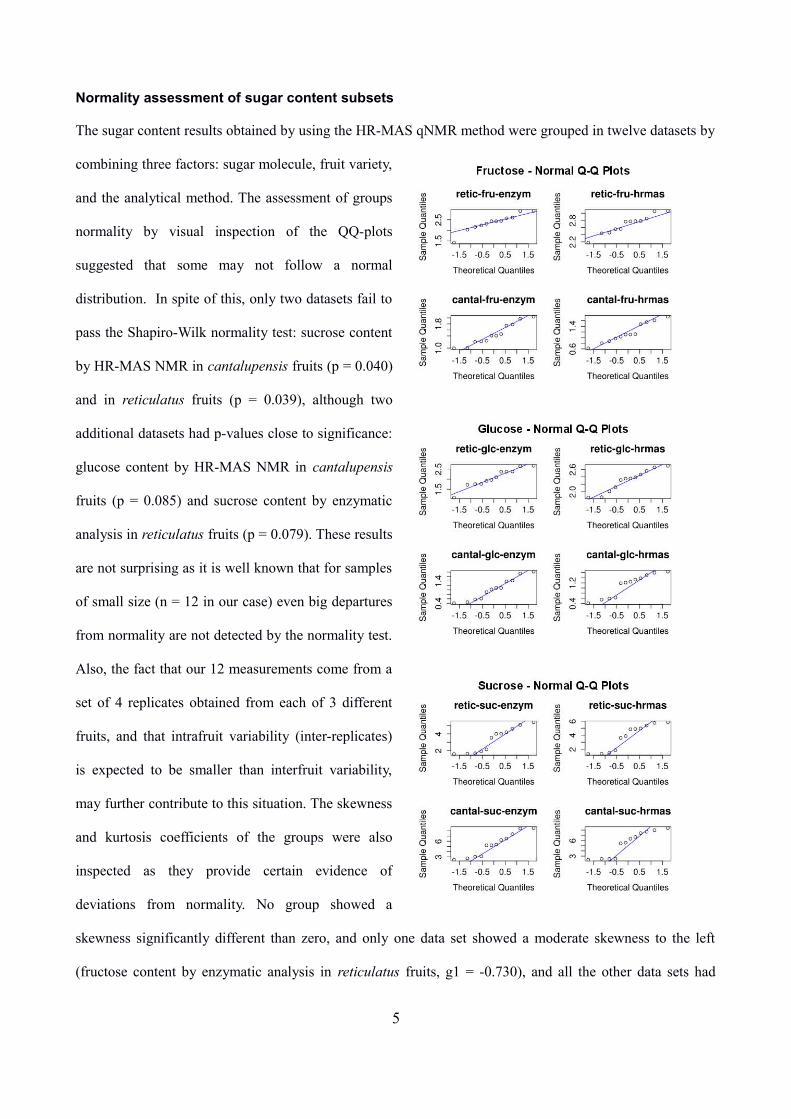
Normality assessment of sugar content subsets
The sugar content results obtained by using the HR-MAS qNMR method were grouped in twelve datasets by
combining three factors: sugar molecule, fruit variety,
and the analytical method. The assessment of groups
normality by visual inspection of the QQ-plots
suggested that some may not follow a normal
distribution. In spite of this, only two datasets fail to
pass the Shapiro-Wilk normality test: sucrose content
by HR-MAS NMR in cantalupensis fruits (p = 0.040)
and in reticulatus fruits (p = 0.039), although two
additional datasets had p-values close to significance:
glucose content by HR-MAS NMR in cantalupensis
fruits (p = 0.085) and sucrose content by enzymatic
analysis in reticulatus fruits (p = 0.079). These results
are not surprising as it is well known that for samples
of small size (n = 12 in our case) even big departures
from normality are not detected by the normality test.
Also, the fact that our 12 measurements come from a
set of 4 replicates obtained from each of 3 different
fruits, and that intrafruit variability (inter-replicates)
is expected to be smaller than interfruit variability,
may further contribute to this situation. The skewness
and kurtosis coefficients of the groups were also
inspected as they provide certain evidence of
deviations from normality. No group showed a
skewness significantly different than zero, and only one data set showed a moderate skewness to the left
(fructose content by enzymatic analysis in reticulatus fruits, g1 = -0.730), and all the other data sets had
5
skewness values in the range [-0.444, 0.296]. Similarly, no group showed a kurtosis significantly different
than zero, but nine data sets were clearly platykurtic with kurtosis coefficients in the range [-1.791, -1.340],
two were moderately platykurtic (g2 = -0.924 and -0.675) and one sample showed a slightly leptokurtic
distribution (g2 = 0.209). Because of these indications of non-normality, non-parametric tests were used to
compare the location and spread of datasets: a Levene's test was used to assess variance homogeneity, and a
Wilcoxon signed rank test of paired data was performed to assess mean ranks differences.
Comparison of datasets obtained by the two analytical methods
The datasets obtained by the two analytical methods were compared by using the non-parametric Levene's
test to assess variance homogeneity, and the non-parametric Wilcoxon signed rank test of paired data to
assess mean ranks differences.
TABLE S4 - Comparison of sugar content measured by HR-MAS NMR and Enzymatic Analysis
Melon Variety Sugar Levene's Test for Homogeneity of Variance (center = median)
Wilcoxon signed rank test
1 to 6 cantal fru F value = 0.01, Pr(>F) = 0.91 V = 75, p-value = 0.002441 *
1 to 6 cantal glc F value = 0.1, Pr(>F) = 0.75 V = 23, p-value = 0.2334
1 to 6 cantal suc F value = 0.22, Pr(>F) = 0.64 V = 32, p-value = 0.6221
1 to 6 retic fru F value = 0.64, Pr(>F) = 0.43 V = 8, p-value = 0.01221
1 to 6 retic glc F value = 2.4, Pr(>F) = 0.14 V = 6, p-value = 0.006836 *
1 to 6 retic suc F value = 0.55, Pr(>F) = 0.47 V = 25, p-value = 0.3013
1 to 6 r & c fru F value = 8.16, Pr(>F) = 0.0064 * V = 148, p-value = 0.9664
1 to 6 r & c glc F value = 0.06, Pr(>F) = 0.81 V = 56, p-value = 0.005898 *
1 to 6 r & c suc F value = 0.23, Pr(>F) = 0.63 V = 111, p-value = 0.2768
r & c: both varieties, reticulatus and cantalupensis* statistically significant differences
All groups involved in the sugar content comparisons passed the Levene's test for homogeneity of variance
across groups at level 0.05 except for fructose in the dataset combining reticulatus and cantalupensis fruits (p
= 0.0064). The comparison of the sugar content determined by the enzymatic and HR-MAS NMR methods
using the Wilcoxon signed rank test of paired data resulted in no statistically significant differences at level
0.05 for sucrose and glucose content in the cantalupensis variety, and sucrose in the reticulatus fruits.
Conversely, the content of fructose in the cantalupensis (V = 75, p = 0.002) and reticulatus fruits (V = 8, p =
6
0.012), and the content of glucose in the reticulatus fruits (V = 6, p = 0.007) showed a significant difference
between methods. This could be due to compound effect of the natural interfruit variability, the short number
of fruits used in this study, and the bias between the two analytical methods.
Comparison of HR-MAS NMR spectroscopy measurements in focused-microwave denaturated
samples and intact samples
To assess whether the high rate sample spinning and the room temperature acquisition times required by the
HR-MAS NMR method caused any artefactual alteration of free sugar levels, we measured the content of
sucrose, glucose and fructose by recording 1D 1H HR-MAS NMR spectra from paired samples: an untreated
sample (control) and its focused microwave denaturated counterpart (FMF), and we compared the sugar
content by using the method of differences vs averages proposed by Bland and Altman (1, 2), according to
the guidelines by Castersen (3). A more detailed explanation of the method and the interpretation of its
results is given in the article.
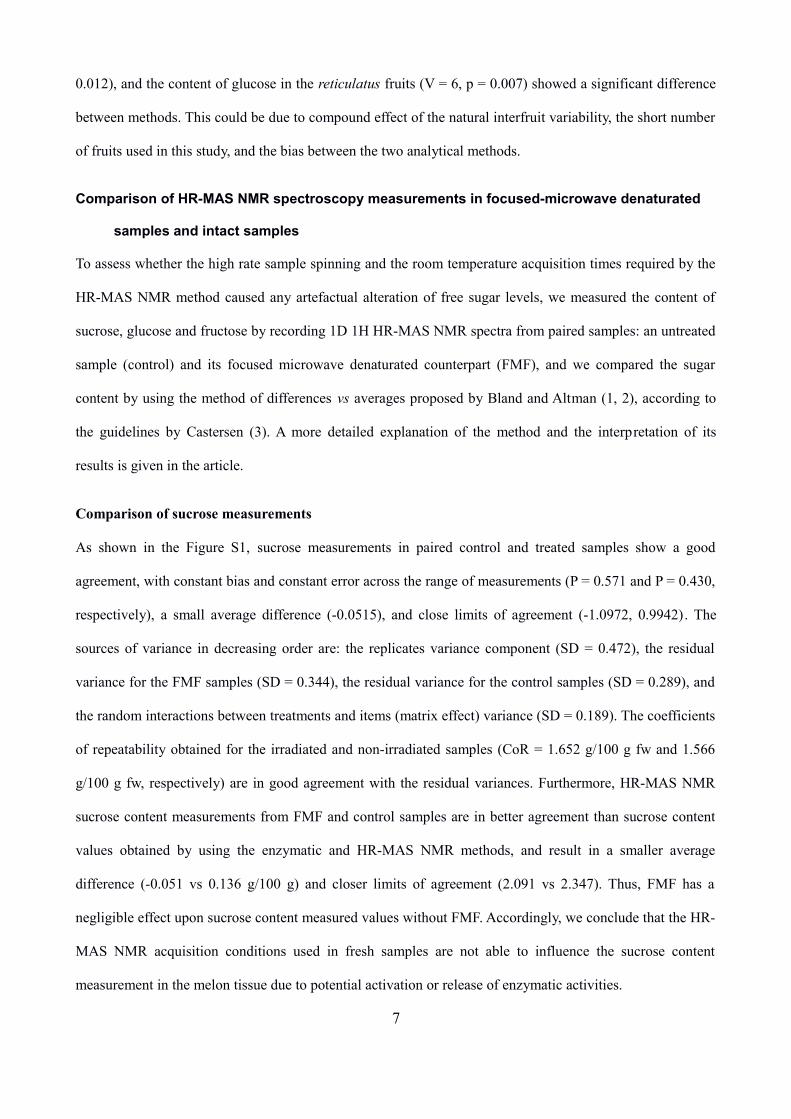
Comparison of sucrose measurements
As shown in the Figure S1, sucrose measurements in paired control and treated samples show a good
agreement, with constant bias and constant error across the range of measurements (P = 0.571 and P = 0.430,
respectively), a small average difference (-0.0515), and close limits of agreement (-1.0972, 0.9942). The
sources of variance in decreasing order are: the replicates variance component (SD = 0.472), the residual
variance for the FMF samples (SD = 0.344), the residual variance for the control samples (SD = 0.289), and
the random interactions between treatments and items (matrix effect) variance (SD = 0.189). The coefficients
of repeatability obtained for the irradiated and non-irradiated samples (CoR = 1.652 g/100 g fw and 1.566
g/100 g fw, respectively) are in good agreement with the residual variances. Furthermore, HR-MAS NMR
sucrose content measurements from FMF and control samples are in better agreement than sucrose content
values obtained by using the enzymatic and HR-MAS NMR methods, and result in a smaller average
difference (-0.051 vs 0.136 g/100 g) and closer limits of agreement (2.091 vs 2.347). Thus, FMF has a
negligible effect upon sucrose content measured values without FMF. Accordingly, we conclude that the HR-
MAS NMR acquisition conditions used in fresh samples are not able to influence the sucrose content
measurement in the melon tissue due to potential activation or release of enzymatic activities.
7
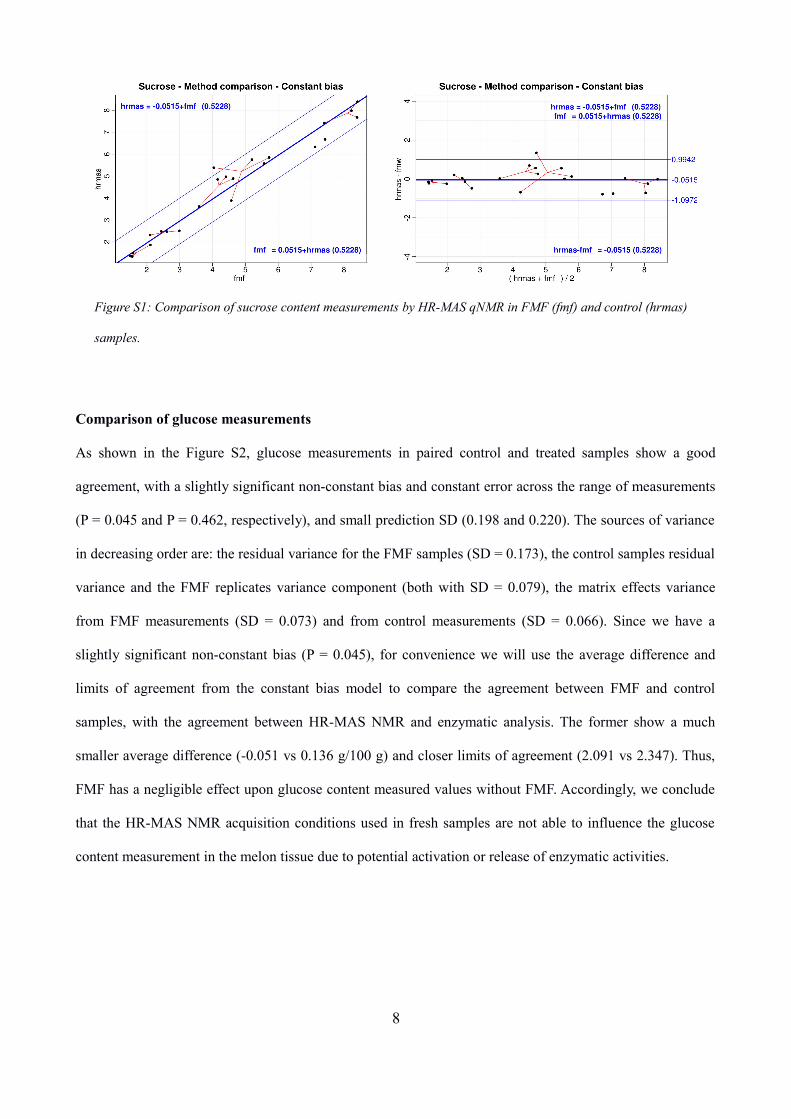
Comparison of glucose measurements
As shown in the Figure S2, glucose measurements in paired control and treated samples show a good
agreement, with a slightly significant non-constant bias and constant error across the range of measurements
(P = 0.045 and P = 0.462, respectively), and small prediction SD (0.198 and 0.220). The sources of variance
in decreasing order are: the residual variance for the FMF samples (SD = 0.173), the control samples residual
variance and the FMF replicates variance component (both with SD = 0.079), the matrix effects variance
from FMF measurements (SD = 0.073) and from control measurements (SD = 0.066). Since we have a
slightly significant non-constant bias (P = 0.045), for convenience we will use the average difference and
limits of agreement from the constant bias model to compare the agreement between FMF and control
samples, with the agreement between HR-MAS NMR and enzymatic analysis. The former show a much
smaller average difference (-0.051 vs 0.136 g/100 g) and closer limits of agreement (2.091 vs 2.347). Thus,
FMF has a negligible effect upon glucose content measured values without FMF. Accordingly, we conclude
that the HR-MAS NMR acquisition conditions used in fresh samples are not able to influence the glucose
content measurement in the melon tissue due to potential activation or release of enzymatic activities.
8
Figure S1: Comparison of sucrose content measurements by HR-MAS qNMR in FMF (fmf) and control (hrmas)
samples.
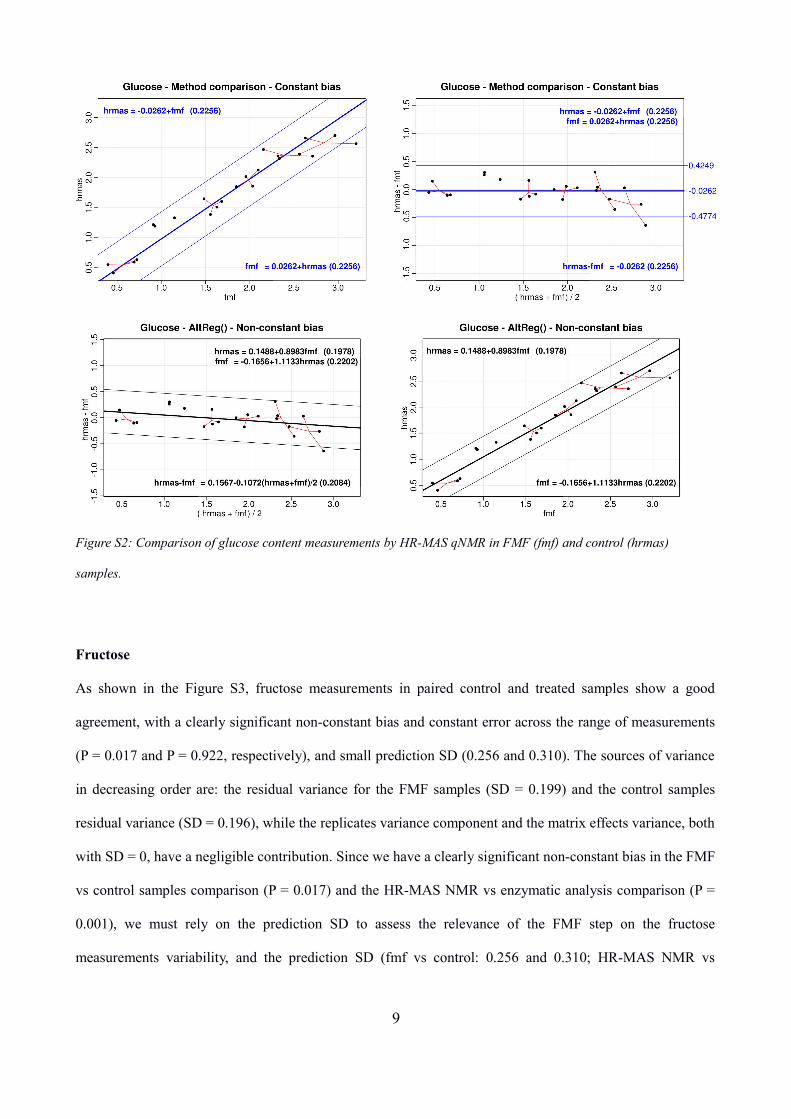
Fructose
As shown in the Figure S3, fructose measurements in paired control and treated samples show a good
agreement, with a clearly significant non-constant bias and constant error across the range of measurements
(P = 0.017 and P = 0.922, respectively), and small prediction SD (0.256 and 0.310). The sources of variance
in decreasing order are: the residual variance for the FMF samples (SD = 0.199) and the control samples
residual variance (SD = 0.196), while the replicates variance component and the matrix effects variance, both
with SD = 0, have a negligible contribution. Since we have a clearly significant non-constant bias in the FMF
vs control samples comparison (P = 0.017) and the HR-MAS NMR vs enzymatic analysis comparison (P =
0.001), we must rely on the prediction SD to assess the relevance of the FMF step on the fructose
measurements variability, and the prediction SD (fmf vs control: 0.256 and 0.310; HR-MAS NMR vs
9
Figure S2: Comparison of glucose content measurements by HR-MAS qNMR in FMF (fmf) and control (hrmas)
samples.
enzymatic analysis: 0.390 and 0.281) indicate that fmf causes a smaller variability than differences amongst
fructose content measurements made by the two analytical methods. Thus, FMF has a negligible effect upon
fructose content measured values without FMF. Accordingly, we conclude that the HR-MAS NMR
acquisition conditions used in fresh samples are not able to influence the fructose content measurement in the
melon tissue due to potential activation or release of enzymatic activities.
Overall conclusion about the FMF-step
The denaturation of enzymes in fruit samples by means of focused-microwave irradiation prior to the HR-
MAS NMR experiments did not improve the results obtained by direct analysis of the samples, quite
possibly because of the comparatively slow metabolism of sugars in the melon mesocarp. On the other side,
the cause of the non-constant bias between control and denaturated samples in the case of glucose and
10
Figure S3: Comparison of fructose content measurements by HR-MAS qNMR in FMF (fmf) and control (hrmas)
samples.
fructose measurements remains unknown. These conclusions fully support our decision to only compare the
HR-MAS NMR results obtained from intact samples with the results obtained by the enzymatic analysis
method.
Comparison of HR-MAS NMR spectroscopy and enzymatic analysis methods of measurement
These are the results of the initial comparison of the full datasets prior to excluding an outlier sample. The
final statistical analysis of the datasets upon excluding the outlier point is reported in the Results &
Discussion section of the manuscript.
Comparison of methods for sucrose quantification
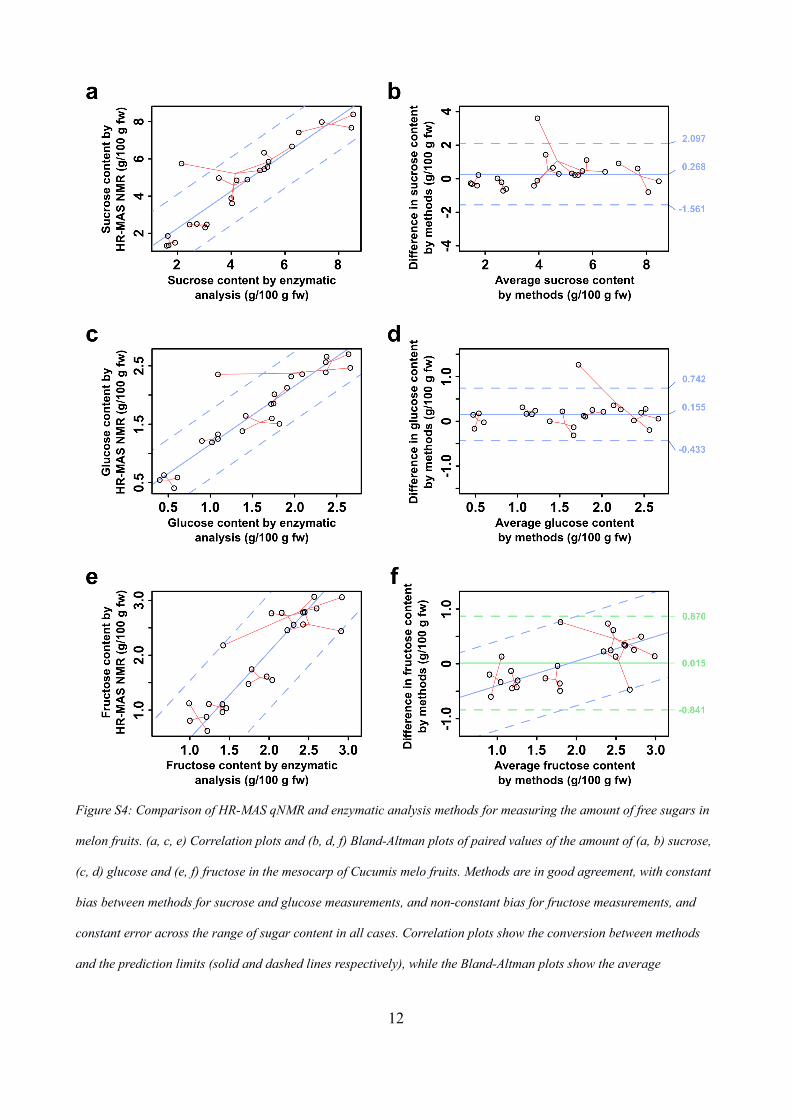
Figure S4a shows that sucrose measurements by HR-MAS NMR correlate well with measurements made by
the enzymatic method, with values laid along a line close to the 45° identity line and uniformly spread across
the range of measurements. Likewise, the difference vs average plot in Figure S4b suggests a constant bias
and constant error across the range of sucrose content, a fact statistically confirmed (see p-values in Table
S5). For sucrose, the average difference between methods is much smaller than the smallest amount of
sucrose measured (0.268 vs 1.331 g/100 g fw), but the limits of agreement between methods are rather large
and could be affected by a suspected outlier measurement. Also, as reported in Table S5, the enzymatic
method variability is the largest source of variability, while the HR-MAS qNMR method plays a smaller
role, albeit it contributes more than the variance between replicates and the matrix effect. Last, the methods
residual variances are in agreement with the difference between the coefficients of repeatability of the
enzymatic and HR-MAS NMR methods (see Table S5), a difference that could be attributable to the larger
amount of manipulation required for the enzymatic method and to the contribution by one suspected outlier
value. These findings confirm that both methods can be regarded as equivalent when measuring sucrose
content in this range of values.
11
12
Figure S4: Comparison of HR-MAS qNMR and enzymatic analysis methods for measuring the amount of free sugars in
melon fruits. (a, c, e) Correlation plots and (b, d, f) Bland-Altman plots of paired values of the amount of (a, b) sucrose,
(c, d) glucose and (e, f) fructose in the mesocarp of Cucumis melo fruits. Methods are in good agreement, with constant
bias between methods for sucrose and glucose measurements, and non-constant bias for fructose measurements, and
constant error across the range of sugar content in all cases. Correlation plots show the conversion between methods
and the prediction limits (solid and dashed lines respectively), while the Bland-Altman plots show the average
Comparison of methods for glucose quantification
The scatter-plot of glucose measurements by the HR-MAS NMR and enzymatic methods shows a good
agreement amongst methods, with data points arranged along a line close to the 45° identity line and
uniformly spread across the range of measurements (Figure S4c). Likewise, Figure S4d shows a constant
bias and constant error across the range of glucose content, with P = 0.741 and P = 0.728, respectively (Table
S5). The average difference in glucose measurements between methods is 0.155 g/100 g fw, less than half the
lowest amount of glucose measured (0.400 g/100 g fw), but the limits of agreement between methods (LoA:
0.742 and -0.433) are rather large and could be affected by a suspected outlier measurement. The sources of
variance in the linear mixed effects model (see Table S5) show that the residual variance of the enzymatic
method is the largest source of variability by large, and that all other sources of variability have a similar and
much smaller contribution. This is in agreement with the coefficients of repeatability obtained for both
analytical methods (Table S5). Accordingly, both methods can be regarded as equivalent for the measurement
of glucose, although the enzymatic method has a much larger variability, maybe because the amount of
manipulation it requires, although we cannot exclude an artefactual contribution by a candidate outlier value.
Comparison of methods for fructose quantification
Figure S4e shows that fructose measurements by HR-MAS NMR correlate well with measurements made by
the enzymatic method but that they deviate from the identity line, yielding the HR-MAS NMR method
smaller values when fructose content is below 2 g/100 g fw and conversely larger values when fructose
content is above that point. This is confirmed by the differences vs averages plot (Figure S4f) that shows a
non-constant bias and constant error across the range of fructose content, with P = 0.002 and P = 0.764,
respectively (Table S5). Accordingly, measurements were fitted again with a non-constant bias model,
13
difference and the 95% limits of agreement (solid and dashed lines respectively, LoA values are shown next to the lines).
Red lines link replicate measurements from the same melon fruit (4 replicates per fruit). Although fructose
measurements by both methods exhibit a non-constant bias, the average difference and limits of agreement of a
constant bias model are shown for comparison purposes (light green lines).
although we were forced to use a non-linked replicates model because the minimizing algorithm failed to
converge when using a linked-replicates model. The consequences of this simplification of the model are
slightly overestimated prediction intervals, and the impossibility to quantify the replicates variance
contribution, which leaves the method residual variances as the only source of variance. The results of the
fitting of a non-constant bias model confirm that measurements by the HR-MAS NMR method are linearly
related to measurements by the enzymatic method, with a scale factor of 1.58 and an offset of -1.1, and that
HR-MAS NMR would yield smaller values than the enzymatic method when fructose content is under 1.89
g/100 g fw, and larger values above that point. The fitting to a non-constant bias model does not yield limits
of agreement in the sense defined by Bland and Altman for a constant-bias model, but the comparison of the
prediction standard deviation of the regression equations of differences on averages shows that the non-
constant bias model results in somewhat narrower prediction limits (SD = 4.071 vs 4.278). Finally, the HR-
MAS NMR method residual variance is 30% smaller than the enzymatic method residual variance (SD =
0.212 vs 0.304). These values show that, in our fructose measurements, the enzymatic method is the largest
source of variability, maybe because the amount of manipulation it requires, although we cannot discard an
artefactual contribution by one candidate outlier measurement.
14
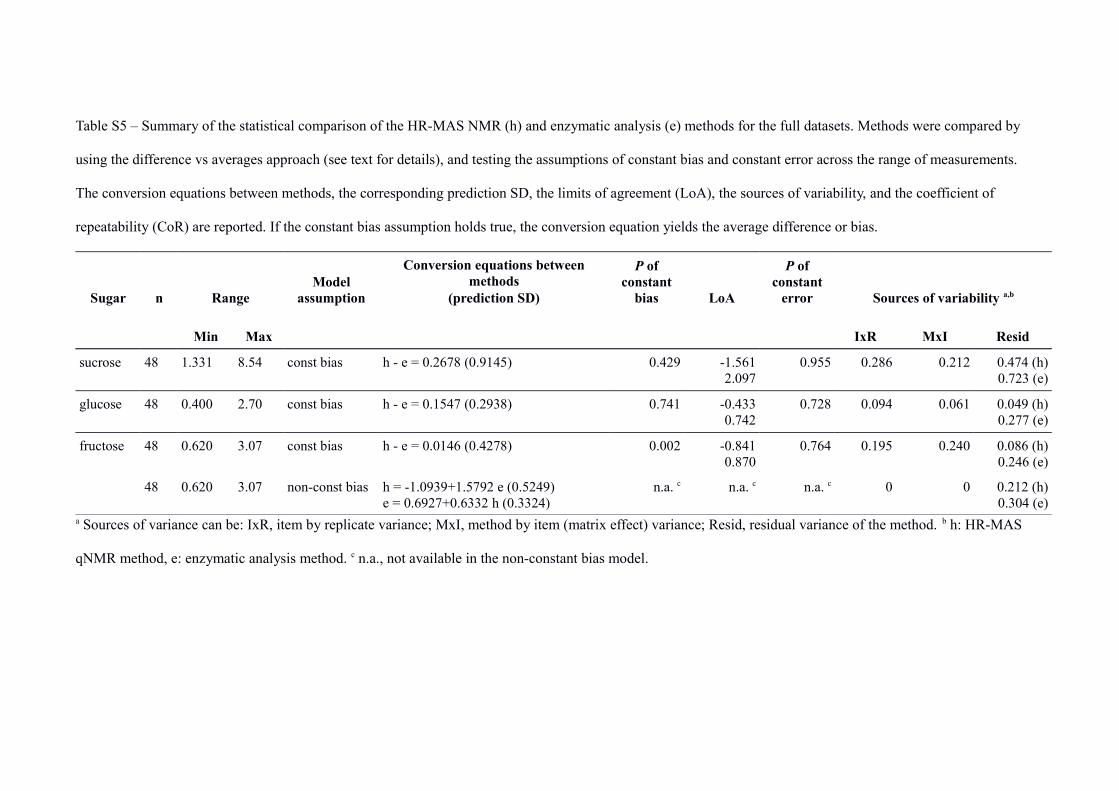
Table S5 – Summary of the statistical comparison of the HR-MAS NMR (h) and enzymatic analysis (e) methods for the full datasets. Methods were compared by
using the difference vs averages approach (see text for details), and testing the assumptions of constant bias and constant error across the range of measurements.
The conversion equations between methods, the corresponding prediction SD, the limits of agreement (LoA), the sources of variability, and the coefficient of
repeatability (CoR) are reported. If the constant bias assumption holds true, the conversion equation yields the average difference or bias.
Sugar n RangeModel
assumption
Conversion equations between methods
(prediction SD)
P of constant
bias LoA
P of constant
error Sources of variability a,b
Min Max IxR MxI Resid
sucrose 48 1.331 8.54 const bias h - e = 0.2678 (0.9145) 0.429 -1.5612.097
0.955 0.286 0.212 0.474 (h)0.723 (e)
glucose 48 0.400 2.70 const bias h - e = 0.1547 (0.2938) 0.741 -0.4330.742
0.728 0.094 0.061 0.049 (h)0.277 (e)
fructose 48 0.620 3.07 const bias h - e = 0.0146 (0.4278) 0.002 -0.8410.870
0.764 0.195 0.240 0.086 (h)0.246 (e)
48 0.620 3.07 non-const bias h = -1.0939+1.5792 e (0.5249)e = 0.6927+0.6332 h (0.3324)
n.a. c n.a. c n.a. c 0 0 0.212 (h)0.304 (e)
a Sources of variance can be: IxR, item by replicate variance; MxI, method by item (matrix effect) variance; Resid, residual variance of the method. b h: HR-MAS
qNMR method, e: enzymatic analysis method. c n.a., not available in the non-constant bias model.
References
1. Altman DG, Bland JM. Measurement in Medicine: the Analysis of Method Comparison Studies. The
Statistician 1983;32:307-3017.
2. Bland JM, Altman DG. Measuring agreement in method comparison studies. Stat Methods Med Res
1999;8(2):135-160.
3. Carstensen B. Comparing Clinical Measurement Methods. A Practical Guide. Singapore: John Wiley
& Sons; 2010.
16


![[Information page] - Springer10.1007/s131… · Web viewComparison of tocilizumab as monotherapy or with add-on disease-modifying antirheumatic drugs in patients with rheumatoid](https://img.pdfslide.net/doc/110x75/5a78be1d7f8b9a4f1b8b8d7e/information-page-springer-101007s131web-viewcomparison-of-tocilizumab-as.jpg)