Embed Size (px)
Citation preview
1
Supplementary Digital Content
Should first-line empiric treatment strategies for neonates cover
coagulase-negative Staphylococcal infections in Kenya?
Anna C. Seale DPhil,*† §, Christina W. Obiero, MBChB, MPH,*† Kelsey Jones,
PhD,* ‡ Hellen C. Barsosio MBChB*, Johnstone Thitiri, MSc,* Moses Ngari, MSc,*
Susan Morpeth, PhD,*§ Shebe Mohammed, HND,* Greg Fegan, PhD,*† Neema
Mturi, MRCP,* James A. Berkley, FRCPCH,*†
*KEMRI-Wellcome Trust Research Institution, Kilifi, Kenya; †University of Oxford,
UK; ‡Imperial College London, London, UK; §London School of Hygiene and
Tropical Medicine, London, UK
2
Contents Table S1: Characteristics of neonates admitted with clinically significant bacteraemias* from Kilifi
County Hospital 1998-2013 ................................................................................................................ 3
Table S2 Demographic and clinical characteristics associated with CoNS isolation in the blood, in
neonates admitted to Kilifi County Hospital 1998-2013 compared to neonates with no clinically
significant isolate (or no growth). ....................................................................................................... 4
Table S3 Demographic and clinical characteristics associated with CoNS isolation in the blood, in
neonates admitted to Kilifi County Hospital 1998-2013 compared to neonates with a clinically
significant bacteraemia ....................................................................................................................... 5
Tables S4 Demographic and clinical characteristics associated with neonates admitted with
clinically significant bacteraemia admitted to Kilifi County Hospital 1998-2013 ............................... 6
Table S5 Demographic and clinical characteristics associated with isolation of clinically non-
significant isolates from blood in neonates admitted to Kilifi County Hospital 1998-2013 ............... 7
Figure S1 Percentage of blood culture isolations by type per year in neonates admitted to Kilifi
County Hospital 1998-2013 ................................................................................................................ 8
3
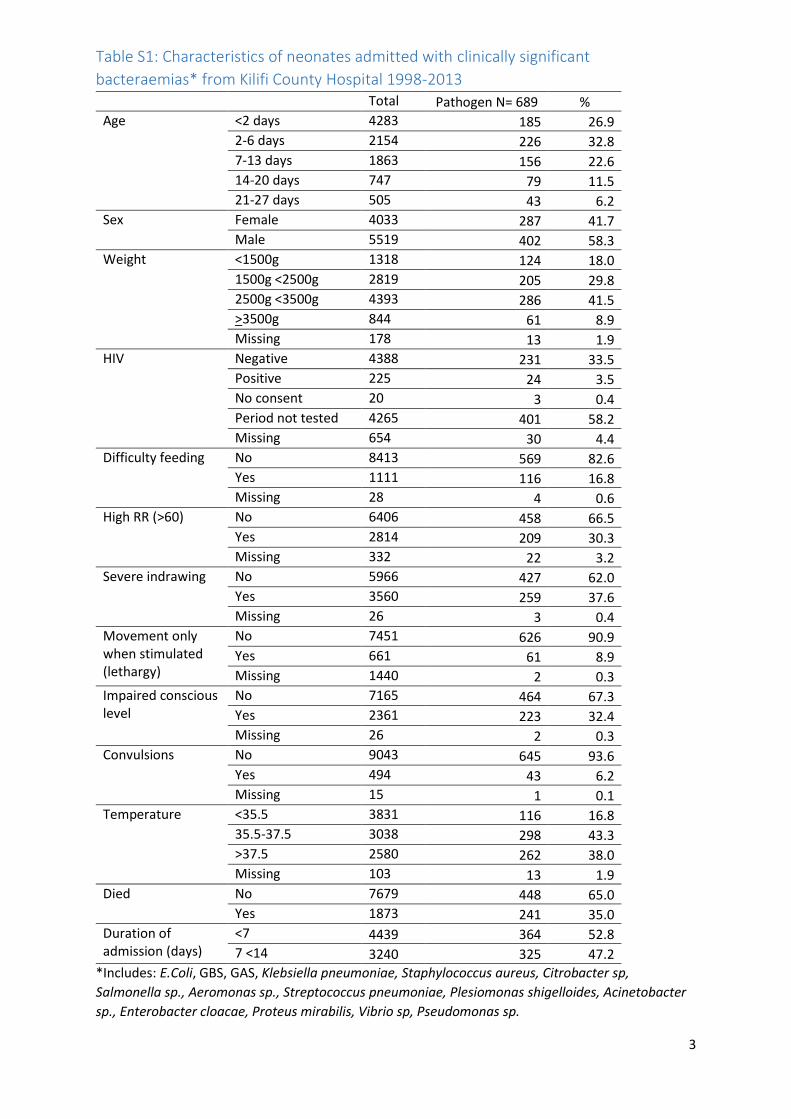
Table S1: Characteristics of neonates admitted with clinically significant
bacteraemias* from Kilifi County Hospital 1998-2013 Total Pathogen N= 689 %
Age <2 days 4283 185 26.9
2-6 days 2154 226 32.8
7-13 days 1863 156 22.6
14-20 days 747 79 11.5
21-27 days 505 43 6.2
Sex Female 4033 287 41.7
Male 5519 402 58.3
Weight <1500g 1318 124 18.0
1500g <2500g 2819 205 29.8
2500g <3500g 4393 286 41.5
>3500g 844 61 8.9
Missing 178 13 1.9
HIV Negative 4388 231 33.5
Positive 225 24 3.5
No consent 20 3 0.4
Period not tested 4265 401 58.2
Missing 654 30 4.4
Difficulty feeding No 8413 569 82.6
Yes 1111 116 16.8
Missing 28 4 0.6
High RR (>60) No 6406 458 66.5
Yes 2814 209 30.3
Missing 332 22 3.2
Severe indrawing No 5966 427 62.0
Yes 3560 259 37.6
Missing 26 3 0.4
Movement only when stimulated (lethargy)
No 7451 626 90.9
Yes 661 61 8.9
Missing 1440 2 0.3
Impaired conscious level
No 7165 464 67.3
Yes 2361 223 32.4
Missing 26 2 0.3
Convulsions No 9043 645 93.6
Yes 494 43 6.2
Missing 15 1 0.1
Temperature <35.5 3831 116 16.8
35.5-37.5 3038 298 43.3
>37.5 2580 262 38.0
Missing 103 13 1.9
Died No 7679 448 65.0
Yes 1873 241 35.0
Duration of admission (days)
<7 4439 364 52.8
7 <14 3240 325 47.2
*Includes: E.Coli, GBS, GAS, Klebsiella pneumoniae, Staphylococcus aureus, Citrobacter sp,
Salmonella sp., Aeromonas sp., Streptococcus pneumoniae, Plesiomonas shigelloides, Acinetobacter
sp., Enterobacter cloacae, Proteus mirabilis, Vibrio sp, Pseudomonas sp.
4
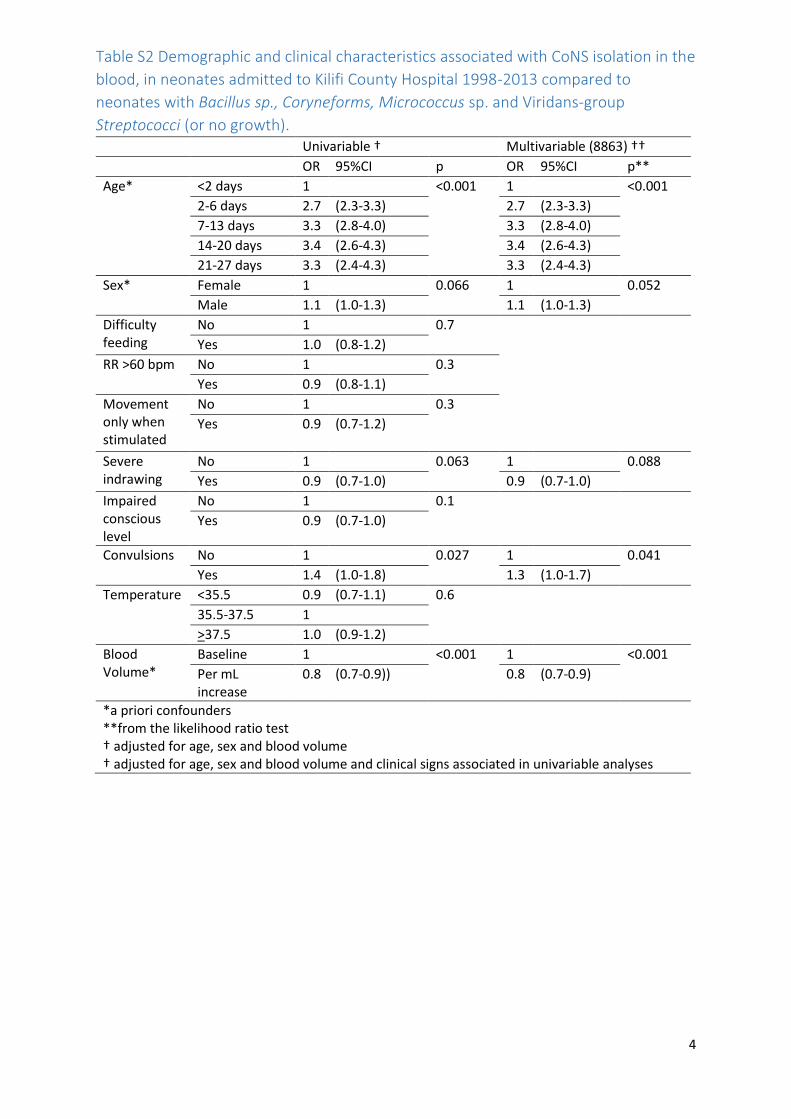
Table S2 Demographic and clinical characteristics associated with CoNS isolation in the
blood, in neonates admitted to Kilifi County Hospital 1998-2013 compared to
neonates with Bacillus sp., Coryneforms, Micrococcus sp. and Viridans-group
Streptococci (or no growth). Univariable † Multivariable (8863) †† OR 95%CI p OR 95%CI p**
Age* <2 days 1
<0.001 1
<0.001
2-6 days 2.7 (2.3-3.3) 2.7 (2.3-3.3)
7-13 days 3.3 (2.8-4.0) 3.3 (2.8-4.0)
14-20 days 3.4 (2.6-4.3) 3.4 (2.6-4.3)
21-27 days 3.3 (2.4-4.3) 3.3 (2.4-4.3)
Sex* Female 1
0.066 1
0.052
Male 1.1 (1.0-1.3) 1.1 (1.0-1.3)
Difficulty feeding
No 1
0.7
Yes 1.0 (0.8-1.2)
RR >60 bpm No 1
0.3
Yes 0.9 (0.8-1.1)
Movement only when stimulated
No 1
0.3
Yes 0.9 (0.7-1.2)
Severe indrawing
No 1
0.063 1
0.088
Yes 0.9 (0.7-1.0) 0.9 (0.7-1.0)
Impaired conscious level
No 1
0.1
Yes 0.9 (0.7-1.0)
Convulsions No 1
0.027 1
0.041
Yes 1.4 (1.0-1.8) 1.3 (1.0-1.7)
Temperature <35.5 0.9 (0.7-1.1) 0.6
35.5-37.5 1
>37.5 1.0 (0.9-1.2)
Blood Volume*
Baseline 1
<0.001 1
<0.001
Per mL increase
0.8 (0.7-0.9)) 0.8 (0.7-0.9)
*a priori confounders **from the likelihood ratio test † adjusted for age, sex and blood volume † adjusted for age, sex and blood volume and clinical signs associated in univariable analyses
5
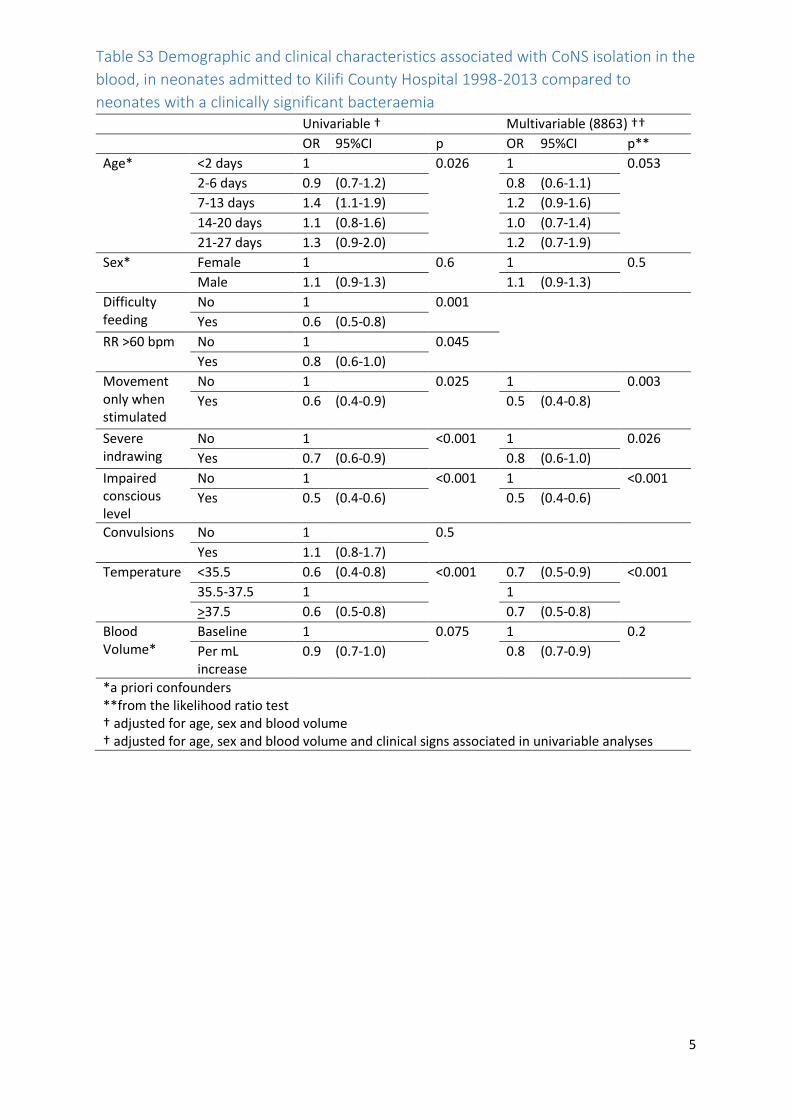
Table S3 Demographic and clinical characteristics associated with CoNS isolation in the
blood, in neonates admitted to Kilifi County Hospital 1998-2013 compared to
neonates with a clinically significant bacteraemia Univariable † Multivariable (8863) †† OR 95%CI p OR 95%CI p**
Age* <2 days 1
0.026 1
0.053
2-6 days 0.9 (0.7-1.2) 0.8 (0.6-1.1)
7-13 days 1.4 (1.1-1.9) 1.2 (0.9-1.6)
14-20 days 1.1 (0.8-1.6) 1.0 (0.7-1.4)
21-27 days 1.3 (0.9-2.0) 1.2 (0.7-1.9)
Sex* Female 1
0.6 1
0.5
Male 1.1 (0.9-1.3) 1.1 (0.9-1.3)
Difficulty feeding
No 1
0.001
Yes 0.6 (0.5-0.8)
RR >60 bpm No 1
0.045
Yes 0.8 (0.6-1.0)
Movement only when stimulated
No 1
0.025 1
0.003
Yes 0.6 (0.4-0.9) 0.5 (0.4-0.8)
Severe indrawing
No 1
<0.001 1
0.026
Yes 0.7 (0.6-0.9) 0.8 (0.6-1.0)
Impaired conscious level
No 1
<0.001 1
<0.001
Yes 0.5 (0.4-0.6) 0.5 (0.4-0.6)
Convulsions No 1
0.5
Yes 1.1 (0.8-1.7)
Temperature <35.5 0.6 (0.4-0.8) <0.001 0.7 (0.5-0.9) <0.001
35.5-37.5 1
1
>37.5 0.6 (0.5-0.8) 0.7 (0.5-0.8)
Blood Volume*
Baseline 1
0.075 1
0.2
Per mL increase
0.9 (0.7-1.0) 0.8 (0.7-0.9)
*a priori confounders **from the likelihood ratio test † adjusted for age, sex and blood volume † adjusted for age, sex and blood volume and clinical signs associated in univariable analyses
6
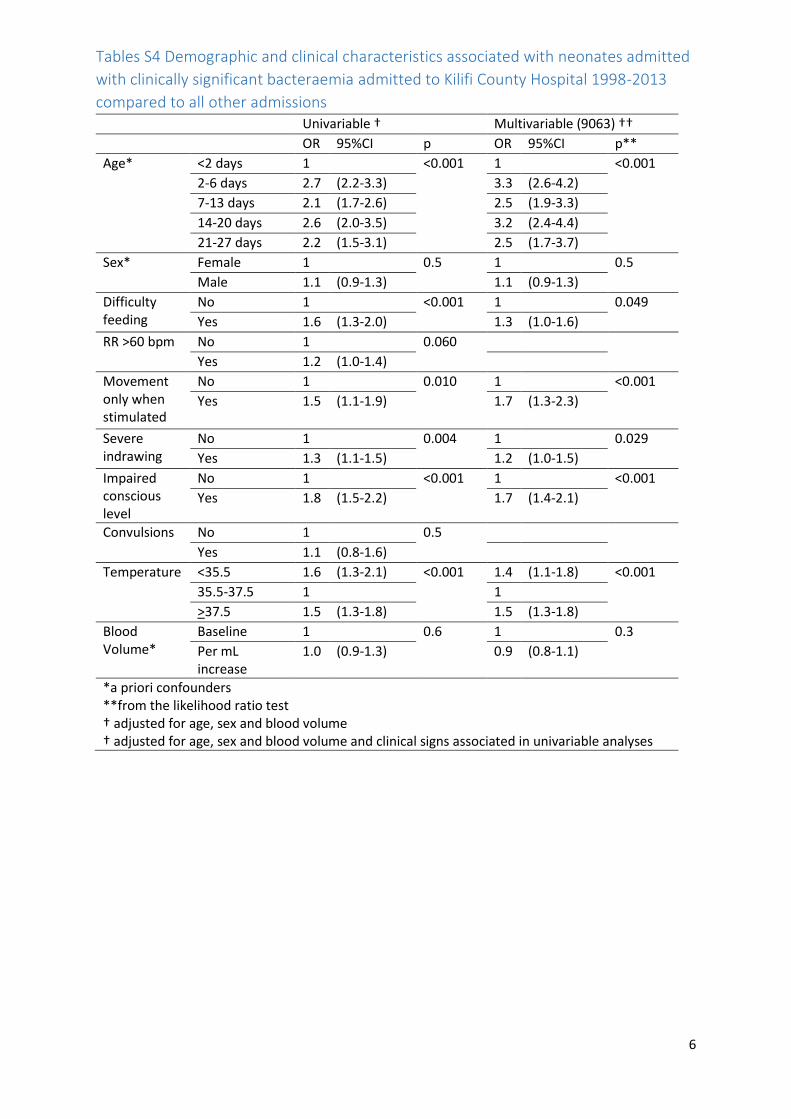
Tables S4 Demographic and clinical characteristics associated with neonates admitted
with clinically significant bacteraemia admitted to Kilifi County Hospital 1998-2013
compared to all other admissions Univariable † Multivariable (9063) †† OR 95%CI p OR 95%CI p**
Age* <2 days 1
<0.001 1
<0.001
2-6 days 2.7 (2.2-3.3) 3.3 (2.6-4.2)
7-13 days 2.1 (1.7-2.6) 2.5 (1.9-3.3)
14-20 days 2.6 (2.0-3.5) 3.2 (2.4-4.4)
21-27 days 2.2 (1.5-3.1) 2.5 (1.7-3.7)
Sex* Female 1
0.5 1
0.5
Male 1.1 (0.9-1.3) 1.1 (0.9-1.3)
Difficulty feeding
No 1
<0.001 1
0.049
Yes 1.6 (1.3-2.0) 1.3 (1.0-1.6)
RR >60 bpm No 1
0.060
Yes 1.2 (1.0-1.4)
Movement only when stimulated
No 1
0.010 1
<0.001
Yes 1.5 (1.1-1.9) 1.7 (1.3-2.3)
Severe indrawing
No 1
0.004 1
0.029
Yes 1.3 (1.1-1.5) 1.2 (1.0-1.5)
Impaired conscious level
No 1
<0.001 1
<0.001
Yes 1.8 (1.5-2.2) 1.7 (1.4-2.1)
Convulsions No 1
0.5
Yes 1.1 (0.8-1.6)
Temperature <35.5 1.6 (1.3-2.1) <0.001 1.4 (1.1-1.8) <0.001
35.5-37.5 1
1
>37.5 1.5 (1.3-1.8) 1.5 (1.3-1.8)
Blood Volume*
Baseline 1
0.6 1
0.3
Per mL increase
1.0 (0.9-1.3) 0.9 (0.8-1.1)
*a priori confounders **from the likelihood ratio test † adjusted for age, sex and blood volume † adjusted for age, sex and blood volume and clinical signs associated in univariable analyses
7
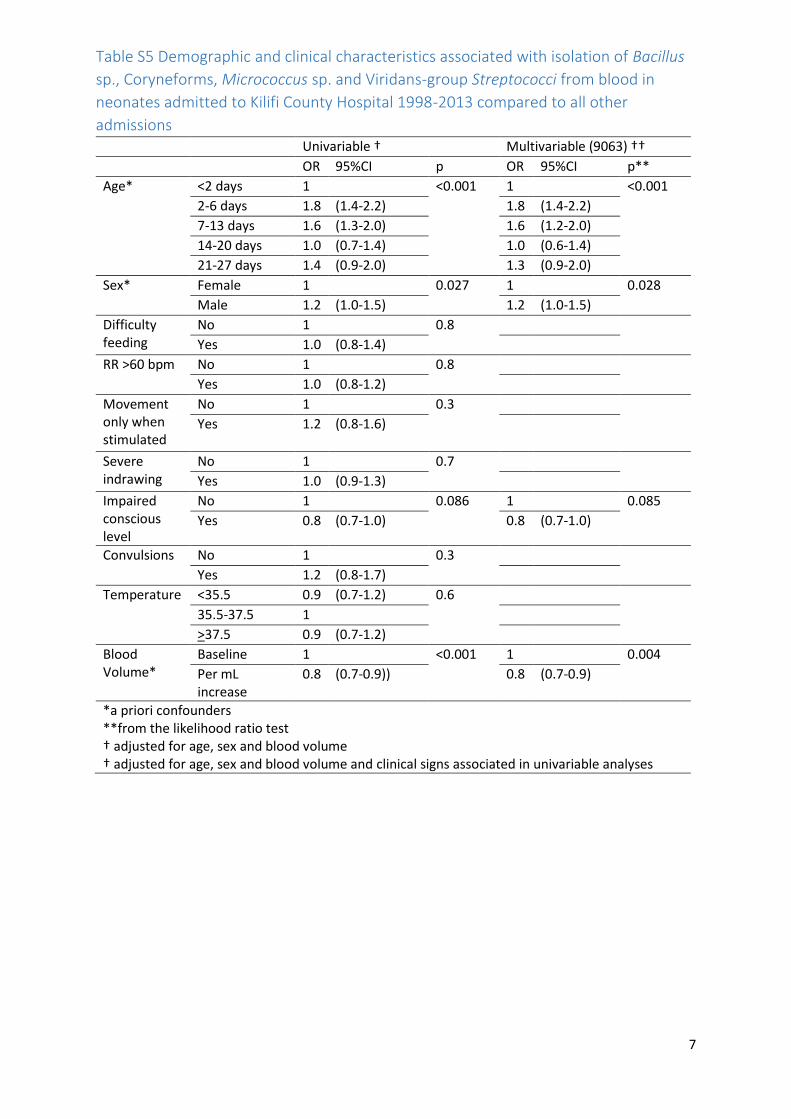
Table S5 Demographic and clinical characteristics associated with isolation of Bacillus
sp., Coryneforms, Micrococcus sp. and Viridans-group Streptococci from blood in
neonates admitted to Kilifi County Hospital 1998-2013 compared to all other
admissions Univariable † Multivariable (9063) †† OR 95%CI p OR 95%CI p**
Age* <2 days 1
<0.001 1
<0.001
2-6 days 1.8 (1.4-2.2) 1.8 (1.4-2.2)
7-13 days 1.6 (1.3-2.0) 1.6 (1.2-2.0)
14-20 days 1.0 (0.7-1.4) 1.0 (0.6-1.4)
21-27 days 1.4 (0.9-2.0) 1.3 (0.9-2.0)
Sex* Female 1
0.027 1
0.028
Male 1.2 (1.0-1.5) 1.2 (1.0-1.5)
Difficulty feeding
No 1
0.8
Yes 1.0 (0.8-1.4)
RR >60 bpm No 1
0.8
Yes 1.0 (0.8-1.2)
Movement only when stimulated
No 1
0.3
Yes 1.2 (0.8-1.6)
Severe indrawing
No 1
0.7
Yes 1.0 (0.9-1.3)
Impaired conscious level
No 1
0.086 1
0.085
Yes 0.8 (0.7-1.0) 0.8 (0.7-1.0)
Convulsions No 1
0.3
Yes 1.2 (0.8-1.7)
Temperature <35.5 0.9 (0.7-1.2) 0.6
35.5-37.5 1
>37.5 0.9 (0.7-1.2)
Blood Volume*
Baseline 1
<0.001 1
0.004
Per mL increase
0.8 (0.7-0.9)) 0.8 (0.7-0.9)
*a priori confounders **from the likelihood ratio test † adjusted for age, sex and blood volume † adjusted for age, sex and blood volume and clinical signs associated in univariable analyses
8
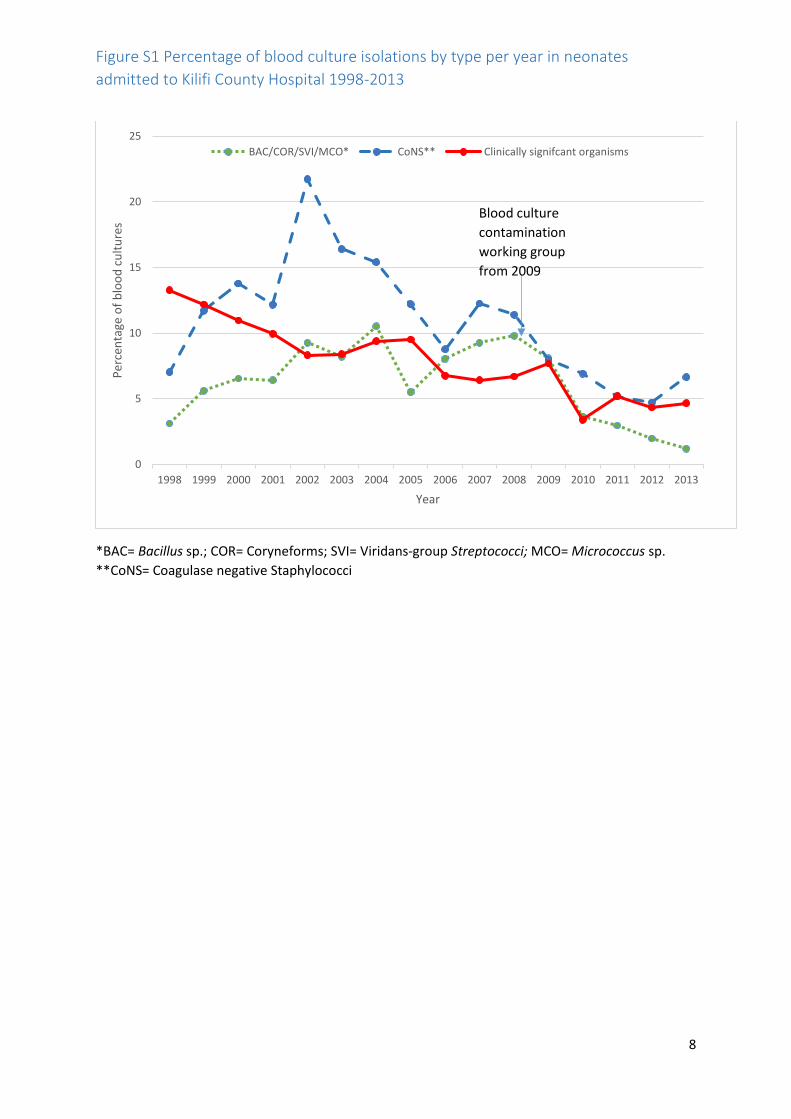
Figure S1 Percentage of blood culture isolations by type per year in neonates
admitted to Kilifi County Hospital 1998-2013
*BAC= Bacillus sp.; COR= Coryneforms; SVI= Viridans-group Streptococci; MCO= Micrococcus sp.
**CoNS= Coagulase negative Staphylococci
0
5
10
15
20
25
1998 1999 2000 2001 2002 2003 2004 2005 2006 2007 2008 2009 2010 2011 2012 2013
Per
cen
tage
of
blo
od
cu
ltu
res
Year
BAC/COR/SVI/MCO* CoNS** Clinically signifcant organisms
Blood culture
contamination
working group
from 2009

![Acute Kidney Injury in Asphyxiated neonates admitted into a ......with perinatal asphyxia. Perinatal Asphyxia ranks as the second most important cause of neonatal death[1]. Major risk](https://img.pdfslide.net/doc/110x75/61110be6b93f5b0fcd11cc91/acute-kidney-injury-in-asphyxiated-neonates-admitted-into-a-with-perinatal.jpg)