Embed Size (px)
Citation preview
Supplementary Figure 1. Dendrogram based on (A) expression or (B) PRIMs of all protein-coding and noncoding genes. Different cell types are distinguished by colors as in Figure 1. Left, dendrograms include all cell lines. Right, dendrograms without published data on SSCs, iPSCs, and MEFs. In-house data are highlighed in gray.
A
Update Figure S1
HSC_1
HSC_2
MEF
MEF_SY12_1
MEF_SY12_2
PGC_E12d5_LBJ13_1
PGC_E14d5_LBJ13_2
PGC_E14d5_LBJ13_1
PGC_E14d5_LBJ13_3
PGC_E12d5_LBJ13_2
PGC_E12d5_LBJ13_3
PGC_E13d5_LBJ13_3
PGC_E13d5_LBJ13_1
PGC_E13d5_LBJ13_2
MASC_OG1
MASC_OG2
ESC_BLA13
ESC_OG
iPS4
iPS1
MASC_Rosa3
ESC_129mix
MASC_Rosa5
MASC_VG5
MASC_VG8
GS_SHS15_1
GS_SHS15_2
SSC_OG2
SSC_VG
SSC_OG1
SSC_B6
PS_LBJ13
RS_LBJ13
PS_SHS15_1
PS_SHS15_2
RS_SHS15_1
RS_SHS15_2
RS_ES13_1
RS_ES13_2
0.00.51.01.52.02.53.0
Clu
ster
Den
drog
ram
hclu
st (*
, "c
om
ple
te")
dis
t(cor(
na.o
mit(T
SS
.exprs
.chip
[, −
c(1
:10, 24, 27, 30, 48:5
0,
56:1
41)]
)))
Height
Transcriptome (RNA-seq)
HSC_1
HSC_2
MEF
MEF_SY12_1
MEF_SY12_2
PGC_E12d5_LBJ13_1
PGC_E14d5_LBJ13_2
PGC_E14d5_LBJ13_1
PGC_E14d5_LBJ13_3
PGC_E12d5_LBJ13_2
PGC_E12d5_LBJ13_3
PGC_E13d5_LBJ13_3
PGC_E13d5_LBJ13_1
PGC_E13d5_LBJ13_2
MASC_OG1
MASC_OG2
ESC_BLA13
ESC_OG
iPS4
iPS1
MASC_Rosa3
ESC_129mix
MASC_Rosa5
MASC_VG5
MASC_VG8
GS_SHS15_1
GS_SHS15_2
SSC_OG2
SSC_VG
SSC_OG1
SSC_B6
PS_LBJ13
RS_LBJ13
PS_SHS15_1
PS_SHS15_2
RS_SHS15_1
RS_SHS15_2
RS_ES13_1
RS_ES13_2
0.00.51.01.52.02.53.0
Cluster Dendrogram
hclust (*, "complete")
dist(cor(na.omit(TSS.exprs.chip[, −c(1:10, 24, 27, 30, 48:50,
56:141)])))
Height
RS_ES13.2 RS_ES13.1 RS_SHS15.2 RS_SHS15.1 PS_SHS15.2 PS_SHS15.1 RS_LBJ13 PS_LBJ13 SSC.3 SSC.1 SSC.4 SSC.2 SSC_SHS15.2 SSC_SHS15.1 MASC.4 MASC.3 MASC.5 ESC.2 MASC.6 iPS.1 iPS.2 ESC.1 ESC_BLA13 MASC.2 MASC.1 PGC_E13d5_LBJ13.2 PGC_E13d5_LBJ13.1 PGC_E13d5_LBJ13.3 PGC_E12d5_LBJ13.3 PGC_E12d5_LBJ13.2 PGC_E14d5_LBJ13.3 PGC_E14d5_LBJ13.1 PGC_E14d5_LBJ13.2 PGC_E12d5_LBJ13.1 MEF_SY12.2 MEF_SY12.1 MEF HSC.2 HSC.1
Height 3.0 2.5 2.0 1.5 1.0 0.5 0.0
MEFHSC_1HSC_2
PGC_E12d5_LBJ13_1PGC_E14d5_LBJ13_2PGC_E14d5_LBJ13_1PGC_E14d5_LBJ13_3PGC_E13d5_LBJ13_3PGC_E13d5_LBJ13_1PGC_E13d5_LBJ13_2PGC_E12d5_LBJ13_2PGC_E12d5_LBJ13_3
SSC_OG1SSC_B6
SSC_OG2SSC_VG
MASC_Rosa3ESC_129mix
MASC_Rosa5MASC_VG5MASC_VG8
iPS1iPS4
ESC_OGMASC_OG1MASC_OG2
PS_LBJ13RS_LBJ13
PS_SHS15_1PS_SHS15_2RS_SHS15_1RS_SHS15_2
RS_ES13_1RS_ES13_2
0.00.51.01.52.02.5
Clu
ster
Den
drog
ram
hclu
st (*
, "co
mpl
ete"
)di
st(c
or(n
a.om
it(TS
S.ex
prs.
chip
[, −c
(1:1
0, 1
3, 2
4:27
, 30,
32,
33,
48:
50, 5
6:14
1)]))
)
Height
RS_ES13.2 RS_ES13.1 RS_SHS15.2 RS_SHS15.1 PS_SHS15.2 PS_SHS15.1 RS_LBJ13 PS_LBJ13 MASC.2 MASC.1 ESC.1 iPS.2 iPS.1 MASC.4 MASC.3 MASC.5 ESC.2 MASC.6 SSC.4 SSC.2 SSC.3 SSC.1 PGC_E12d5_LBJ13.3 PGC_E12d5_LBJ13.2 PGC_E13d5_LBJ13.2 PGC_E13d5_LBJ13.1 PGC_E13d5_LBJ13.3 PGC_E14d5_LBJ13.3 PGC_E14d5_LBJ13.1 PGC_E14d5_LBJ13.2 PGC_E12d5_LBJ13.1 HSC.2 HSC.1 MEF
MEFHSC_1HSC_2
PGC_E12d5_LBJ13_1PGC_E14d5_LBJ13_2PGC_E14d5_LBJ13_1PGC_E14d5_LBJ13_3PGC_E13d5_LBJ13_3PGC_E13d5_LBJ13_1PGC_E13d5_LBJ13_2PGC_E12d5_LBJ13_2PGC_E12d5_LBJ13_3
SSC_OG1SSC_B6
SSC_OG2SSC_VG
MASC_Rosa3ESC_129mixMASC_Rosa5
MASC_VG5MASC_VG8
iPS1iPS4
ESC_OGMASC_OG1MASC_OG2
PS_LBJ13RS_LBJ13
PS_SHS15_1PS_SHS15_2RS_SHS15_1RS_SHS15_2
RS_ES13_1RS_ES13_2
0.00.51.01.52.02.5
Cluster Dendrogram
hclust (*, "complete")
dist(cor(na.omit(TSS.exprs.chip[, −c(1:10, 13, 24:27, 30, 32,
33, 48:50, 56:141)])))
HeightHeight
2.5 2.0 1.5 1.0 0.5 0.0
Transcriptome (RNA-seq)
Update Figure S1
iPS1_H3d3OSKM.prim
PGC_E12d5_LBJ13.prim
PGC_E13d5_LBJ13.prim
PGC_E14d5_LBJ13.prim
HFTAC.prim
qHFSC.prim
aHFSC.prim
LSK_AM10.prim
MAC.prim
HSC_1.prim
HSC_2.prim
AGSC_HSS14.prim
PS_SHS15.prim
RS_SHS15.prim
Sperm_ES13.prim
RS_LBJ13.prim
PS_LBJ13.prim
RS_ES13.prim
MASC_OG_1_2.prim
MASC_OG_3.prim
MASC_Rosa.prim
iPS_MCV81_MTS08.prim
ESC_MTS07.prim
ESC_WJA12.prim
ESC_H3d3HA_BLA13.prim
iPS4_H3d3OSKM.prim
SSC_B6.prim
SSC_VG.prim
SSC_OG.prim
GS_SHS15.prim
MEF_H3d3OSKM_D0.prim
MEF_MTS07.prim
MEF_MTS08.prim
PiPS_MCV6_MTS08.prim
PiPS_MCV8_MTS08.prim
0.00.51.01.5
Clu
ster
Den
drog
ram
hcl
ust
(*,
"co
mp
lete
")d
ist(
cor(
na
.om
it(T
SS
.exp
rs.c
hip
[, −
c(1
:99
, 1
03
, 1
04
, 1
09
, 1
10
,
1
28
, 1
32
, 1
40
)]))
)
Height
iPS1_H3d3OSKM.prim
PGC_E12d5_LBJ13.prim
PGC_E13d5_LBJ13.prim
PGC_E14d5_LBJ13.prim
HFTAC.prim
qHFSC.prim
aHFSC.prim
LSK_AM10.prim
MAC.prim
HSC_1.prim
HSC_2.prim
AGSC_HSS14.prim
PS_SHS15.prim
RS_SHS15.prim
Sperm_ES13.prim
RS_LBJ13.prim
PS_LBJ13.prim
RS_ES13.prim
MASC_OG_1_2.prim
MASC_OG_3.prim
MASC_Rosa.prim
iPS_MCV81_MTS08.prim
ESC_MTS07.prim
ESC_WJA12.prim
ESC_H3d3HA_BLA13.prim
iPS4_H3d3OSKM.prim
SSC_B6.prim
SSC_VG.prim
SSC_OG.prim
GS_SHS15.prim
MEF_H3d3OSKM_D0.prim
MEF_MTS07.prim
MEF_MTS08.prim
PiPS_MCV6_MTS08.prim
PiPS_MCV8_MTS08.prim
0.00.51.01.5
Cluster Dendrogram
hclust (*, "complete")
dist(cor(na.omit(TSS.exprs.chip[, −c(1:99, 103, 104, 109, 110,
128, 132, 140)])))
Height
PiPS_MCV8_MTS08 PiPS_MCV6_MTS08 MEF_MTS08 MEF_MTS07 MEF SSC_SHS15 SSC.1 SSC.3 SSC.2 iPS.2 ESC_BLA13 ESC_WJA12 ESC_MTS07 iPS_MCV81_MTS08 MASC.3 MASC.2 MASC.1 RS_ES13 PS_LBJ13 RS_LBJ13 Sperm_ES13 RS_SHS15 PS_SHS15 AGSC_HSS14 HSC.2 HSC.1 Macrophage LSK_AM10 aHFSC_LWH11 qHFSC_LWH11 HFTAC_LWH11 PGC_E14d5_LBJ13 PGC_E13d5_LBJ13 PGC_E12d5_LBJ13 iPS.1
Height 1.5 1.0 0.5 0.0
Epigenome at Promoters (PRIM) Epigenome at Promoters (PRIM)
iPS1_H3d3OSKM.prim
PGC_E12d5_LBJ13.prim
PGC_E13d5_LBJ13.prim
PGC_E14d5_LBJ13.prim
AGSC_HSS14.prim
HFTAC.prim
qHFSC.prim
aHFSC.prim
LSK_AM10.prim
MAC.prim
HSC_1.prim
HSC_2.prim
PS_SHS15.prim
RS_SHS15.prim
Sperm_ES13.prim
RS_LBJ13.prim
PS_LBJ13.prim
RS_ES13.prim
MASC_OG_1_2.prim
MASC_OG_3.prim
MASC_Rosa.prim
ESC_MTS07.prim
ESC_WJA12.prim
ESC_H3d3HA_BLA13.prim
iPS4_H3d3OSKM.prim
SSC_OG.prim
SSC_B6.prim
SSC_VG.prim
MEF_H3d3OSKM_D0.prim
PiPS_MCV6_MTS08.prim
PiPS_MCV8_MTS08.prim
0.00.20.40.60.81.01.21.4
Cluster Dendrogram
hclust (*, "complete")
dist(cor(na.omit(TSS.exprs.chip[, −c(1:99, 103, 104, 109, 110,
117:119, 128, 132, 134, 140)])))
Height
iPS1_H3d3OSKM.prim
PGC_E12d5_LBJ13.prim
PGC_E13d5_LBJ13.prim
PGC_E14d5_LBJ13.prim
AGSC_HSS14.prim
HFTAC.prim
qHFSC.prim
aHFSC.prim
LSK_AM10.prim
MAC.prim
HSC_1.prim
HSC_2.prim
PS_SHS15.prim
RS_SHS15.prim
Sperm_ES13.prim
RS_LBJ13.prim
PS_LBJ13.prim
RS_ES13.prim
MASC_OG_1_2.prim
MASC_OG_3.prim
MASC_Rosa.prim
ESC_MTS07.prim
ESC_WJA12.prim
ESC_H3d3HA_BLA13.prim
iPS4_H3d3OSKM.prim
SSC_OG.prim
SSC_B6.prim
SSC_VG.prim
MEF_H3d3OSKM_D0.prim
PiPS_MCV6_MTS08.prim
PiPS_MCV8_MTS08.prim
0.00.20.40.60.81.01.21.4
Clu
ster
Den
drog
ram
hcl
ust
(*,
"co
mple
te")
dis
t(co
r(na.o
mit(
TS
S.e
xprs
.chip
[, −
c(1:9
9, 103, 104, 109, 110,
117:1
19, 128, 132, 134, 140)]
)))
Height
PiPS_MCV8_MTS08 PiPS_MCV6_MTS08 MEF SSC.3 SSC.2 SSC.1 iPS.2 ESC_BLA13 ESC_WJA12 ESC_MTS07 MASC.3 MASC.2 MASC.1 RS_ES13 PS_LBJ13 RS_LBJ13 Sperm_ES13 RS_SHS15 PS_SHS15 HSC.2 HSC.1 Macrophage LSK_AM10 aHFSC_LWH11 qHFSC_LWH11 HFTAC_LWH11 AGSC_HSS14 PGC_E14d5_LBJ13 PGC_E13d5_LBJ13 PGC_E12d5_LBJ13 iPS.1
Height 1.4 1.2 1.0 0.8 0.6 0.4 0.2 0.0
B
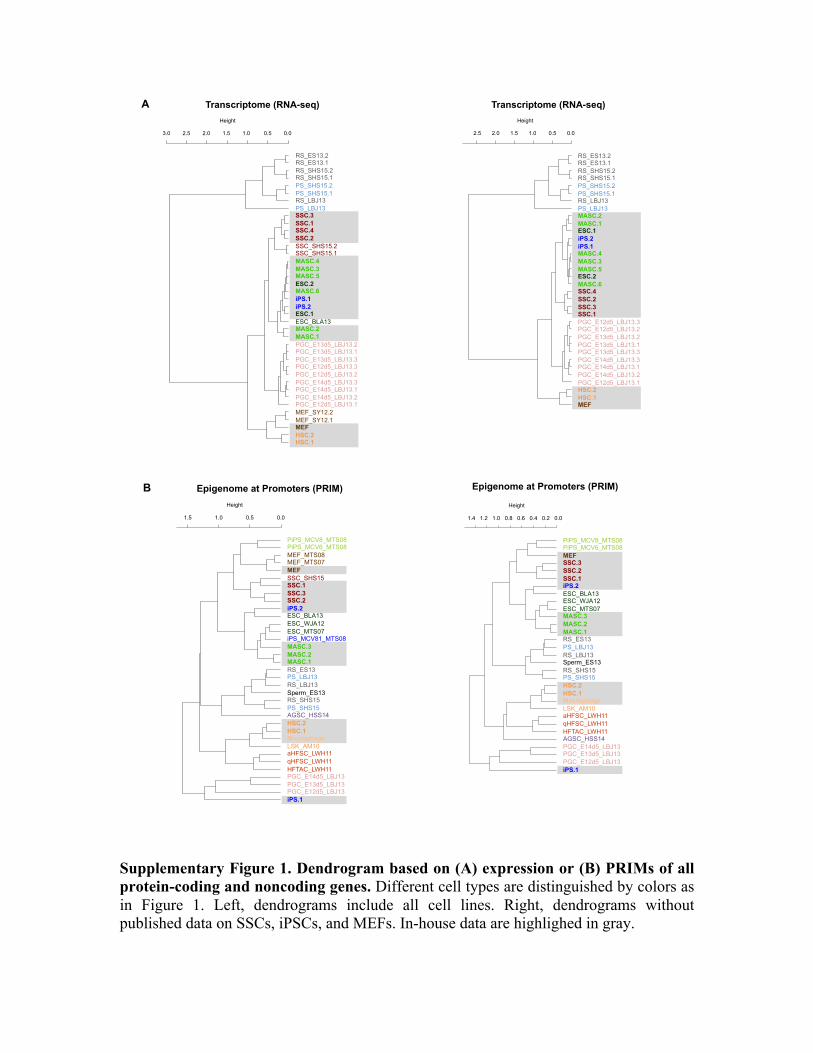
Supplementary Figure 2. 3D PCA plot based on (A) expression or (B) PRIMs of all protein-coding and noncoding genes. For SSCs, iPSCs, and MEFs, only in-house data were analyzed. Different cell types are distinguished by colors as in Figure 1.
Figure S1
-0.2
0.4
0.2
0
00.1
-0.1-0.2
-0.3
0.12 0.14 0.16 0.18
HSC.1 HSC.2
MEF
SSC.1/2/4 SSC.3
iPS.1
iPS.2 MASC.3/4/5/6 MASC.2
MASC.1
ESC.1
ESC.2
PC3
PC1 PC2
Transcriptome (RNA-seq)
A B
0.14
-0.1
0
-0.2
0.4
0.1
0.2
0.3
0.150.160.170.180.190.2
0.2-0.2 0
PC3
PC1
PC2
Epigenome at Promoters (PRIM)
SSC.3 SSC.2
SSC.1 PiPS_MCV6 PiPS_MCV8
HSC.2 HSC.1 MEF
iPS.1
iPS.2 MASC.1 MASC.3
MASC.2
ESC_MTS07 ESC_WJA12
ESC_BLA13
020
4060
8010
0
ESCMASCPiPSiPSMEFHSCMacrophageq/a−HFSC, HFTACSSCPGCAGSCPachytene SpermatocyteRound SpermatidSperm
ESC MASC PiPS iPS
020
4060
8010
0
ESCMASCPiPSiPSMEFHSCMacrophageq/a−HFSC, HFTACSSCPGCAGSCPachytene SpermatocyteRound SpermatidSperm
SSC PGC AGSC PS RS Spermatozoon
020
4060
8010
0
ESCMASCPiPSiPSMEFHSCMacrophageq/a−HFSC, HFTACSSCPGCAGSCPachytene SpermatocyteRound SpermatidSperm
MEF HSC, LSK Macrophage q/a-HFSC, HFTAC
Pluripotent Germ Cells Somatic Cells / Multipotent Cells
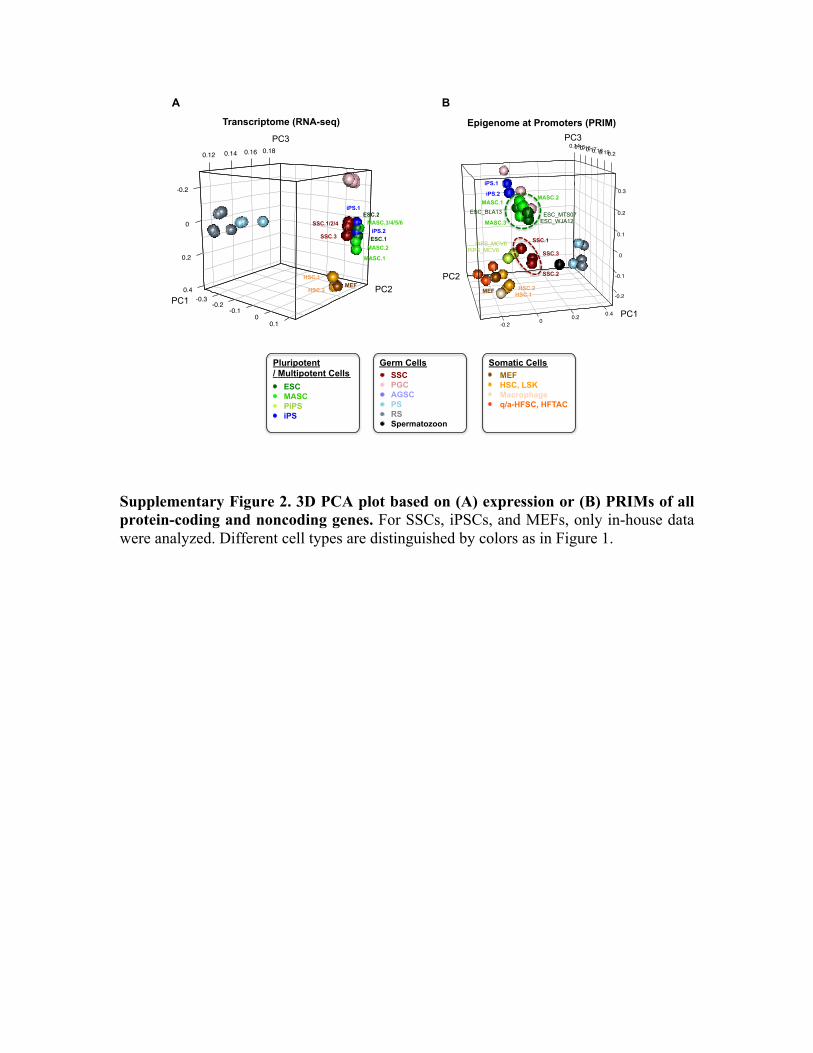
Supplementary Figure 3. Correlation coefficients between in-house and published cell lines. (A) Expression of all protein-coding and noncoding genes. (B) PRIMs of all protein-coding and noncoding gene promoters with K4me3 and/or K27me3 modification. Black boxes denote data produced in-house.
1 0.93
1
0.96
0.92
1
0.94
0.95
0.93
1
0.9
0.88
0.91
0.89
1
0.9
0.88
0.91
0.89
0.97
1
0.88
0.86
0.89
0.87
0.89
0.89
1
0.88
0.86
0.88
0.86
0.86
0.86
0.97
1
0.86
0.88
0.86
0.87
0.86
0.86
0.95
0.95
1
0.86
0.88
0.86
0.87
0.86
0.86
0.94
0.95
0.98
1
0.87
0.88
0.86
0.87
0.86
0.86
0.94
0.94
0.98
0.98
1
0.87
0.89
0.87
0.87
0.87
0.87
0.95
0.95
0.98
0.97
0.98
1
0.88
0.87
0.88
0.87
0.87
0.87
0.97
0.96
0.96
0.96
0.96
0.96
1
0.86
0.88
0.86
0.86
0.86
0.86
0.94
0.94
0.98
0.98
0.97
0.97
0.96
1
0.84
0.87
0.83
0.85
0.85
0.85
0.91
0.91
0.96
0.96
0.95
0.95
0.93
0.95
1
0.86
0.88
0.85
0.86
0.85
0.85
0.93
0.94
0.96
0.96
0.96
0.96
0.96
0.96
0.95
1
0.87
0.88
0.86
0.87
0.87
0.87
0.95
0.95
0.96
0.96
0.96
0.96
0.96
0.95
0.95
0.98
1
SSC.1
SSC.2
SSC.3
SSC.4
SSC_SHS15.1
SSC_SHS15.2
MASC.1
MASC.2
MASC.3
MASC.4
MASC.5
MASC.6
ESC.1
ESC.2
ESC_BLA13
iPS.1
iPS.2
SSC.1SSC.2SSC.3SSC.4
SSC_SHS15.1
SSC_SHS15.2
MASC.1
MASC.2
MASC.3
MASC.4
MASC.5
MASC.6ESC.1ESC.2
ESC_BLA13iPS.1iPS.2
0.00 0.25 0.50 0.75 1.00
PearsonCorrelation
SSC
MASC
ESC
iPS
Gene Expression (RNA-seq)
1 0.93
1
0.91
0.91
1
0.9
0.84
0.86
1
0.84
0.81
0.8
0.79
1
0.76
0.79
0.75
0.65
0.85
1
0.75
0.73
0.74
0.77
0.76
0.68
1
0.82
0.83
0.81
0.76
0.85
0.85
0.77
1
0.87
0.84
0.83
0.86
0.88
0.8
0.84
0.9
1
0.81
0.8
0.79
0.81
0.86
0.8
0.82
0.88
0.95
1
0.68
0.69
0.67
0.65
0.74
0.73
0.67
0.77
0.78
0.79
1
0.84
0.81
0.8
0.8
0.86
0.81
0.79
0.87
0.9
0.88
0.8
1
0.84
0.83
0.81
0.82
0.86
0.8
0.8
0.89
0.93
0.9
0.76
0.88
1
0.78
0.78
0.78
0.74
0.76
0.73
0.71
0.78
0.8
0.77
0.66
0.77
0.77
1
0.82
0.81
0.81
0.78
0.78
0.73
0.73
0.8
0.82
0.77
0.67
0.8
0.8
0.82
1
SSC.1
SSC.2
SSC.3
SSC_SHS15
MASC.1
MASC.2
MASC.3
ESC_MTS07
ESC_WJA12
ESC_BLA13
iPS.1
iPS.2
iPS_MCV81_MTS08
PiPS_MCV6_MTS08
PiPS_MCV8_MTS08
SSC.1SSC.2SSC.3
SSC_SHS15
MASC.1
MASC.2
MASC.3
ESC_MTS07
ESC_WJA12
ESC_BLA13iPS.1iPS.2
iPS_MCV81_MTS08
PiPS_MCV6_MTS08
PiPS_MCV8_MTS08
0.00 0.25 0.50 0.75 1.00
PearsonCorrelation
SSC
MASC
iPS
PRIM=log2(H3K4me3/H3K27me3)
A B
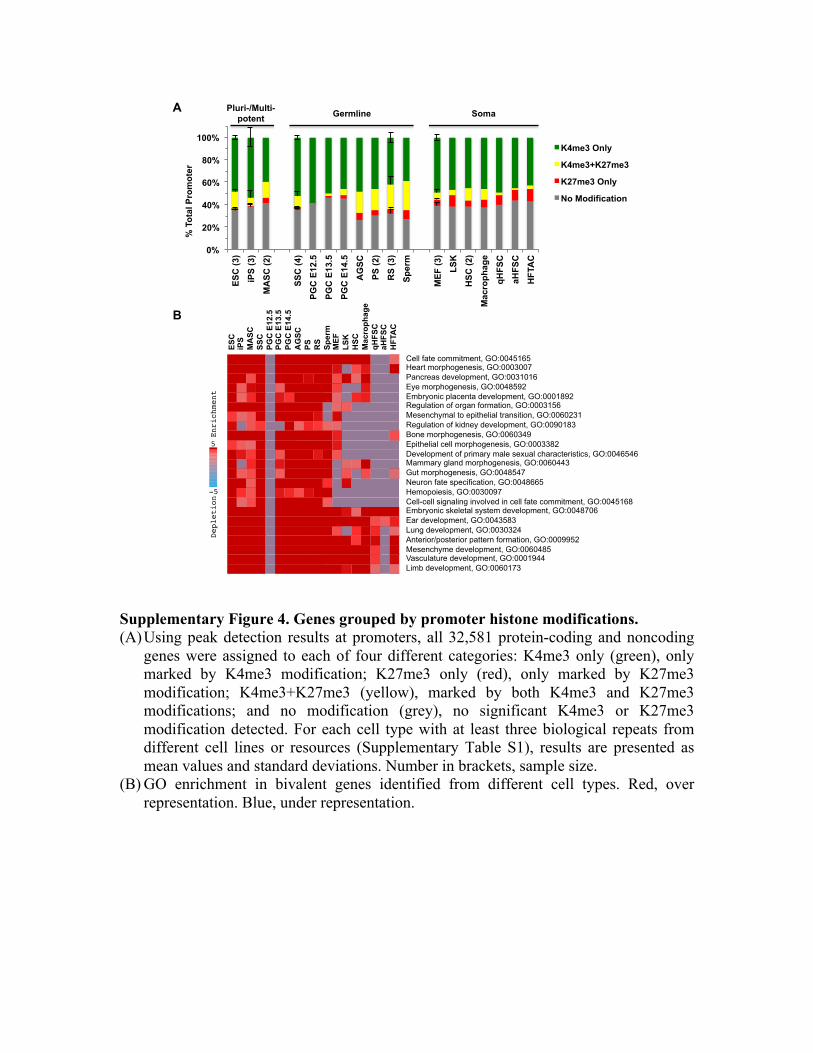
Supplementary Figure 4. Genes grouped by promoter histone modifications. (A) Using peak detection results at promoters, all 32,581 protein-coding and noncoding
genes were assigned to each of four different categories: K4me3 only (green), only marked by K4me3 modification; K27me3 only (red), only marked by K27me3 modification; K4me3+K27me3 (yellow), marked by both K4me3 and K27me3 modifications; and no modification (grey), no significant K4me3 or K27me3 modification detected. For each cell type with at least three biological repeats from different cell lines or resources (Supplementary Table S1), results are presented as mean values and standard deviations. Number in brackets, sample size.
(B) GO enrichment in bivalent genes identified from different cell types. Red, over representation. Blue, under representation.
0%
20%
40%
60%
80%
100%
ESC
(3)
iPS
(3)
MA
SC (2
)
SSC
(4)
PGC
E12
.5
PGC
E13
.5
PGC
E14
.5
AG
SC
PS (2
)
RS
(3)
Sper
m
MEF
(3)
LSK
HSC
(2)
Mac
roph
age
qHFS
C
aHFS
C
HFT
AC
% T
otal
Pro
mot
er
K4me3 Only
K4me3+K27me3
K27me3 Only
No Modification
A B
Germline Soma Pluri-/Multi-potent
ESC
iP
S M
ASC
SS
C
PGC
E12
.5
PGC
E13
.5
PGC
E14
.5
AG
SC
PS
RS
Sper
m
MEF
LS
K
HSC
M
acro
phag
e qH
FSC
aH
FSC
H
FTA
C
ESC
iPS
MASC
SSC
PGC_
E12d
PGC_
E13d
PGC_
E14d
AGSC
PS RS Sper
mME
FLS
KHS
CMA
CqH
FSC
aHFS
CHF
TAC
Cell fate commitment, GO:0045165
Heart morphogenesis, GO:0003007
Pancreas development, GO:0031016
Eye morphogenesis, GO:0048592
Embryonic placenta development, GO:0001892
Regulation of organ formation, GO:0003156
Mesenchymal to epithelial transition, GO:0060231
Regulation of kidney development, GO:0090183
Bone morphogenesis, GO:0060349
Epithelial cell morphogenesis, GO:0003382
Development of primary male sexual characteristics, GO:0046546
Mammary gland morphogenesis, GO:0060443
Gut morphogenesis, GO:0048547
Neuron fate specification, GO:0048665
Hemopoiesis, GO:0030097
Cell-cell signaling involved in cell fate commitment, GO:0045168
Embryonic skeletal system development, GO:0048706
Ear development, GO:0043583
Lung development, GO:0030324
Anterior/posterior pattern formation, GO:0009952
Mesenchyme development, GO:0060485
Vasculature development, GO:0001944
Limb development, GO:0060173
5
Enri
chme
nt
-5
Depl
etio
n
Cell fate commitment, GO:0045165 Heart morphogenesis, GO:0003007 Pancreas development, GO:0031016 Eye morphogenesis, GO:0048592 Embryonic placenta development, GO:0001892 Regulation of organ formation, GO:0003156 Mesenchymal to epithelial transition, GO:0060231 Regulation of kidney development, GO:0090183 Bone morphogenesis, GO:0060349 Epithelial cell morphogenesis, GO:0003382 Development of primary male sexual characteristics, GO:0046546 Mammary gland morphogenesis, GO:0060443 Gut morphogenesis, GO:0048547 Neuron fate specification, GO:0048665 Hemopoiesis, GO:0030097 Cell-cell signaling involved in cell fate commitment, GO:0045168 Embryonic skeletal system development, GO:0048706 Ear development, GO:0043583 Lung development, GO:0030324 Anterior/posterior pattern formation, GO:0009952 Mesenchyme development, GO:0060485 Vasculature development, GO:0001944 Limb development, GO:0060173
ESC
iPS
MASC
SSC
PGC_E12d
PGC_E13d
PGC_E14d
AGSC
PSRSSperm
MEF
LSK
HSC
MAC
qHFSC
aHFSC
HFTAC
Cell fate commitment, GO:0045165
Heart morphogenesis, GO:0003007
Pancreas development, GO:0031016
Eye morphogenesis, GO:0048592
Embryonic placenta development, GO:0001892
Regulation of organ formation, GO:0003156
Mesenchymal to epithelial transition, GO:0060231
Regulation of kidney development, GO:0090183
Bone morphogenesis, GO:0060349
Epithelial cell morphogenesis, GO:0003382
Development of primary male sexual characteristics, GO:0046546
Mammary gland morphogenesis, GO:0060443
Gut morphogenesis, GO:0048547
Neuron fate specification, GO:0048665
Hemopoiesis, GO:0030097
Cell-cell signaling involved in cell fate commitment, GO:0045168
Embryonic skeletal system development, GO:0048706
Ear development, GO:0043583
Lung development, GO:0030324
Anterior/posterior pattern formation, GO:0009952
Mesenchyme development, GO:0060485
Vasculature development, GO:0001944
Limb development, GO:0060173
5
Enrichment
-5
Depletion
Figure S2
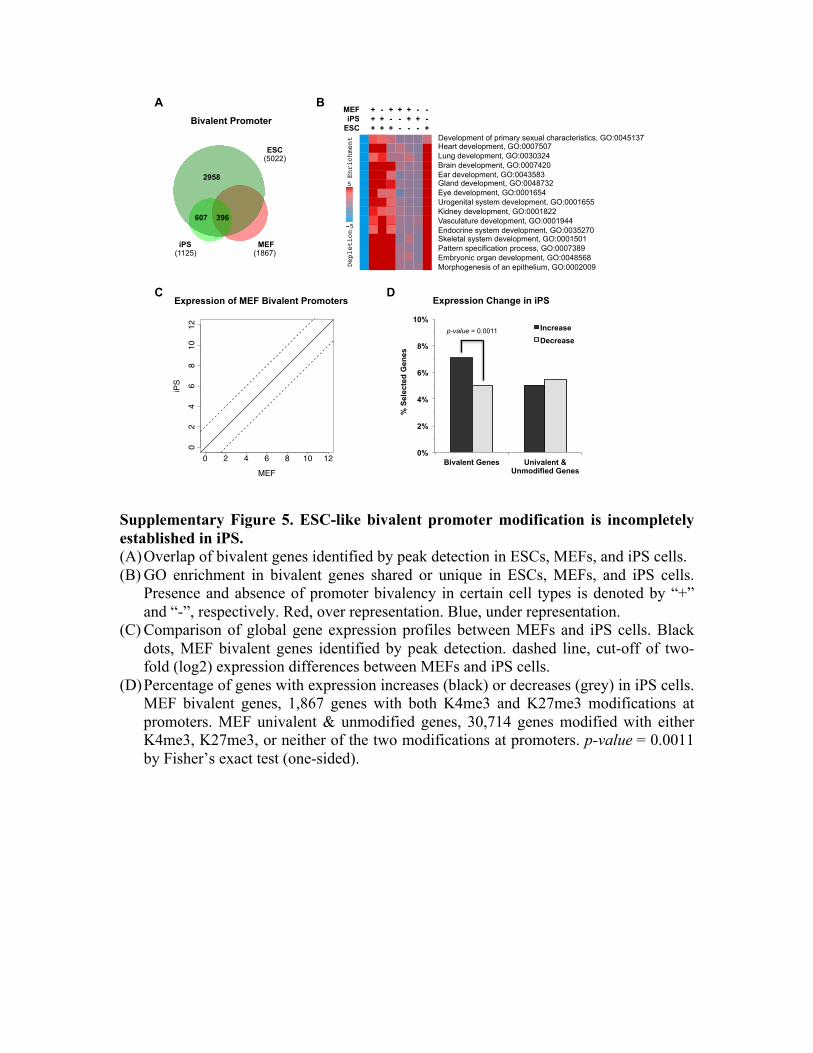
Supplementary Figure 5. ESC-like bivalent promoter modification is incompletely established in iPS. (A) Overlap of bivalent genes identified by peak detection in ESCs, MEFs, and iPS cells. (B) GO enrichment in bivalent genes shared or unique in ESCs, MEFs, and iPS cells.
Presence and absence of promoter bivalency in certain cell types is denoted by “+” and “-”, respectively. Red, over representation. Blue, under representation.
(C) Comparison of global gene expression profiles between MEFs and iPS cells. Black dots, MEF bivalent genes identified by peak detection. dashed line, cut-off of two-fold (log2) expression differences between MEFs and iPS cells.
(D) Percentage of genes with expression increases (black) or decreases (grey) in iPS cells. MEF bivalent genes, 1,867 genes with both K4me3 and K27me3 modifications at promoters. MEF univalent & unmodified genes, 30,714 genes modified with either K4me3, K27me3, or neither of the two modifications at promoters. p-value = 0.0011 by Fisher’s exact test (one-sided).
MEF + - + + + - - iPS + + - - + + -
ESC + + + - - - +
A B
iPS MEF (1125) (1867)
ESC (5022)
607 396
2958
Bivalent Promoter
0%
2%
4%
6%
8%
10%
Bivalent Genes Univalent & Unmodified Genes
% S
elec
ted
Gen
es
Expression Change in iPS
Increase Decrease
p-value = 0.0011
0 2 4 6 8 10 12
02
46
810
12
MEF
iPS
Expression of MEF Bivalent Promoters
Development of primary sexual characteristics, GO:0045137 Heart development, GO:0007507 Lung development, GO:0030324 Brain development, GO:0007420 Ear development, GO:0043583 Gland development, GO:0048732 Eye development, GO:0001654 Urogenital system development, GO:0001655 Kidney development, GO:0001822 Vasculature development, GO:0001944 Endocrine system development, GO:0035270 Skeletal system development, GO:0001501 Pattern specification process, GO:0007389 Embryonic organ development, GO:0048568 Morphogenesis of an epithelium, GO:0002009
X0
X1
X2
X3
X4
X5
X6
X7
Development of primary sexual characteristics, GO:0045137
Heart development, GO:0007507
Lung development, GO:0030324
Brain development, GO:0007420
Ear development, GO:0043583
Gland development, GO:0048732
Eye development, GO:0001654
Urogenital system development, GO:0001655
Kidney development, GO:0001822
Vasculature development, GO:0001944
Endocrine system development, GO:0035270
Skeletal system development, GO:0001501
Pattern specification process, GO:0007389
Embryonic organ development, GO:0048568
Morphogenesis of an epithelium, GO:0002009
5
Enrichment
-5
Depletion
X0
X1
X2
X3
X4
X5
X6
X7
Development of primary sexual characteristics, GO:0045137
Endocrine system development, GO:0035270
Morphogenesis of an epithelium, GO:0002009
Gland development, GO:0048732
Ear development, GO:0043583
Lung development, GO:0030324
Eye development, GO:0001654
Urogenital system development, GO:0001655
Heart development, GO:0007507
Brain development, GO:0007420
Vasculature development, GO:0001944
Kidney development, GO:0001822
Pattern specification process, GO:0007389
Embryonic organ development, GO:0048568
Skeletal system development, GO:0001501
5
Enrichment
-5
Depletion
Figure S3
C D
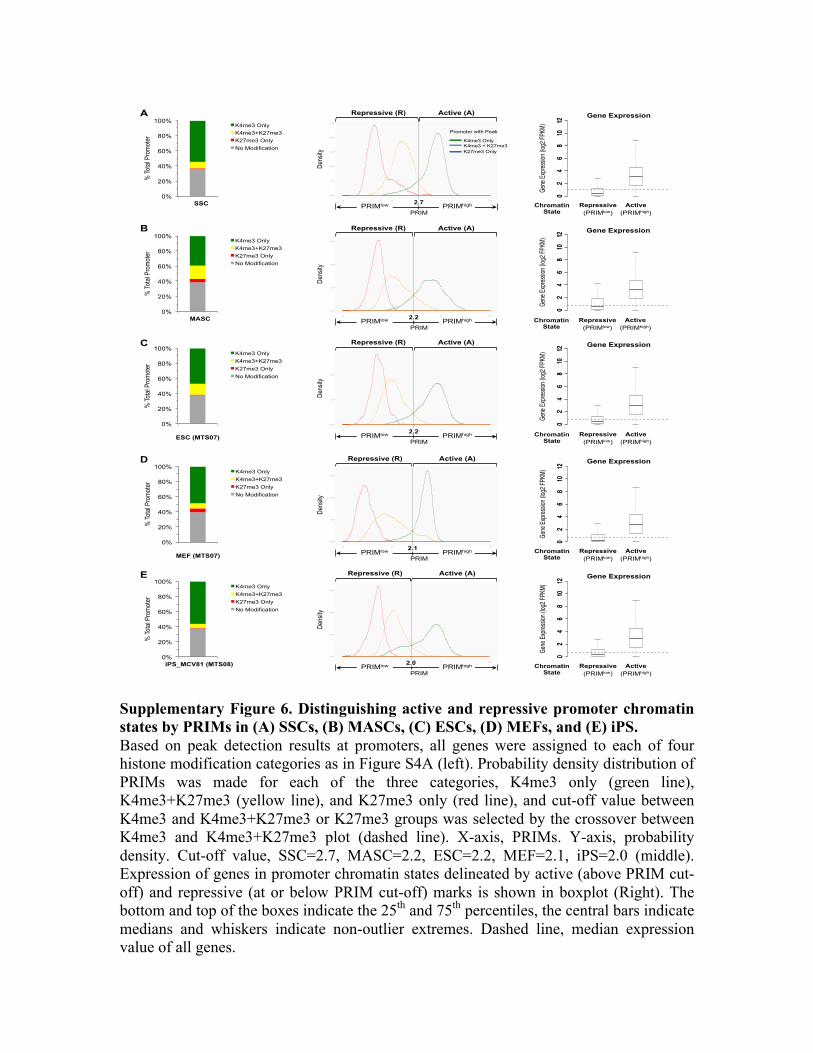
Supplementary Figure 6. Distinguishing active and repressive promoter chromatin states by PRIMs in (A) SSCs, (B) MASCs, (C) ESCs, (D) MEFs, and (E) iPS. Based on peak detection results at promoters, all genes were assigned to each of four histone modification categories as in Figure S4A (left). Probability density distribution of PRIMs was made for each of the three categories, K4me3 only (green line), K4me3+K27me3 (yellow line), and K27me3 only (red line), and cut-off value between K4me3 and K4me3+K27me3 or K27me3 groups was selected by the crossover between K4me3 and K4me3+K27me3 plot (dashed line). X-axis, PRIMs. Y-axis, probability density. Cut-off value, SSC=2.7, MASC=2.2, ESC=2.2, MEF=2.1, iPS=2.0 (middle). Expression of genes in promoter chromatin states delineated by active (above PRIM cut-off) and repressive (at or below PRIM cut-off) marks is shown in boxplot (Right). The bottom and top of the boxes indicate the 25th and 75th percentiles, the central bars indicate medians and whiskers indicate non-outlier extremes. Dashed line, median expression value of all genes.
0%
20%
40%
60%
80%
100%
MASC
% To
tal P
rom
oter
K4me3 Only K4me3+K27me3 K27me3 Only No Modification
0%
20%
40%
60%
80%
100%
SSC
% To
tal P
rom
oter
K4me3 Only K4me3+K27me3 K27me3 Only No Modification
0%
20%
40%
60%
80%
100%
ESC (MTS07)
% To
tal P
rom
oter
K4me3 Only K4me3+K27me3 K27me3 Only No Modification
02
46
810
12
Gene
Expre
ssion
(log2
FPKM
)
02
46
810
120
24
68
1012
Gene
Expre
ssion
(log2
FPKM
)
02
46
810
120
24
68
1012
Gene
Expre
ssion
(log2
FPKM
)
02
46
810
12
A
B
C
Gene Expression
Repressive (PRIMlow)
Active (PRIMhigh)
Chromatin State
Gene Expression
Repressive (PRIMlow)
Active (PRIMhigh)
Chromatin State
Gene Expression
Repressive (PRIMlow)
Active (PRIMhigh)
Chromatin State
0.0
0.1
0.2
0.3
0.4
0.5
−5 0 5 10
K4K4K27K27
Dens
ity
Repressive (R) Active (A)
Promoter with Peak
K4me3 Only K4me3 + K27me3 K27me3 Only
2.7
PRIM
0.0
0.2
0.4
0.6
−5 0 5 10
K4K4K27K27
Repressive (R) Active (A)
Dens
ity
2.2
PRIM
0.0
0.2
0.4
−5 0 5 10
K4K4K27K27
Repressive (R) Active (A)
Dens
ity
2.2
PRIM PRIMlow PRIMhigh
PRIMlow PRIMhigh
PRIMlow PRIMhigh
0%
20%
40%
60%
80%
100%
MEF (MTS07)
% To
tal P
rom
oter
K4me3 Only K4me3+K27me3 K27me3 Only No Modification
0%
20%
40%
60%
80%
100%
iPS_MCV81 (MTS08)
% To
tal P
rom
oter
K4me3 Only K4me3+K27me3 K27me3 Only No Modification
02
46
810
12
Gene
Expre
ssion
(log2
FPKM
)
02
46
810
120
24
68
1012
Gene
Expre
ssion
(log2
FPKM
)
02
46
810
12
D
E
Gene Expression
Repressive (PRIMlow)
Active (PRIMhigh)
Chromatin State
Gene Expression
Repressive (PRIMlow)
Active (PRIMhigh)
Chromatin State
0.0
0.2
0.4
0.6
−5 0 5 10
K4K4K27K27
Dens
ity
Repressive (R) Active (A)
2.1
PRIM
0.0
0.2
0.4
0.6
−5 0 5 10
K4K4K27K27De
nsity
Repressive (R) Active (A)
2.0
PRIM PRIMlow PRIMhigh
PRIMlow PRIMhigh
Figure S4
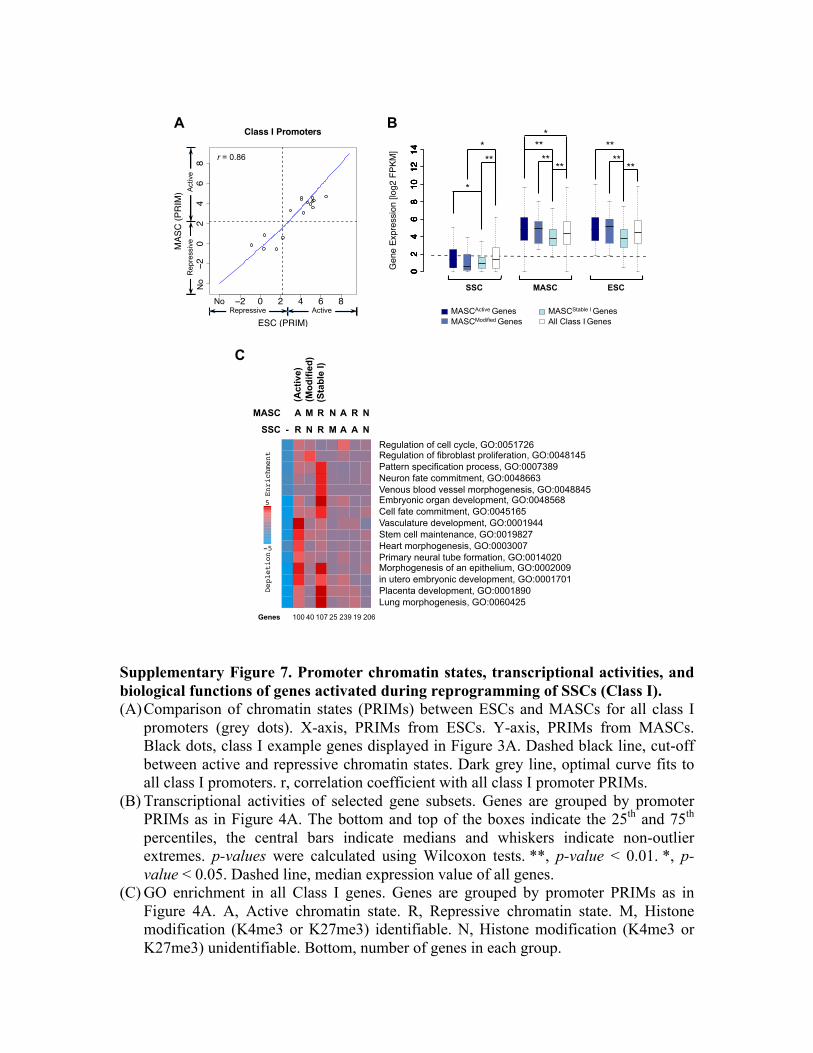
Supplementary Figure 7. Promoter chromatin states, transcriptional activities, and biological functions of genes activated during reprogramming of SSCs (Class I). (A) Comparison of chromatin states (PRIMs) between ESCs and MASCs for all class I
promoters (grey dots). X-axis, PRIMs from ESCs. Y-axis, PRIMs from MASCs. Black dots, class I example genes displayed in Figure 3A. Dashed black line, cut-off between active and repressive chromatin states. Dark grey line, optimal curve fits to all class I promoters. r, correlation coefficient with all class I promoter PRIMs.
(B) Transcriptional activities of selected gene subsets. Genes are grouped by promoter PRIMs as in Figure 4A. The bottom and top of the boxes indicate the 25th and 75th percentiles, the central bars indicate medians and whiskers indicate non-outlier extremes. p-values were calculated using Wilcoxon tests. **, p-value < 0.01. *, p-value < 0.05. Dashed line, median expression value of all genes.
(C) GO enrichment in all Class I genes. Genes are grouped by promoter PRIMs as in Figure 4A. A, Active chromatin state. R, Repressive chromatin state. M, Histone modification (K4me3 or K27me3) identifiable. N, Histone modification (K4me3 or K27me3) unidentifiable. Bottom, number of genes in each group.
C
X0 X1 X2 X3 X4 X5 X6 X7Mesodermal cell fate commitment, GO:0001710Stem cell maintenance, GO:0019827Phosphate metabolic process, GO:0006796in utero embryonic development, GO:0001701Regulation of cell cycle, GO:0051726Positive regulation of ossification, GO:0045778Neuron development, GO:0048666Cell morphogenesis involved in differentiation, GO:0000904Respiratory system development, GO:0060541Blastoderm segmentation, GO:0007350Negative regulation of cell differentiation, GO:0045596Embryonic pattern specification, GO:0009880Vasculature development, GO:0001944Embryonic organ development, GO:0048568Morphogenesis of an epithelium, GO:0002009
5
Enri
chme
nt
-5
Depl
etio
n
MASC
SSC
A
R
M
N
R
R
N
M
A
A
R
A
N
N
-
Genes 100 40 107 25 239 19 206
(Mod
ified
) (S
tabl
e I)
(Act
ive)
X0
X1
X2
X3
X4
X5
X6
X7
Regulation of cell cycle, GO:0051726
Regulation of fibroblast proliferation, GO:0048145
Pattern specification process, GO:0007389
Neuron fate commitment, GO:0048663
Venous blood vessel morphogenesis, GO:0048845
Embryonic organ development, GO:0048568
Cell fate commitment, GO:0045165
Vasculature development, GO:0001944
Stem cell maintenance, GO:0019827
Heart morphogenesis, GO:0003007
Primary neural tube formation, GO:0014020
Morphogenesis of an epithelium, GO:0002009
in utero embryonic development, GO:0001701
Placenta development, GO:0001890
Lung morphogenesis, GO:0060425
5
Enrichment
-5
Depletion
Regulation of cell cycle, GO:0051726 Regulation of fibroblast proliferation, GO:0048145 Pattern specification process, GO:0007389 Neuron fate commitment, GO:0048663 Venous blood vessel morphogenesis, GO:0048845 Embryonic organ development, GO:0048568 Cell fate commitment, GO:0045165 Vasculature development, GO:0001944 Stem cell maintenance, GO:0019827 Heart morphogenesis, GO:0003007 Primary neural tube formation, GO:0014020 Morphogenesis of an epithelium, GO:0002009 in utero embryonic development, GO:0001701 Placenta development, GO:0001890 Lung morphogenesis, GO:0060425
−4 −2 0 2 4 6 8
−4−2
02
46
8
Class I Promoters
ESC (PRIM)
MAS
C (P
RIM
)
No
No
r = 0.86
Repressive Active
Rep
ress
ive
Act
ive
Figure S7 A B
1.0 1.5 2.0 2.5 3.0
02
46
810
1214
SSC_avg MASC_avg ESC_avg
02
46
810
1214
Gen
e Ex
pres
sion
[log
2 FP
KM]
SSC_avg MASC_avg ESC_avg
02
46
810
1214
SSC_avg MASC_avg ESC_avg
02
46
810
1214
SSC_avg MASC_avg ESC_avg
02
46
810
1214 Active Genes
Modified GenesStable I GenesAll Class I Genes
SSC MASC ESC
1.0 1.5 2.0 2.5 3.0
02
46
810
1214 Type (a) Promoters
Type (b) PromotersType (c) PromotersAll Class I Promoters
1.0 1.5 2.0 2.5 3.0
02
46
810
1214 Type (a) Promoters
Type (b) PromotersType (c) PromotersAll Class I Promoters
MASCActive Genes MASCModified Genes
MASCStable I Genes All Class I Genes
** *
*
** **
**
*
** **
**
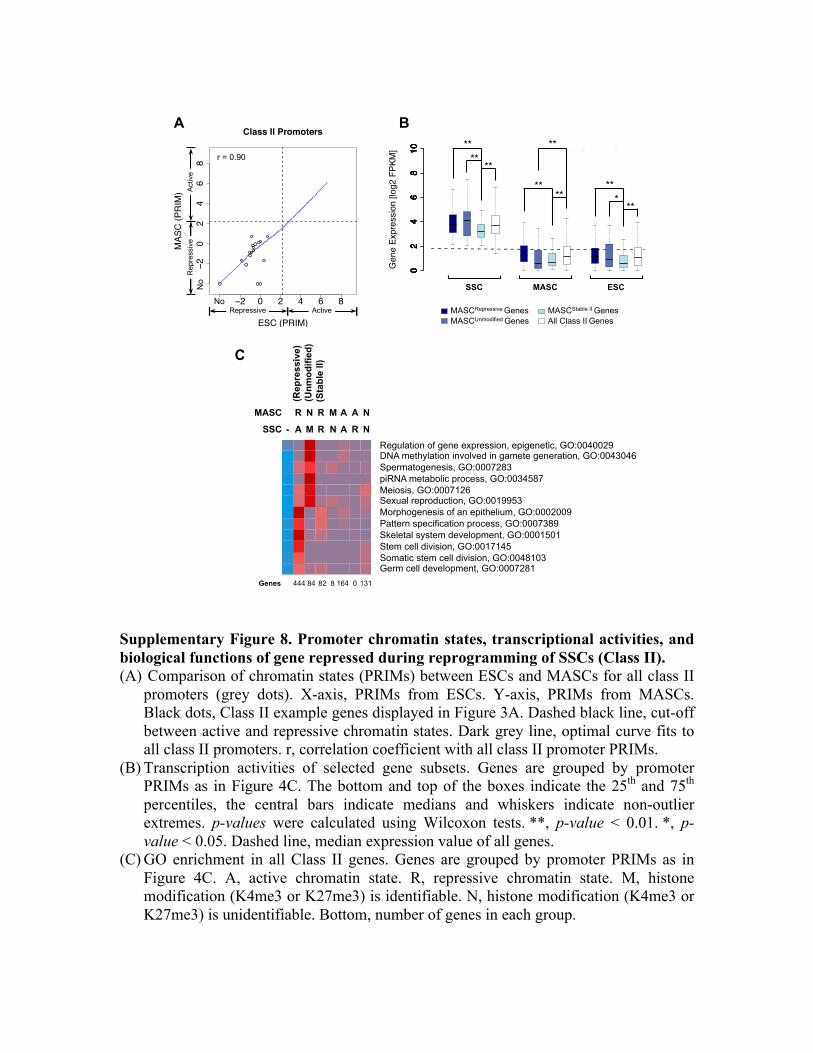
Supplementary Figure 8. Promoter chromatin states, transcriptional activities, and biological functions of gene repressed during reprogramming of SSCs (Class II). (A) Comparison of chromatin states (PRIMs) between ESCs and MASCs for all class II
promoters (grey dots). X-axis, PRIMs from ESCs. Y-axis, PRIMs from MASCs. Black dots, Class II example genes displayed in Figure 3A. Dashed black line, cut-off between active and repressive chromatin states. Dark grey line, optimal curve fits to all class II promoters. r, correlation coefficient with all class II promoter PRIMs.
(B) Transcription activities of selected gene subsets. Genes are grouped by promoter PRIMs as in Figure 4C. The bottom and top of the boxes indicate the 25th and 75th percentiles, the central bars indicate medians and whiskers indicate non-outlier extremes. p-values were calculated using Wilcoxon tests. **, p-value < 0.01. *, p-value < 0.05. Dashed line, median expression value of all genes.
(C) GO enrichment in all Class II genes. Genes are grouped by promoter PRIMs as in Figure 4C. A, active chromatin state. R, repressive chromatin state. M, histone modification (K4me3 or K27me3) is identifiable. N, histone modification (K4me3 or K27me3) is unidentifiable. Bottom, number of genes in each group.
C
X0
X1
X2
X3
X4
X5
X6
X7
Regulation of gene expression, epigenetic, GO:0040029DNA methylation involved in gamete generation, GO:0043046Spermatogenesis, GO:0007283piRNA metabolic process, GO:0034587Meiosis, GO:0007126Sexual reproduction, GO:0019953Morphogenesis of an epithelium, GO:0002009Pattern specification process, GO:0007389Skeletal system development, GO:0001501Stem cell division, GO:0017145Somatic stem cell division, GO:0048103Germ cell development, GO:0007281
5
Enrichment
-5
Depletion
Regulation of gene expression, epigenetic, GO:0040029 DNA methylation involved in gamete generation, GO:0043046 Spermatogenesis, GO:0007283 piRNA metabolic process, GO:0034587 Meiosis, GO:0007126 Sexual reproduction, GO:0019953 Morphogenesis of an epithelium, GO:0002009 Pattern specification process, GO:0007389 Skeletal system development, GO:0001501 Stem cell division, GO:0017145 Somatic stem cell division, GO:0048103 Germ cell development, GO:0007281
-
MASC
SSC
R
A
N
M
R
R
M
N
A
A
A
R
N
N
Genes 444 84 82 8 164 0 131
(Unm
odifi
ed)
(Sta
ble
II)
(Rep
ress
ive)
−4 −2 0 2 4 6 8
−4−2
02
46
8
Class II Promoters
ESC (PRIM)
MAS
C (P
RIM
)
No
No
r = 0.90
Repressive Active
Rep
ress
ive
Act
ive
Figure S8 A B
1.0 1.5 2.0 2.5 3.0
02
46
810
SSC_avg MASC_avg ESC_avg
02
46
810
Gen
e Ex
pres
sion
[log
2 FP
KM]
SSC_avg MASC_avg ESC_avg
02
46
810
SSC_avg MASC_avg ESC_avg
02
46
810
SSC_avg MASC_avg ESC_avg
02
46
810 Repress Genes
No Modified GenesStable II GenesAll Class II Genes
1.0 1.5 2.0 2.5 3.0
02
46
810
1214 Type (a) Promoters
Type (b) PromotersType (c) PromotersAll Class II Promoters
1.0 1.5 2.0 2.5 3.0
02
46
810
1214 Type (a) Promoters
Type (b) PromotersType (c) PromotersAll Class II Promoters
SSC MASC ESC
MASCRepressive Genes MASCUnmodified Genes
MASCStable II Genes All Class II Genes
** **
**
** **
**
* **
**
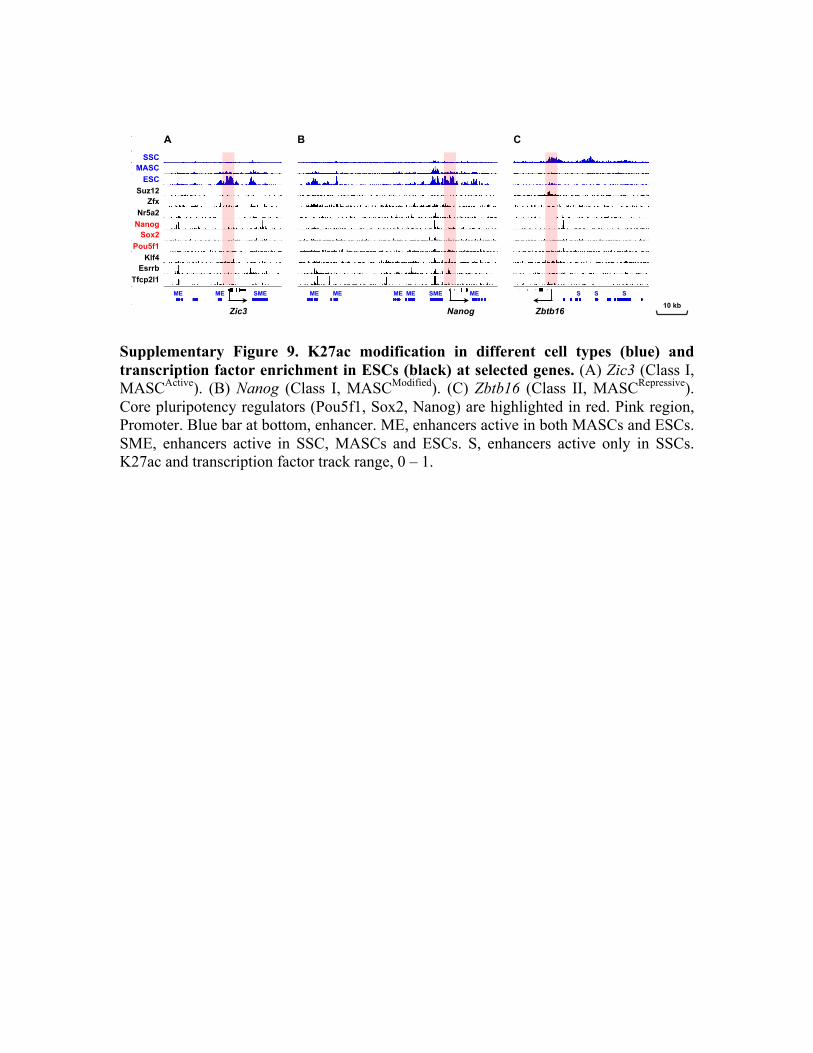
Supplementary Figure 9. K27ac modification in different cell types (blue) and transcription factor enrichment in ESCs (black) at selected genes. (A) Zic3 (Class I, MASCActive). (B) Nanog (Class I, MASCModified). (C) Zbtb16 (Class II, MASCRepressive). Core pluripotency regulators (Pou5f1, Sox2, Nanog) are highlighted in red. Pink region, Promoter. Blue bar at bottom, enhancer. ME, enhancers active in both MASCs and ESCs. SME, enhancers active in SSC, MASCs and ESCs. S, enhancers active only in SSCs. K27ac and transcription factor track range, 0 – 1.
SSC MASC
ESC Suz12
Zfx Nr5a2
Nanog Sox2
Pou5f1 Klf4
Esrrb Tfcp2l1
Nanog Zic3
ME ME SME ME ME ME ME SME ME S S S
Zbtb16
A B C
10 kb
Figure S7
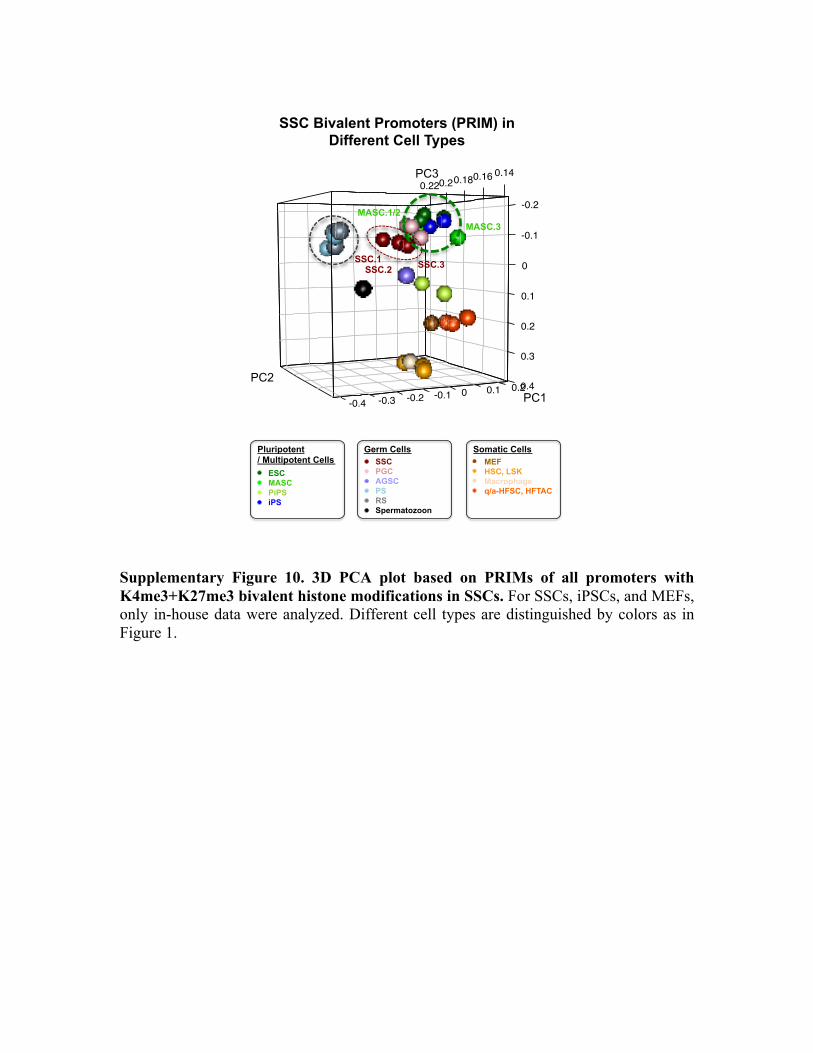
Supplementary Figure 10. 3D PCA plot based on PRIMs of all promoters with K4me3+K27me3 bivalent histone modifications in SSCs. For SSCs, iPSCs, and MEFs, only in-house data were analyzed. Different cell types are distinguished by colors as in Figure 1.
0.220.20.180.16
-0.1
-0.2
0.14
0.40.2
0.3
0.2
0.1
0
0.1-0.1 0-0.2-0.3-0.4
SSC Bivalent Promoters (PRIM) in Different Cell Types
SSC.1 SSC.2 SSC.3
MASC.3 MASC.1/2
PC2
PC1
PC3 Figure S1
-0.2
0.4
0.2
0
00.1
-0.1-0.2
-0.3
0.12 0.14 0.16 0.18
HSC.1 HSC.2
MEF
SSC.1/2/4 SSC.3
iPS.1
iPS.2 MASC.3/4/5/6 MASC.2
MASC.1
ESC.1
ESC.2
PC3
PC1 PC2
Transcriptome (RNA-seq)
A B
0.14
-0.1
0
-0.2
0.4
0.1
0.2
0.3
0.150.160.170.180.190.2
0.2-0.2 0
PC3
PC1
PC2
Epigenome at Promoters (PRIM)
SSC.3 SSC.2
SSC.1 PiPS_MCV6 PiPS_MCV8
HSC.2 HSC.1 MEF
iPS.1
iPS.2 MASC.1 MASC.3
MASC.2
ESC_MTS07 ESC_WJA12
ESC_BLA13
020
4060
8010
0
ESCMASCPiPSiPSMEFHSCMacrophageq/a−HFSC, HFTACSSCPGCAGSCPachytene SpermatocyteRound SpermatidSperm
ESC MASC PiPS iPS
020
4060
8010
0
ESCMASCPiPSiPSMEFHSCMacrophageq/a−HFSC, HFTACSSCPGCAGSCPachytene SpermatocyteRound SpermatidSperm
SSC PGC AGSC PS RS Spermatozoon
020
4060
8010
0
ESCMASCPiPSiPSMEFHSCMacrophageq/a−HFSC, HFTACSSCPGCAGSCPachytene SpermatocyteRound SpermatidSperm
MEF HSC, LSK Macrophage q/a-HFSC, HFTAC
Pluripotent Germ Cells Somatic Cells / Multipotent Cells
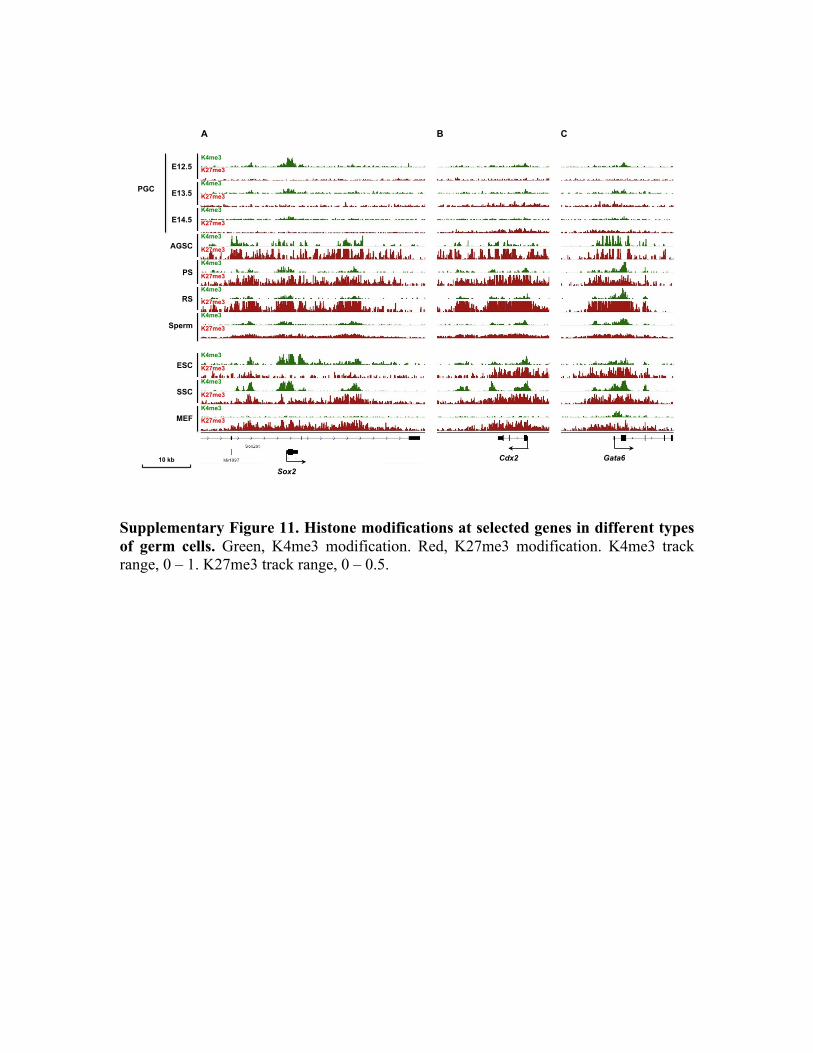
Supplementary Figure 11. Histone modifications at selected genes in different types of germ cells. Green, K4me3 modification. Red, K27me3 modification. K4me3 track range, 0 – 1. K27me3 track range, 0 – 0.5.
Sox2
Cdx2 Gata6
E12.5 E13.5 E14.5
PGC
AGSC
PS
RS
Sperm
ESC
SSC
MEF
K4me3
K27me3
K4me3
K27me3
K4me3
K27me3
K4me3
K27me3
K4me3
K27me3
K4me3
K27me3
K4me3
K27me3
K4me3
K27me3
K4me3
K27me3
K4me3
K27me3
10 kb
A B C
Figure S8
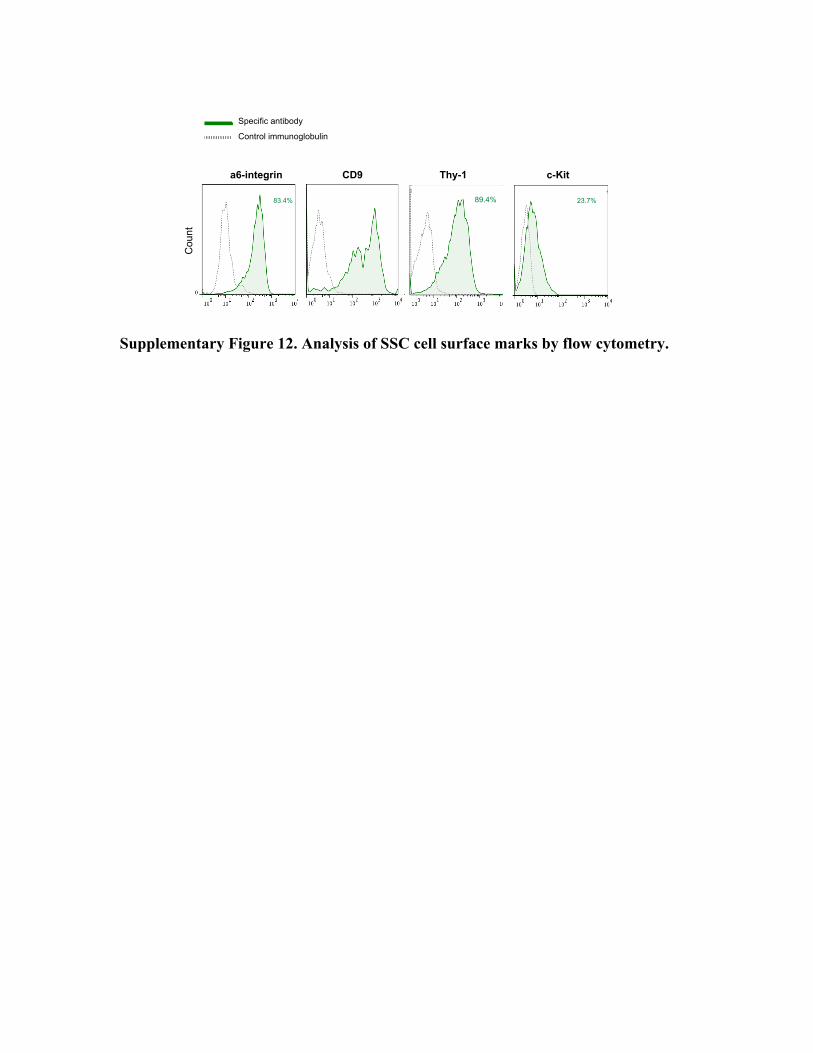
Supplementary Figure 12. Analysis of SSC cell surface marks by flow cytometry.
Specific antibody
Control immunoglobulin
83.4%
Cou
nt
23.7% 89.4%
Figure S12
a6-integrin CD9 Thy-1 c-Kit