Embed Size (px)
Citation preview

Supplementary Figure S1
eQTL prior model modified from previous approaches to Bayesian gene
regulatory network modeling. Detailed description is provided in Extended
Experimental Procedures. We used 2,000 breast cancer eQTL data (Nature
486, 346-352) covering SNPs, copy number variations (CNVs), and copy
number alterations (CNAs).

Module1 Module2 Module3Module4 Module5
Supplementary Figure S2
Identification and characterization of gene co-expression modules. Five major
co-expression modules were identified (left). Genes in module 4 and 5 were
enriched for meaningful Gene Ontology terms such as breast cancer, cell cycle,
DNA replication, and DNA damage (right). We merged the two modules
because they were closely related to each other (left).

Update by MCMC-based
greedy algorithm
128 individuals
128 individuals
......Evolution by
genetic algorithm
evolutionary outputs (suboptimal networks)
versusrandom seeds
1,000 seed networks
Supplementary Figure S3
10 random seeds updated through MCMC 10 evolved GA populations of >100 individuals
updated through MCMC
Number of overlapping edges
245171791 2541
A. Schematic view of the GA-MCMC approach. For full-scale network
constrcution, the GA is run to obtain 1,000 suboptimal networks, each of
which is evolutionarily selected from 128 initial prior-based candidates and
then used as the input of the MCMC-based learning.
B. In order to compare the output network of the GA-MCMC approach with that
of the pure MCMC method, we carried out a pilot-scale GA (for ten
populations containing 128 individual networks) followed by an MCMC with
ten seed networks and counted the number of the links commonly present in
the output of a pilot-scale MCMC (10 seed networks) based on the identical
prior data. The number of common edges between the two networks was
obtained.
A
B
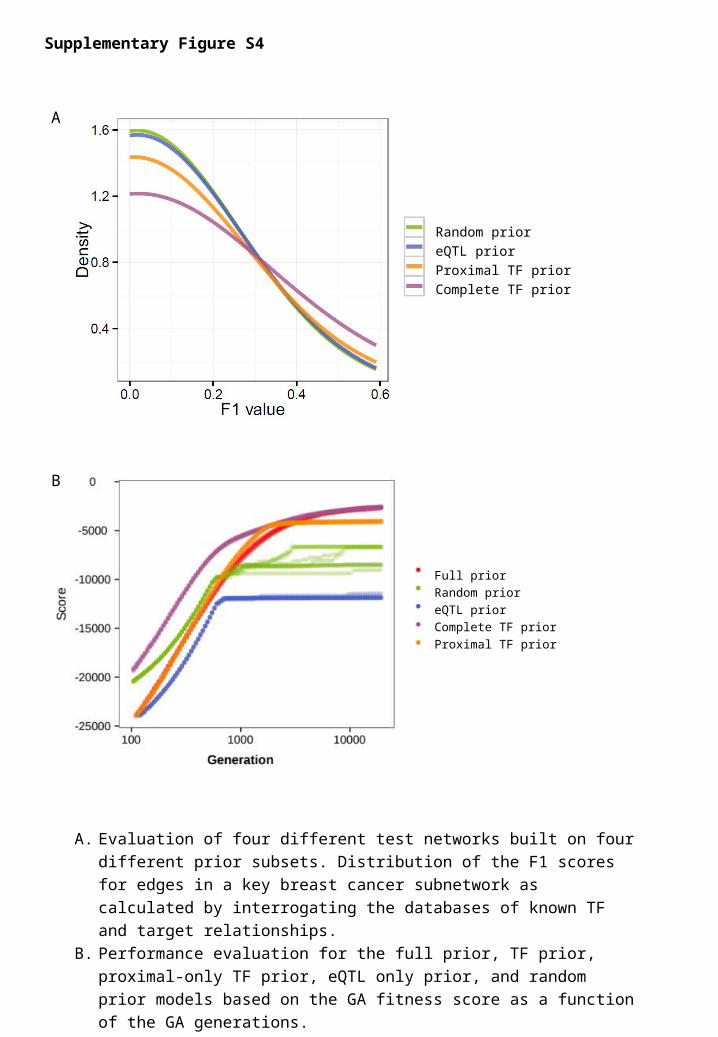
Supplementary Figure S4
A. Evaluation of four different test networks built on four different prior subsets.
Distribution of the F1 scores for edges in a key breast cancer subnetwork as
calculated by interrogating the databases of known TF and target
relationships.
B. Performance evaluation for the full prior, TF prior, proximal-only TF prior,
eQTL only prior, and random prior models based on the GA fitness score as
a function of the GA generations.
A
Random prior
eQTL prior
Proximal TF prior
Complete TF prior
Full prior
Random prior
eQTL prior
Complete TF prior
Proximal TF prior
B

Supplementary Figure S5
A
Fitn
ess
scor
e
Number of edges
Proximal TF prior
Complete TF prior
Null (random) priorNum
ber
of e
dges
Evolutionary generation
Complete TF prior
Null (random) prior
Proximal TF prior
A. Identification and characterization of gene co-expression modules in
leukemia. Five major co-expression modules were identified (left). Genes in
module 5 were enriched for meaningful Gene Ontology terms such as
leukemia, DNA damage checkpoint, cell cycle and cell cycle checkpoint
(right).
B. Evaluation of four different test networks built on four different prior subsets.
Distribution of the F1 scores for edges in a key leukemia subnetwork as
calculated by interrogating a manually curated and peer-reviewed pathway
database.
C. Global network performance of four partial prior models. Convergence
patterns were observed in ten independent GA runs that used each prior
subset by tracing the number of recovered edges according to the number of
GA generations (left) and by tracing the fitness score according to the
number of edges (right).
Module1 Module2 Module3Module4 Module5
B C

Proximal TF prior
Complete TF prior
B
Supplementary Figure S6
A. Comparison of two pilot networks (10 MCMC) built upon either the complete
TF priors or proximal TF priors only, in terms of precision in retrieving true
links provided in a manually curated and peer-reviewed pathway database.
B. Comparison of two pilot networks (10 MCMC) built upon either the complete
TF priors or proximal TF priors only, in terms of specificity and sensitivity in
retrieving regulatory interactions in the full-scale network (1,000 GA-MCMC).
A

Supplementary Figure S7
Percentage of genes that are connected to regulators shown left among genes
differentially expressed in cancer vs normal according to the patient subclass.

Supplementary Figure S8
A. The fraction of genes that are specifically under GATA3 or FOXM1 or
commonly under GATA3 and FOXM1 among genes up-regulated or down-
regulated upon a drug treatment that sensitizes basal-like cancer cells (Cell
149:780-794).
B. The distance to GATA3 relative to the distance to FOXM1 in the network
obtained for each of the genes commonly regulated by GATA3 and FOXM1.
The up-regulated genes were generally closer to GATA3.
A B

Network distance of GATA3 and FOXM1 to the genes up- or down-regulated
upon drug treatments that may sensitize basal-like cells by inducing luminal
expression phenotypes.
Supplementary Figure S9

Supplementary Figure S10
Percentage of prior nodes retained in the functional network
Percentage of nodes in the TF prior table recovered in the functional network
according to the TF binding mode. DRE and PRE stands for distal regulatory
element and proximal regulatory element, respectively. The colon indicates TF
binding and the arrow indicates long-range chromatin interaction.

Supplementary Figure S11
Schematic view of the identification of the functional target genes of somatic
mutations or risk SNPs

A. Misregulation concordance between transcriptional drivers (coding driver
factors and regulatory driver factors) and all genes in the network (gray),
downstream genes in the network (black), and downstream genes that are
risk genes (red).
B. Misregulation concordance for the coding mutation of GATA3 and the
differential expression of its downstream risk genes.
A
Supplementary Figure S12
B


![[Supplementary Material] Bayesian analysis and free market](https://img.pdfslide.net/doc/110x75/625864446e750613075a3953/supplementary-material-bayesian-analysis-and-free-market-.jpg)
