Embed Size (px)
Citation preview
TTSBI TFTPN PIM-1
Supplementary Figure S1: Synthesis of PIM-1 polymer. TTSBI: 5,5′,6,6′-tetrahydroxy-3,3,3′,3′-
tetramethylspirobisindane; TTFPN: 2,3,5,6-tetrafluoroterephthalonitrile; DMF: dimethylformamide.
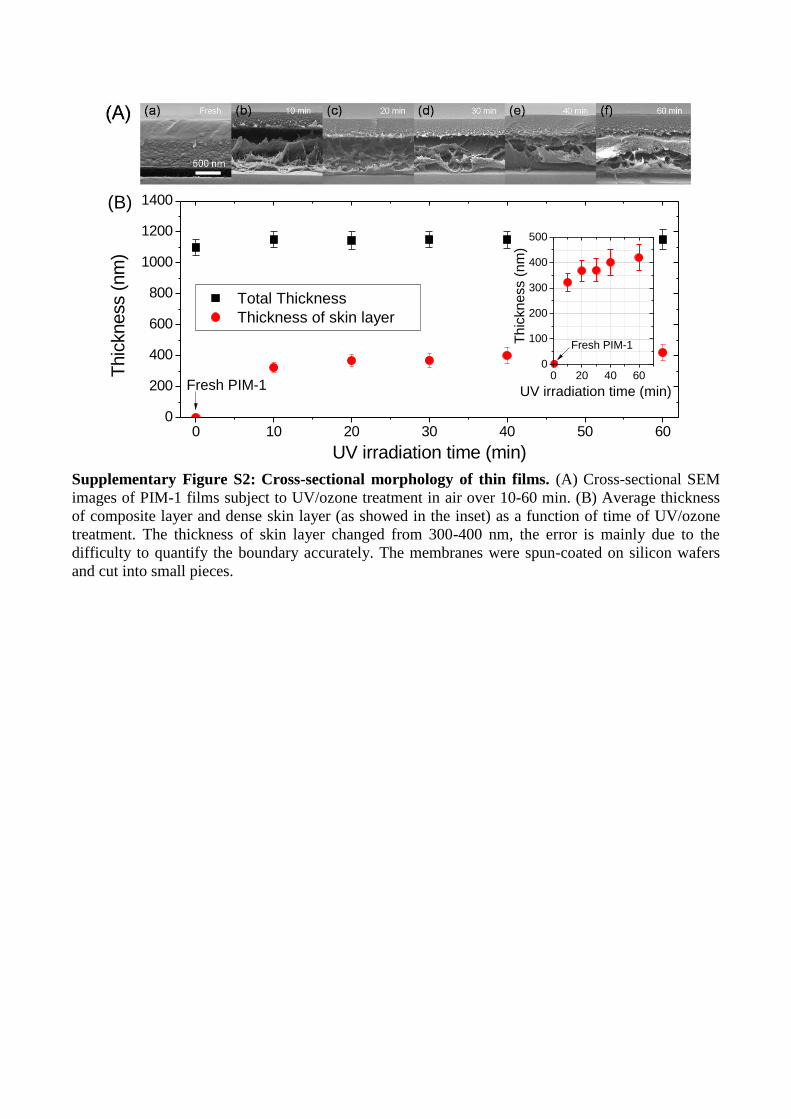
Supplementary Figure S2: Cross-sectional morphology of thin films. (A) Cross-sectional SEM
images of PIM-1 films subject to UV/ozone treatment in air over 10-60 min. (B) Average thickness
of composite layer and dense skin layer (as showed in the inset) as a function of time of UV/ozone
treatment. The thickness of skin layer changed from 300-400 nm, the error is mainly due to the
difficulty to quantify the boundary accurately. The membranes were spun-coated on silicon wafers
and cut into small pieces.
0 10 20 30 40 50 600
200
400
600
800
1000
1200
1400
Fresh PIM-1
Thic
kness (
nm
)
UV irradiation time (min)
Total Thickness
Thickness of skin layer
(B)
0 20 40 600
100
200
300
400
500
Th
ickn
ess (
nm
)
UV irradiation time (min)
Fresh PIM-1
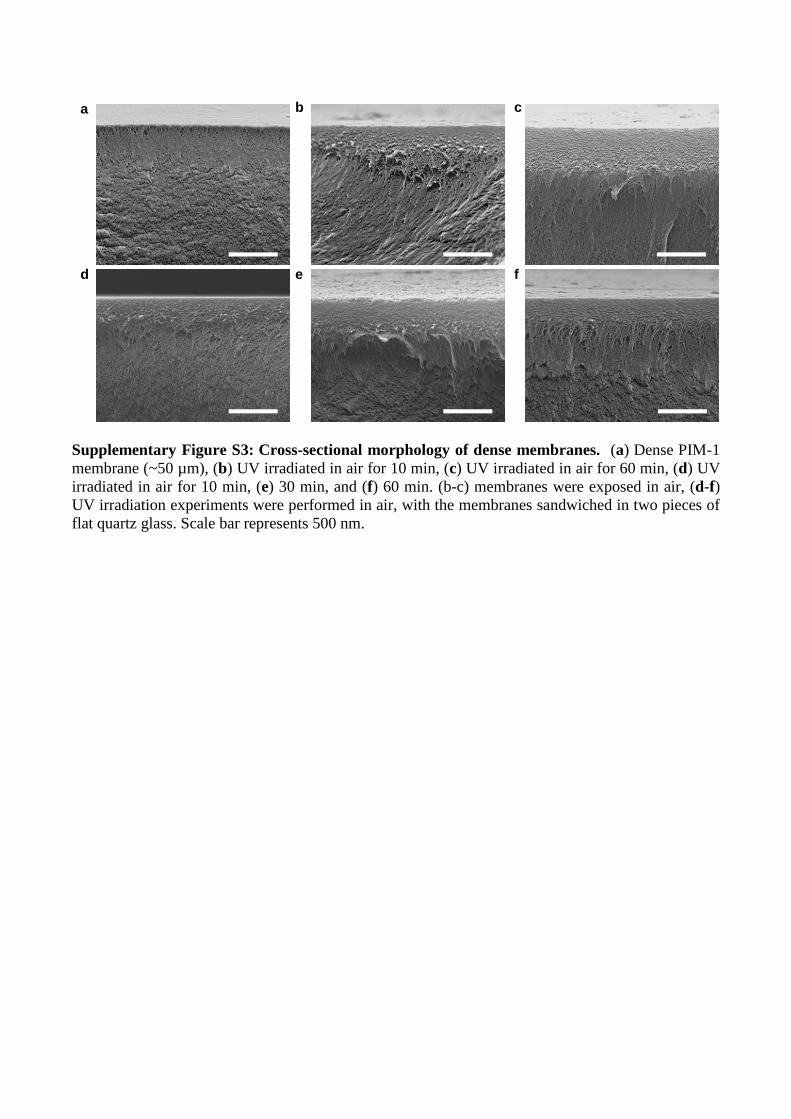
Supplementary Figure S3: Cross-sectional morphology of dense membranes. (a) Dense PIM-1
membrane (~50 µm), (b) UV irradiated in air for 10 min, (c) UV irradiated in air for 60 min, (d) UV
irradiated in air for 10 min, (e) 30 min, and (f) 60 min. (b-c) membranes were exposed in air, (d-f)
UV irradiation experiments were performed in air, with the membranes sandwiched in two pieces of
flat quartz glass. Scale bar represents 500 nm.
a b c
d e f
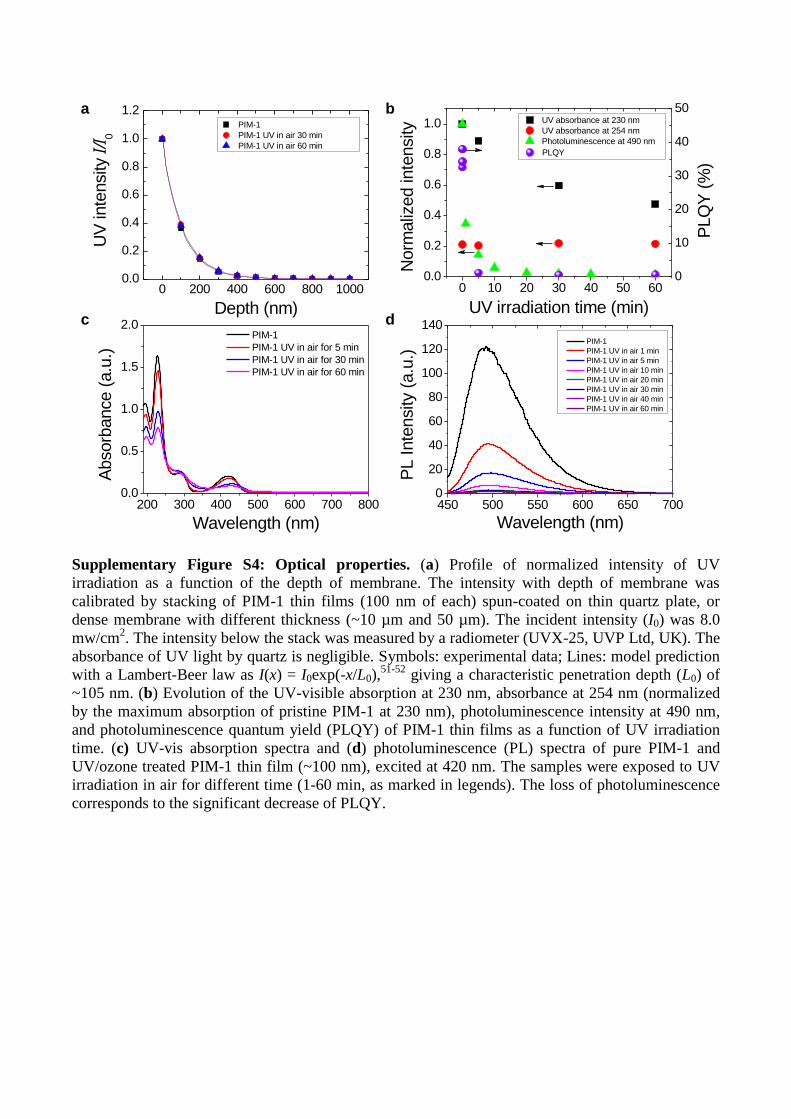
Supplementary Figure S4: Optical properties. (a) Profile of normalized intensity of UV
irradiation as a function of the depth of membrane. The intensity with depth of membrane was
calibrated by stacking of PIM-1 thin films (100 nm of each) spun-coated on thin quartz plate, or
dense membrane with different thickness (~10 µm and 50 µm). The incident intensity (I0) was 8.0
mw/cm2. The intensity below the stack was measured by a radiometer (UVX-25, UVP Ltd, UK). The
absorbance of UV light by quartz is negligible. Symbols: experimental data; Lines: model prediction
with a Lambert-Beer law as I(x) = I0exp(-x/L0),51-52
giving a characteristic penetration depth (L0) of
~105 nm. (b) Evolution of the UV-visible absorption at 230 nm, absorbance at 254 nm (normalized
by the maximum absorption of pristine PIM-1 at 230 nm), photoluminescence intensity at 490 nm,
and photoluminescence quantum yield (PLQY) of PIM-1 thin films as a function of UV irradiation
time. (c) UV-vis absorption spectra and (d) photoluminescence (PL) spectra of pure PIM-1 and
UV/ozone treated PIM-1 thin film (~100 nm), excited at 420 nm. The samples were exposed to UV
irradiation in air for different time (1-60 min, as marked in legends). The loss of photoluminescence
corresponds to the significant decrease of PLQY.
0 200 400 600 800 10000.0
0.2
0.4
0.6
0.8
1.0
1.2 PIM-1
PIM-1 UV in air 30 min
PIM-1 UV in air 60 min
U
V inte
nsity I/I
0
Depth (nm)
200 300 400 500 600 700 8000.0
0.5
1.0
1.5
2.0
Absorb
ance (
a.u
.)
Wavelength (nm)
PIM-1
PIM-1 UV in air for 5 min
PIM-1 UV in air for 30 min
PIM-1 UV in air for 60 min
450 500 550 600 650 7000
20
40
60
80
100
120
140
PL Inte
nsity (
a.u
.)
Wavelength (nm)
PIM-1
PIM-1 UV in air 1 min
PIM-1 UV in air 5 min
PIM-1 UV in air 10 min
PIM-1 UV in air 20 min
PIM-1 UV in air 30 min
PIM-1 UV in air 40 min
PIM-1 UV in air 60 min
a b
c d
0 10 20 30 40 50 600.0
0.2
0.4
0.6
0.8
1.0 UV absorbance at 230 nm
UV absorbance at 254 nm
Photoluminescence at 490 nm
Norm
aliz
ed inte
nsity
UV irradiation time (min)
0
10
20
30
40
50
PLQY
PLQ
Y (
%)
0 100 200 300 400 5000
5
10
15
20 Sample a, PIM-1
Sample b, PIM-1 UV/ozone
Sample c, PIM-1 UV/ozone
Ela
stic M
od
ulu
s,
E (
GP
a)
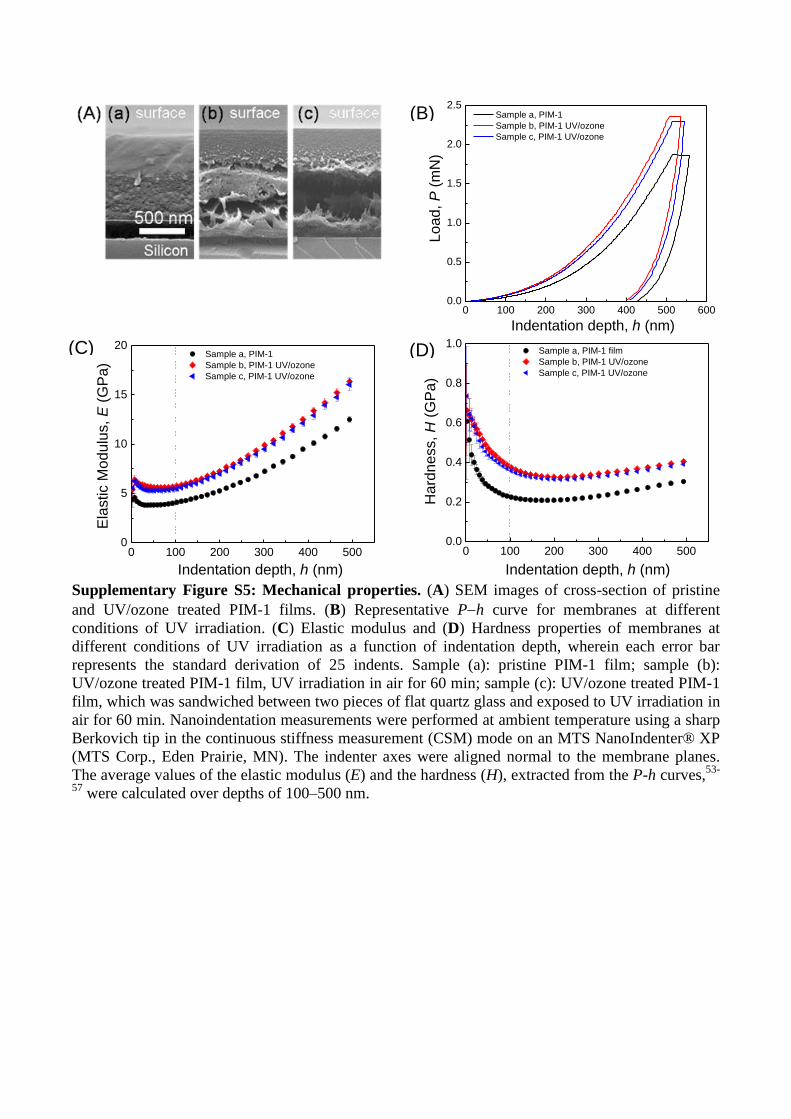
Indentation depth, h (nm) Supplementary Figure S5: Mechanical properties. (A) SEM images of cross-section of pristine
and UV/ozone treated PIM-1 films. (B) Representative Ph curve for membranes at different
conditions of UV irradiation. (C) Elastic modulus and (D) Hardness properties of membranes at
different conditions of UV irradiation as a function of indentation depth, wherein each error bar
represents the standard derivation of 25 indents. Sample (a): pristine PIM-1 film; sample (b):
UV/ozone treated PIM-1 film, UV irradiation in air for 60 min; sample (c): UV/ozone treated PIM-1
film, which was sandwiched between two pieces of flat quartz glass and exposed to UV irradiation in
air for 60 min. Nanoindentation measurements were performed at ambient temperature using a sharp
Berkovich tip in the continuous stiffness measurement (CSM) mode on an MTS NanoIndenter® XP
(MTS Corp., Eden Prairie, MN). The indenter axes were aligned normal to the membrane planes.
The average values of the elastic modulus (E) and the hardness (H), extracted from the P-h curves,53-
57 were calculated over depths of 100–500 nm.
0 100 200 300 400 500 6000.0
0.5
1.0
1.5
2.0
2.5 Sample a, PIM-1
Sample b, PIM-1 UV/ozone
Sample c, PIM-1 UV/ozone
Lo
ad
, P
(m
N)
Indentation depth, h (nm)
0 100 200 300 400 5000.0
0.2
0.4
0.6
0.8
1.0 Sample a, PIM-1 film
Sample b, PIM-1 UV/ozone
Sample c, PIM-1 UV/ozone
Indentation depth, h (nm)
Ha
rdn
ess, H
(G
Pa)
(C)
(A)
(D)
(A)
(B)
(A)
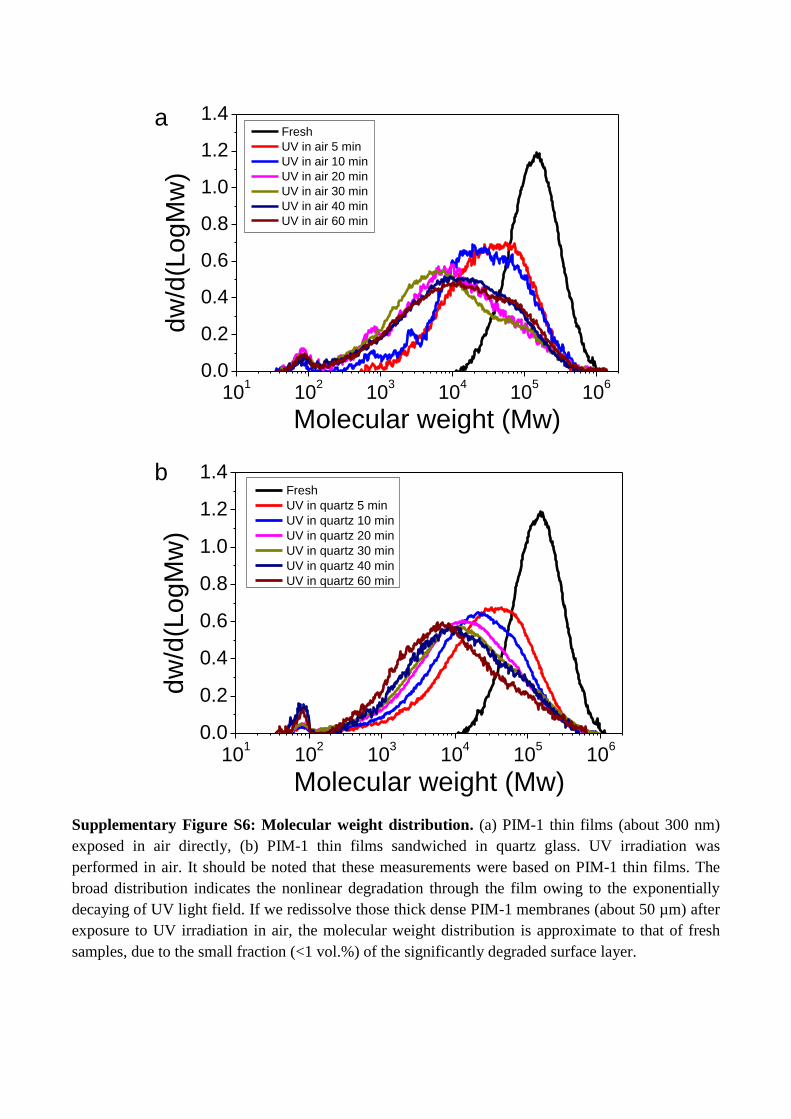
Supplementary Figure S6: Molecular weight distribution. (a) PIM-1 thin films (about 300 nm)
exposed in air directly, (b) PIM-1 thin films sandwiched in quartz glass. UV irradiation was
performed in air. It should be noted that these measurements were based on PIM-1 thin films. The
broad distribution indicates the nonlinear degradation through the film owing to the exponentially
decaying of UV light field. If we redissolve those thick dense PIM-1 membranes (about 50 µm) after
exposure to UV irradiation in air, the molecular weight distribution is approximate to that of fresh
samples, due to the small fraction (<1 vol.%) of the significantly degraded surface layer.
101
102
103
104
105
106
0.0
0.2
0.4
0.6
0.8
1.0
1.2
1.4 Fresh
UV in air 5 min
UV in air 10 min
UV in air 20 min
UV in air 30 min
UV in air 40 min
UV in air 60 min
dw
/d(L
og
Mw
)
Molecular weight (Mw)
101
102
103
104
105
106
0.0
0.2
0.4
0.6
0.8
1.0
1.2
1.4
dw
/d(L
og
Mw
)
Molecular weight (Mw)
Fresh
UV in quartz 5 min
UV in quartz 10 min
UV in quartz 20 min
UV in quartz 30 min
UV in quartz 40 min
UV in quartz 60 min
a
b
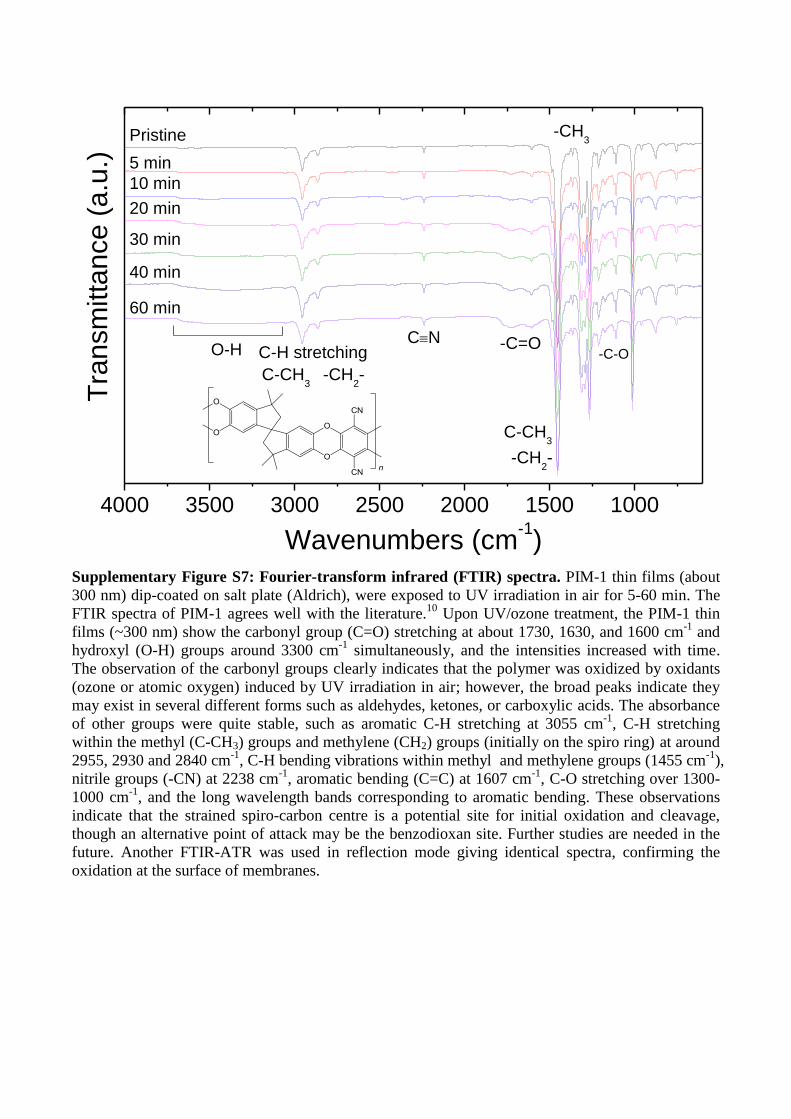
Supplementary Figure S7: Fourier-transform infrared (FTIR) spectra. PIM-1 thin films (about
300 nm) dip-coated on salt plate (Aldrich), were exposed to UV irradiation in air for 5-60 min. The
FTIR spectra of PIM-1 agrees well with the literature.10
Upon UV/ozone treatment, the PIM-1 thin
films (~300 nm) show the carbonyl group (C=O) stretching at about 1730, 1630, and 1600 cm-1
and
hydroxyl (O-H) groups around 3300 cm-1
simultaneously, and the intensities increased with time.
The observation of the carbonyl groups clearly indicates that the polymer was oxidized by oxidants
(ozone or atomic oxygen) induced by UV irradiation in air; however, the broad peaks indicate they
may exist in several different forms such as aldehydes, ketones, or carboxylic acids. The absorbance
of other groups were quite stable, such as aromatic C-H stretching at 3055 cm-1
, C-H stretching
within the methyl (C-CH3) groups and methylene (CH2) groups (initially on the spiro ring) at around
2955, 2930 and 2840 cm-1
, C-H bending vibrations within methyl and methylene groups (1455 cm-1
),
nitrile groups (-CN) at 2238 cm-1
, aromatic bending (C=C) at 1607 cm-1
, C-O stretching over 1300-
1000 cm-1
, and the long wavelength bands corresponding to aromatic bending. These observations
indicate that the strained spiro-carbon centre is a potential site for initial oxidation and cleavage,
though an alternative point of attack may be the benzodioxan site. Further studies are needed in the
future. Another FTIR-ATR was used in reflection mode giving identical spectra, confirming the
oxidation at the surface of membranes.
4000 3500 3000 2500 2000 1500 1000
-CH3
-C-O
-CH2-
C-H stretchingCN
C-CH3
60 min
40 min
30 min
20 min
10 min
5 min
T
ransm
itta
nce (
a.u
.)
Wavenumbers (cm-1)
Pristine
-C=OO-H
C-CH3
-CH2-
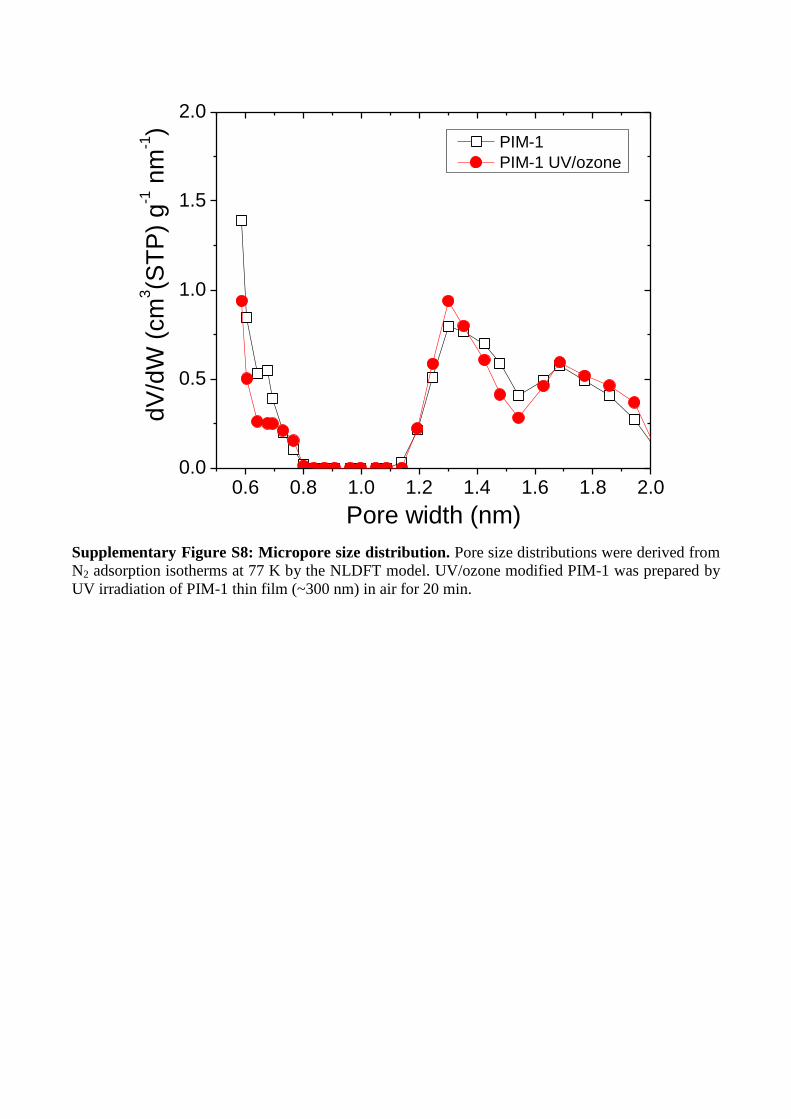
Supplementary Figure S8: Micropore size distribution. Pore size distributions were derived from
N2 adsorption isotherms at 77 K by the NLDFT model. UV/ozone modified PIM-1 was prepared by
UV irradiation of PIM-1 thin film (~300 nm) in air for 20 min.
0.6 0.8 1.0 1.2 1.4 1.6 1.8 2.00.0
0.5
1.0
1.5
2.0
PIM-1
PIM-1 UV/ozoned
V/d
W (
cm
3(S
TP
) g
-1 n
m-1)
Pore width (nm)
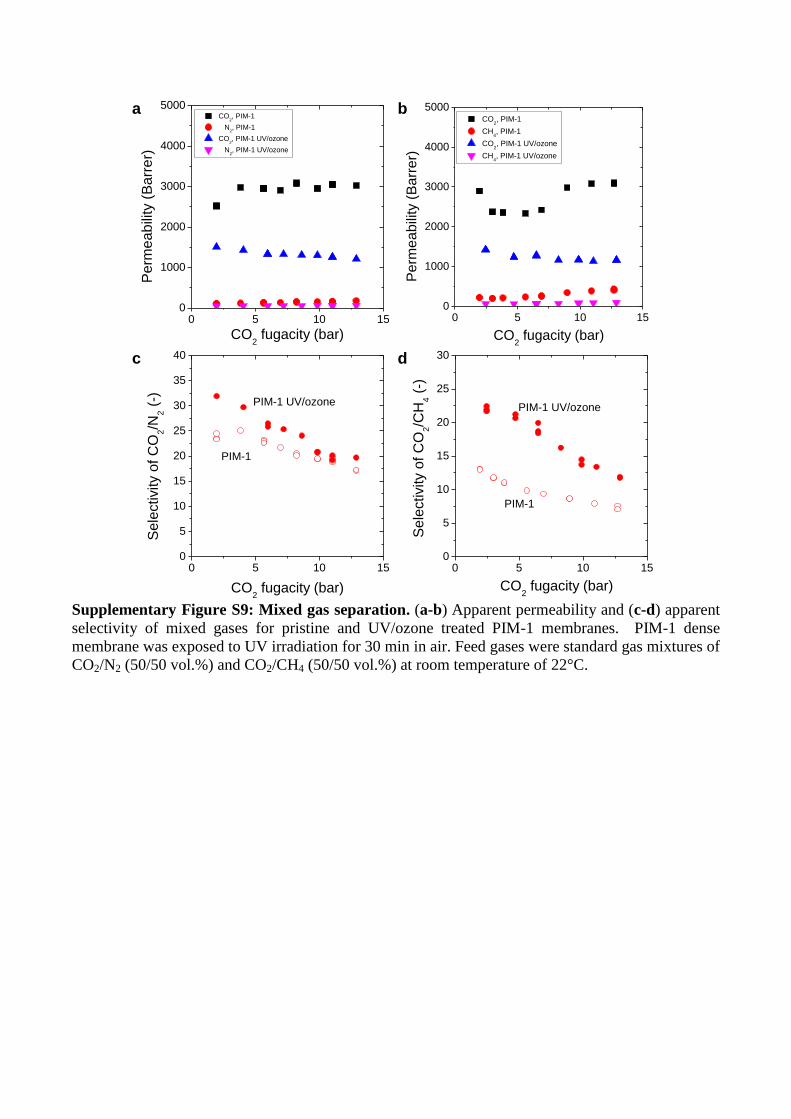
Supplementary Figure S9: Mixed gas separation. (a-b) Apparent permeability and (c-d) apparent
selectivity of mixed gases for pristine and UV/ozone treated PIM-1 membranes. PIM-1 dense
membrane was exposed to UV irradiation for 30 min in air. Feed gases were standard gas mixtures of
CO2/N2 (50/50 vol.%) and CO2/CH4 (50/50 vol.%) at room temperature of 22°C.
0 5 10 150
1000
2000
3000
4000
5000
CO2, PIM-1
N2, PIM-1
CO2, PIM-1 UV/ozone
N2, PIM-1 UV/ozone
Pe
rme
ab
ility
(B
arr
er)
CO2 fugacity (bar)
0 5 10 150
1000
2000
3000
4000
5000
CO2, PIM-1
CH4, PIM-1
CO2, PIM-1 UV/ozone
CH4, PIM-1 UV/ozone
Pe
rme
ab
ility
(B
arr
er)
CO2 fugacity (bar)
0 5 10 150
5
10
15
20
25
30
35
40
PIM-1 UV/ozone
Se
lectivity o
f C
O2/N
2 (
-)
CO2 fugacity (bar)
PIM-1
0 5 10 150
5
10
15
20
25
30
PIM-1 UV/ozone
Se
lectivity o
f C
O2/C
H4 (
-)
CO2 fugacity (bar)
PIM-1
a
(A)
b
(A)
c
(A)
d
(A)

Supplementary Figure S10: Dynamic change of gas transport properties. Experimental data and
model prediction of overall apparent gas permeability and selectivity of dense PIM-1 membrane
(~50 µm) exposed to UV irradiation in air for a range of times. Symbols: experimental data; lines:
model predictions with Supplementary Equations S2-3 and parameters in Supplementary Table S3.
(a-b) membranes were exposed to UV irradiation in air, (c-d) membranes were sandwiched in two
pieces of quartz glass, and exposed to UV irradiation in air.
0 20 40 60 80 100 120
10
100
1000
10000
H2
CO2
O2
N2
CH4
Appare
nt perm
eabili
ty (
Barr
er)
UV irradiation time (min)
0 20 40 60 80 100 1200
20
40
60
80
CO2/N
2
CO2/CH
4
O2/N
2
H2/N
2
H2/CH
4
Appare
nt sele
ctivity
UV irradiation time (min)
c d
0 20 40 60 80 100 120
10
100
1000
10000
H2
CO2
O2
N2
CH4
Appare
nt perm
eabili
ty (
Barr
er)
UV irradiation time (min)0 20 40 60 80 100 120
0
20
40
60
80
CO2/N
2
CO2/CH
4
O2/N
2
H2/N
2
H2/CH
4
Appare
nt sele
ctivity (
-)
UV irradiation time (min)
a b
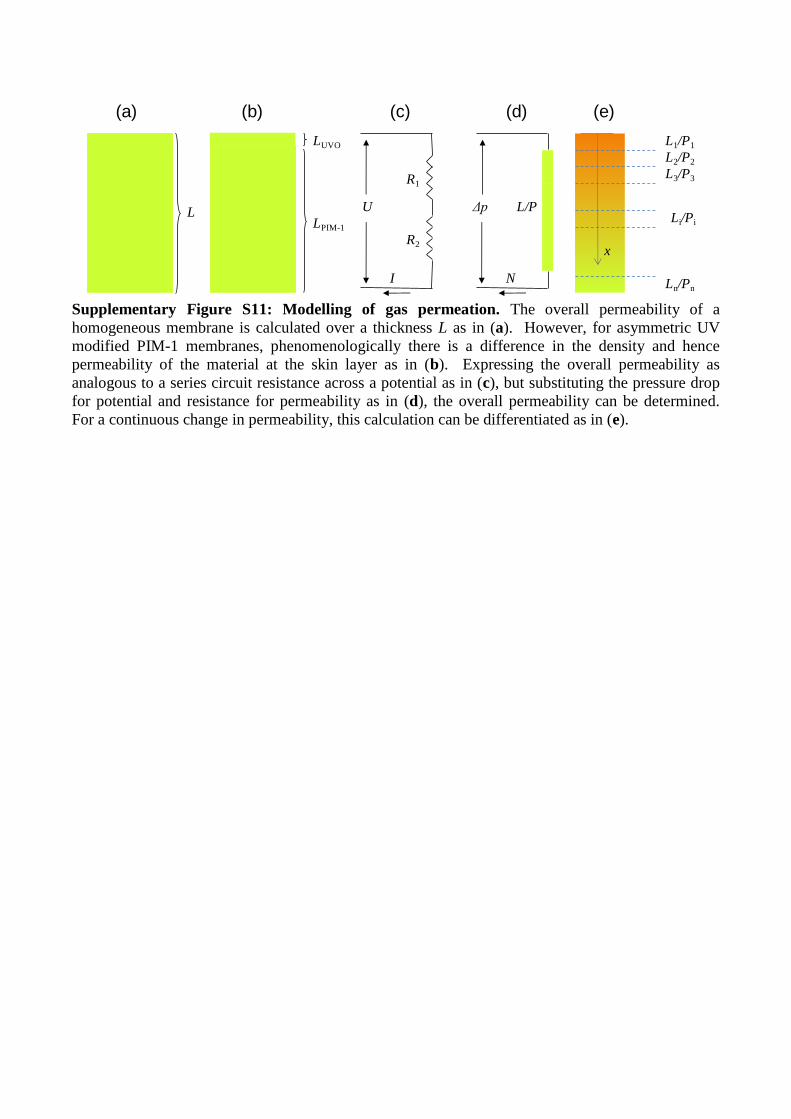
Supplementary Figure S11: Modelling of gas permeation. The overall permeability of a
homogeneous membrane is calculated over a thickness L as in (a). However, for asymmetric UV
modified PIM-1 membranes, phenomenologically there is a difference in the density and hence
permeability of the material at the skin layer as in (b). Expressing the overall permeability as
analogous to a series circuit resistance across a potential as in (c), but substituting the pressure drop
for potential and resistance for permeability as in (d), the overall permeability can be determined.
For a continuous change in permeability, this calculation can be differentiated as in (e).
LUVO
LPIM-1
N
Δp
(b) (d)
L1/P1
L2/P2
L3/P3
Ln/Pn
(e)
x
Li/Pi
(a)
L L/P
I
U
(c)
R1
R2
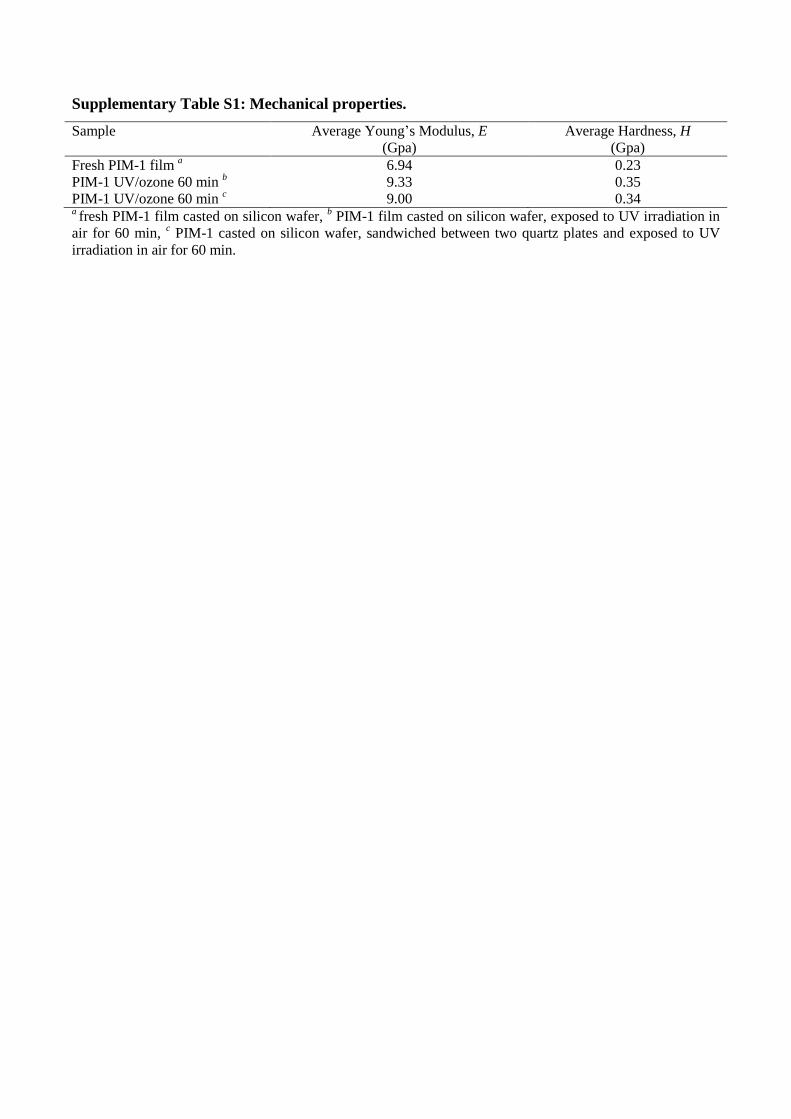
Supplementary Table S1: Mechanical properties.
Sample Average Young’s Modulus, E
(Gpa)
Average Hardness, H
(Gpa)
Fresh PIM-1 film a 6.94 0.23
PIM-1 UV/ozone 60 min b 9.33 0.35
PIM-1 UV/ozone 60 min c 9.00 0.34
a fresh PIM-1 film casted on silicon wafer,
b PIM-1 film casted on silicon wafer, exposed to UV irradiation in
air for 60 min, c PIM-1 casted on silicon wafer, sandwiched between two quartz plates and exposed to UV
irradiation in air for 60 min.

Supplementary Table S2: Apparent gas transport properties. PIM-1 membranes were exposed to
UV/ozone treatment and tested at feed pressure of 4 bar at 22°C. 1 Barrer=1×10⁻¹⁰
cm3(STP)cm cm
-2
s-1
cmHg-1
.
Sample Permeability (Barrer)
Selectivity
H2 CO2 O2 N2 CH4 CO2/N2 CO2/CH4 O2/N2 H2/N2 H2/CH4
PIM-1 blank 3195 5622 1089 325 418
17.3 13.5 3.4 9.8 7.6
Exposure to UV irradiation in air
PIM-1, UV in air, 5min 2758 6007 972 288 381
20.9 15.8 3.4 9.6 7.2
PIM-1, UV in air, 10 min 2986 6374 1097 296 393
21.6 16.2 3.7 10.1 7.6
PIM-1, UV in air, 20 min 2103 4374 736 198 228
22.1 19.2 3.7 10.6 9.2
PIM-1, UV in air, 30 min 1666 1555 317 58 62
26.9 25.0 5.5 28.8 26.8
PIM-1, UV in air, 40 min 1882 1535 359 60 59
25.6 26.2 6.0 31.4 32.1
PIM-1, UV in air, 60 min 1427 1147 238 38 42
30.0 27.0 6.2 37.4 33.6
Exposure to UV irradiation in air, membranes were sandwiched in quartz glass
PIM-1, UV in quartz, 5min 3410 6960 1144 336 377 20.7 18.5 3.4 10.1 9.0
PIM-1, UV in quartz, 10 min 3025 6721 1149 263 315 25.6 21.3 4.4 11.5 9.6
PIM-1, UV in quartz, 20 min 2609 3781 839 146 161 27.7 25.1 5.2 16.5 14.9
PIM-1, UV in quartz, 30 min 2104 2394 513 84 85 28.4 28.1 6.1 25.0 24.7
PIM-1, UV in quartz, 40 min 1681 1364 288 42 43 32.4 31.5 6.8 40.0 38.8
PIM-1, UV in quartz, 60 min 1509 857 196 31 30 27.2 28.6 6.2 48.0 50.3
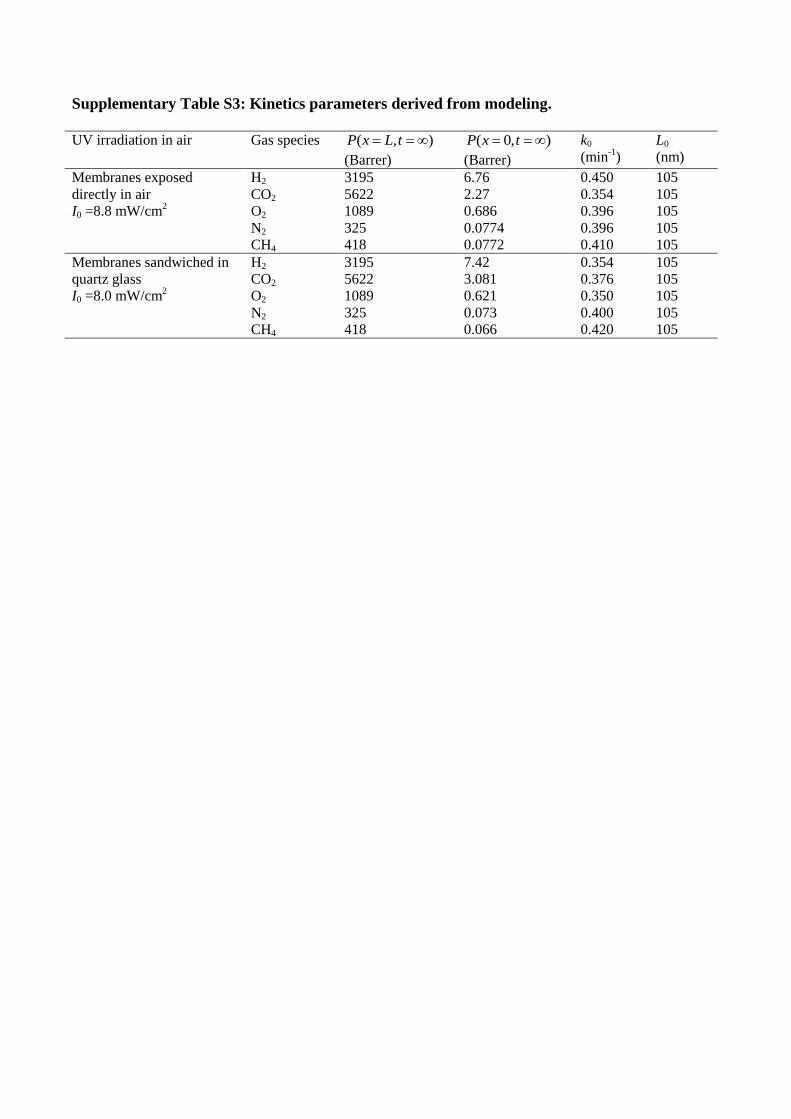
Supplementary Table S3: Kinetics parameters derived from modeling.
UV irradiation in air Gas species ),( tLxP
(Barrer)
),0( txP
(Barrer)
k0
(min-1
) L0
(nm)
Membranes exposed
directly in air I0 =8.8 mW/cm
2
H2 3195 6.76 0.450 105 CO2 5622 2.27 0.354 105 O2 1089 0.686 0.396 105 N2 325 0.0774 0.396 105 CH4 418 0.0772 0.410 105
Membranes sandwiched in
quartz glass I0 =8.0 mW/cm
2
H2 3195 7.42 0.354 105 CO2 5622 3.081 0.376 105 O2 1089 0.621 0.350 105 N2 325 0.073 0.400 105 CH4 418 0.066 0.420 105
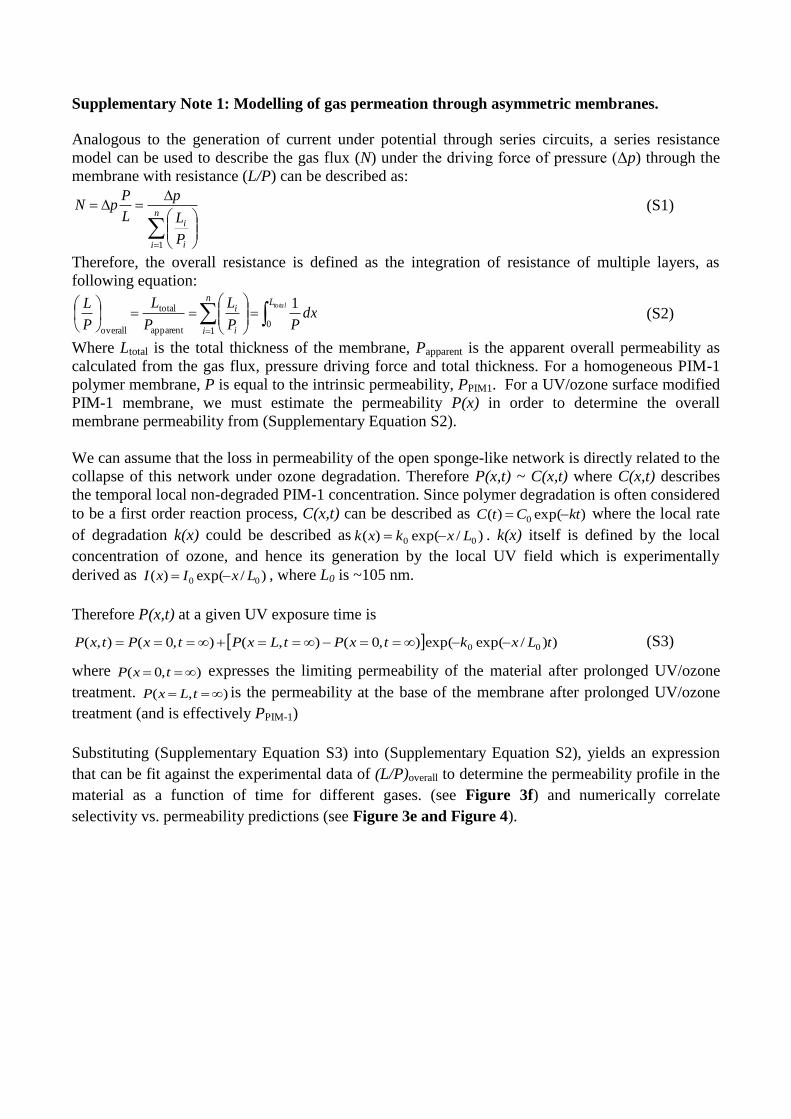
Supplementary Note 1: Modelling of gas permeation through asymmetric membranes. Analogous to the generation of current under potential through series circuits, a series resistance
model can be used to describe the gas flux (N) under the driving force of pressure (Δp) through the
membrane with resistance (L/P) can be described as:
n
i i
i
P
L
p
L
PpN
1
(S1)
Therefore, the overall resistance is defined as the integration of resistance of multiple layers, as
following equation:
totalLn
i i
i dxPP
L
P
L
P
L
01apparent
total
overall
1 (S2)
Where Ltotal is the total thickness of the membrane, Papparent is the apparent overall permeability as
calculated from the gas flux, pressure driving force and total thickness. For a homogeneous PIM-1
polymer membrane, P is equal to the intrinsic permeability, PPIM1. For a UV/ozone surface modified
PIM-1 membrane, we must estimate the permeability P(x) in order to determine the overall
membrane permeability from (Supplementary Equation S2).
We can assume that the loss in permeability of the open sponge-like network is directly related to the
collapse of this network under ozone degradation. Therefore P(x,t) ~ C(x,t) where C(x,t) describes
the temporal local non-degraded PIM-1 concentration. Since polymer degradation is often considered
to be a first order reaction process, C(x,t) can be described as )exp()( 0 ktCtC where the local rate
of degradation k(x) could be described as )/exp()( 00 Lxkxk . k(x) itself is defined by the local
concentration of ozone, and hence its generation by the local UV field which is experimentally
derived as )/exp()( 00 LxIxI , where L0 is ~105 nm.
Therefore P(x,t) at a given UV exposure time is
))/exp(exp(),0(),(),0(),( 00 tLxktxPtLxPtxPtxP (S3)
where ),0( txP expresses the limiting permeability of the material after prolonged UV/ozone
treatment. ),( tLxP is the permeability at the base of the membrane after prolonged UV/ozone
treatment (and is effectively PPIM-1)
Substituting (Supplementary Equation S3) into (Supplementary Equation S2), yields an expression
that can be fit against the experimental data of (L/P)overall to determine the permeability profile in the
material as a function of time for different gases. (see Figure 3f) and numerically correlate
selectivity vs. permeability predictions (see Figure 3e and Figure 4).
Supplementary Methods
Preparation of thin films. The samples after UV/ozone treatment were prepared by dip-coating of
PIM-1 polymer solution (0.8 wt%) on glass substrate (effective area, ~15×15 cm) forming thin film
of about 300 nm. The intensity of UV was relatively uniform over the irradiation area of films, as
measured by a radiometer. Based on the SEM observation, we could assume the thin film was
degraded through the membrane. After the UV irradiation in air, the film was removed and dried in
vacuum oven for overnight. For each sample, about 20 pieces of PIM-1 thin film were prepared to
collect enough sample for characterization analyses (density, TGA, and gas adsorption).
Density measurements. Density values of both as prepared PIM-1 membranes and UV/ozone
treated samples were measured using a Micromeritics Accupyc 1340 helium pycnometer, equipped
with a 1 cm3
insert. Typically, sample masses of 100-200 mg were used and the values quoted are the
mean and standard deviation from a cycle of 15 measurements. Before density measurements, all
samples were degased thoroughly under vacuum (< 1 mbar) at 150 °C for 5 hours. The average
helium pycnometric density of the UV/Ozone treated PIM-1 thin film (~300 nm) was 1.418(16)
g/cm3, i.e. higher than the pristine PIM-1 film, 1.277(11) g/cm
3, owing to the denser packing of
polymer chains and loss of accessible free volume. Normally the reported density of PIM-1 polymer
in the literature is about ~1.1 g/cm.10-11
Note our measurements were based on PIM-1 thin films
(~300 nm) and could also be subject to the system inaccuracy. Yet, the increase of density by about
11% was unambiguous.

Supplementary References
51. Jaffe, H. H. & Orchin, M., Theory and Applications of Ultraviolet Spectroscopy. (Wiley, New
York, 1962).
52. Serra, F. & Terentjev, E. M., Nonlinear dynamics of absorption and photobleaching of dyes. The
Journal of Chemical Physics 128, 224510-224516 (2008).
53. Lilleodden, E. T., Zimmerman, J. A., Foiles, S. M., & Nix, W. D., Atomistic simulations of
elastic deformation and dislocation nucleation during nanoindentation. Journal of the Mechanics and
Physics of Solids 51, 901-920 (2003).
54. Oliver, W. C. & Pharr, G. M., An improved technique for determining hardness and elastic
modulus using load and displacement sensing indentation experiments. J. Mater. Res. 7, 1564-1583
(1992).
55. Oliver, W. C. & Pharr, G. M., Measurement of hardness and elastic modulus by instrumented
indentation: Advances in understanding and refinements to methodology. J. Mater. Res. 19, 3-20
(2004).
56. Vlassak, J. J. & Nix, W. D., Measuring the elastic properties of anisotropic materials by means of
indentation experiments. Journal of the Mechanics and Physics of Solids 42, 1223-1245 (1994).
57. Cripps, A. C. F., Introduction to Contact Mechanics, Second Edition. (Springer, New South
Wales, Australia, 2007).