Embed Size (px)
Citation preview

Valuing impacts on air quality:
May 2013
Supplementary Green Book guidance
Authors: Roald Dickens, Joanne Gill, Alex Rubin and Milo Butterick
This do
cumen
t is ou
t of d
ate.
,
A newer
versi
on is
avail
able
on G
OV.UKncece

This do
cumen
t is ou
t of d
ate.
A newer
versi
on is
avail
able
on G
OV.UK
Valuing impacts on air quality:
May 2013
Supplementary Green Book guidance
Editor: Victoria Harrison
Series Editor: Joseph Lowe
Authors: Roald Dickens, Joanne Gill, Alex Rubin and Milo Butterick
This do
cumen
t is ou
t of d
ate.
,
A newer
versi
on is
avail
able
on G
OV.UK
a Ha

Official versions of this document are printed on 100% recycled paper. When you have finished with it please recycle it again.
If using an electronic version of the document, please consider the environment and only print the pages which you need and recycle them when you have finished.
© Crown copyright 2013
You may re-use this information (not including logos) free of charge in any format or medium, under the terms of the Open Government Licence. To view this licence, visit http://www.nationalarchives.gov.uk/doc/open-government-licence/ or write to the Information Policy Team, The National Archives, Kew, London TW9 4DU, or e-mail: [email protected].
Any queries regarding this publication should be sent to us at: [email protected].
ISBN 978-1-909096-99-8 PU1500
This do
cumen
t is ou
t of d
ate.
A newer
versi
on is
avail
able
on G
OV.UK

1
Contents Page
Chapter 1 Introduction and overview 3
Chapter 2 Estimating damage costs 7
Chapter 3 Assessing compliance 9
Chapter 4 Unit abatement cost approach 13
Chapter 5 Where to go for further information 15
Annex A Damage costs 17
Annex B Unit abatement costs 19
Annex C Overview of the impact pathway approach 21
Annex D Overview of full abatement cost assessment 23
Annex E National air quality objectives and European Directive limit and target values
25
Annex F Glossary 29
This do
cumen
t is ou
t of d
ate. smentment
nd Europnd Europ
A newer
versi
on is
avail
able
on G
OV.UK
199
22
an Directn Dire

This do
cumen
t is ou
t of d
ate.
A newer
versi
on is
avail
able
on G
OV.UK

3
1 Introduction and overview 11.1 The quality of the air impacts upon health and the environment. Air pollution is estimated to reduce the average life expectancy of every person in the UK by six months imposing a cost of around £16 billion per year1
1.2 Two approaches are used to value changes in air quality, dependent on the nature of the change. They are:
. The air quality impacts of any proposed policy, programme or project need to be understood and accounted for in appraisal. This supplementary Green Book guidance should be used in conjunction with the Green Book when assessing proposals that lead to changes in UK air pollution.
the impact pathway approach, which is used in the majority of instances to value the consequences of changes in air quality such as on health, crops and buildings; and
the abatement cost approach, which is used in the limited instances where the change in air quality is likely to affect compliance with a legally binding obligation (whether causing, removing or changing the extent of non-compliance).
1.3 Chart 1.A illustrates how to identify the appropriate approach.
1.4 The impact pathway approach (I-PA) is the central methodology for appraisal. It values the air quality impacts of proposed decisions by estimating how changes in the ambient concentrations of air pollutants affect a range of health and environmental outcomes.
1.5 Full I-PA modelling is therefore quite resource and time intensive, requiring the estimation of emissions, dispersion, population exposure and outcomes. Damage costs have been developed to enable proportionate analysis when assessing the scale of air quality impacts where they are less significant. They are derived from the I-PA methodology to offer approximations of the value using representative modelling. The full I-PA uses bespoke analysis to provide a fuller assessment, suitable for cases where air quality impacts are significant.
1.6 When total air quality impacts are estimated to be less than £50 million (in present value terms) it is recommended that damage costs are used. Where total air quality impacts are estimated to be in excess of £50 million a full impact pathway assessment should be considered in consultation with Defra.
1.7 The abatement cost approach2
1
is relevant for the minority of situations where the breach of legally binding obligations is an issue. In such instances, it is still only those changes in air quality in excess of the relevant obligation that should be valued using this approach. Changes below the obligation should be valued using the impact pathway approach.
http://archive.defra.gov.uk/environment/quality/air/airquality/panels/igcb/documents/100303-aq-valuing-impacts.pdf2 www.gov.uk/air-quality-economic-analysis
This do
cumen
t is ou
t of d
ate. n the lim
pliance wiance wg the extg the ext
propriate opriate
s the centhe centns by estimby est
ct a rangea rang
ore quitee quiteation expon exp
nalysis alysis wwre derivedderived
e modellinmodellinable for cble for c
otal air qual air quis recomms recom
ted to beted to bultatat
A newer
versi
on is
avail
able
on G
OV.UKure of ture of t
nstances tnstances ps and bups and
ted instand instath a legala lega
nt of nont of no
pproachpproach
al methodmethoating howng ho
of healthhealt
esource asourcesure and re and
enen assesassesfrom the om the
g. The fulThe fulses wheres wher
ality impaty impended thnded th
n excessexcessn with Dwith D
temeem

4
Chart 1.A: Overview of air quality valuation methodologies
Yes
No
Yes
Yes
No
No
Are estimates >£50m?
Is compliance with legally binding
objectives expected?
Are estimates >£50m?
Compare impacts in affected areas to legal obligations
Apply unit costs to assess scale of abatement costsa
Report unit cost estimates
Apply damage costs to assess significance of AQ impact
a Only emissions that occur above the legal obligation should be valued using unit costs. Emissions below this level should be valued using damage costs.
Consider using an Impact Pathway Assessment. Contact
[email protected] for advice
Report damage cost estimates
Consider more detailed abatement cost assessment.
Contact [email protected] advice
This do
cume
ococ
This do
cummen
t is ou
t
enou
t of d
ate.
o assess assessment nt costcost
out o
f da
Report daReport da
A newer
versi
on is
ava
A newer
Are Are estimaestima>£5>£
rsi
vaila
ble on
GOV.U
K
vaila
ble o
mage cost mage cost

5
11.8 When total air quality impacts are estimated to be less than £50 million (in present value terms) it is recommended that damage costs are used. Where total air quality impacts are estimated to be in excess of £50 million a full impact pathway assessment should be considered in consultation with Defra.
1.9 The abatement cost approach3
1.10 The UK has a number of legally binding obligations that have been established to manage the health risk from air pollution and to protect the environment for current and future generations. They were set using the best available scientific and medical evidence on the effect of pollutants on health and the wider environment. The complexity of the science is such that standards have to be set without perfect information, but applying these obligations allows the risks to be managed.
is relevant for the minority of situations where the breach of legally binding obligations is an issue. In such instances, it is still only those changes in air quality in excess of the relevant obligation that should be valued using this approach. Changes below the obligation should be valued using the impact pathway approach.
1.11 If the legally binding obligations are not met, remedial actions will need to be undertaken to restore compliance or fines will be imposed. Consequently decisions that result in non-compliance may create substantial potentially unlimited financial liabilities. In this case any changes in air quality that exceed the minimum standard must be valued at what it will cost to subsequently restore compliance using the abatement cost approach. The abatement cost approach is only recommended where pollution is already in breach of legally binding obligations, or where this is expected as a result of the policy under consideration. The approach should not be used for objectives that are not legally binding, nor when setting targets or binding obligations as the impact pathway approach is appropriate in these circumstances.
1.12 Chart 1.A provides an overview of how the appropriate air quality methodology can be selected, and Box 1.A gives some examples of how they might be applied.
3 www.gov.uk/air-quality-economic-analysis
This do
cumen
t is ou
t of d
ate.
t bapproa
dy in breay in bree policy ue policy u
lly bindinbindinroach is aoach is a
w the apthe apples of hoes of ho
A newer
versi
on is
avail
able
on G
OV.UKbe underte unde
sult in nolt in noIn this can this ca
d at whatd at whaThe abahe ab
h of legaof lender consr con
g, nor wh, nor whppropriatpropriat
ropriate aopriate aw they mhey m

6
Box 1.A: Examples of applying the different air quality methodologies
EExample 1: A proposal is put forward for a new piece of infrastructure in an area where air quality is currently of a good standard with all obligations being met. The new infrastructure would lead to a substantial permanent increase in emissions which would breach a legally binding objective.
Both approaches will be needed because the proposal is expected to result in a new exceedance. The first step is to assess the significance of the impact by producing damage cost estimates. In this case these are greater than £50 million, indicating that a full impact pathway assessment should be conducted. Impact pathway modelling suggests the air quality changes up to the objective represent a cost to society of £100 million in present value terms.
Next the adverse changes in air quality above the level at which the objective has been set should be valued using the abatement cost approach. Modelling suggests that the cost of abatement to restore compliance has a cost of £200 million in present value terms. Combining these values suggests that the adverse changes in air quality have a total cost of £300 million in present value terms.
Example 2: Air quality in a particular location is of a good standard with all obligations being met. A proposal is expected to have a small increase in emissions for the next five years.
The estimated change in the level of emissions (in tonnes) is valued directly using damage costs. This valuation suggests that the increase in emissions imposes a cost of £5 million in present value terms. Since this is less than £50 million and no breaches of legal obligations are expected these damage cost estimates are the relevant values to be reported.
ofof
te.
) is va
atessions i
dat
on and
f da
he relev
t ot o
A newer
versi
on is
avail
aababl
KUKtal cost
V.UK
OV.all oblig
GOVhe next f
n Gdirectly
on
oses a c
leono breach
ble
nt values
ilab
ila

7
2 Estimating damage costs 22.1 It is recommended that damage costs are estimated at the outset to assess the significance of a change in air quality. Damage cost estimates will not be the appropriate values to report in all instances but they serve as a filtering mechanism to determine the appropriate valuation approach.
Key steps in the application of damage costs: 1 Set the appropriate baseline.
The ‘baseline’ is the do nothing counterfactual i.e. the state of the world in the absence of the option under consideration. This should reflect all changes expected to occur over time in the absence of the programme, policy or project under consideration. These changes may be due to natural or technological changes, or due to policies other than the one under consideration, and (for PM) should take into account expected changes in the location of emissions.
2 Quantify the changes in emissions.
The amount of pollution produced from each source should then be estimated on the basis of the amount of raw material used or processed at that source. The relationship between the raw material used and the pollution produced is known as the ‘emissions factor’. For example, the emissions factor for road traffic is the amount of pollution produced per vehicle mile travelled. Estimates of emissions factors for different activities are developed by the National Atmospheric Emissions Inventory (NAEI). Their Emissions Factor Database is available here: www.naei.org.uk/emissions.
3 Value the changes in emissions.
Once the changes in emissions and their locations are known, these need to be valued in monetary terms. Representative dispersion and exposure modelling has been used to approximate damage costs for four key pollutants: particulate matter (PM10), oxides of nitrogen (NOX), sulphur dioxide (SO2), and ammonia (NH3). These are available from Defra and the current values are included in Annex A.1
The damage cost estimates include estimates of the heath impacts (both deaths and sickness) of all four pollutants. The PM10 and SO2 estimates, in addition, include the impact of building soiling and the impact on materials respectively.
As theimpact of particulate matter varies hugely depending on location and the sector it is produced by, damage costs for this pollutant vary by sector: electricity supply industries (ESI), domestic, agriculture, industrial, waste, and road transport (which is, in turn, broken down into National Transport Model areas).
1 As values may be updated periodically to reflect improved evidence, you should check the Defra website for up to date values, www.gov.uk/air-quality-economic-analysis.
This do
cumen
t is ou
t of d
ate. atural o
nsideratioderatation of etion of
ced from ed fromaw materw mate
raw matew mateFor examFor exam
n produceproduceent activit activ
AEI). ). TheirTheiorg.uk/erg.uk/e
umthe chanhe chan
Once the e the valued valuebeebee((
A newer
versi
on is
avail
able
on G
OV.UK
world inworld inall changeall chang
or projecr projeechnologhnolo
n, and (foand (fomissions.sions
eaach sourch soural used orused or
ial used a used aple, the emthe em
d per vehper vehes are deare de
missionsissionsmissionssionssi.
ges in ems in em
hanges innges inn monetamoneta
used to ased to M1010), oxid), oxi
are availare availimpampa

8
Values listed are in 2010 prices. Most assessments will be dealing with air quality changes occurring over a number of years and it is recommended that values are uplifted by 2 per cent per annum to account for rising incomes. It is expected that as people’s incomes rise, so too does their willingness to pay to reduce health risks such as those associated with air pollution.
As well as central estimates of damage costs, Annex A provides the range of central estimation and low and high values for the purposes of sensitivity testing.
In considering the impact of PM10 in sectors other than those listed, PM10 damage costs for the sector most similar to the one being examined should be used. Damage costs for pollutants other than PM10, NOX, SO2, and NH3 are not available and the standard Ecosystems Services Approach2
22.2 You can use the Damage Cost Calculator
to valuation should be applied.
3
the length (in years) of the policy appraisal;
that is available on the UK-AIR website to calculate the estimated value of changes in air quality using damage costs. The following information is required:
the base year for the appraisal;
the pollutant(s) being assessed; and
the annual change in emissions (in tonnes).
When to report damage cost estimates 2.3 As shown in Chart 1.A, damage cost estimates should be reported in the final cost-benefit analysis when two conditions are satisfied:
when total air quality impacts are valued at less than £50 million (in present value terms) using the damage cost approach; and
When compliance with legally binding objectives is expected, both with and without the proposal being considered. Chapter 3 explains how to assess compliance.
2.4 More information on the derivation and application of damage costs is available from: www.gov.uk/air-quality-economic-analysis.
2.5 If total air quality impacts are valued at more than £50 million, a full impact pathway assessment may be necessary. However, the case for such analysis will also depend on a range of other factors such as the importance of air quality to the specific decision. If the damage cost assessment suggests a full impact pathway assessment may be required, contact Defra at [email protected]. Annex C provides an overview of how such assessments are conducted.
Activity costs 2.6 Activity costs simplify the estimation of the value of changes in air quality by providing a direct link between an activity (such as fuel consumption or transport) and the value of changes in air quality. They are a potential tool for situations when the change in tonnes of emissions associated with an activity is unknown but the behavioural responses have been estimated.
2.7 Activity costs can be produced for specific uses if needed. In such instances contact [email protected].
2 Defra’s Introductory Guide to the Valuation of Ecosystem Services: http://ec.europa.eu/environment/nature/biodiversity/economics/pdf/valuing_ecosystems.pdf. 3 http://uk-air.defra.gov.uk/library/reports?section_id=19.
sstes shous shou
cts are vas are vae cost apcost a
with legalth legalng considconsid
n the derthe derity-econoecono
cuuality impality impmay be nebe ne
ors such ars suchment suggent suggdefra.gdefra.gT
A newer
versi
on is
avail
able
on G
OV.UK
be repobe repo
ued at lesd at lesroach; anoach; an
binding bindinred. ed. ChapCha
ation andtion andmic--analysanalys
erscts are vas are vaessary. Hosary
the impohe imposts a full s a ful
i.gov.ukgov.uknecostsosts

9
3 Assessing compliance 33.1 Unless it has been established that a full impact pathway assessment is required the next step is to determine whether the proposal will affect compliance with any legally-binding air quality obligations. To do this you need to identify:
the current concentrations in affected areas;
changes as a result of the proposal; and
relevant legally binding obligations.
Establishing the areas affected and their current levels of air quality 3.2 National data and annual compliance reports are available from UK-AIR (http://uk-air.defra.gov.uk), which will enable an initial estimation of whether there is an existing air quality management problem.
3.3 Additional local-level information may be available if areas of interest are within a designated Air Quality Management Area (AQMA). AQMAs are created by Local Authorities to address local issues and specific pollutants where it is deemed likely that an air quality objective will not be met. The Local Authority will draw up action plans setting out how the objectives will be met. Information on AQMAs is available from the Defra website: http://aqma.defra.gov.uk/list.php.
Establishing the changes as a result of the proposal 3.4 There are a number of methods which can be used ranging from simple tools to complex dispersion models. The choice of scientific assessment should be proportional to the expected air quality impacts.
3.5 A suite of tools is available to provide an initial indication of the likely impact by different sources of air pollution, including:
the Design Manual for Roads and Bridges (DMRB) Screening Model, which can be used to assess changes from road traffic sources. The DMRB Screening Model can predict changes in air quality concentrations of a range of pollutants, including NO2 and PM10
1
Industrial Emissions Screening Tools, which can be used to estimate the characteristics of industrial sources that would cause non-compliance with a range of minimum standards
;
2
a chimney height calculation spreadsheet for sulphur dioxide emissions from small boilers
;
3
1 Guidance on using the DMRB can be downloaded from
; and
http://laqm.defra.gov.uk/documents/DMRB-guidance_V4.pdf. 2 Calculators for Industrial Nomograms are available from http://laqm.defra.gov.uk/review-and-assessment/tools/emissions.html. 3 Available from http://laqm.defra.gov.uk/review-and-assessment/modelling.html.
This do
cumen
t is ou
t of d
ate. fr
whethe
ble if aree if areA). AQMA). AQM
here it is de it israw up acw up ac
able fromle from
ges as aes as af methodmethod
choice ohoice o
ools is avols is air pollutiopollutio
tthe he
A newer
versi
on is
avail
able
on G
OV.UK
of air qof air qAIR (AIR (httphtt
GOhere is ane is a
s of intereof inters are creaare cre
eemed likmed likion plansn plans
the Defrae Defra
a result esultwhich cawhich ca
scientificcientific
ilable to able ton, inclincludiud
Design Msign Msed to assd to as
predict predictand and
10
the Biomass Calculator estimates the maximum stack emission rate that is not likely to exceed the PM2.5 cap4
33.6 The suite of tools is continually developing. For the latest tools, contact
.
Establishing compliance 3.7 It is important to determine whether areas affected by the proposal are expected to comply with the relevant legally binding obligations. Non-compliance, whether as a result of the proposal or in its absence (the baseline), indicates that the abatement cost approach is appropriate both for improvements and worsening of air quality.
3.8 Air quality standards are designed to restrict the levels at which particular substances can be present in the air. They take a range of forms from legally binding obligations to national targets. Full details of current air quality obligations relevant to the UK are provided in Annex E. Legally binding standards were established to manage the risk from air pollution and were set using the best available scientific and medical evidence on the effect of pollutants on health or the wider environment. The complexity of the science is such that standards have to be set without perfect information as a means of managing the potential risks. Where such limits are set it should be on the basis of the social consequences of air pollution – meaning that the impact pathway approach, not the abatement cost approach, should be used to assess possible standards.
3.9 The UK is currently projected to comply with the majority of its obligations. You should check current information on the state of compliance of different pollutants, available at: www.gov.uk/air-quality-economic-analysis.
3.10 However compliance with some legally binding obligations is uncertain, particularly the EU limit values for nitrogen dioxide (NO2) and particulate matter (PM10). As of 2012, it is likely to be a number of years before full compliance with NO2 limits are achieved in major towns and cities. Limits for particulate matter are largely met. As such, the two legally binding obligations that are most likely to be relevant for the compliance assessment are:
the PM10 40μg.m-3 (annual mean) objective; and
the NO2 40μg.m-3 (annual mean) objective.
Outcomes from compliance assessment 3.11 There are a number of possible outcomes of a compliance assessment:
a The areas affected by the proposal are expected to be in compliance with legally binding obligations, in the baseline and following implementation of the proposal.
No impact on compliance. Report damage cost estimates.
b The areas affected are expected to alter their compliance status as a result of the proposal (either becoming non-compliant through increased air pollution or becoming compliant through reduced air pollution).
Proposal results in a change in compliance. Proceed to unit abatement cost assessment.
4 Available from http://laqm.defra.gov.uk/review-and-assessment/tools/emissions.html.
This do
cumen
t is ou
t of d
ate.
poch, shou
e majoritymajorityance of dnce of
ally bindiy bindand partd part
pliance wiance wlargely mrgely m
the comhe com
0μg.mg.m--3 3 (a(
2 40μg.m40μg.m
s from com cre are a nre are a
A newer
versi
on is
avail
able
on G
OV.UKd were were
on healton heaave to be e to be
here suchhere suchmeaningmeanin
be used e used
of its oblf its obfferent pofferent p
g obligatobligaculate malate ma
h NOO22 limliet. As suc. As s
iance assnce as
nnual meaual me
(annuaannua
ompliampliaumber ofmber of
The aThe alege

11
c The areas affected are expected to be non-compliant both in the baseline and following implementation of the proposal.
Proposal affects the degree of non-compliance, either improving or worsening its extent. Proceed to unit abatement cost assessment.
This do
cumen
t is ou
t of d
ate.
A newer
versi
on is
avail
able
on G
OV.UK

This do
cumen
t is ou
t of d
ate.
A newer
versi
on is
avail
able
on G
OV.UK

13
4 Unit abatement cost approach
44.1 Where breaches of a legally binding objective occur, the abatement cost approach should be used to value changes in air quality. This applies whether concentrations in an area are already non-compliant or the proposal is likely to cause non-compliance. Where an area is already non-compliant, the abatement cost approach can be used to value both increases and decreases in air pollution.
4.2 Only those changes over the binding limit should be valued using abatement costs; changes up to the binding limit should follow the appropriate impact pathway approach methodology (see Box 1.A for illustrative examples). The abatement cost approach should not be used for objectives that are not legally binding, or when appraising the costs and benefits of alternative target levels or binding obligations – in these instances the impact pathway approach should be used.
Unit cost approach 4.3 Unit costs have been developed to approximate the likely abatement cost based on indicative national abatement technologies. Using these to value changes in emissions is much simpler than undertaking a more comprehensive abatement cost assessment. Unit costs should be used in two circumstances:
as part of an initial assessment of the scale of abatement costs, to determine whether total air quality impacts are in excess of £50 million (in which case the full abatement cost approach should be applied); or
when air quality impacts (damage costs and unit costs) are expected to be less than £50 million.
4.4 Unit costs are the marginal cost of abatement using a particular technology or emission reduction method, measured in £/tonne. Annex B sets out unit abatement costs for emissions of NOx, which is the main air pollutant for which the abatement cost methodology might be needed. Contact Defra for abatement cost information for other pollutants ([email protected]).
Full abatement cost assessment 4.5 A full abatement cost assessment may be necessary for proposals that are expected to affect compliance with legally-binding obligations and have impacts of more than £50 million (valued using damage and unit abatement costs). If you think this is the case you should contact [email protected] for advice. Annex D provides an overview of how such assessments are conducted.
This do
cumen
t is ou
t of d
ate.
e the likehe likeng these g these
sive abatsive aba
sment ofnt olity impacy imp
pproach sroach s
ity impacy impa.
the marge margod, measd, mea
s the maithe maContact Dntact
wer vr ve
rsion
is av
ailab
le on
GOV.U
K; c
ethodolothodolobe used fe used
efits of altfits of alty approay approa
abatemeabatemeo value chvalue c
ment cosment co
the scale e scale s are in eare in e
ould be auld be
s (damags (damag
nal cost o cost oed in £/td in £/
air polluir pofra for ab for ab
gov.ukv.uke). )
tementement

This do
cumen
t is ou
t of d
ate.
A newer
versi
on is
avail
able
on G
OV.UK

15
5 Where to go for further information
Defra’s web pages on air quality valuation
www.gov.uk/air-quality-economic-analysis
HM Treasury, “The Green Book: Appraisal and Evaluation in Central Government”
www.gov.uk/government/publications/the-green-book-appraisal-and-evaluation-in-central-governent
Supplementary Green Book guidance
www.gov.uk/government/organisations/hm-treasury/series/the-green-book-supplementary-guidance
Including:
Energy use and greenhouse gas emissions
www.gov.uk/government/publications/valuation-of-energy-use-and-greenhouse-gas-emissions-for-appraisal
Transport appraisal
www.dft.gov.uk/webtag
This do
cumen
t is ou
t of d
ate. es/thees/the-grg
te
valuationluationou
A newer
versi
on is
avail
able
on G
OV.UKentralentra
UK
en-bookbon
of-energenergva

This do
cumen
t is ou
t of d
ate.
A newer
versi
on is
avail
able
on G
OV.UK

17
A Damage costs
Chart A.1: Air quality damage costs (per tonne, 2010 prices)
CCentral
Estimate (1)
Central Range (2) Sensitivities (3)
Low High Low High
NOX ££955 £744 £1,085 £187 £2,164
SOX ££1,633 £1,320 £1,856 £520 £3,452
Ammonia ££1,972 £1,538 £2,241 £733 £1,069
PM Domestic ££28,140 £22,033 £31,978 £3,033 £79,131
PM Agriculture ££9,703 £7,598 £11,027 £1,046 £27,286
PM Waste ££20,862 £16,335 £23,708 £2,248 £58,666
PM Industry ££25,229 £19,753 £28,669 £2,720 £70,945
PM ESI ££2,426 £1,900 £2,757 £495 £6,257
PM Transport Average ££48,517 £37,987 £55,133 £9,897 £125,134
PM Transport Central London
£221,726 £173,601 £251,961 £45,229 £571,859
PM Transport Inner London ££228,033 £178,540 £259,129 £46,516 £588,126
PM Transport Outer London £148,949 £116,621 £169,261 £30,383 £384,160
PM Transport Inner Conurbation
£117,899 £92,309 £133,975 £24,050 £304,074
PM Transport Outer Conurbation
£73,261 £57,362 £83,252 £14,944 £188,951
PM Transport Urban Big £87,332 £68,377 £99,241 £17,815 £225,240
PM Transport Urban Large ££70,351 £55,081 £79,944 £14,351 £181,443
PM Transport Urban Medium
£55,310 £43,305 £62,853 £11,283 £142,652
PM Transport Urban Small ££34,932 £27,351 £39,696 £7,126 £90,096
PM Rural ££15,041 £11,776 £17,091 £3,068 £38,791 (1) The central damage cost is derived from the lag probability distribution developed to reflect the fact that, although evidence is limited, COMEAP tend towards a greater proportion of the health effect occurring in the years soonest after the pollution. This estimate is intended for use only where a single point estimate is necessary and should always be accompanied by the central range. (2) Variation between the central values reflects uncertainty about the lag between exposure to air pollutants and the associated health impact. The figures presented above vary according to a range between a 0 and 40 year lag. (3) In addition to the lag range, this sensitivity also applies the recommended COMEAP typical high (12%) and typical low (1%) hazard rate sensitivity. For current values and further detail see: www.gov.uk/air-quality-economic-analysis
This do
cport UrbanUrbanoc
umen
t ££en11en1n
t is ou
t of d
ate. £23,708
£28,6£28,t0 ££ttteda
t7,987,987 dadaada
£1£ 73,673,6ofu33 o ££uuut ou
1 t4 t88t i,t is99is44is99sso
tme
uter er on
mmmmdo
cansport Usport Us d
PM TransPM TranThiTAA ne
wer ve
rsio
££er77er33ers,r22rs66sion
is av
ailab
le on
GOV.U
K£3,45£3,45K£1£1UKV
U03333 V
UV
UV
UV
U£1,,0466OV£2,24£2,2GO
9 £G
on757 onononon£55,13355,133e o£25£25bl
ail78,540,540ailailailail£116,6£116,6avi
8
o9
o99
oniisn i
siovBig vvver v
ban LargeLargeerort Urbanrt Urban
ediumum ewsport Urport UA
nA

This do
cumen
t is ou
t of d
ate.
A newer
versi
on is
avail
able
on G
OV.UK

19
B Unit abatement costs BB.1 The abatement options in the table below are an extract from the full marginal abatement cost model. They are those which may represent the marginal technology once all cheaper options have been exhausted.
B.2 It is for the appraiser to decide which value is most appropriate for a particular decision, considering the source and location of the emissions in question. The default value is identified in the table below. It is recommended that sensitivity analysis is undertaken with higher and lower abatement cost technologies. If the default value of £29,150 is used then the abatement costs £28,374 and £72,932 could be used for the upper and lower bounds.
B.3 Refer to the Defra website for current compliance information for different pollutants, www.gov.uk/air-quality-economic-analysis.
Table B.1: Unit abatement costs (2011 prices)
Sector Measure MAC 2015 (£2011/t)1 Emission savings 2015 (tNOx)
Road Transport Euro V Buses replaced by Euro VI
£24,852 1,433
Road Transport Euro V Rigid HGVs replaced by Euro VI
£28,374 3,394
Road Transport Euro IV Buses replaced by Electric*
£29,150* 13
Road Transport Euro V Buses replaced by Hydrogen
£72,932 282
Road Transport Class 1 Euro 5 Diesel LGVs replaced by Class 1 Euro VI
£79,323 559
Commercial Buildings Dry lining of solid walls
£313,555 46
Commercial Buildings External insulation of solid walls
£313,555 8
Domestic Homes Retrofit cavity walls £537,411 3,111
Domestic Homes Improved boiler efficiency
£686,688 113
* This is the default value to be used when there is no clear reason to use one of the other measures. This measure has been selected as the average marginal abatement technology across England. Source: Defra
1 Marginal abatement costs capture a number of wider impacts on society, beyond the impact on NOx emissions and the direct cost of the technology. These are: impacts on other air pollutants; energy and fuel impacts, and health impacts.
This do
cumen
t is ou
t of d
ate. te
dadateC 2015 (£e.te.
da£24,85£24,85
Vs s uro VIo VI
£
useses repls rectric*ric*
ro V BusV Busby Hydroy Hydro
ClasClasLGL
al Buildinl Build
ercialrcia
A newer
versi
on is
avail
able
on G
OV.UK
r ar abatemabatem
ent pollutent pollut
onne oon1/t)1onn nnnn
le28,374,374
ced £29£29
s replacedreplacegenn
1 Euro 5 Euro 5Vs replacs replac
1 Euro VEuro V
gs Dry lDry lww
uildingsdings
mem

This do
cumen
t is ou
t of d
ate.
A newer
versi
on is
avail
able
on G
OV.UK
21
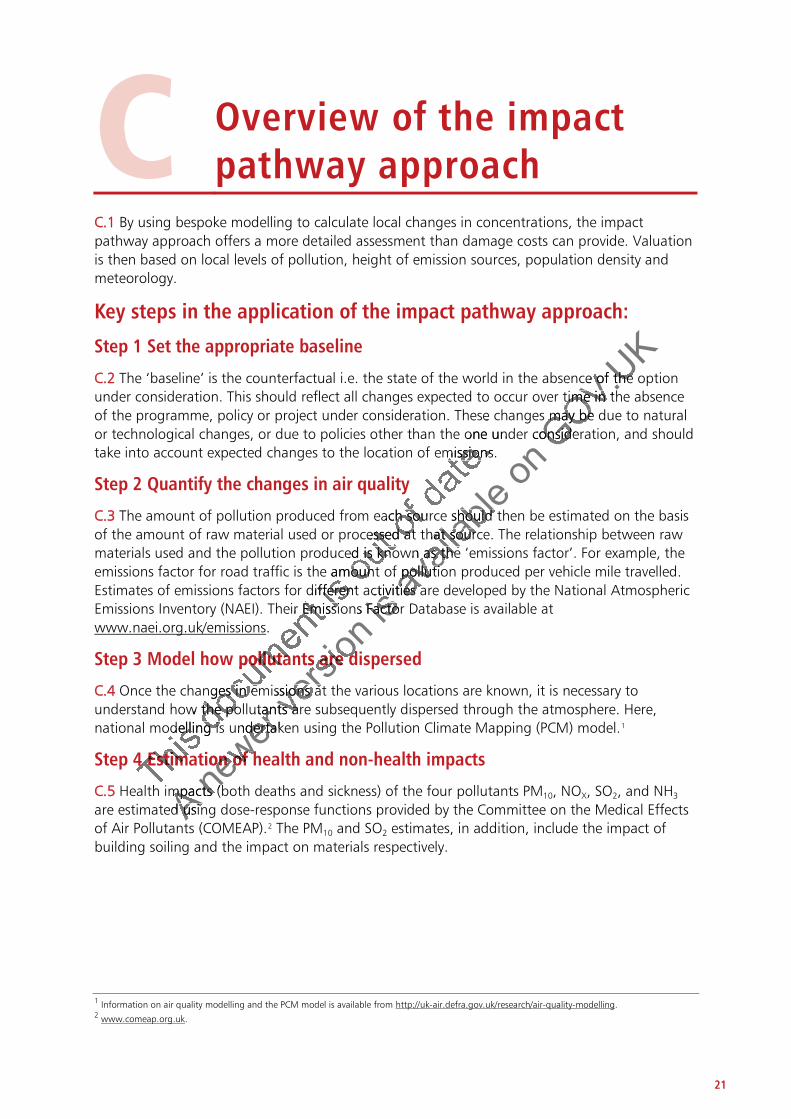
C Overview of the impact pathway approach
CC.1 By using bespoke modelling to calculate local changes in concentrations, the impact pathway approach offers a more detailed assessment than damage costs can provide. Valuation is then based on local levels of pollution, height of emission sources, population density and meteorology.
Key steps in the application of the impact pathway approach:
Step 1 Set the appropriate baseline
C.2 The ‘baseline’ is the counterfactual i.e. the state of the world in the absence of the option under consideration. This should reflect all changes expected to occur over time in the absence of the programme, policy or project under consideration. These changes may be due to natural or technological changes, or due to policies other than the one under consideration, and should take into account expected changes to the location of emissions.
Step 2 Quantify the changes in air quality
C.3 The amount of pollution produced from each source should then be estimated on the basis of the amount of raw material used or processed at that source. The relationship between raw materials used and the pollution produced is known as the ‘emissions factor’. For example, the emissions factor for road traffic is the amount of pollution produced per vehicle mile travelled. Estimates of emissions factors for different activities are developed by the National Atmospheric Emissions Inventory (NAEI). Their Emissions Factor Database is available at www.naei.org.uk/emissions.
Step 3 Model how pollutants are dispersed
C.4 Once the changes in emissions at the various locations are known, it is necessary to understand how the pollutants are subsequently dispersed through the atmosphere. Here, national modelling is undertaken using the Pollution Climate Mapping (PCM) model.1
Step 4 Estimation of health and non-health impacts
C.5 Health impacts (both deaths and sickness) of the four pollutants PM10, NOX, SO2, and NH3 are estimated using dose-response functions provided by the Committee on the Medical Effects of Air Pollutants (COMEAP).2
1 Information on air quality modelling and the PCM model is available from
The PM10 and SO2 estimates, in addition, include the impact of building soiling and the impact on materials respectively.
http://uk-air.defra.gov.uk/research/air-quality-modelling. 2 www.comeap.org.uk.
se one un
missions.missions
ach sourch soucessed atssed at
ed is knod is knoe amountoun
different fferenir EmissioEmissi
pollutanolluta
nges in emes in emw the pothe po
delling isdelling is
4 4 EstimaEstima
th
A newer
versi
on is
avail
able
on G
OV.UK
e of tof the hetime in thtime in
may be may ber consideonsid
e should tshould hat sourcat sour
wn as the as theof pollutiopollutio
ctivities ativities ans Factor Facto
nts are ds are d
issions ations autants arants a
undertakenderta
tion of hon of h
mpacmpa ts (bts (ed usin usin
22
Step 5 Monetisation of impacts
CC.6 The quantified health impacts are then valued using values derived from a contingent valuation study.3
C.7 A more detailed explanation of the impact pathway approach to valuing air quality impacts is available from Defra.
This study is consistent with the values used in deriving damage costs set out in Chapter 2.
4
3 ‘Valuation of health benefits associated with reductions in air pollution’, Defra (2004). Available at http://archive.defra.gov.uk/environment/quality/air/airquality/publications/healthbenefits/airpollution_reduction.pdf. 4 www.gov.uk/air-quality-economic-analysis.
This do
cumen
t is ou
t of d
ate.
A newer
versi
on is
avail
able
on G
OV.UK

23
D Overview of full abatement cost assessment
Key steps in the application of the abatement cost approach:
Step 1 Establish the level of abatement
DD.1 The level of abatement is the change in the concentration above the prescribed minimum standard as a result of the decision. If concentrations are reduced towards the relevant standard, it is avoided abatement and hence a benefit. If concentrations move away from the standard, additional abatement is required and this is a cost. Tools to estimate the change in air quality arising from the proposal are set out in Chapter 3 above. The level of abatement required is likely to vary between areas, so the identification and selection of abatement options will depend upon particular locations.
Step 2 Identify abatement options
D.2 The various options for reducing concentrations of pollutants should be identified. Both technological and behavioural options can be considered – those that reduce the level of emissions through the use of tools and techniques, and those that involve changing human actions. The scope, availability and feasibility of abatement options will depend on the location under consideration.
Step 3 Select the abatement method(s) to be used
D.3 Each abatement option identified needs to be appraised for its costs and benefits to society. As well as financial costs the wider social and environmental costs and benefits must be considered. Other concerns such as public acceptability and the degree of certainty over the method’s effectiveness and cost may also influence the choice of options where appropriate.
D.4 The solution may involve the use of more than one option. For example, it may be cheapest overall to use one method for the first 10μgm-3 of abatement, after which the abatement potential of this method is reduced or further use becomes very expensive, and it becomes sensible to switch to a different method to achieve the remaining abatement required.
D.5 A more detailed explanation of the abatement cost approach to valuing air quality impacts is available from Defra.1
1
www.gov.uk/air-quality-economic-analysis.
This do
cumen
t is ou
t of d
ate.
of pollutof pollunsidered sidered
ques, andes, aty of abatof aba
methodmethod
entified nntifiede wider swider
erns suchns suchss and coand c
n may invmay invone mete me
of this methis m to switcto swit
ore
A newer
versi
on is
avail
able
on G
OV.UKstandatanda
n air quan air qunt requirt requir
nt optionsnt optio
nts shots shouuthose thahose t
those thahose thement opment op
(s) to beto be
eeds to bds to bcial and al and
as public publict may alsmay als
lve the uthe uod for thd fo
hod is reod is reto a diffo a diff
detailed edetailed from Dom D

This do
cumen
t is ou
t of d
ate.
A newer
versi
on is
avail
able
on G
OV.UK

25
E National air quality objectives and European Directive limit and target values
EE.1 The objectives adopted in the UK are defined in the latest Air Quality Strategy for England, Scotland, Wales and Northern Ireland, published in 20071
1
. A summary of the current UK Air Quality Objectives is provided on the next page.
www.gov.uk/government/publications/the-air-quality-strategy-for-england-scotland-wales-and-northern-ireland-volume-1.
This do
cumen
t is ou
t of d
ate.
A newer
versi
on is
avail
able
on G
OV.UK

26
Table E.1: UK Air Quality Objectives
Pollutant Applies Objective Concentration measured as11
Date to be achieved by and
maintained thereafter
European obligations Date to be achieved by
and maintained thereafter
Particles (PM2.5) Exposure Reduction
UK (except Scotland)
25 g.m-3 Annual mean 2020 Target value 25 g.m-3 2010
Scotland 12 g.m-3 2020 Limit value 25 g.m-3 2015
UK urban areas 15% reduction target in concentrations at urban background2
Between 2010 and 2020
20% reduction target in concentrations at urban background3
Between 2010 and 2020
Particles (PM10)
UK 50μg.m-3 not to be exceeded more than 35 times a year
24 hour mean 31 December 200450μg.m-3 not to be exceeded more than 35 times a year
1 January 2005
UK 40μg.m-3 Annual mean 31 December 2004 40μg.m-3 1 January 2005
Indicative 2010 objectives for PM10 (from the 2000 Air Quality Strategy and 2003 Addendum to the Air Quality Strategy) have been replaced by an exposure reduction approach for PM2.5 (except in Scotland – see below).
Scotland 50μg.m-3 not to be exceeded more than 7 times a year
24 hour mean 31 December 2010
Scotland 18μg.m-3 Annual mean 31 December 2010
Nitrogen dioxideUK
200μg.m-3 not to be exceeded more than 18 times a year
1 hour mean 31 December 2005 200μg.m-3 not to be exceeded more than 18 times a year
1 January 2010
UK 40μg.m-3 Annual mean 31 December 2005 40μg.m-3 1 January 2010
1 An explanation of the different concentration measurements is provided in Volume 2 of the Air Quality Strategy: www.gov.uk/government/publications/the-air-quality-strategy-for-england-scotland-wales-and-northern-ireland-volume-2. 2 25 g.m-3 is a cap to be observed in conjunction with this 15% reduction. 3 The European Directive which includes these proposals for PM2.5 concentrations is currently subject to negotiation and final adoption.
This do
cumen
t is ou
t of d
ate.
ween 2020
33ttte
eann
Air Qualitr Qualn Scotlandtlan
24 ho24 ho
not to beot to bd more tmore
s a yeara year
um
40μg.m40μg.m-33
hhhis
A newer
versi
on is
avail
able
on G
OV.UKKKrget valueget valu
Limit vLimit v
and nd 22
DecembeDecemon
31 De31 De
Strategy arategy see belowee below
meanean
Annual mnual m
n 18 18 1 h1 hsi
we
A s is pris

27
Ozone UK 100μg.m-3 not to be exceeded more than 10 times a year
8 hour mean 31 December 2005
Target of 120μg.m-3 not to be exceeded more than 25 times a year averaged over 3 years
31 December 2010
Sulphur dioxide
UK 266μg.m-3 not to be exceeded more than 35 times a year
15 minute mean 31 December 2005
UK 350μg.m-3 not to be exceeded more than 24 times a year
1 hour mean 31 December 2004
350μg.m-3not to be exceeded more than 24 times a year
1 January 2005
UK 125μg.m-3 not to be exceeded more than 3 times a year
24 hour mean 31 December 2004 125μg.m-3not to be exceeded more than 3 times a year
1 January 2005
Polycyclic aromatic hydrocarbons
UK 0.25ng.m-3 B[a]P As annual average 31 December 2010 Target of 1ng.m-3 31 December 2012
UK 16.25μg.m-3 Running annual mean 31 December 2003
Benzene England and Wales
5μg.m-3 Annual average 31 December 2010 5μg.m-3 1 January 2010
Scotland, Northern Ireland
3.25μg.m-3 Running annual mean 31 December 2010
1,3- butadiene UK 2.25μg.m-3 Running annual mean 31 December 2003
Carbon monoxide UK 10mg.m-3
Maximum daily running 8 hour mean/in Scotland as running 8 hour mean
31 December 2003 10mg.m-3 1 January 2005
Lead UK 0.5μg.m-3 Annual mean 31 December 2004 0.5μg.m-3 1 January 2005
0.25μg.m-3 Annual mean 31 December 2008
National air quality objectives and European Directive limit values for the protection of vegetation and ecosystems
Nitrogen oxides UK 30μg.m-3 Annual mean 31 December 2000 30μg.m-3 19 July 2001
Sulphur dioxide UK 20μg.m-3 Annual mean 31 December 2000 20μg.m-3 19 July 2001
UK 20μg.m-3 Winter average 31 December 2000 20μg.m-3 19 July 2001
This do5μg.mmdo
cumen
t is ou
t of d
ate. Decem
31 31ttteual meanl meaf d
averageverage
Running aunning
RunRuntttenenn
-33do0.25μg.0.25μg
Thuality obThThThThThiThiTTTTA0μgμgA ne00μg.mμg. -3-3ne
wctives aewer
versi
on is
avail
able
on G
OV.UK00μg.μg mm-3-3nn
exceededxceededtimes times
2004004121
ecember ember on31 Dece1 Deceble3131
nual meaual mea
ng annuag annuisMaximum aximum 8 hour m8 hour ScotlScotlhoh
on
v
ewewneneA
28
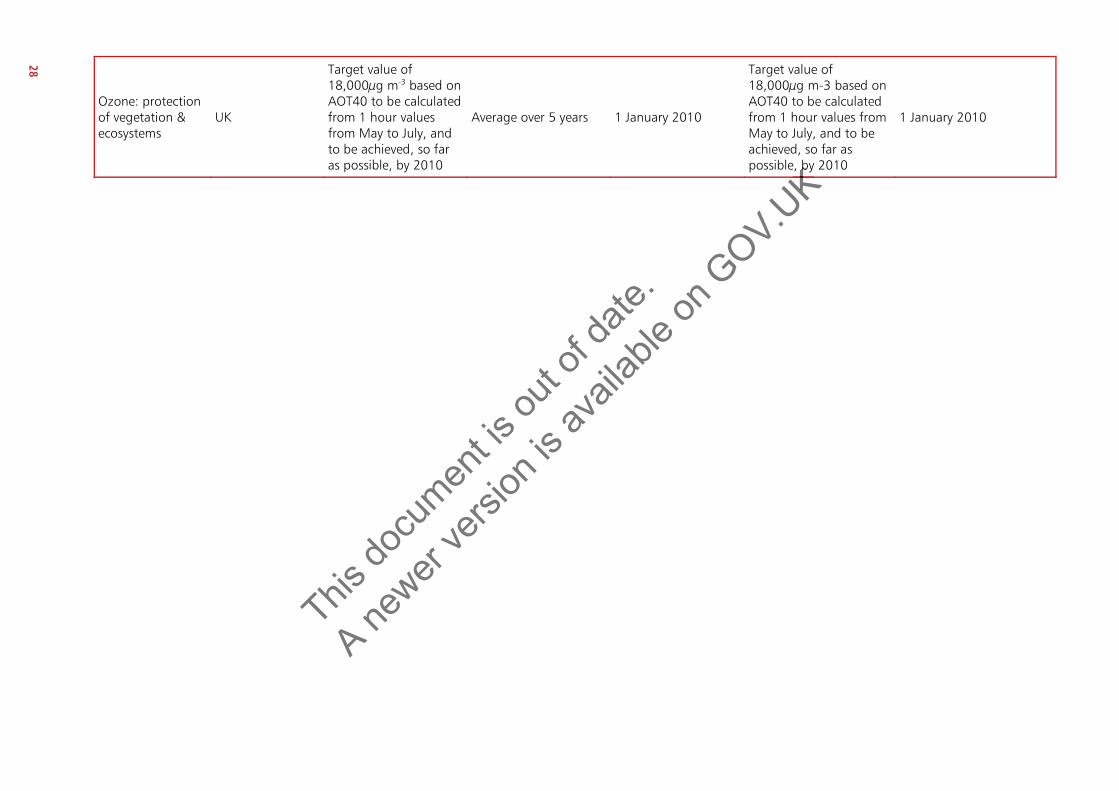
Ozone: protection of vegetation & ecosystems
UK
Target value of 18,000μg m-3 based on AOT40 to be calculated from 1 hour values from May to July, and to be achieved, so far as possible, by 2010
Average over 5 years 1 January 2010
Target value of 18,000μg m-3 based on AOT40 to be calculated from 1 hour values from May to July, and to be achieved, so far as possible, by 2010
1 January 2010
This do
cumen
t is ou
t of d
ate.
A newer
versi
on is
avail
able
on G
OV.UK
byb
K

29
F Glossary Table F.1: Glossary of key terms
AQMA
Air Quality Management Area
Building soiling
The result of airborne particulate matter being deposited on external building surfaces. Darkening the reflectance of the building surface, it causes economic damages through cleaning and amenity costs
COMEAP
Committee on the Medical Effects of Air Pollution
DC
Damage Costs
DMRB
Design Manual for Roads and Bridges
ESI
Energy Supply Industry
Hazard rate
A measure of the risk (probability) of mortality at a given point in time
IGCB(A)
Interdepartmental Group on Costs and Benefits – Air Quality
I-PA
Impact Pathway Approach
Limit Value
Legally binding limit on ambient air quality concentration
NAEI
National Atmospheric Emissions Inventory
NH3
Ammonia
NO2
Nitrogen dioxide
NOX
Oxides of nitrogen
PCM
Pollution Climate Mapping Model
PM10
Particulate matter of 10 micrometers or less in aerodynamic diameter
PM2.5
Particulate matter of 2.5 micrometers or less in aerodynamic diameter
SO2
Sulphur dioxide
Target value
Target values are defined objectives that are not legally binding
This do
cumen
t is ou
t of d
ate. Bridgesridges
e risk (prorisk (pro
artmental mental
mpact Pathact Pat
LegaLega
A newer
versi
on is
avail
able
on G
OV.UK
ces
ability) ofbility) of
roup on Cup on
way Approy Appro
y binding binding
National ational
AA

HM Treasury contacts
This document can be found in full on our website: http://www.gov.uk/hm-treasury
If you require this information in another language, format or have general enquiries about HM Treasury and its work, contact:
Correspondence Team HM Treasury 1 Horse Guards Road London SW1A 2HQ
Tel: 020 7270 5000 Fax: 020 7270 4861
E-mail: [email protected]
This do
cumen
t is ou
t of d
ate.
A newer
versi
on is
avail
able
on G
OV.UK
ctsts