Embed Size (px)
Citation preview
1
Supplementary Information
Diversity in gut bacterial community of school-age children in Asia
Jiro Nakayama1#, Koichi Watanabe2#, Jiahui Jiang1, Kazunori Matsuda2,3, Shiou-Huei Chao4, Pri Haryono5,
Orawan La-ongkham6, Martinus-Agus Sarwoko5, I Nengah Sujaya7, Liang Zhao8, Kang-Ting Chen9, Yen-Po
Chen10, Hsueh-Hui Chiu11, Tomoko Hidaka1, Ning- Xin Huang9, Chikako Kiyohara12, Takashi Kurakawa2,
Naoshige Sakamoto1, Kenji Sonomoto1, Kousuke Tashiro1, Hirokazu Tsuji2, Ming-Ju Chen10, Vichai
Leelavatcharamas13, Chii-Cherng Liao11, Sunee Nitisinprasert6, Endang S. Rahayu5, Fa-Zheng Ren8, Ying-Chieh
Tsai4*, Yuan-Kun Lee9*
1Department of Bioscience and Biotechnology, Faculty of Agriculture, Kyushu University, 6-10-1 Hakozaki,
Higashi-ku, Fukuoka 812-8581, Japan. 2Yakult Central Institute, 1796 Yaho, Kunitachi, Tokyo 186-8659, Japan. 3Yakult Honsha European Research Center for Microbiology, ESV, Technologiepark 4, 9052 Ghent-Zwijnaarde,
Belgium.
4Institute of Biochemistry and Molecular Biology, National Yang-Ming University, 155, Sec 2, Li Nong Street,
Peitou, Taipei 11221, Taiwan. 5Faculty of Agricultural Technology and Center for Food & Nutrition Studies, Universitas Gadjah Mada,
Bulaksumur, Yogyakarta 55281, Indonesia. 6Department of Biotechnology, Kasetsart University, 50 Ngam Wong Wan Road, Chatuchak, Bangkok 10900,
Thailand. 7School of Public Health, Faculty of Medicine, Udayana University, Jalan PB.Sudirman, Denpasar 80230, Bali,
Indonesia. 8College of Food Science & Nutritional Engineering, China Agricultural University, 17 Qinghua Donglu, Hai
Dian District Beijing 100083, P.R. China. 9Department of Microbiology, National University of Singapore, 5 Science Drive 2, Singapore 117597,
Singapore. 10Department of Animal Science and Technology, National Taiwan University, 50 Lane 155, Sec 3, Keelung
Road, Taipei 10673, Taiwan. 11Food Industry Research & Development Institute, PO Box 246, Hsinchu 30062, Taiwan. 12Department of Preventive Medicine, Division of Social Medicine, School of Medical Sciences, Kyushu
University, Maidashi 3-1-1, Higashi-ku, Fukuoka 812-8582, Japan. 13Fermentation Research Center for Value Added Agricultural Products, Khon Kaen University, 123 Mitrapap
Road, Amphur Muang, Khon Kaen, 40002, Thailand.
*Correspondence and requests for materials should be addressed to Y.-K. L. ([email protected])
2
Supplementary Methods
1. DNA/RNA extraction
Bacterial DNA was extracted from samples by the bead-beating method and purified as described previously (1),
with some modification. In brief, Freshly-voided fecal sample was diluted 10-fold with RNAlater and
homogenized. Then, 200 µl of the fecal sample diluents were mixed with 1 ml PBS and vortexed. After
centrifugation at 20,000 × g for 5 min at 4 ºC, the supernatant was removed and washed twice with 1 ml of PBS
buffer to remove PCR inhibitors. The supernatant was discarded and the pellet was stored at –30 ºC until use.
Three hundred milligram of glass beads (diameter, 0.1 mm) (TOMY SEIKO Co., Ltd., Tokyo, Japan), 300 μl of
Tris-SDS solution and 500 μl of TE buffer-saturated phenol were added to a thawed sample, and then vortexed
vigorously using a FastPrep FP120 (Bio 101) at a speed of 5.0 m/sec for 30 s. Four hundred microliter of
phenol/chloroform/isoamyl alcohol (25:24:1; v/v) was added to 400 μl of supernatant and shook vigorously with
the use of FastPrep PF120 at a speed of 4.0 m/sec for 45 s. After centrifugation at 20,000 × g for 5 min at 4 ºC,
250 μl of supernatant was mixed with 25 μl of 3 M sodium acetate (pH 5.2). After being kept for 3 min on ice, 300
μl of ice cold 100% isopropanol was added and centrifuged at 20,000 × g for 5 min at 4 ºC. The pellet of DNA
was washed in 500 μl of ice cold 70% ethanol and air dried prior to suspension in 1 ml of TE buffer (pH 8.0) and
stored at –30 ºC until use.
RNA was extracted from the stool samples by the method described previously (2). The thawed sample was
resuspended in a solution containing 346.5 µl RLT lysis buffer (catalog no. 79216; QIAGEN Sciences,
Germantown MD), 3.5 µl β-meracaptoehtanol (Sigma-Aldrich Co., St. Louis, MO) and 100 Tris-EDTA buffer
(pH 8.0). Then 300 mg of glass beads (diameter, 0.1 mm; TOMY SEIKO Co., Ltd.) was added to the suspension,
and the mixture was vortexed vigorously for 60 s using a FastPrep FP120 (BIO 101) at a speed of 5.0 m/s. Then
500 µl acid phenol (Wako Pure Chemical Industries, Ltd.) was added, and the mixture was incubated at 60 ºC for
10 min. After incubation, the mixture was cooled on ice for 5 min prior to the addition of 100 µl chloroform-
isoamyl alcohol. After centrifugation at 12,000 × g for 5 min, 400 µl of the supernatant was collected and subjected
to isopropanol precipitation. Finally, the nucleic acid fraction was suspended in 50 µl nuclease-free water (Ambion
Inc., Austin, TX, USA). To remove contaminating genomic DNA from the RNA fraction, 0.5 U RNase-free DNase
I (Takara Bio Inc., Shiga, Japan) per µg RNA was added to each sample in a solution containing 1 µl DNase I
buffer (Takara Bio Inc.), followed by incubating at 37 ºC for 20 min. After incubation, the DNase was inactivated
and removed twice by acid-phenol and chloroform-isoamyl alcohol extraction as described above, and the RNA
in the resultant supernatant was collected by isopropanol precipitation. Finally, the RNA was suspended in 50 µl
nuclease-free water.
3
2. qPCR and RT-qPCR
Quantitative PCR amplification (qPCR) and reverse transcription quantitative PCR (RT-qPCR) were performed
in an ABI PRISM 7900HT Sequence Detection system (Applied Biosystems, Foster City, CA, USA). For qPCR
amplification, a 10 µl of reaction mixture was composed in 10 mM Tris-HCl (pH 8.3), 50 mM KCl, 1.5 mM MgCl2
200 µM (each) deoxynucleoside triphosphates, a 1:100,000 dilution of SYBR Green I (Invitrogen), 11 ng of
TaqStart antibody (ClonTech, Palo, Alto, CA) per µl, 0.05 U of Taq DNA polymerase (Takara Bio) per µl, 0.25
µM (each) specific primers (Table S12), and 1 µl of ×1, ×10, and ×100 diluted temperate DNA. The amplification
program consisted of one cycle at 95 °C for 15 min, followed by 45 cycles at 94 °C for 20s, 55 °C for 20 s, and
72 °for 50 s, and finally one cycle of 94 °C for 15 s.
RT-qPCR was carried out using a QIAGEN OneStep RT-PCR kit (QIAGEN, Hilden, Germany). Each 10 µl
reaction mixture was composed of 1 × QIAGEN OneStep RT-PCR buffer, 0.5 × Q-solution buffer, each
deoxynucleoside triphosphate at a concentration of 400 µM each, a 1:100,000 dilution of SYBR Green I
(Invitrogen), 0.4 µl QIAGEN OneStep RT-PCR enzyme mixture, each of the specific primers (Table S12) at a
concentration of 0.6 µM, and 5µl template RNA. The reaction mixture was incubated at 50 °C for 30 min for
reverse transcription to occur, prior to continuous amplification which consisted of one cycle at 95 °C for 15 min,
followed by 45 cycles at 94 °C for 20s, 55 °C for 20 s, and 72 °for 50 s. To distinguish the target PCR product
from the non-targeted PCR products, the melt curve was obtained by continuous fluorescence intensity
measurements as the reaction mix was slowly heated at temperatures from 60 to 95 °C in increments of 0.2 °C/s.
Amplification and detection were carried out in 384-well optical plates with an ABI PRISM 7900HT Sequence
Detection system (Applied Biosystems).
3. 454 pyrotag sequencing and data processing
The V6–V8 region of bacterial 16S rRNA gene was amplified by PCR with a bacterial universal primer set, Q-
968F-# (5’-CWSWSWWSHTWACGCGARGAACCTTACC-3’) and Q-1390R-# (5’-
CWSWSWWSHTTGACGGGCGGTGWGTAC-3’) (# indicates a series of 128 barcode sequence tags underlined
in the sequence) (3). The PCR was performed in a 50 µL volume containing 10 ng to 100 ng extracted DNA as a
template, 10 mM Tris-HCl (pH 8.3), 50 mM KCl, 1.5 mM MgCl2, 200 µM deoxynucleoside triphosphate (dNTP)
mixture, 10 pmol of each primer and 1.25 U TaKaRa Ex Taq HS (Takara Bio, Otsu, Shiga, Japan). The PCR
condition was as follows: 98ºC for 2.5 min; 20 cycles at 98ºC for 15 sec, 54ºC for 30 sec, and 72ºC for 20 sec; and
finally 72ºC for 5 min. The PCR products were purified using a QIAquick PCR Purification Kit (Qiagen, Valencia,
CA, USA) according to the manufacturer’s protocol. The purified products were quantified using a NanoDrop
4
ND-1000 microphotometer (NanoDrop Technologies, Wilmington, DE, USA). After that, equal amounts (100 ng)
of the amplicons from different samples were pooled and purified prior to pyrosequencing by standard ethanol
precipitation. The amplicon mixture DNAs were clonally amplified by emulsion PCR (emPCR) with GS FLX
Titanium LV emPCR Kit (Lib-L) v2 according to manufacturer’s protocol (454 Life Sciences / Roche Diagnostics).
Beads with amplified DNA were loaded onto a GS FLX Titanium PicoTiterPlate with dividers with separate
reaction chambers to accommodate two mixture pools. Sequencing was carried out using an FLX Genome
Sequencer (454 Life Sciences) with GS FLX Titanium Sequencing Kit XLR70 according to the manufacturer’s
protocol (454 Life Sciences). In total, pyrosequencing was performed using five half regions for the 303 samples.
The obtained 454 batch sequence data were sorted into each sample batch by using the QIIME split_library.py
script (http://qiime.org/scripts/split_libraries.html) with the barcode sequences (4). The parameters used in this
script were as follows: l (minimum sequence length) = 408, e (maximum number of errors in barcode) = 0, reverse
primer mismatches = 3, a (maximum number of ambiguous bases) = 3, L (maximum sequence length) = 500, s
(minimum average quality score allowed in read) = 25. As a result, a total 1,866,525 reads were assigned to the
303 subjects. The quality filtered sequences were subjected to USEARCH ver.5.2.236 (5) installed in the QIIME
pipeline to perform filtering of noisy sequences, chimera filtering, and OTU picking. 96,067 sequences were
discarded as noisy reads. Chimera filtering was performed though two steps of de novo Uchime and reference-
based Uchime in which a template sequence set, gold.fa
(http://en.sourceforge.jp/projects/sfnet_microbiomeutil/releases/), was used as reference (6). The denoised reads
were de-replicated to unique sequence and was then sorted by abundance. Clusters with less than four reads were
discarded and the remaining clusters were subjected to OTU clustering at 97% similarity. As a result, 3,003 OTUs
corresponding to 1,704,482 reads [5,623 ± 2,038 (minimum = 1,043) reads per subject] were obtained as non-
redundant OTU set. Representative sequence of each OTU was selected by QIIME pick_rep_set.py program using
the method “first”. Based on the obtained OTU map, the number of times an OTU in each sample was tabulated
by make_otu_table.py program in the QIIME pipeline and OTU table was created as biom format. If required, the
OTU table was subsampled to adjust sampling depth of all samples by multiple_rarefactions.py program in the
QIIME pipeline.
REFERENCES
1. Matsuki, T. et al. Use of 16S rRNA gene-targeted group-specific primers for real-time PCR analysis of
predominant bacteria in human feces. Appl. Environ. Microbiol. 70, 7220-7228 (2004).
5
2. Matsuda, K. et al. Establishment of an analytical system for the human fecal microbiota, based on reverse
transcription-quantitative PCR targeting of multicopy rRNA molecules. Appl. Environ. Microbiol. 75, 1961-
1969 (2009).
3. Nakayama, J. Pyrosequence-based 16S rRNA profiling of gastro-intestinal microbiota. Biosci. Microflora 29,
83-96 (2010).
4. Caporaso, J. G. et al. QIIME allows analysis of high-throughput community sequencing data. Nat. Methods 7,
335-336 (2010).
5. Edgar, R. C. Search and clustering orders of magnitude faster than BLAST. Bioinformatics 26, 2460-2461
(2010).
6. Edgar, R. C. et al. UCHIME improves sensitivity and speed of chimera detection. Bioinformatics 27, 2194-2200
(2011).
6
Supplementary Note 1
Clustering of fecal bacteria communities of 303 Asian children.
Clustering of the 303 Asian samples was attempted at each taxonomic level. From phylum to species level,
clustering was performed using the Jensen-Shannon divergence (JSD) and partitioning around medoid (PAM)
algorithm, as performed in the study which originally defined the enterotypes1. For phylotype level, the distance
was calculated by weighted UniFrac using phylogenetic information2. Significant clustering was not observed
from phylum to order level, whereas consistent clustering emerged with high significance from family to phylotype
level (Table S9). At these taxonomic levels, the optimal number of clusters was suggested to be 2 by maximizing
the Calinski–Harabasz (CH) index (inset in Fig. S2) and confirmed by the two indices of prediction strength (PS)
and average silhouette width (SW) (Fig. S3a). At the number of cluster equal to two, PS and SW were superior to
those of 200 simulation datasets randomized according to the Gaussian deviates based on experimental data (Fig.
S3a), suggesting significant clustering that represents two distinct bacteria communities occurring in the gut
microbiota of Asian children. The Jaccard coefficient was kept high during 1,000 bootstrap resampling, suggesting
the stability of the two clusters (Fig. S3b).
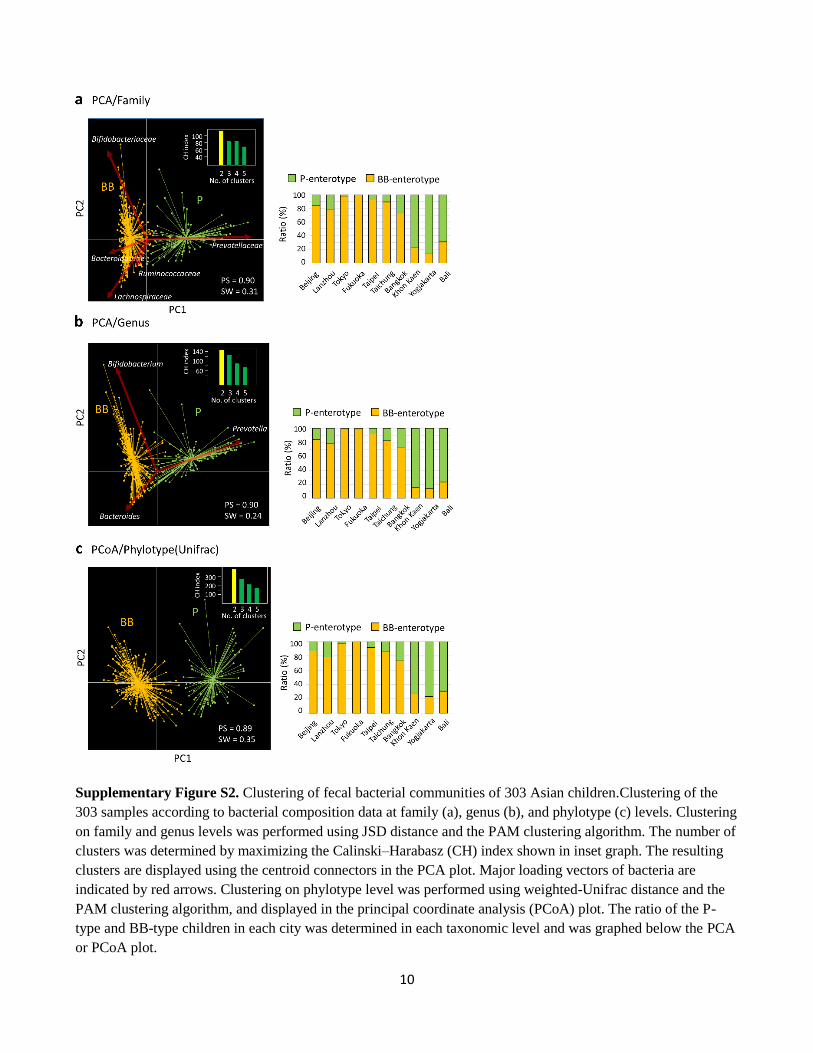
The clusterings on family and genus level are displayed on the PCA plots (Fig. S2a and S2b). The two clusters
were divided into the PC1-positive and PC1-negative regions, similarly in both family and genus levels, although
the partitioning was somewhat fuzzier in the genus level. Major loadings, namely
Bifidobacteriaceae/Bifidobacterium, Bacteroidaceae/Bacteroides and Prevotellaceae/Prevotella, are consistent
between family and genus levels, in which Prevotellaceae/Prevotella drives PC1-positive cluster and the others
drive PC1-negative cluster. Loadings corresponding to Ruminococcaceae and Lachnospiraceae were diminished
in the genus level, likely due to the complexity of genus-level taxonomy in these families. The clustering based
on the weighted UniFrac distance (Fig. 2c) showed a similar profile to those in family and genus levels; 96% and
91% of samples were consistently classified, respectively. This clustering stayed robust even when whole samples
of any one city were removed from the dataset used for clustering (Fig. S3c), suggesting that this clustering does
not depend on local variation specific to a certain city but is involved in global distribution of these two microbiota
types in the Asian children. Distribution of P- and BB-types of children in each city is nearly consistent among the
family, genus, and phylotype level (right panels of Fig. S2).
REFERENCES
1. Arumugam, M. et al., Enterotypes of the human gut microbiome. Nature 473 (7346), 174-180 (2011).
2. Lozupone, C. and Knight, R., UniFrac: a new phylogenetic method for comparing microbial communities.
Appl Environ Microbiol 71 (12), 8228-8235 (2005).
7
Supplementary Note 2
Features of fecal bacterial community in each country (Data deposited in Table S4 to S8)
1. China
Among BB-type countries, the gut microbiota of children living in Beijing and Lanzhou are characterized by a
high abundance of cluster II species, including two Dorea species, as indicated by the heat map of Fig. 5b. This
feature is shared with P-enterotype cities. Another noticeable common feature in these two Chinese cities is the
low abundance of genus Fusobacterium, notably species Fusobacterium mortiferum. Although the majority of
subjects in Beijing and Lanzhou harbored the BB-type microbiota, there are significant differences in their
microbiota. The Bifidobacterium population represents the major difference between these subjects with
averages abundance of 20.0% (1010.25 cells/g feces) in Lanzhou and 11.7% (109.89 cells/g feces) in Beijing (P =
0.0043 for cell counts). In contrast, Lachnospiraceae and Ruminococcaceae are more abundant in children in
Beijing than those in Lanzhou. These differences may be due to the unique diet of residents of Lanzhou, where
dough noodles are the main source of dietary carbohydrate.
2. Japan
Children in Japan mostly harbored the BB-type microbiota. Among BB-type countries, their microbiota is
particularly characteristic in terms of a high abundance of Bifidobacterium (20.3%) and relatively low
abundance of Bacteroides (12.4%), similar to that of the children from Lanzhou. Further, there are a number of
distinct features in their microbiota, e.g., a high abundance of families Peptosterptococcaceae and Bacillaceae,
and genera Veillonella and Eggerthella, and a low abundance of family Enterobacteriaceae and genera
Phascolarctobacterium, Slakia, and Desulfovibrio. As shown in Fig. 5b, Dialister invisus is particularly frequent
(67%) in children in Japanese compared to other children (18%). It is known that Dialister invisus is associated
with dysbiosis of the faecal microbiota in patients with Crohn's disease. It is also interesting that Bifidobacterium
animalis was detected in 10 out of 83 tested subjects in Japan, while it was detected in only two Chinese subjects
in the other countries. E. coli (0.10% versus 0.61% for total average) and Clostridium perfringens (0.0029%
versus 0.088% for total average) were notably less abundant in the children in Japan compared to the other
countries. Lactococcus garvieae which is known as a fish pathogen was not detected in the children from Japan
whereas it was detected in 20% of children from the other countries. The qPCR data also indicates a significantly
lower level (p < 0.01) and prevalence (p < 0.05) of C. perfringens and Enterobacteriaceae in Japan (Table S8).
It is also evident from Fig. 6a that the gut microbiota of Japanese children is remarkably less diversified
compared with children in the other countries. As shown in Fig. 6b, the children from these two Japanese cities
possess significantly similar bacteria community. Only minor differences were observed in Methylobacterium
8
populi, which was detected from 85% of tested subjects in Fukuoka (mean abundance = 0.07%), but not detected
in children from Tokyo and the other countries.
3. Taiwan
The majority of children in Taiwan harbored the BB-type microbiota. Other than the common features found in
BB-type microbiota, there are no distinct features in their bacterial composition. Bacteroides population is
somewhat higher, especially in Taichung (16.9%) even among BB-type countries.
4. Thailand
BB- and P-types are mixed in Thai children, although there is a tendency that BB- and P-types are enriched in
Bangkok and Khon Kaen, respectively. Other than enterotype-like variations, Thai children showed some unique
features in their gut bacterial composition. Enterobacteriaceae was significantly abundant in children in Thai
(2.67%) compared with those in the other countries (1.02%). L. garvieae, was also significantly abundant in Thai
(0.11%) compared with the other countries (0.026%). There are also features unique to either Bangkok or Khon
Kaen, such as a high abundance of Fusobacteriaceae, Collinsella, and Phascolarctobacterium in Bangkok and a
high abundance of Weissella in Khon Kaen. It is noted that total bacteria count of Bangkok children is
significantly lower than the other cities (p < 0.01). Further, the abundance of Bifidobacterium (109.1 cells /g
feces) in children in Bangkok is significantly lower even in the BB-type cities (average 1011.2 cells / g feces).
5. Indonesia
Children from both cities in Indonesia mainly harbored the P-type microbiota. The abundance of Prevotella
accounted for 28.7% in Yogyakarta and 22.9% in Bali. Typical of the P-type microbiota, there are a number of
families and genera that are markedly abundant in Indonesia, such as Succinivibrionaceae, Victivallaceae,
Oxalobacteraceae, Catenibacterium, Slakia, Desulfovibrio, Succinivibrio, Mitsuokella, and Comamonas. It is
interesting to note that children in Yogyakarta and Bali shares similar microbiota profiles (Fig. 6b), although
their populations have different religious backgrounds that affect their dietary habit as shown in Table S1.
9
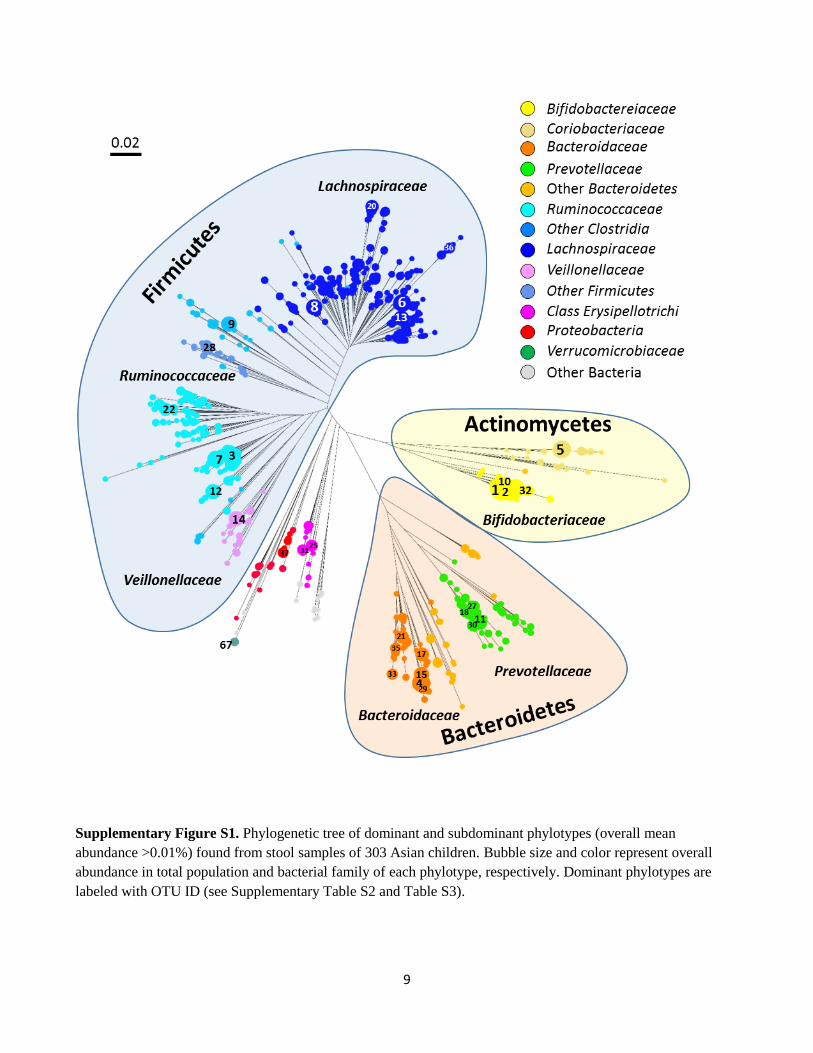
Supplementary Figure S1. Phylogenetic tree of dominant and subdominant phylotypes (overall mean
abundance >0.01%) found from stool samples of 303 Asian children. Bubble size and color represent overall
abundance in total population and bacterial family of each phylotype, respectively. Dominant phylotypes are
labeled with OTU ID (see Supplementary Table S2 and Table S3).
10
Supplementary Figure S2. Clustering of fecal bacterial communities of 303 Asian children.Clustering of the
303 samples according to bacterial composition data at family (a), genus (b), and phylotype (c) levels. Clustering
on family and genus levels was performed using JSD distance and the PAM clustering algorithm. The number of
clusters was determined by maximizing the Calinski–Harabasz (CH) index shown in inset graph. The resulting
clusters are displayed using the centroid connectors in the PCA plot. Major loading vectors of bacteria are
indicated by red arrows. Clustering on phylotype level was performed using weighted-Unifrac distance and the
PAM clustering algorithm, and displayed in the principal coordinate analysis (PCoA) plot. The ratio of the P-
type and BB-type children in each city was determined in each taxonomic level and was graphed below the PCA
or PCoA plot.
11
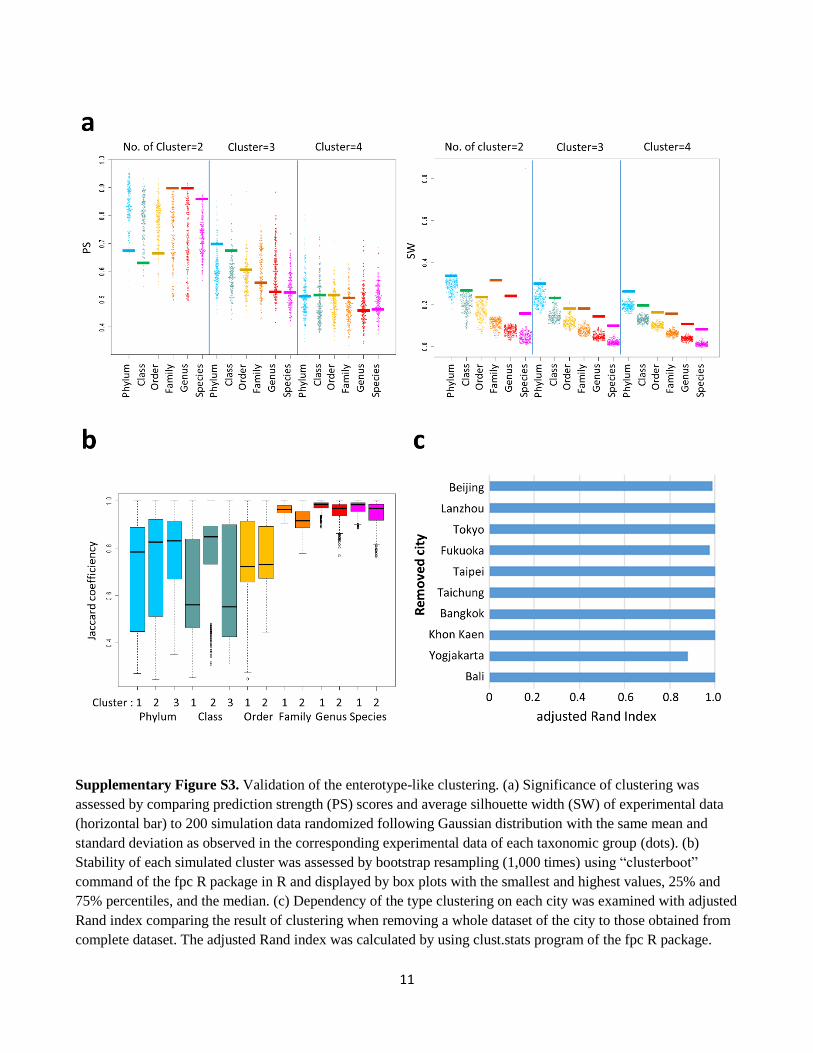
Supplementary Figure S3. Validation of the enterotype-like clustering. (a) Significance of clustering was
assessed by comparing prediction strength (PS) scores and average silhouette width (SW) of experimental data
(horizontal bar) to 200 simulation data randomized following Gaussian distribution with the same mean and
standard deviation as observed in the corresponding experimental data of each taxonomic group (dots). (b)
Stability of each simulated cluster was assessed by bootstrap resampling (1,000 times) using “clusterboot”
command of the fpc R package in R and displayed by box plots with the smallest and highest values, 25% and
75% percentiles, and the median. (c) Dependency of the type clustering on each city was examined with adjusted
Rand index comparing the result of clustering when removing a whole dataset of the city to those obtained from
complete dataset. The adjusted Rand index was calculated by using clust.stats program of the fpc R package.
12
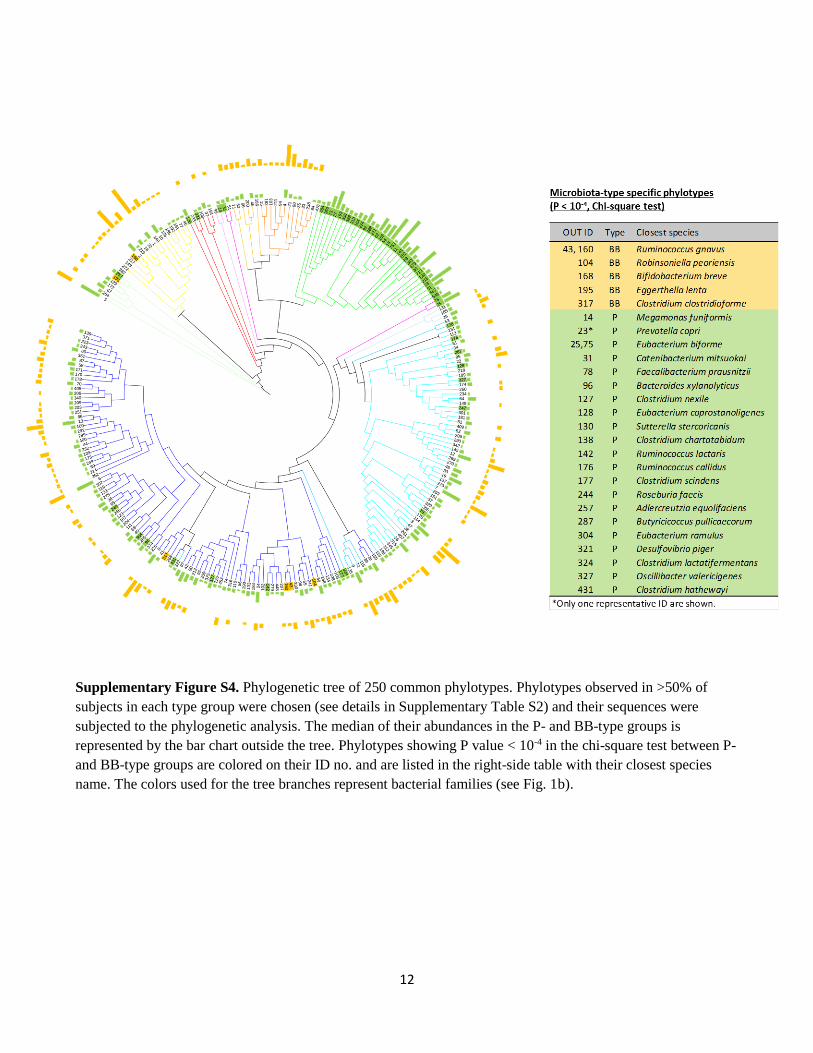
Supplementary Figure S4. Phylogenetic tree of 250 common phylotypes. Phylotypes observed in >50% of
subjects in each type group were chosen (see details in Supplementary Table S2) and their sequences were
subjected to the phylogenetic analysis. The median of their abundances in the P- and BB-type groups is
represented by the bar chart outside the tree. Phylotypes showing P value < 10-4 in the chi-square test between P-
and BB-type groups are colored on their ID no. and are listed in the right-side table with their closest species
name. The colors used for the tree branches represent bacterial families (see Fig. 1b).
13
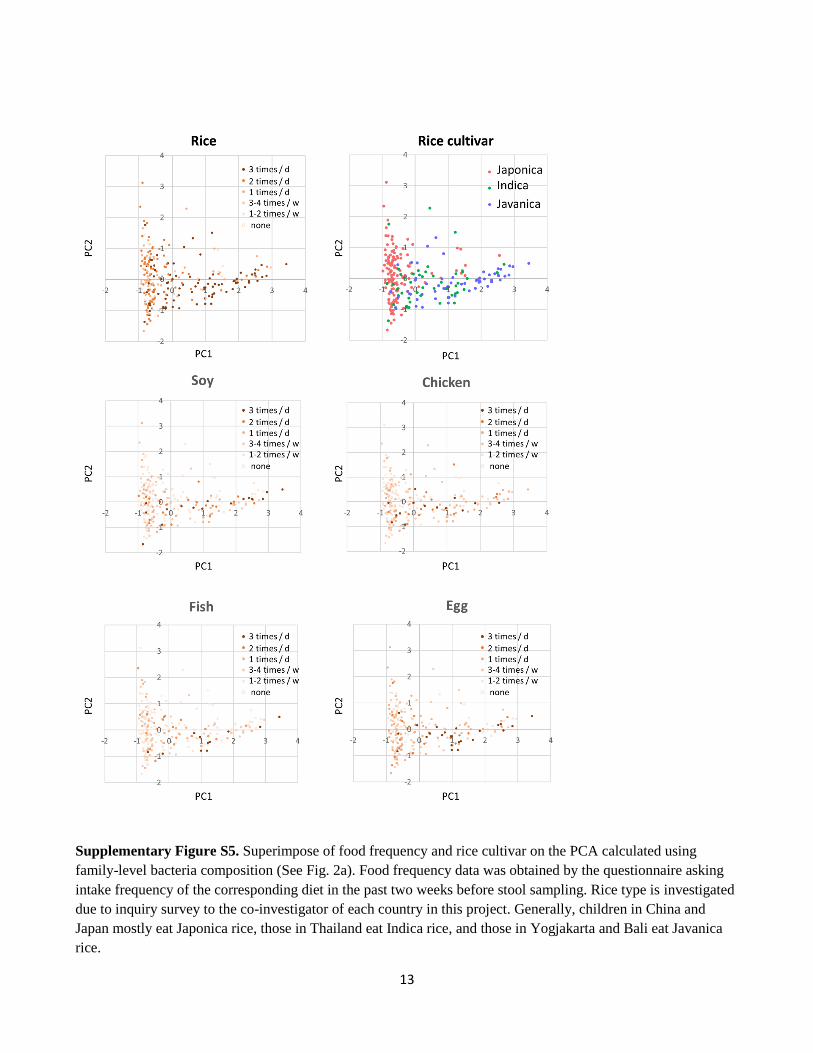
Supplementary Figure S5. Superimpose of food frequency and rice cultivar on the PCA calculated using
family-level bacteria composition (See Fig. 2a). Food frequency data was obtained by the questionnaire asking
intake frequency of the corresponding diet in the past two weeks before stool sampling. Rice type is investigated
due to inquiry survey to the co-investigator of each country in this project. Generally, children in China and
Japan mostly eat Japonica rice, those in Thailand eat Indica rice, and those in Yogjakarta and Bali eat Javanica
rice.
14
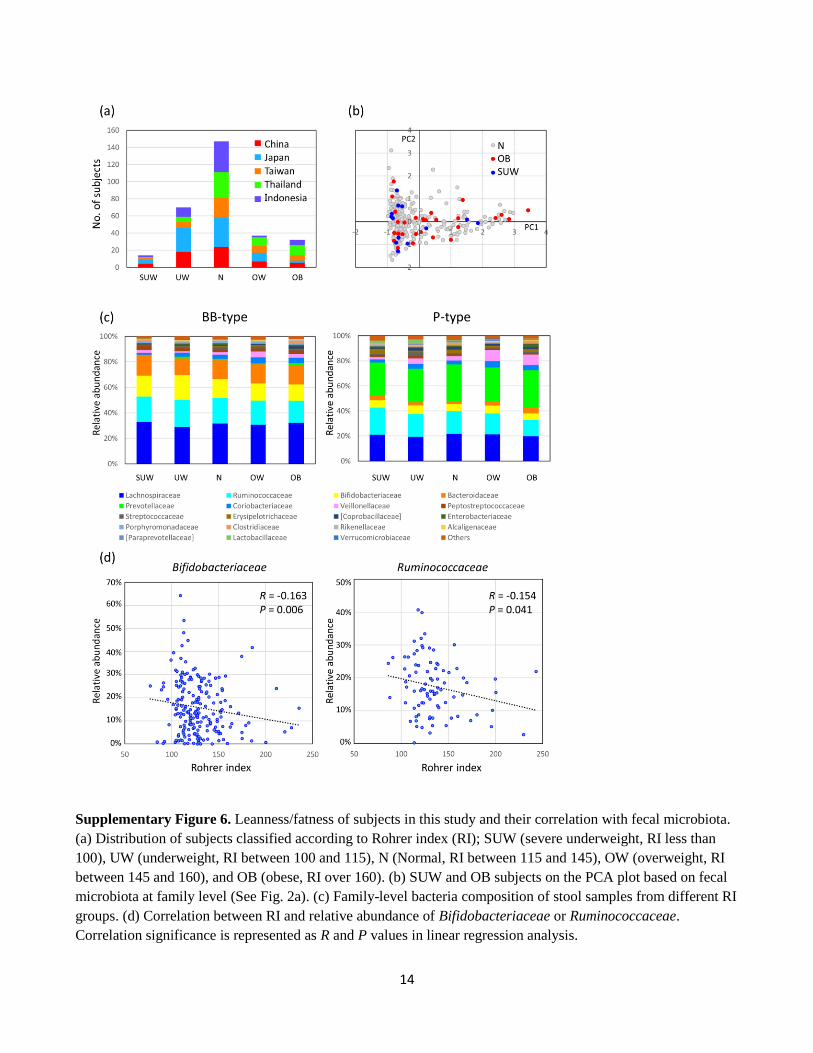
Supplementary Figure 6. Leanness/fatness of subjects in this study and their correlation with fecal microbiota.
(a) Distribution of subjects classified according to Rohrer index (RI); SUW (severe underweight, RI less than
100), UW (underweight, RI between 100 and 115), N (Normal, RI between 115 and 145), OW (overweight, RI
between 145 and 160), and OB (obese, RI over 160). (b) SUW and OB subjects on the PCA plot based on fecal
microbiota at family level (See Fig. 2a). (c) Family-level bacteria composition of stool samples from different RI
groups. (d) Correlation between RI and relative abundance of Bifidobacteriaceae or Ruminococcaceae.
Correlation significance is represented as R and P values in linear regression analysis.
15
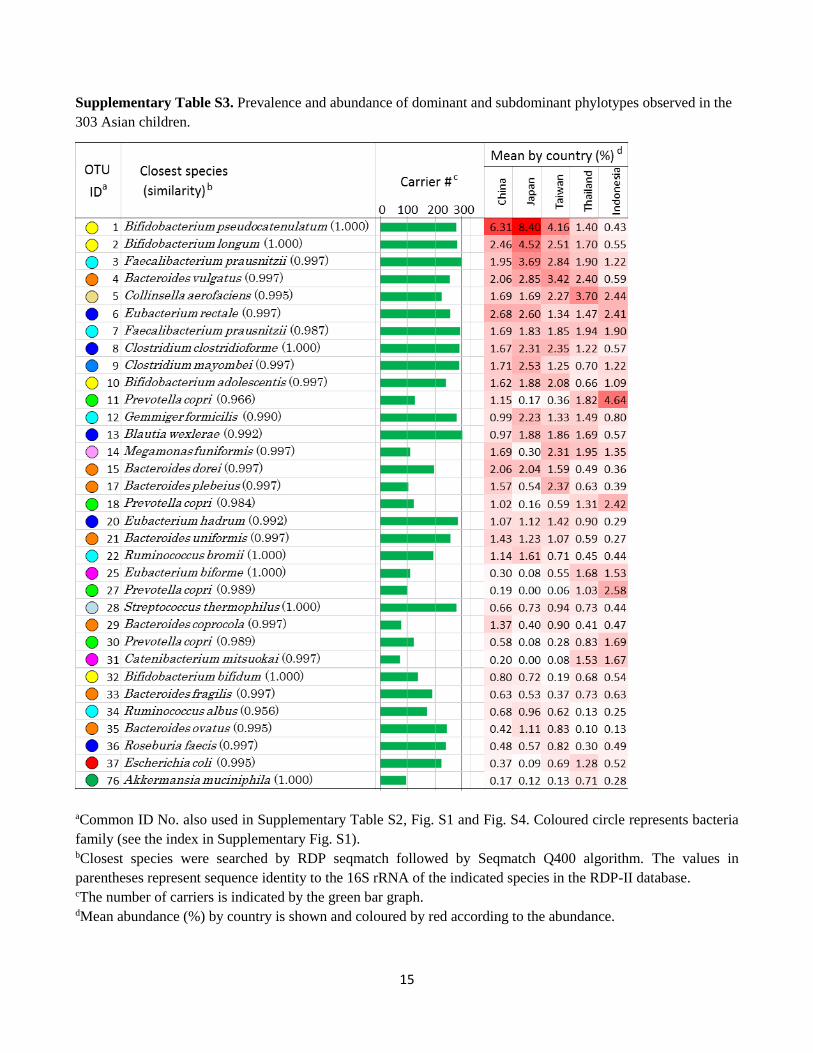
Supplementary Table S3. Prevalence and abundance of dominant and subdominant phylotypes observed in the
303 Asian children.
aCommon ID No. also used in Supplementary Table S2, Fig. S1 and Fig. S4. Coloured circle represents bacteria
family (see the index in Supplementary Fig. S1). bClosest species were searched by RDP seqmatch followed by Seqmatch Q400 algorithm. The values in
parentheses represent sequence identity to the 16S rRNA of the indicated species in the RDP-II database. cThe number of carriers is indicated by the green bar graph. dMean abundance (%) by country is shown and coloured by red according to the abundance.
16
Table S9. Cluster analysis at each taxonomic rank.
aThe optimal number of clusters was chosen by maximizing the Calinski–Harabasz index. bPS/SW: Prediction strength/average Silhouette width. cThe number of samples assigned to each cluster. dWeighted UniFrac was used to calculate distance, while JSD was used for other taxonomic levels.
Taxonomic rank Cluster
numbera
PS/SWb Cluster sizec
Phylum 3 0.70/0.30 130/72/101
Class 3 0.69/0.23 117/84/122
Order 2 0.68/0.23 191/122
Family 2 0.90/0.31 215/88
Genus 2 0.90/0.24 208/95
Species 2 0.86/0.16 213/90
Phylotyped 2 0.89/0.35 219/84


![Cockatiel ([i]Nymphicus hollandicus[i]) gut microbiomes ...Cockatiel (Nymphicus hollandicus) gut microbiomes, bacterial inhabitantsof a worldwide distributed pet Author names and affiliations](https://img.pdfslide.net/doc/110x75/611080c4f40c465cea143cab/cockatiel-inymphicus-hollandicusi-gut-microbiomes-cockatiel-nymphicus.jpg)