Embed Size (px)
Citation preview
Supplementary Information
Metagenomics uncovers a new group of low GC and ultra-small marine
Actinobacteria
Short Title: Novel, ultra-small, low-GC marine Actinobacteria
Rohit Ghai1, Carolina Megumi Mizuno1, Antonio Picazo2, Antonio Camacho2,
Francisco Rodriguez-Valera1
1Evolutionary Genomics Group, Departamento de Producción Vegetal y Microbiología,
Universidad Miguel Hernández, San Juan de Alicante, 03550, Alicante, Spain 2Cavanilles Institute of Biodiversity and Evolutionary Biology – University of Valencia E-46100
Burjassot, Spain.
Corresponding Author: Francisco Rodriguez-Valera
Evolutionary Genomics Group, Departamento de Producción Vegetal y Microbiología, Universidad Miguel Hernández, San Juan de Alicante, 03550, Alicante, Spain Tel: +34 965 919451 Email: [email protected]
Keywords: Low-GC Actinobacteria, metagenomics, deep chlorophyll maximum, rhodopsins
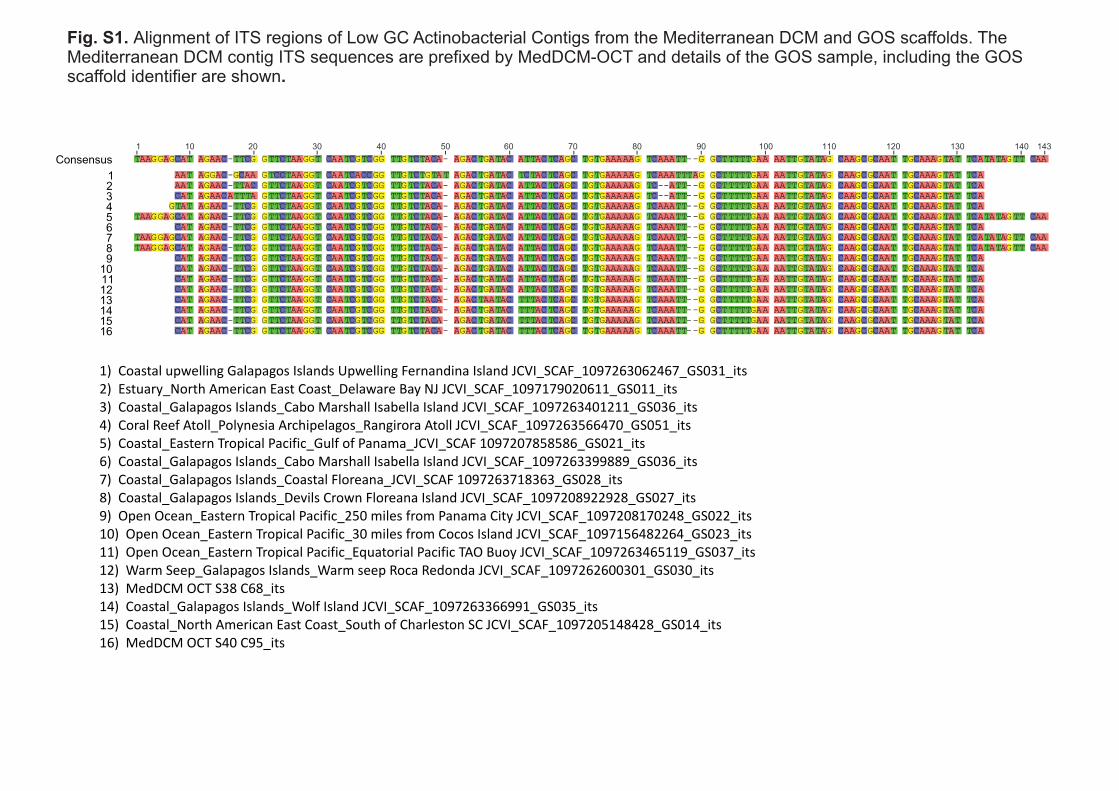
Fig. S1. Alignment of ITS regions of Low GC Actinobacterial Contigs from the Mediterranean DCM and GOS scaffolds. The Mediterranean DCM contig ITS sequences are prefixed by MedDCM-OCT and details of the GOS sample, including the GOS scaffold identifier are shown.
1) Coastal upwelling Galapagos Islands Upwelling Fernandina Island JCVI_SCAF_1097263062467_GS031_its2) Estuary_North American East Coast_Delaware Bay NJ JCVI_SCAF_1097179020611_GS011_its3) Coastal_Galapagos Islands_Cabo Marshall Isabella Island JCVI_SCAF_1097263401211_GS036_its4) Coral Reef Atoll_Polynesia Archipelagos_Rangirora Atoll JCVI_SCAF_1097263566470_GS051_its5) Coastal_Eastern Tropical Pacific_Gulf of Panama_JCVI_SCAF 1097207858586_GS021_its6) Coastal_Galapagos Islands_Cabo Marshall Isabella Island JCVI_SCAF_1097263399889_GS036_its7) Coastal_Galapagos Islands_Coastal Floreana_JCVI_SCAF 1097263718363_GS028_its8) Coastal_Galapagos Islands_Devils Crown Floreana Island JCVI_SCAF_1097208922928_GS027_its9) Open Ocean_Eastern Tropical Pacific_250 miles from Panama City JCVI_SCAF_1097208170248_GS022_its10) Open Ocean_Eastern Tropical Pacific_30 miles from Cocos Island JCVI_SCAF_1097156482264_GS023_its11) Open Ocean_Eastern Tropical Pacific_Equatorial Pacific TAO Buoy JCVI_SCAF_1097263465119_GS037_its12) Warm Seep_Galapagos Islands_Warm seep Roca Redonda JCVI_SCAF_1097262600301_GS030_its13) MedDCM OCT S38 C68_its14) Coastal_Galapagos Islands_Wolf Island JCVI_SCAF_1097263366991_GS035_its15) Coastal_North American East Coast_South of Charleston SC JCVI_SCAF_1097205148428_GS014_its16) MedDCM OCT S40 C95_its
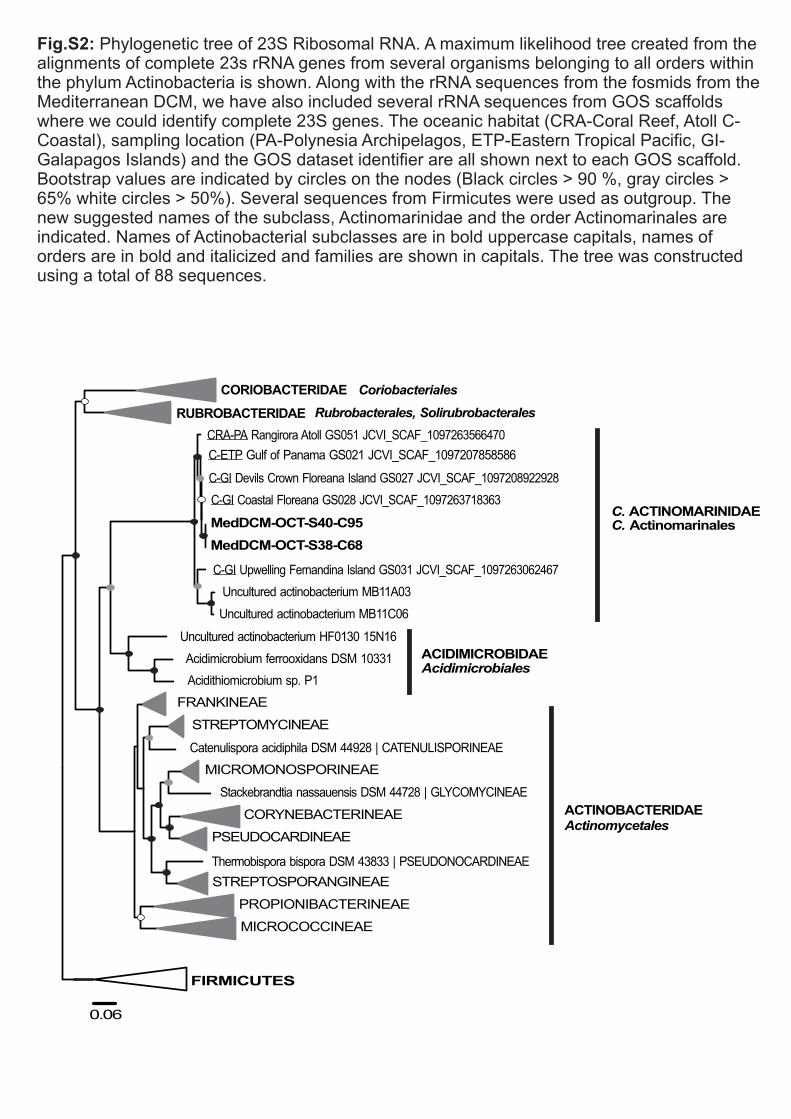
Fig.S2: Phylogenetic tree of 23S Ribosomal RNA. A maximum likelihood tree created from the alignments of complete 23s rRNA genes from several organisms belonging to all orders within the phylum Actinobacteria is shown. Along with the rRNA sequences from the fosmids from the Mediterranean DCM, we have also included several rRNA sequences from GOS scaffolds where we could identify complete 23S genes. The oceanic habitat (CRA-Coral Reef, Atoll C-Coastal), sampling location (PA-Polynesia Archipelagos, ETP-Eastern Tropical Pacific, GI-Galapagos Islands) and the GOS dataset identifier are all shown next to each GOS scaffold. Bootstrap values are indicated by circles on the nodes (Black circles > 90 %, gray circles > 65% white circles > 50%). Several sequences from Firmicutes were used as outgroup. The new suggested names of the subclass, Actinomarinidae and the order Actinomarinales are indicated. Names of Actinobacterial subclasses are in bold uppercase capitals, names of orders are in bold and italicized and families are shown in capitals. The tree was constructed using a total of 88 sequences.
0.06
FIRMICUTES
MICROMONOSPORINEAE
MedDCM-OCT-S38-C68
MedDCM-OCT-S40-C95
FRANKINEAE
CORYNEBACTERINEAE
STREPTOMYCINEAE
PROPIONIBACTERINEAE
STREPTOSPORANGINEAE
PSEUDOCARDINEAE
MICROCOCCINEAE
CRA-PA Rangirora Atoll JCVI_SCAF_1097263566470GS051
C-ETP Gulf of Panama GS021 JCVI_SCAF_1097207858586
C-GI Devils Crown Floreana Island JCVI_SCAF_1097208922928GS027
C-GI Coastal Floreana JCVI_SCAF_1097263718363GS028
C-GI Upwelling Fernandina Island JCVI_SCAF_1097263062467GS031
Uncultured actinobacterium MB11A03
Uncultured actinobacterium MB11C06
Uncultured actinobacterium HF0130 15N16
Acidimicrobium ferrooxidans DSM 10331
Acidithiomicrobium sp. P1
Catenulispora acidiphila DSM 44928 | CATENULISPORINEAE
Stackebrandtia nassauensis DSM 44728 | GLYCOMYCINEAE
Thermobispora bispora DSM 43833 | PSEUDONOCARDINEAE
CORIOBACTERIDAE Coriobacteriales
RUBROBACTERIDAE Rubrobacterales, Solirubrobacterales
C. ACTINOMARINIDAEC. Actinomarinales
ACIDIMICROBIDAEAcidimicrobiales
ACTINOBACTERIDAEActinomycetales
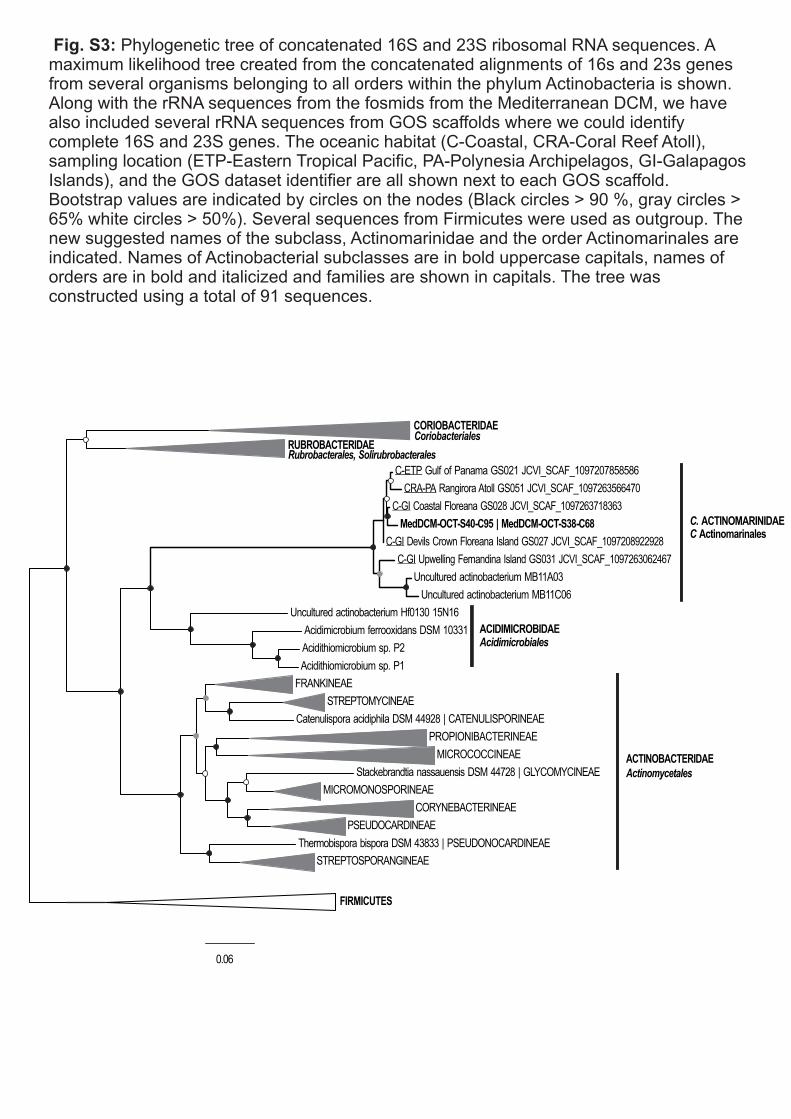
Fig. S3: Phylogenetic tree of concatenated 16S and 23S ribosomal RNA sequences. A maximum likelihood tree created from the concatenated alignments of 16s and 23s genes from several organisms belonging to all orders within the phylum Actinobacteria is shown. Along with the rRNA sequences from the fosmids from the Mediterranean DCM, we have also included several rRNA sequences from GOS scaffolds where we could identify complete 16S and 23S genes. The oceanic habitat (C-Coastal, CRA-Coral Reef Atoll), sampling location (ETP-Eastern Tropical Pacific, PA-Polynesia Archipelagos, GI-Galapagos Islands), and the GOS dataset identifier are all shown next to each GOS scaffold. Bootstrap values are indicated by circles on the nodes (Black circles > 90 %, gray circles > 65% white circles > 50%). Several sequences from Firmicutes were used as outgroup. The new suggested names of the subclass, Actinomarinidae and the order Actinomarinales are indicated. Names of Actinobacterial subclasses are in bold uppercase capitals, names of orders are in bold and italicized and families are shown in capitals. The tree was constructed using a total of 91 sequences.
0.06
C-GI Upwelling Fernandina Island JCVI_SCAF_1097263062467GS031
STREPTOSPORANGINEAE
Acidimicrobium ferrooxidans DSM 10331
CRA-PA Rangirora Atoll JCVI_SCAF_1097263566470GS051
Acidithiomicrobium sp. P2
Uncultured actinobacterium Hf0130 15N16
Thermobispora bispora DSM 43833 | PSEUDONOCARDINEAE
C-GI Devils Crown Floreana Island JCVI_SCAF_1097208922928GS027
C-GI Coastal Floreana JCVI_SCAF_1097263718363GS028
STREPTOMYCINEAE
Stackebrandtia nassauensis DSM 44728 | GLYCOMYCINEAE
MedDCM-OCT-S40-C95 | MedDCM-OCT-S38-C68
PSEUDOCARDINEAE
PROPIONIBACTERINEAE
MICROMONOSPORINEAE
C-ETP Gulf of Panama GS021 JCVI_SCAF_1097207858586
Uncultured actinobacterium MB11A03
Catenulispora acidiphila DSM 44928 | CATENULISPORINEAE
Uncultured actinobacterium MB11C06
MICROCOCCINEAE
Acidithiomicrobium sp. P1
FRANKINEAE
CORYNEBACTERINEAE
RUBROBACTERIDAE
FIRMICUTES
CORIOBACTERIDAE
C. ACTINOMARINIDAEC Actinomarinales
ACIDIMICROBIDAE
ACTINOBACTERIDAE
Rubrobacterales, Solirubrobacterales
Coriobacteriales
Acidimicrobiales
Actinomycetales
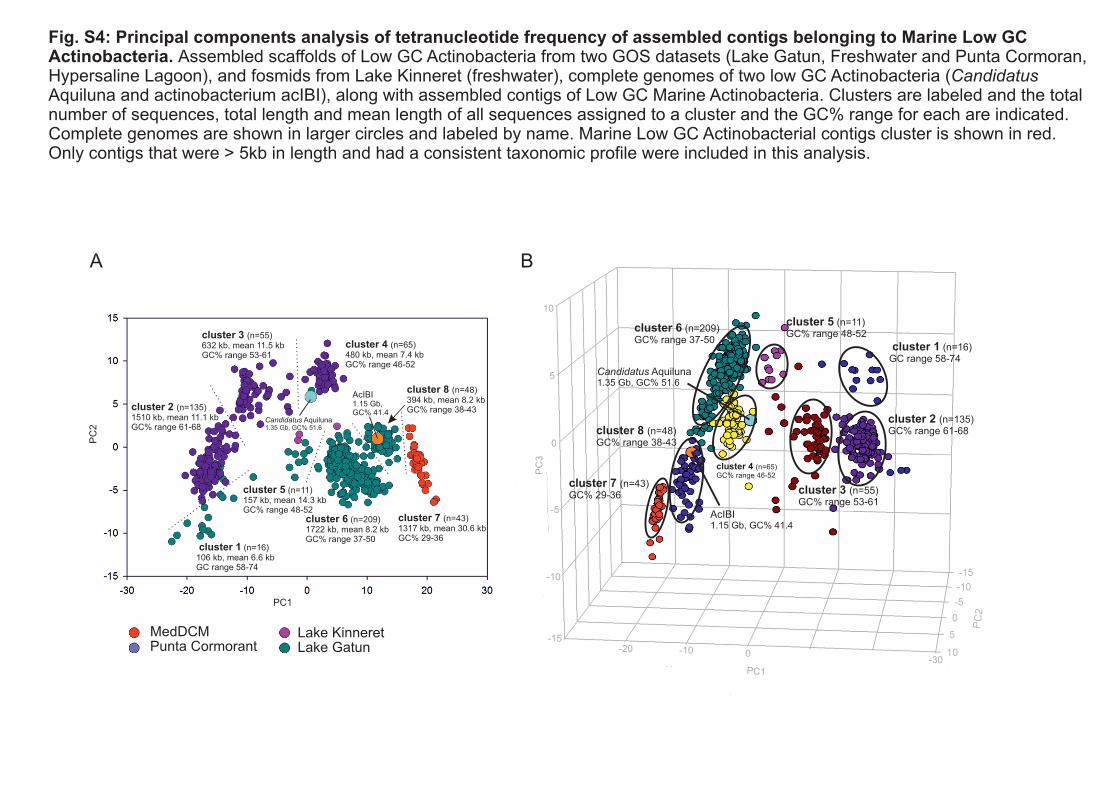
Fig. S4: Principal components analysis of tetranucleotide frequency of assembled contigs belonging to Marine Low GC Actinobacteria. Assembled scaffolds of Low GC Actinobacteria from two GOS datasets (Lake Gatun, Freshwater and Punta Cormoran, Hypersaline Lagoon), and fosmids from Lake Kinneret (freshwater), complete genomes of two low GC Actinobacteria (Candidatus Aquiluna and actinobacterium acIBI), along with assembled contigs of Low GC Marine Actinobacteria. Clusters are labeled and the total number of sequences, total length and mean length of all sequences assigned to a cluster and the GC% range for each are indicated. Complete genomes are shown in larger circles and labeled by name. Marine Low GC Actinobacterial contigs cluster is shown in red. Only contigs that were > 5kb in length and had a consistent taxonomic profile were included in this analysis.
10
5
-5
-10
0
-15
-300-20 -10
PC1
PC
3
PC1
PC
2
Lake Kinneret Lake Gatun
MedDCM Punta Cormorant
Candidatus Aquiluna1.35 Gb, GC% 51.6
AcIBI1.15 Gb, GC% 41.4
106 kb, mean 6.6 kbGC range 58-74
cluster 1 (n=16)
cluster 2 (n=135)1510 kb, mean 11.1 kbGC% range 61-68
cluster 3 (n=55)632 kb, mean 11.5 kbGC% range 53-61
cluster 4 (n=65)480 kb, mean 7.4 kbGC% range 46-52
cluster 5 (n=11)157 kb, mean 14.3 kbGC% range 48-52
cluster 6 (n=209)1722 kb, mean 8.2 kbGC% range 37-50
cluster 8 (n=48)394 kb, mean 8.2 kbGC% range 38-43
cluster 7 (n=43)1317 kb, mean 30.6 kbGC% 29-36
GC range 58-74cluster 1 (n=16)
cluster 2 (n=135)GC% range 61-68
cluster 4 (n=65)GC% range 46-52
cluster 5 (n=11)GC% range 48-52
cluster 6 (n=209)GC% range 37-50
cluster 8 (n=48)GC% range 38-43
cluster 7 (n=43)GC% 29-36 cluster 3 (n=55)
GC% range 53-61
Candidatus Aquiluna1.35 Gb, GC% 51.6
AcIBI1.15 Gb, GC% 41.4
A B
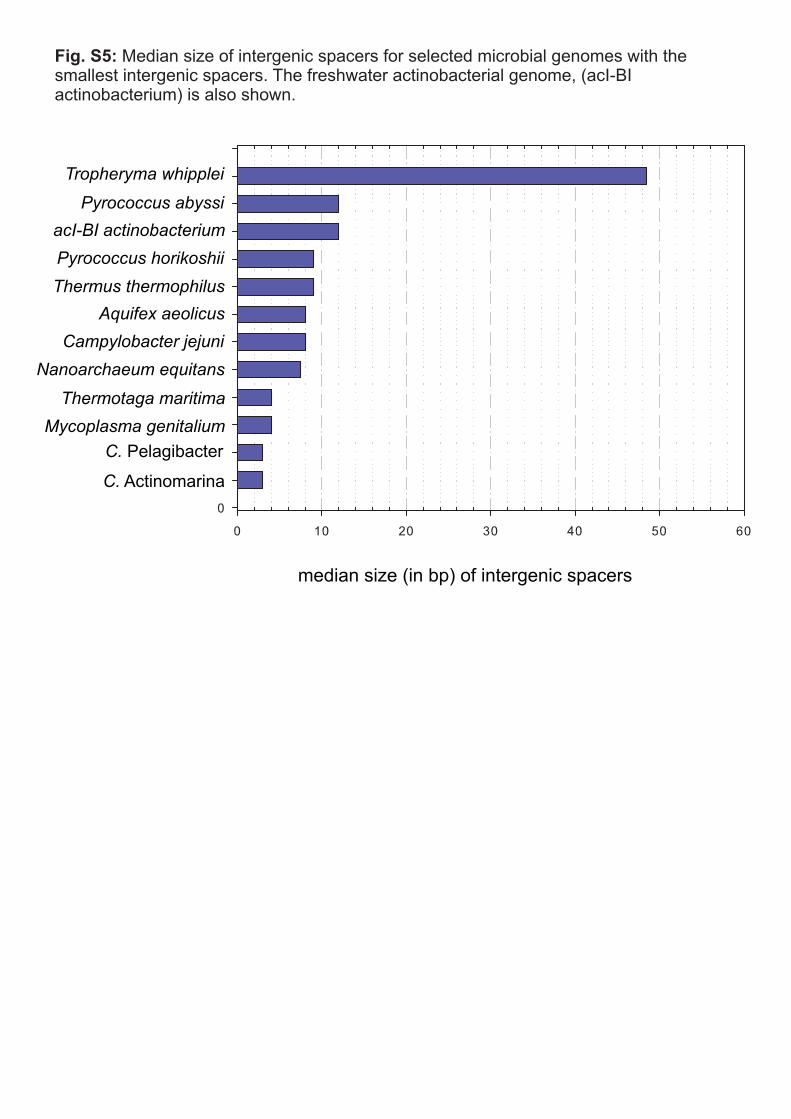
Fig. S5: Median size of intergenic spacers for selected microbial genomes with the smallest intergenic spacers. The freshwater actinobacterial genome, (acI-BI actinobacterium) is also shown.
C. Actinomarina
C. Pelagibacter
Mycoplasma genitalium
Thermotaga maritima
Nanoarchaeum equitans
Campylobacter jejuni
Aquifex aeolicus
Thermus thermophilus
Pyrococcus horikoshii
acI-BI actinobacterium
Pyrococcus abyssi
Tropheryma whipplei
median size (in bp) of intergenic spacers
MedDCM-OCT-S44-C50(34.7 kb, GC%33.47)
MedDCM-OCT-S36-C22(39 kb, GC%33.49)
FeS assemblyATPase SufCFeS assembly
protein SufD
FeS assemblyprotein SufB
DNA modificationmethylase
fumarase
RpiB/LacA/LacBfamily sugar-phosphate
isomerase
carbamoylphosphatesynthase
large subunit
aspartatecarbamoyltransferase
catalytic subunitcarbamoylphosphatesynthase
small subunit
cysteine desulfuraseSufS subfamily
FeS assemblyATPase SufC
lipoylsynthaseABC transporter
related proteinFeS assemblyATPase SufC
FeS assemblyprotein SufB
ubiquinone/menaquinonebiosynthesis methyltransferase
ABC transporter
pyridoxamine 5-Poxidase-related
binding-protein-dependent transport system inner
membrane protein
antibiotic ABC transporterATP-binding protein
propionyl-CoAcarboxylase alcohol
dehydrogenase
tRNA Leu
ABCtransporter
alpha-glucosides-bindingperiplasmic protein AglE
ROK family protein
sugar ABCtransporterpermease
alpha-glucosides-bindingperiplasmic protein
AglE precursor
MazG family protein
50S ribosomalprotein L50
bioY protein
carbamoyl phosphatesynthase L chain ATP
binding proteintRNA Arg
MACrhodopsin
JCVI_SCAF_1097156482175_Eastern_Tropical_Pacific_Cocos_Island_2_m_GS023
JCVI_SCAF_1097205335775_Caribbean_Sea_Gulf_of_Mexico_2_m_GS016
JCVI_SCAF_1097205453281_Caribbean_Sea_Yucatan_Channel_2_m_GS017
JCVI_SCAF_1097205816890_Caribbean_Sea_Northeast_of_Colon_1.7_m_GS019
JCVI_SCAF_1097207869285_Eastern_Tropical_Pacific_Gulf_of_Panama_1.6_m_GS021
JCVI_SCAF_1097208168413_Eastern_Tropical_Pacific_250_miles_from_Panama_City_2_m_GS022
JCVI_SCAF_1097262602060_Galapagos_Islands_Warm_seep,_Roca_Redonda_19_m_GS030
JCVI_SCAF_1097263498021_Tropical_South_Pacific_201_miles_from_F._Polynesia_30_m_GS047
JCVI_SCAF_1099266104707_Sargasso_Sea_Station_5_m_GS000b
JCVI_SCAF_1099266274449_Sargasso_Sea_Sargasso_Station_5_m_GS000a42.7 kb, GC% 26.55
JCVI_SCAF_1099266666974_Sargasso_Sea_Station_5_m_GS000d
JCVI_SCAF_1099266920828_Sargasso_Sea_Hydrostation_5_m_GS001c
JCVI_SCAF_1099266922068_Sargasso_Sea_Hydrostation_5_m_GS001c
JCVI_SCAF_1101670697342_Sargasso_Sea_Hydrostation_5_m_GS001c
Color Scale (%identity)
30-50 50-70 70-80 80-90 90-95 95-100
photolyase
thiol disulfide reductase
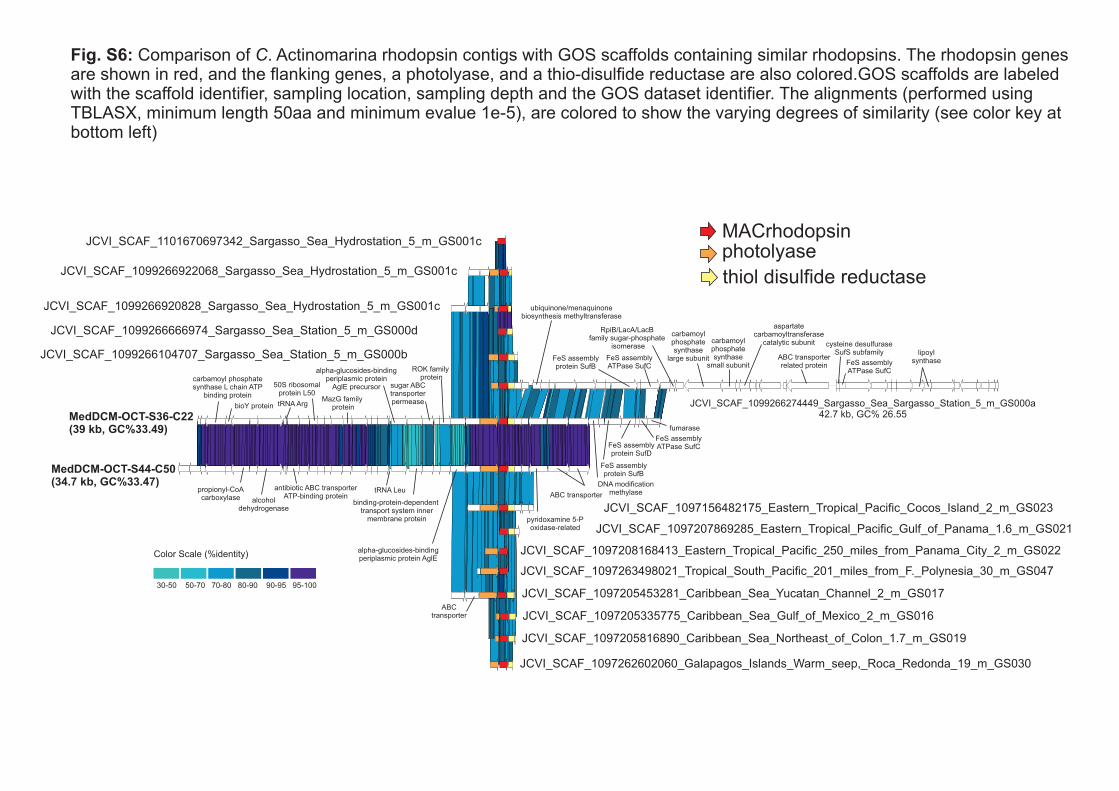
Fig. S6: Comparison of C. Actinomarina rhodopsin contigs with GOS scaffolds containing similar rhodopsins. The rhodopsin genes are shown in red, and the flanking genes, a photolyase, and a thio-disulfide reductase are also colored.GOS scaffolds are labeled with the scaffold identifier, sampling location, sampling depth and the GOS dataset identifier. The alignments (performed using TBLASX, minimum length 50aa and minimum evalue 1e-5), are colored to show the varying degrees of similarity (see color key at bottom left)
Arc
tic M
eta
genom
e
Anta
rctic
a-S
tatio
n_347-0
p1-S
outh
Zone
Anta
rctic
a-S
tatio
n_349-0
p1-S
outh
Zone
Anta
rctic
a-S
tatio
n_351-0
p1-S
outh
Zone
Anta
rctic
a-S
tatio
n_352-0
p1-S
outh
Zone
Anta
rctic
a-S
tatio
n_353-0
p1-S
outh
Zone
Anta
rctic
a-S
tatio
n_357-0
p1-S
outh
Zone
Anta
rctic
a-S
tatio
n_358-0
p1-S
outh
Zone
Anta
rctic
a-S
tatio
n_359-0
p1-S
outh
Zone
Anta
rctic
a-S
tatio
n_360-0
p1-S
outh
Zone
Anta
rctic
a-S
tatio
n_362-0
p1-S
outh
Zone
Anta
rctic
a-S
tatio
n_346-0
p1-N
ort
hZ
one
Anta
rctic
a-S
tatio
n_363-0
p1-N
ort
hZ
one
Anta
rctic
a-S
tatio
n_364-0
p1-N
ort
hZ
one
Anta
rctic
a-S
tatio
n_366-0
p1-N
ort
hZ
one
Anta
rctic
a-S
tatio
n_366-0
p8-N
ort
hZ
one
Anta
rctic
a-S
tatio
n_367-0
p1-N
ort
hZ
one
Anta
rctic
a-S
tatio
n_367-0
p8-N
ort
hZ
one
Anta
rctic
a-S
tatio
n_368-0
p1-N
ort
hZ
one
BA
TS
20m
BA
TS
50m
BA
TS
100m
Medite
rranean D
CM
HO
Ts25m
HO
Ts75m
HO
Ts11
0m
HO
Ts500m
GS
000a-O
pen_O
cean-5
_m
-Sarg
ass
o_S
ea
GS
000b-O
pen_O
cean-5
_m
-Sarg
ass
o_S
ea
GS
000c-
Open_O
cea
n-5
_m
-Sarg
ass
o_S
ea
GS
000d-O
pen_O
cean-5
_m
-Sarg
ass
o_S
ea
GS
001c-
Open_O
cea
n-5
_m
-Sarg
ass
o_S
ea
GS
017-O
pen_O
cean
-2_m
-Caribbean_S
ea
GS
018-O
pen_O
cean-1
.7_m
-Caribbean_S
ea
GS
022-O
pen_O
cean-2
_m
-East
ern
_T
ropic
al_
Paci
fic
GS
023-O
pen_O
cean-2
_m
-East
ern
_T
ropic
al_
Paci
fic
GS
026-O
pen_O
cean-2
_m
-Gala
pagos_
Isla
nds
GS
047-O
pen_O
cean-3
0_m
-Tro
pic
al_
South
_P
aci
fic
GS
110a-O
pen_O
cean-1
.5_m
-India
n_O
cean
GS
112a-O
pen_O
cean-1
.8_m
-India
n_O
cean
GS
113-O
pen_O
cean-1
.8_m
-India
n_O
cean
GS
114-O
pen_O
cean-1
.5_m
-India
n_O
cean
GS
116-O
pen_O
cean-1
.5_m
-India
n_O
cean
GS
119-O
pen_O
cean-2
.0_m
-India
n_O
cean
GS
121-O
pen_O
cean-1
.5_m
-India
n_O
cean
GS
122a-O
pen_O
cean-1
.9_m
-India
n_O
cean
GS
123-O
pen_O
cean-2
.2_m
-India
n_O
cean
GS
002-C
oast
al-1_m
-Nort
h_A
merica
n_E
ast
_C
oast
GS
008-C
oast
al-1_m
-Nort
h_A
merica
n_E
ast
_C
oast
GS
009-C
oast
al-1_m
-Nort
h_A
merica
n_E
ast
_C
oast
GS
010-C
oast
al-1_m
-Nort
h_A
merica
n_E
ast
_C
oast
GS
013-C
oast
al-2.1
_m
-Nort
h_A
merica
n_E
ast
_C
oast
GS
014-C
oast
al-1_m
-Nort
h_A
merica
n_E
ast
_C
oast
GS
015-C
oast
al-1
.7_m
-Caribbean_S
ea
GS
016-C
oast
al_
Sea
-2_m
-Caribbean_S
ea
GS
019-C
oast
al-1
.7_m
-Caribbean_S
ea
GS
02
1-C
oast
al-1.6
_m
-East
ern
_T
ropic
al_
Paci
fic
GS
027-C
oast
al-2.2
_m
-Gala
pagos_
Isla
nds
GS
028-C
oast
al-2_
m-G
ala
pagos_
Isla
nds
GS
029-C
oast
al-2.1
_m
-Gala
pagos_
Isla
nds
GS
031-C
oast
al_
upw
elli
ng-1
2_
m-G
ala
pagos_
Isla
nds
GS
034-C
oast
al-2.1
_m
-Gala
pagos_
Isla
nds
GS
035-C
oast
al-1.7
_m
-Gala
pagos_
Isla
nds
GS
036-C
oast
al-2.1
_m
-Gala
pagos_
Isla
nds
GS
049-C
oast
al-1.4
_m
-Poly
nesi
a_A
rchip
ela
gos
GS
117a-C
oast
al_
sam
ple
-1.8
_m
-India
n_O
cean
GS
051-C
ora
l_R
eef_
Ato
ll-1_m
-Poly
nesi
a_A
rchip
ela
gos
GS
048a-C
ora
l_R
eef-
1.4
_m
-Poly
nesi
a_A
rchip
ela
gos
GS
011
-Est
uary
-1_m
-Nort
h_A
merica
n_E
ast
_C
oast
GS
012-E
stu
ary
-13.2
_m
-Nort
h_A
merica
n_E
ast
_C
oast
GS
020-F
resh
_W
ate
r-2_m
-Panam
a_C
anal
GS
030-W
arm
_S
eep-1
9_
m-G
ala
pagos_
Isla
nds
GS
032-M
angro
ve-0
.1_m
-Gala
pagos_
Isla
nds
GS
033-H
ypers
alin
e-0
.2_m
-Gala
pagos_
Isla
nds
Puert
o R
ico
Tre
nch
Meta
genom
e
% o
f to
tal 1
6S
rR
NA
0
10
20
30
40
Candidatus Actinomarina
Synechococcus
Prochlorococcus
Candidatus Pelagibacter
Polar High Latitude BATS/HOTS/MedDCM GOS Open Ocean GOS Coastal GOS Assorted Deep Sea
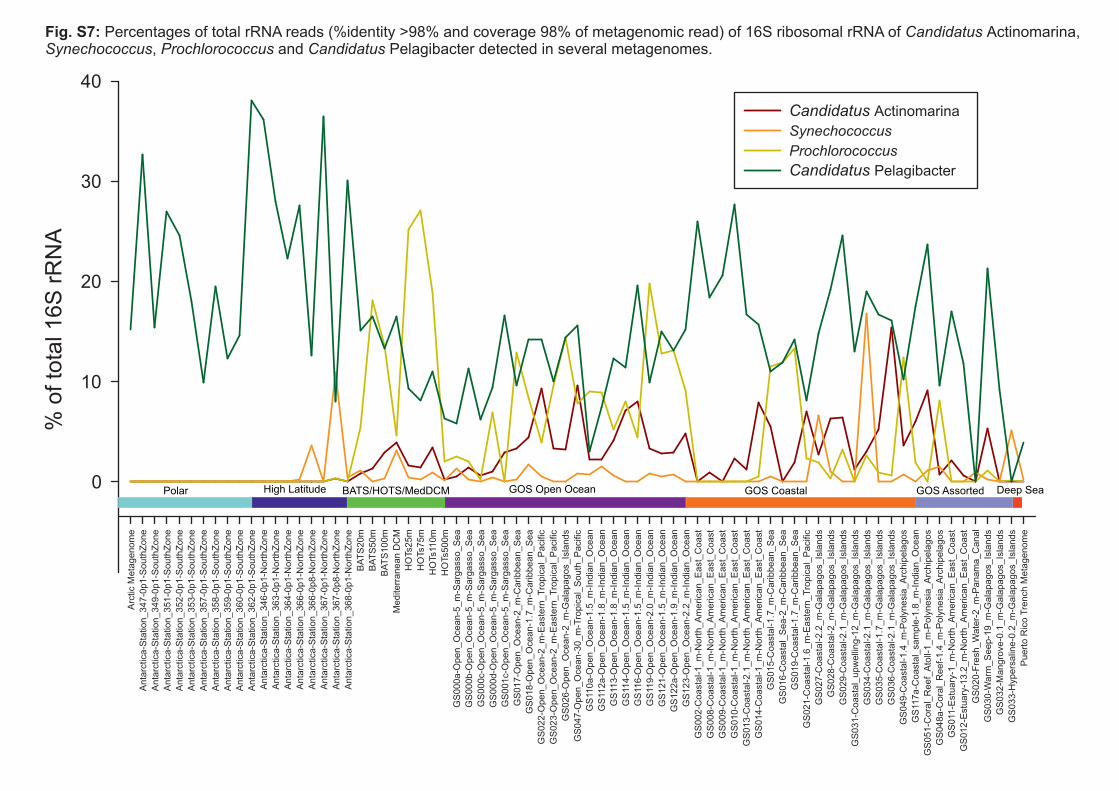
Fig. S7: Percentages of total rRNA reads (%identity >98% and coverage 98% of metagenomic read) of 16S ribosomal rRNA of Candidatus Actinomarina, Synechococcus, Prochlorococcus and Candidatus Pelagibacter detected in several metagenomes.
Supplementary Tables
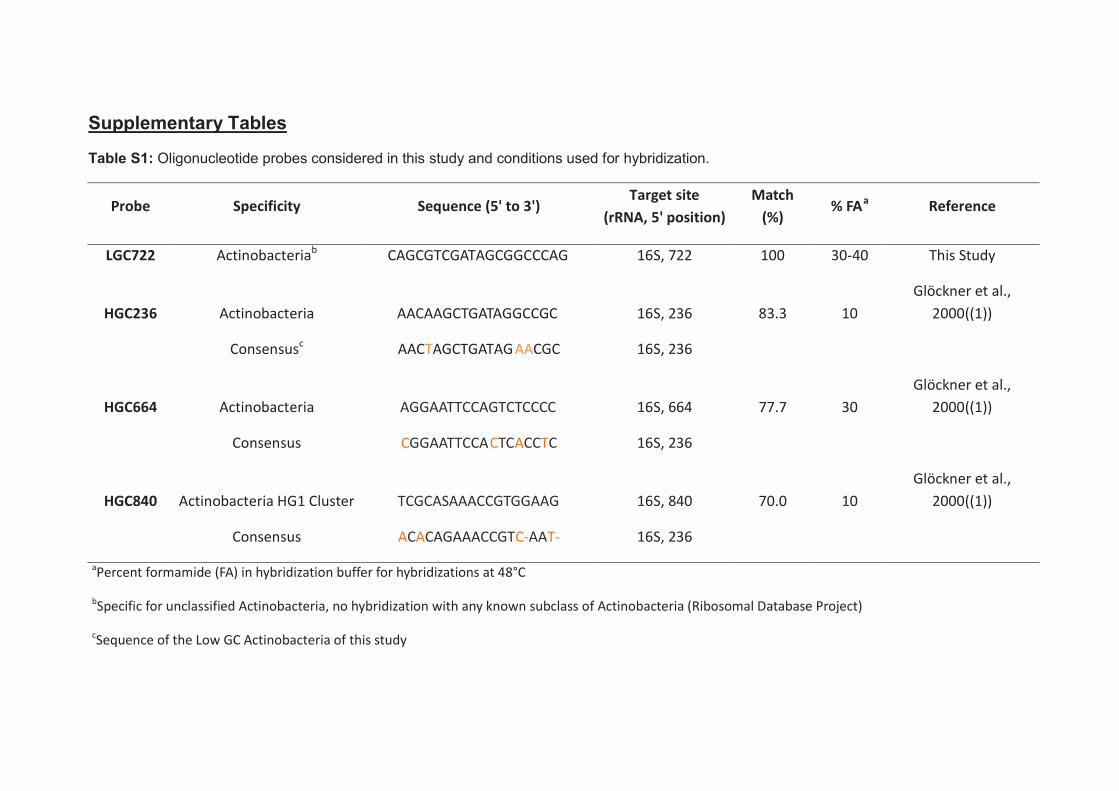
Table S1: Oligonucleotide probes considered in this study and conditions used for hybridization.
Probe Specificity Sequence (5' to 3') Target site
(rRNA, 5' position)
Match
(%) % FAa Reference
LGC722 Actinobacteriab CAGCGTCGATAGCGGCCCAG 16S, 722 100 30-40 This Study
HGC236 Actinobacteria AACAAGCTGATAGGCCGC 16S, 236 83.3 10
Glöckner et al.,
2000((1))
Consensusc AACTAGCTGATAGAACGC 16S, 236
HGC664 Actinobacteria AGGAATTCCAGTCTCCCC 16S, 664 77.7 30
Glöckner et al.,
2000((1))
Consensus CGGAATTCCACTCACCTC 16S, 236
HGC840 Actinobacteria HG1 Cluster TCGCASAAACCGTGGAAG 16S, 840 70.0 10
Glöckner et al.,
2000((1))
Consensus ACACAGAAACCGTC-AAT- 16S, 236
aPercent formamide (FA) in hybridization buffer for hybridizations at 48°C
bSpecific for unclassified Actinobacteria, no hybridization with any known subclass of Actinobacteria (Ribosomal Database Project)
cSequence of the Low GC Actinobacteria of this study
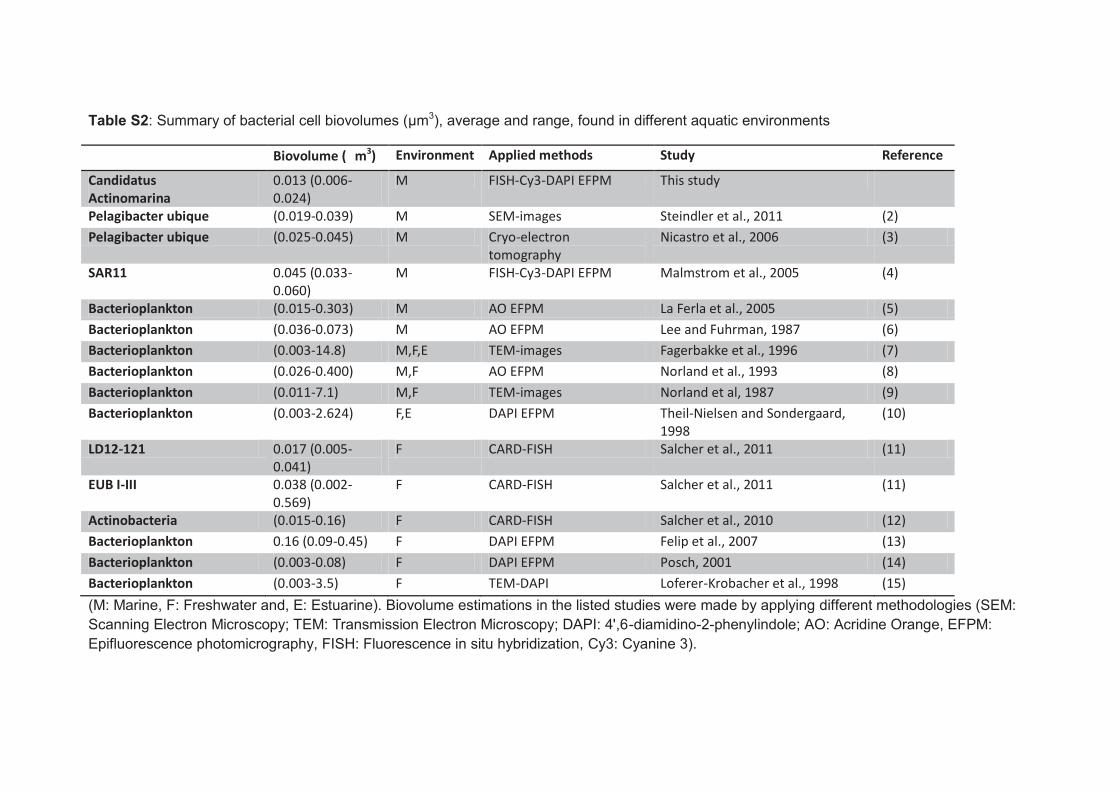
Table S2: Summary of bacterial cell biovolumes (μm3), average and range, found in different aquatic environments
Biovolume ( m3) Environment Applied methods Study Reference
Candidatus Actinomarina
0.013 (0.006-0.024)
M FISH-Cy3-DAPI EFPM This study
Pelagibacter ubique (0.019-0.039) M SEM-images Steindler et al., 2011 (2)
Pelagibacter ubique (0.025-0.045) M Cryo-electron tomography
Nicastro et al., 2006 (3)
SAR11 0.045 (0.033-0.060)
M FISH-Cy3-DAPI EFPM Malmstrom et al., 2005 (4)
Bacterioplankton (0.015-0.303) M AO EFPM La Ferla et al., 2005 (5)
Bacterioplankton (0.036-0.073) M AO EFPM Lee and Fuhrman, 1987 (6)
Bacterioplankton (0.003-14.8) M,F,E TEM-images Fagerbakke et al., 1996 (7)
Bacterioplankton (0.026-0.400) M,F AO EFPM Norland et al., 1993 (8)
Bacterioplankton (0.011-7.1) M,F TEM-images Norland et al, 1987 (9)
Bacterioplankton (0.003-2.624) F,E DAPI EFPM Theil-Nielsen and Sondergaard, 1998
(10)
LD12-121 0.017 (0.005-0.041)
F CARD-FISH Salcher et al., 2011 (11)
EUB I-III 0.038 (0.002-0.569)
F CARD-FISH Salcher et al., 2011 (11)
Actinobacteria (0.015-0.16) F CARD-FISH Salcher et al., 2010 (12)
Bacterioplankton 0.16 (0.09-0.45) F DAPI EFPM Felip et al., 2007 (13)
Bacterioplankton (0.003-0.08) F DAPI EFPM Posch, 2001 (14)
Bacterioplankton (0.003-3.5) F TEM-DAPI Loferer-Krobacher et al., 1998 (15)
(M: Marine, F: Freshwater and, E: Estuarine). Biovolume estimations in the listed studies were made by applying different methodologies (SEM:
Scanning Electron Microscopy; TEM: Transmission Electron Microscopy; DAPI: 4',6-diamidino-2-phenylindole; AO: Acridine Orange, EFPM:
Epifluorescence photomicrography, FISH: Fluorescence in situ hybridization, Cy3: Cyanine 3).
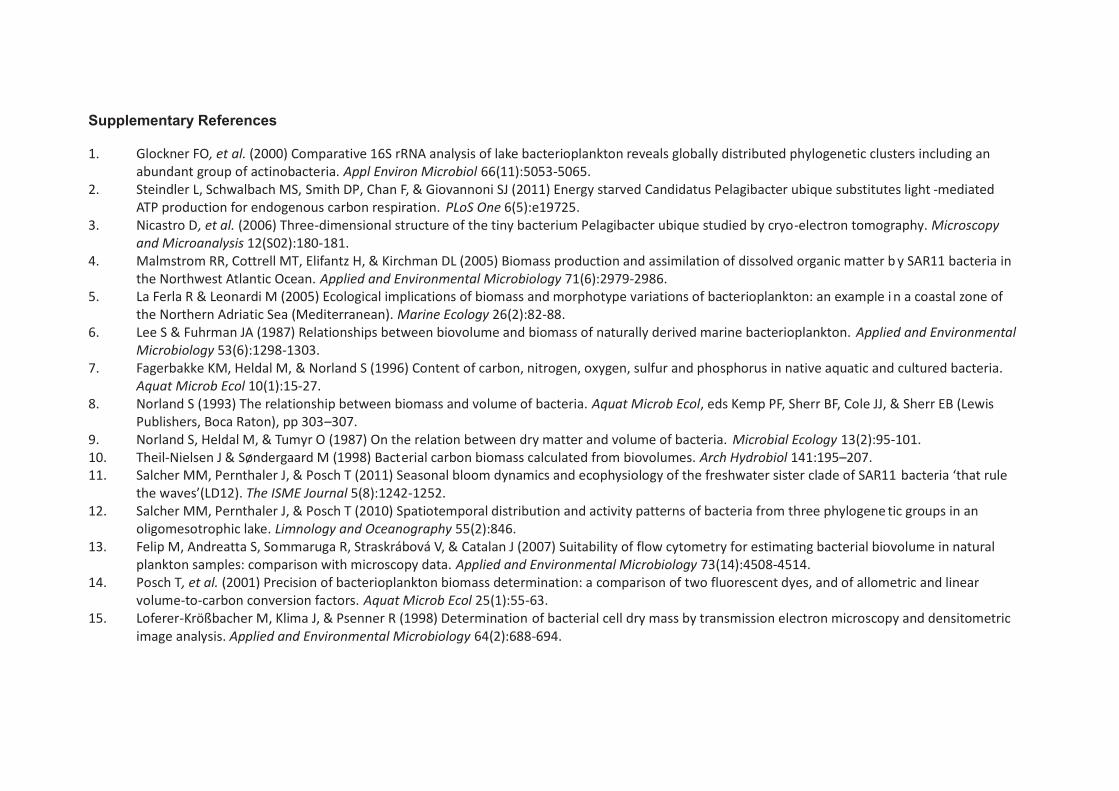
Supplementary References
1. Glockner FO, et al. (2000) Comparative 16S rRNA analysis of lake bacterioplankton reveals globally distributed phylogenetic clusters including an abundant group of actinobacteria. Appl Environ Microbiol 66(11):5053-5065.
2. Steindler L, Schwalbach MS, Smith DP, Chan F, & Giovannoni SJ (2011) Energy starved Candidatus Pelagibacter ubique substitutes light -mediated ATP production for endogenous carbon respiration. PLoS One 6(5):e19725.
3. Nicastro D, et al. (2006) Three-dimensional structure of the tiny bacterium Pelagibacter ubique studied by cryo-electron tomography. Microscopy and Microanalysis 12(S02):180-181.
4. Malmstrom RR, Cottrell MT, Elifantz H, & Kirchman DL (2005) Biomass production and assimilation of dissolved organic matter b y SAR11 bacteria in the Northwest Atlantic Ocean. Applied and Environmental Microbiology 71(6):2979-2986.
5. La Ferla R & Leonardi M (2005) Ecological implications of biomass and morphotype variations of bacterioplankton: an example i n a coastal zone of the Northern Adriatic Sea (Mediterranean). Marine Ecology 26(2):82-88.
6. Lee S & Fuhrman JA (1987) Relationships between biovolume and biomass of naturally derived marine bacterioplankton. Applied and Environmental Microbiology 53(6):1298-1303.
7. Fagerbakke KM, Heldal M, & Norland S (1996) Content of carbon, nitrogen, oxygen, sulfur and phosphorus in native aquatic and cultured bacteria. Aquat Microb Ecol 10(1):15-27.
8. Norland S (1993) The relationship between biomass and volume of bacteria. Aquat Microb Ecol, eds Kemp PF, Sherr BF, Cole JJ, & Sherr EB (Lewis Publishers, Boca Raton), pp 303–307.
9. Norland S, Heldal M, & Tumyr O (1987) On the relation between dry matter and volume of bacteria. Microbial Ecology 13(2):95-101. 10. Theil-Nielsen J & Søndergaard M (1998) Bacterial carbon biomass calculated from biovolumes. Arch Hydrobiol 141:195–207. 11. Salcher MM, Pernthaler J, & Posch T (2011) Seasonal bloom dynamics and ecophysiology of the freshwater sister clade of SAR11 bacteria ‘that rule
the waves’(LD12). The ISME Journal 5(8):1242-1252. 12. Salcher MM, Pernthaler J, & Posch T (2010) Spatiotemporal distribution and activity patterns of bacteria from three phylogene tic groups in an
oligomesotrophic lake. Limnology and Oceanography 55(2):846. 13. Felip M, Andreatta S, Sommaruga R, Straskrábová V, & Catalan J (2007) Suitability of flow cytometry for estimating bacterial biovolume in natural
plankton samples: comparison with microscopy data. Applied and Environmental Microbiology 73(14):4508-4514. 14. Posch T, et al. (2001) Precision of bacterioplankton biomass determination: a comparison of two fluorescent dyes, and of allometric and linear
volume-to-carbon conversion factors. Aquat Microb Ecol 25(1):55-63. 15. Loferer-Krößbacher M, Klima J, & Psenner R (1998) Determination of bacterial cell dry mass by transmission electron microscopy and densitometric
image analysis. Applied and Environmental Microbiology 64(2):688-694.