Embed Size (px)
Citation preview

1
Supplementary information
Pubertal status
Descriptive statistics for pubertal status based on Tanner pubic hair stage for males (stage I
[least advanced] to V [most advanced]) and age of menarche status for females at age 11, 13
and 16 years can be found in supplementary Table 1.
Associations with Academic attainment at 11
Linear regression was used to examine the association between physical activity and
academic attainment assessed at 11 years old and the resulting standardised beta-coefficients
can be found in Supplementary Tables 2 and 3.
Associations with Academic attainment at 13
Supplementary tables 4 and 5 present the associations with academic attainment at age 13
years.
Associations with Academic attainment at 16
Supplementary tables 6 and 7 present the associations with academic attainment at age 16
years. Results presented show that total volume of PA (represented by cpm) predicted
decreased attainment across all areas of the curriculum assessed. Furthermore, when cpm was
not controlled for, MVPA also predicted decreased attainment in some models. These results
therefore suggest that light intensity PA, which comprised the majority of the cpm, may lead
to decreased academic attainment.
Additional adjustment for Full scale IQ
In addition to the fully adjusted models presented (model 5 in results tables), full scale IQ
was also included in regression analyses as an additional confounding variable. This was

2
assessed at ALSPAC clinics at age 8 only. The results of these analyses are presented in
supplementary tables 8 and 9. While the standardised regression coefficients are somewhat
attenuated when full scale IQ is also included in the models, the pattern of results continues
to reflect the results presented in the main paper.
Analyses with only complete data
In order to ensure effects sizes in the fully adjusted models were due to confounding rather
than missing data, for each association, model 1 was repeated for participants who had
complete data at model 5. The resulting regression coefficients were slightly larger than when
all available data were included and results summarised in supplementary tables 10 and 11.

3
Supplementary Table 1. Descriptive statistics for pubertal status
Characteristic Males Females
n Percentage n Percentage
Pubertal status at 11 Experienced menarche - - 298 15.0
Tanner stage I 528 39.0 - -
Tanner stage II 565 41.7 - -
Tanner stage III 206 15.2 - -
Tanner stage IV 53 3.9 - -
Tanner stage V 3 0.2 - -
Pubertal status at 13 Experienced menarche - - 1123 60.5
Tanner stage I 151 11.9 - -
Tanner stage II 301 23.7 - -
Tanner stage III 358 28.2 - -
Tanner stage IV 398 31.3 - -
Tanner stage V 62 4.9 - -
Pubertal status at 16 Experienced menarche - - 1631 99.5
Tanner stage I 3 0.3 - -
Tanner stage II 3 0.3 - -
Tanner stage III 29 2.7 - -
Tanner stage IV 359 33.9 - -
Tanner stage V 664 62.8 - -

4
Supplementary Table 2. Associations between physical activity at 11 years old and academic attainment at 11 years old in males.
Model cpm mvpa % time in mvpa
β 95% CI p value β 95% CI p value β 95% CI p value
English mark
Separate models
1 n=1704 -0.164 -0.21 to -0.12 <0.001 -0.077 -0.12 to -0.03 <0.001 -0.025 -0.07 to 0.02 0.30
2 n = 1607 -0.154 -0.20 to -0.11 <0.001 -0.066 -0.11 to -0.02 0.01 -0.016 -0.06 to 0.03 0.52
3 n = 1527 -0.149 -0.20 to -0.10 <0.001 -0.073 -0.12 to -0.02 <0.001 -0.030 -0.08 to 0.02 0.23
4 n= 1102 -0.188 -0.25 to -0.13 <0.001 -0.109 -0.17 to -0.05 <0.001 -0.060 -0.12 to 0.00 0.05
5 n=991 -0.165 -0.22 to -0.11 <0.001 -0.113 -0.17 to -0.05 <0.001 -0.078 -0.14 to -0.02 0.01
Simultaneous models
1 -0.307 -0.37 to -0.24 <0.001 0.197 0.13 to 0.26 <0.001
2 -0.305 -0.38 to -0.23 <0.001 0.206 0.14 to 0.28 <0.001
3 -0.273 -0.34 to -0.20 <0.001 0.168 0.10 to 0.24 <0.001
4 -0.309 -0.39 to -0.22 <0.001 0.167 0.08 to 0.25 <0.001
5 -0.236 -0.32 to -0.15 <0.001 0.096 0.01 to 0.18 0.03
Maths mark
Separate models
1 n=1708 -0.117 -0.16 to -0.07 <0.001 -0.040 -0.09 to 0.01 0.10 0.002 -0.05 to 0.05 0.94
2 n=1611 -0.111 -0.16 to -0.06 <0.001 -0.032 -0.08 to 0.02 0.21 0.008 -0.04 to 0.06 0.74
3 n=1531 -0.105 -0.15 to -0.06 <0.001 -0.038 -0.09 to 0.01 0.13 -0.006 -0.05 to 0.04 0.80
4 n=1104 -0.129 -0.19 to -0.07 <0.001 -0.066 -0.13 to -0.01 0.03 -0.029 -0.09 to 0.03 0.33
5 n=994 -0.104 -0.16 to -0.04 <0.001 -0.062 -0.12 to 0.00 0.05 -0.037 -0.10 to 0.02 0.24
Simultaneous models
1 -0.249 -0.32 to -0.18 <0.001 0.182 0.11 to 0.25 <0.001
2 -0.248 -0.32 to -0.18 <0.001 0.189 0.12 to 0.26 <0.001
3 -0.216 -0.29 to -0.14 <0.001 0.151 0.08 to 0.22 <0.001
4 -0.229 -0.31 to -0.14 <0.001 0.138 0.05 to 0.22 <0.001
5 -0.166 -0.25 to -0.08 <0.001 0.085 0.00 to 0.17 0.06
Science mark
Separate models

5
1 n=1710 -0.139 -0.19 to -0.09 <0.001 -0.073 -0.12 to -0.03 <0.001 -0.032 -0.08 to 0.02 0.18
2 n=1613 -0.125 -0.17 to -0.08 <0.001 -0.055 -0.10 to -0.01 0.03 -0.017 -0.07 to 0.03 0.51
3 n=1534 -0.114 -0.16 to -0.06 <0.001 -0.059 -0.11 to -0.01 0.02 -0.028 -0.08 to 0.02 0.26
4 n=1106 -0.131 -0.19 to -0.07 <0.001 -0.078 -0.14 to -0.02 0.01 -0.042 -0.10 to 0.02 0.17
5 n=995 -0.102 -0.16 to -0.04 <0.001 -0.068 -0.13 to -0.01 0.03 -0.047 -0.11 to 0.01 0.13
Simultaneous models
1 -0.243 -0.31 to -0.18 <0.001 0.144 0.08 to 0.21 <0.001
2 -0.239 -0.31 to -0.17 <0.001 0.157 0.09 to 0.23 <0.001
3 -0.200 -0.27 to -0.13 <0.001 0.117 0.05 to 0.19 <0.001
4 -0.215 -0.30 to -0.13 <0.001 0.116 0.03 to 0.20 0.01
5 -0.146 -0.23 to -0.06 <0.001 0.060 -0.03 to 0.15 0.18
Note: Tables include standardised beta coefficients (β) and 95% confidence intervals for physical activity variables predicting academic
attainment. Separate models include either cpm, MVPA or % time in MVPA; Simultaneous models adjust for both cpm and % time in MVPA.
Model 1 (minimally adjusted) adjusts for age of participants; model 2 adjusts for age plus birth weight and gestation; model 3 adjusts for
variables in model 2 plus age of mother at delivery, mother’s oily fish intake and whether the mother of participants smoked in the first three
months of pregnancy; model 4 adjusted for variables in model 3 plus the inclusion of BMI Z score relative to UK 1990 reference data and
pubertal stage of participant (recorded at time of outcome); model 5 (fully adjusted) adjusted for all confounders in model 4 plus ethnicity,
maternal educational attainment and occupational social class.

6
Supplementary Table 3. Associations between physical activity at 11 years old and academic attainment at 11 years old in females.
Model cpm mvpa % time in mvpa
β 95% CI p value β 95% CI p value β 95% CI p value
English mark
Separate models
1 n=2114 -0.105 -0.15 to -0.06 <0.001 -0.006 -0.05 to 0.04 0.80 0.057 0.01 to 0.10 0.01
2 n = 1981 -0.108 -0.15 to -0.06 <0.001 -0.007 -0.05 to 0.04 0.76 0.057 0.01 to 0.10 0.01
3 n = 1882 -0.095 -0.14 to -0.05 <0.001 0.00 0.00 to 0.00 0.98 0.054 0.01 to 0.10 0.02
4 n= 1492 -0.073 -0.12 to -0.02 <0.001 0.007 -0.05 to 0.06 0.79 0.056 0.01 to 0.11 0.03
5 n=1316 -0.055 -0.11 to 0.00 0.04 0.005 -0.04 to 0.05 0.83 0.042 -0.01 to 0.09 0.11
Simultaneous models
1 -0.269 -0.33 to -0.21 <0.001 0.240 0.18 to 0.30 <0.001
2 -0.270 -0.33 to -0.21 <0.001 0.239 0.18 to 0.30 <0.001
3 -0.243 -0.30 to -0.18 <0.001 0.218 0.16 to 0.28 <0.001
4 -0.211 -0.28 to -0.14 <0.001 0.199 0.13 to 0.27 <0.001
5 -0.159 -0.23 to -0.09 <0.001 0.151 0.08 to 0.22 <0.001
Maths mark
Separate models
1 n=2104 -0.085 -0.13 to -0.04 <0.001 -0.019 -0.06 to 0.02 0.38 0.019 -0.02 to 0.06 0.38
2 n=1973 -0.090 -0.13 to -0.05 <0.001 -0.021 -0.07 to 0.02 0.36 0.019 -0.03 to 0.06 0.40
3 n=1876 -0.080 -0.12 to -0.04 <0.001 -0.017 -0.06 to 0.03 0.47 0.015 -0.03 to 0.06 0.51
4 n=1485 -0.086 -0.14 to -0.04 <0.001 -0.036 -0.09 to 0.01 0.16 -0.008 -0.06 to 0.04 0.77
5 n=1309 -0.063 -0.11 to -0.01 0.02 -0.035 -0.09 to 0.02 0.19 -0.019 -0.07 to 0.03 0.48
Simultaneous models
1 -0.184 -0.24 to -0.13 <0.001 0.145 0.09 to 0.20 <0.001
2 -0.191 -0.25 to -0.13 <0.001 0.148 0.09 to 0.21 <0.001
3 -0.169 -0.23 to -0.11 <0.001 0.130 0.07 to 0.19 <0.001
4 -0.152 -0.22 to -0.08 <0.001 0.096 0.03 to 0.16 0.01
5 -0.096 -0.17 to -0.02 0.01 0.048 -0.02 to 0.12 0.19
Science mark
Separate models

7
1 n=2110 -0.094 -0.14 to -0.05 <0.001 -0.005 -0.05 to 0.04 0.82 0.041 0.00 to 0.08 0.06
2 n=1977 -0.098 -0.14 to -0.05 <0.001 -0.008 -0.05 to 0.04 0.73 0.039 -0.01 to 0.08 0.08
3 n=1879 -0.085 -0.13 to -0.04 <0.001 -0.001 -0.07 to 0.07 0.98 0.037 -0.01 to 0.08 0.10
4 n=1487 -0.087 -0.14 to -0.04 <0.001 -0.008 -0.06 to 0.05 0.77 0.030 -0.02 to 0.08 0.24
5 n=1312 -0.075 -0.13 to -0.02 0.01 -0.007 -0.06 to 0.04 0.79 0.020 -0.03 to 0.07 0.45
Simultaneous models
1 -0.228 -0.29 to -0.17 <0.001 0.197 0.14 to 0.25 <0.001
2 -0.231 -0.29 to -0.17 <0.001 0.195 0.14 to 0.25 <0.001
3 -0.206 -0.27 to -0.15 <0.001 0.177 0.12 to 0.24 <0.001
4 -0.204 -0.27 to -0.13 <0.001 0.169 0.10 to 0.24 <0.001
5 -0.168 -0.24 to -0.10 <0.001 0.136 0.07 to 0.21 <0.001

8
Supplementary Table 4. Associations between physical activity at 11 years old and academic attainment at 13 years old in males.
Model cpm mvpa % time in mvpa
β 95% CI p value β 95% CI p value β 95% CI p value
English mark
Separate models
1 n=1293 -0.134 -0.19 to -0.08 <0.001 -0.047 -0.10 to 0.01 0.093 0.016 -0.04 to 0.07 0.57
2 n = 1215 -0.129 -0.18 to -0.07 <0.001 -0.041 -0.10 to 0.01 0.015 0.019 -0.04 to 0.08 0.51
3 n = 1161 -0.128 -0.18 to -0.07 <0.001 -0.056 -0.11 to -0.00 0.049 -0.005 -0.06 to 0.05 0.86
4 n= 575 -0.162 -0.24 to -0.08 <0.001 -0.074 -0.16 to 0.01 0.078 -0.018 -0.10 to 0.06 0.67
5 n=532 -0.112 -0.19 to -0.03 0.07 -0.055 -0.14 to 0.03 0.189 -0.017 -0.10 to 0.06 0.68
Simultaneous models
1 -0.301 -0.38 to -0.22 <0.001 0.233 0.16 to 0.31 <0.001
2 -0.299 -0.38 to -0.22 <0.001 0.234 0.15 to 0.31 <0.001
3 -0.264 -0.34 to -0.18 <0.001 0.187 0.11 to 0.27 <0.001
4 -0.303 -0.42 to -0.19 <0.001 0.199 0.08 to 0.31 0.01
5 -0.206 -0.32 to -0.09 0.01 0.131 0.01 to 0.25 0.03
Maths mark
Separate models
1 n=1293 -0.140 -0.19 to -0.09 <0.001 -0.082 -0.14 to -0.03 0.003 -0.031 -0.09 to 0.02 0.26
2 n=1214 -0.137 -0.19 to -0.08 <0.001 -0.083 -0.14 to -0.03 0.004 -0.034 -0.09 to 0.02 0.23
3 n=1159 -0.139 -0.20 to -0.08 <0.001 -0.091 -0.15 to -0.03 0.002 -0.045 -0.10 to 0.01 0.12
4 n=575 -0.150 -0.23 to -0.07 <0.001 -0.101 -0.18 to -0.02 0.018 -0.053 -0.14 to 0.03 0.22
5 n=531 -0.120 -0.20 to -0.04 0.01 -0.096 -0.18 to-0.01 0.028 -0.066 -0.15 to 0.02 0.13
Simultaneous models
1 -0.241 -0.32 to -0.16 <0.001 0.142 0.06 to 0.22 <0.001
2 -0.235 -0.32 to -0.15 <0.001 0.136 0.06 to 0.22 0.01
3 -0.223 -0.30 to -0.14 <0.001 0.117 0.03 to 0.20 0.01
4 -0.227 -0.34 to -0.11 <0.001 0.108 -0.01 to 0.23 0.07
5 -0.151 -0.27 to -0.03 0.02 0.043 -0.08 to 0.17 0.50
Science mark
Separate models

9
1 n=1300 -0.092 -0.15 to -0.04 <0.001 -0.073 -0.13 to -0.02 0.009 -0.046 -0.10 to 0.01 0.10
2 n=1221 -0.081 -0.14 to -0.02 0.01 -0.071 -0.13 to -0.01 0.013 -0.047 -0.10 to 0.01 0.10
3 n=1166 -0.077 -0.13 to -0.02 0.01 -0.076 -0.13 to -0.02 0.010 -0.055 -0.11 to 0.00 0.06
4 n=578 -0.077 -0.16 to -0.01 0.07 -0.031 -0.11 to 0.05 0.470 -0.001 -0.09 to 0.09 0.98
5 n=533 -0.078 -0.17 to 0.01 0.08 -0.045 -0.13 to 0.04 0.314 -0.022 -0.11 to 0.07 0.62
Simultaneous models
1 -0.122 -0.20 to -0.04 <0.001 0.042 -0.04 to 0.12 0.30
2 -0.098 -0.18 to -0.02 0.02 0.024 -0.06 to 0.11 0.57
3 -0.078 -0.16 to 0.01 0.07 0.002 -0.11 to 0.11 0.97
4 -0.153 -0.27 to -0.03 0.01 0.108 -0.01 to 0.23 0.08
5 -0.128 -0.25 to 0.00 0.05 0.070 -0.06 to 0.20 0.28
N.B: Large reduction in sample size when add pubertal status into the model. While there are a decent number of respondents to this question,
only a reduced number also have KS3 data. This reduction does not influence the results unduly but for girls some results are not significant
when use puberty assessed at 13 rather than at the time of the physical activity measurement.

10
Supplementary Table 5. Associations between physical activity at 11 years old and academic attainment at 13 years old in females.
Model cpm mvpa % time in mvpa
β 95% CI p value β 95% CI p value β 95% CI p value
English mark
Separate models
1 n=1577 -0.135 -0.18 to -0.09 <0.001 -0.030 -0.08 to 0.02 0.233 0.039 -0.01 to 0.09 0.12
2 n = 1477 -0.141 -0.19 to -0.09 <0.001 -0.029 -0.08 to 0.02 0.261 0.041 -0.01 to 0.09 0.12
3 n = 1408 -0.126 -0.18 to -0.07 <0.001 -0.022 -0.07 to 0.03 0.397 0.039 -0.01 to 0.09 0.14
4 n= 788 -0.159 -0.23 to -0.09 <0.001 -0.057 -0.13 to 0.01 0.114 0.007 -0.07 to 0.08 0.85
5 n=693 -0.142 -0.21 to -0.07 <0.001 -0.059 -0.13 to 0.01 0.106 0.001 -0.07 to 0.08 0.98
Simultaneous models
1 -0.294 -0.36 to -0.23 <0.001 0.236 0.17 to 0.30 <0.001
2 -0.302 -0.37 to -0.24 <0.001 0.242 0.18 to 0.31 <0.001
3 -0.274 -0.34 to -0.21 <0.001 0.222 0.15 to 0.29 <0.001
4 -0.296 -0.39 to -0.20 <0.001 0.202 0.11 to 0.29 <0.001
5 -0.257 -0.35 to -0.16 <0.001 0.171 0.08 to 0.27 <0.001
Maths mark
Separate models
1 n=1579 -0.087 -0.14 to -0.04 <0.001 -0.010 -0.06 to 0.04 0.701 0.027 -0.02 to 0.08 0.28
2 n=1478 -0.096 -0.15 to -0.05 <0.001 -0.018 -0.07 to 0.03 0.479 0.019 -0.03 to 0.07 0.47
3 n=1407 -0.081 -0.13 to -0.03 <0.001 -0.005 -0.05 to 0.04 0.843 0.025 -0.03 to 0.08 0.34
4 n=789 -0.116 -0.19 to -0.05 <0.001 -0.052 -0.12 to 0.02 0.144 -0.027 -0.10 to 0.04 0.44
5 n=693 -0.087 -0.16 to -0.01 0.02 -0.055 -0.13 to 0.02 0.136 -0.042 -0.11 to 0.03 0.26
Simultaneous models
1 -0.194 -0.26 to -0.13 <0.001 0.158 0.09 to 0.22 <0.001
2 -0.196 -0.26 to -0.13 <0.001 0.151 0.08 to 0.22 <0.001
3 -0.178 -0.25 to -0.11 <0.001 0.144 0.08 to 0.21 <0.001
4 -0.176 -0.27 to -0.08 <0.001 0.090 0.00 to 0.18 0.06
5 -0.106 -0.20 to -0.01 0.03 0.028 -0.07 to 0.12 0.57
Science mark
Separate models

11
1 n=1584 -0.064 -0.11 to -0.01 0.01 -0.028 -0.08 to 0.02 0.260 -0.005 -0.05 to 0.04 0.84
2 n=1482 -0.073 -0.12 to -0.02 0.01 -0.039 -0.09 to 0.01 0.132 -0.016 -0.07 to 0.04 0.55
3 n=1412 -0.069 -0.12 to -0.02 0.01 -0.034 -0.09 to 0.02 0.208 -0.010 -0.06 to 0.04 0.70
4 n=791 -0.119 -0.19 to -0.05 <0.001 -0.096 -0.17 to -0.03 0.007 -0.071 -0.14 to 0.00 0.05
5 n=694 -0.112 -0.19 to -0.04 <0.001 -0.116 -0.19 to -0.04 0.002 -0.093 -0.17 to -0.02 0.01
Simultaneous models
1 -0.111 -0.18 to -0.04 <0.001 0.070 0.00 to 0.14 0.04
2 -0.113 -0.18 to -0.04 <0.001 0.061 -0.01 to 0.13 0.08
3 -0.113 -0.18 to -0.04 <0.001 0.066 0.00 to 0.14 0.07
4 -0.128 -0.22 to -0.03 0.01 0.014 -0.08 to 0.11 0.77
5 -0.088 -0.19 to 0.01 0.09 -0.035 -0.13 to 0.06 0.49

12
Supplementary Table 6. Associations between physical activity at 11 years old and academic attainment at 16 years old in males.
Model cpm mvpa % time in mvpa
β 95% CI p value β 95% CI p value β 95% CI p value
English mark
Separate models
1 n=1272 -0.197 -0.25 to -0.14 <0.001 -0.100 -0.15 to -0.05 <0.001 -0.028 -0.08 to 0.03 0.32
2 n = 1192 -0.195 -0.25 to -0.14 <0.001 -0.098 -0.15 to -0.04 0.001 -0.029 -0.09 to 0.03 0.31
3 n = 1136 -0.188 -0.24 to -0.13 <0.001 -0.113 -0.17 to -0.06 <0.001 -0.057 -0.11 to 0.00 0.04
4 n= 697 -0.192 -0.26 to -0.12 <0.001 -0.113 -0.19 to -0.04 0.002 -0.055 -0.13 to 0.02 0.14
5 n=635 -0.156 -0.23 to -0.08 <0.001 -0.089 -0.16 to -0.02 0.016 -0.041 -0.11 to 0.03 0.27
Simultaneous models
1 -0.373 -0.45 to -0.30 <0.001 0.242 0.16 to 0.32 <0.001
2 -0.374 -0.45 to -0.29 <0.001 0.244 0.16 to 0.32 <0.001
3 -0.318 -0.40 to -0.24 <0.001 0.177 0.10 to 0.26 <0.001
4 -0.333 -0.44 to -0.23 <0.001 0.192 0.09 to 0.30 <0.001
5 -0.273 -0.38 to -0.17 <0.001 0.158 0.05 to 0.26 <0.001
Maths mark
Separate models
1 n=1214 -0.187 -0.24 to -0.13 <0.001 -0.093 -0.15 to -0.04 0.001 -0.024 -0.08 to 0.03 0.41
2 n=1136 -0.191 -0.25 to -0.13 <0.001 -0.093 -0.15 to -0.04 0.002 -0.025 -0.08 to 0.03 0.40
3 n=1081 -0.189 -0.25 to -0.13 <0.001 -0.107 -0.16 to -0.05 <0.001 -0.049 -0.11 to 0.01 0.09
4 n=653 -0.187 -0.26 to -0.11 <0.001 -0.118 -0.19 to -0.04 0.002 -0.061 -0.14 to 0.01 0.11
5 n=592 -0.145 -0.22 to -0.07 <0.001 -0.097 -0.17 to -0.02 0.012 -0.055 -0.13 to 0.02 0.16
Simultaneous models
1 -0.358 -0.44 to -0.28 <0.001 0.236 0.16 to 0.32 <0.001
2 -0.372 -0.45 to -0.29 <0.001 0.246 0.16 to 0.33 <0.001
3 -0.333 -0.42 to -0.25 <0.001 0.196 0.11 to 0.28 <0.001
4 -0.313 -0.42 to -0.20 <0.001 0.171 0.06 to 0.28 <0.001
5 -0.227 -0.34 to -0.12 <0.001 0.111 0.00 to 0.22 0.05
Science mark
Separate models
13
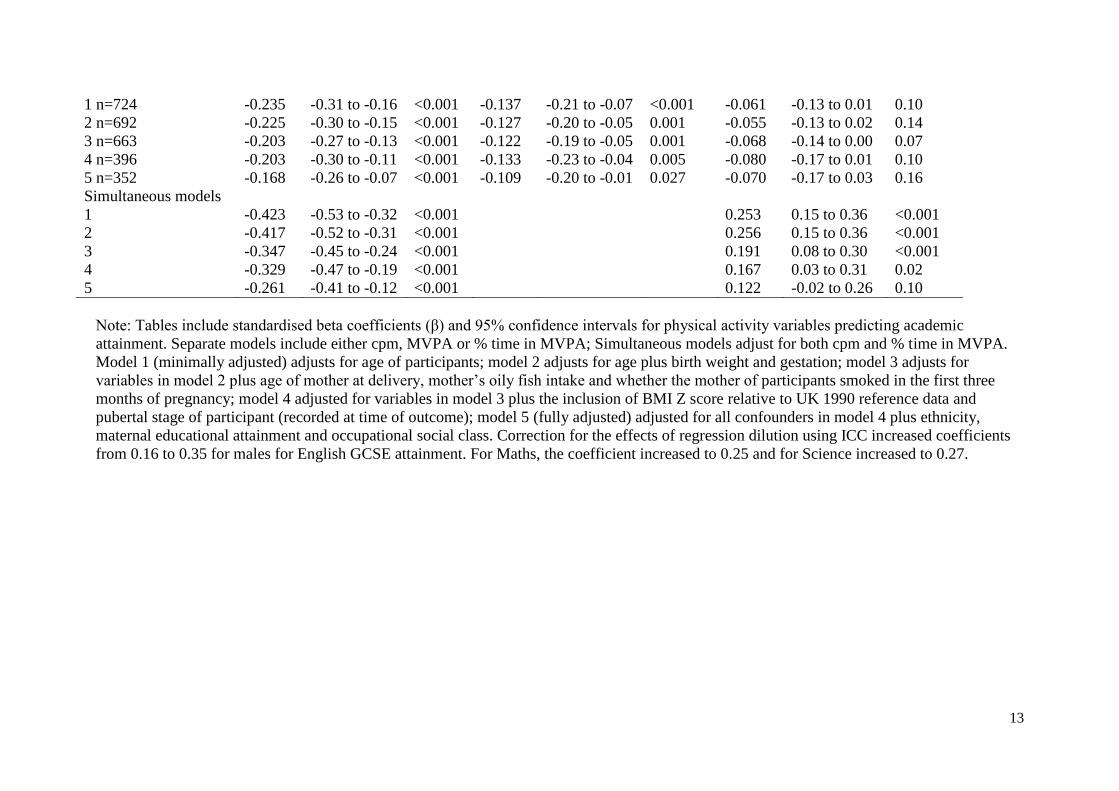
1 n=724 -0.235 -0.31 to -0.16 <0.001 -0.137 -0.21 to -0.07 <0.001 -0.061 -0.13 to 0.01 0.10
2 n=692 -0.225 -0.30 to -0.15 <0.001 -0.127 -0.20 to -0.05 0.001 -0.055 -0.13 to 0.02 0.14
3 n=663 -0.203 -0.27 to -0.13 <0.001 -0.122 -0.19 to -0.05 0.001 -0.068 -0.14 to 0.00 0.07
4 n=396 -0.203 -0.30 to -0.11 <0.001 -0.133 -0.23 to -0.04 0.005 -0.080 -0.17 to 0.01 0.10
5 n=352 -0.168 -0.26 to -0.07 <0.001 -0.109 -0.20 to -0.01 0.027 -0.070 -0.17 to 0.03 0.16
Simultaneous models
1 -0.423 -0.53 to -0.32 <0.001 0.253 0.15 to 0.36 <0.001
2 -0.417 -0.52 to -0.31 <0.001 0.256 0.15 to 0.36 <0.001
3 -0.347 -0.45 to -0.24 <0.001 0.191 0.08 to 0.30 <0.001
4 -0.329 -0.47 to -0.19 <0.001 0.167 0.03 to 0.31 0.02
5 -0.261 -0.41 to -0.12 <0.001 0.122 -0.02 to 0.26 0.10
Note: Tables include standardised beta coefficients (β) and 95% confidence intervals for physical activity variables predicting academic
attainment. Separate models include either cpm, MVPA or % time in MVPA; Simultaneous models adjust for both cpm and % time in MVPA.
Model 1 (minimally adjusted) adjusts for age of participants; model 2 adjusts for age plus birth weight and gestation; model 3 adjusts for
variables in model 2 plus age of mother at delivery, mother’s oily fish intake and whether the mother of participants smoked in the first three
months of pregnancy; model 4 adjusted for variables in model 3 plus the inclusion of BMI Z score relative to UK 1990 reference data and
pubertal stage of participant (recorded at time of outcome); model 5 (fully adjusted) adjusted for all confounders in model 4 plus ethnicity,
maternal educational attainment and occupational social class. Correction for the effects of regression dilution using ICC increased coefficients
from 0.16 to 0.35 for males for English GCSE attainment. For Maths, the coefficient increased to 0.25 and for Science increased to 0.27.

14
Supplementary Table 7. Associations between physical activity at 11 years old and academic attainment at 16 years old in females.
Model cpm mvpa % time in mvpa
β 95% CI p value β 95% CI p value β 95% CI p value
English mark
Separate models
1 n=1609 -0.120 -0.17 to -0.07 <0.001 -0.033 -0.08 to 0.02 0.185 0.032 -0.02 to 0.08 0.19
2 n = 1512 -0.118 -0.17 to-0.07 <0.001 -0.032 -0.08 to 0.02 0.213 0.033 -0.02 to 0.08 0.10
3 n = 1441 -0.104 -0.15 to -0.05 <0.001 -0.024 -0.07 to 0.03 0.352 0.029 -0.02 to 0.08 0.26
4 n= 1017 -0.120 -0.18 to -0.06 <0.001 -0.050 -0.11 to 0.01 0.109 0.008 -0.05 to 0.07 0.80
5 n=911 -0.117 -0.18 to -0.06 <0.001 -0.068 -0.13 to -0.01 0.032 -0.017 -0.08 to 0.04 0.58
Simultaneous models
1 -0.265 -0.33 to -0.20 <0.001 0.213 0.15 to 0.28 <0.001
2 -0.259 -0.33 to -0.19 <0.001 0.209 0.14 to 0.28 <0.001
3 -0.230 -0.30 to -0.16 <0.001 0.185 0.12 to 0.25 <0.001
4 -0.229 -0.31 to -0.15 <0.001 0.160 0.08 to 0.24 <0.001
5 -0.191 -0.27 to -0.11 <0.001 0.111 0.03 to 0.19 0.010
Maths mark
Separate models
1 n=1587 -0.125 -0.17 to -0.08 <0.001 -0.029 -0.08 to 0.02 0.243 0.028 -0.02 to 0.08 0.27
2 n=1491 -0.126 -0.18 to -0.08 <0.001 -0.028 -0.08 to 0.02 0.275 0.029 -0.02 to 0.08 0.27
3 n=1420 -0.117 -0.17 to 0.07 <0.001 -0.024 -0.07 to 0.03 0.352 0.023 -0.03 to 0.07 0.38
4 n=1001 -0.100 -0.16 to -0.04 <0.001 -0.028 -0.09 to 0.03 0.365 0.011 -0.05 to 0.07 0.72
5 n=898 -0.086 -0.15 to -0.03 0.01 -0.040 -0.10 to 0.02 0.191 -0.012 -0.07 to 0.05 0.69
Simultaneous models
1 -0.265 -0.33 to -0.20 <0.001 0.208 0.14 to 0.27 <0.001
2 -0.268 -0.34 to -0.20 <0.001 0.210 0.14 to 0.28 <0.001
3 -0.244 -0.31 to -0.18 <0.001 0.188 0.12 to 0.26 <0.001
4 -0.193 -0.27 to -0.11 <0.001 0.138 0.06 to 0.22 <0.001
5 -0.139 -0.22 to -0.06 <0.001 0.081 0.00 to 0.16 0.05
Science mark
Separate models

15
1 n=920 -0.111 -0.17 to -0.05 <0.001 -0.025 -0.09 to 0.04 0.449 0.036 -0.03 to 0.10 0.28
2 n=870 -0.108 -0.17 to -0.04 <0.001 -0.017 -0.08 to 0.05 0.621 0.046 -0.02 to 0.11 0.17
3 n=824 -0.099 -0.17 to -0.03 <0.001 -0.013 -0.08 to 0.05 0.705 0.039 -0.03 to 0.11 0.26
4 n=569 -0.113 -0.19 to -0.03 0.01 -0.030 -0.11 to 0.05 0.467 0.028 -0.05 to 0.11 0.51
5 n=506 -0.111 -0.19 to -0.03 0.01 -0.035 -0.12 to 0.05 0.412 0.012 -0.07 to 0.10 0.78
Simultaneous models
1 -0.244 -0.33 to -0.16 <0.001 0.199 0.11 to 0.28 <0.001
2 -0.251 -0.34 to -0.16 <0.001 0.214 0.13 to 0.30 <0.001
3 -0.228 -0.32 to -0.14 <0.001 0.193 0.10 to 0.28 <0.001
4 -0.224 -0.33 to -0.12 <0.001 0.172 0.07 to 0.28 <0.001
5 -0.201 -0.31 to -0.09 <0.001 0.143 0.03 to 0.25 0.01
Note: Correction for the effects of regression dilution using ICC increased coefficients from 0.11 to 0.25 for females for English GCSE
attainment. For Maths, the coefficient increased to 0.18 and for Science increased to 0.32.

16
Supplementary Table 8. Associations between PA and academic attainment in males, adjusting for all confounders plus full scale IQ; model 6.
Model cpm mvpa % time in mvpa
β 95% CI p value β 95% CI p value β 95% CI p value
English at 11 years
Separate models n= 909 -0.104 -0.16 to -0.05 <0.001 -0.072 -0.13 to-0.02 0.01 -0.051 -0.11 to 0.00 0.07
Simultaneous models -0.148 -0.23 to -0.07 <0.001 0.058 -0.02 to 0.14 0.16
Maths at 11years
Separate models n=912 -0.036 -0.09 to 0.02 0.19 -0.023 -0.08 to 0.03 0.40 -0.017 -0.07 to 0.04 0.52
Simultaneous models -0.051 -0.13 to 0.03 0.21 0.020 -0.06 to 0.10 0.62
Science at 11 years
Separate models n=913 -0.021 -0.07 to 0.03 0.43 -0.018 -0.07 to 0.03 0.49 -0.017 -0.07 to 0.04 0.52
Simultaneous models -0.019 -0.10 to 0.06 0.64 -0.003 -0.07 to 0.07 0.93
English at 13 years
Separate models n= 493 -0.088 -0.17 to -0.01 0.03 -0.050 -0.13 to 0.03 0.20 -0.025 -0.10 to 0.05 0.53
Simultaneous models -0.143 -0.25 to -0.03 0.01 0.077 -0.03 to 0.19 0.18
Maths at 13years
Separate models n=492 -0.109 -0.19 to -0.03 0.01 -0.114 -0.19 to -0.03 0.01 -0.102 -0.18 to -0.02 0.01
Simultaneous models -0.073 -0.19 to 0.04 0.21 -0.049 -0.16 to 0.06 0.40
Science at 13 years
Separate models n=495 -0.072 -0.16 to 0.02 0.12 -0.066 -0.16 to 0.02 0.15 -0.052 -0.14 to 0.04 0.26
Simultaneous models -0.072 -0.20 to 0.06 0.28 -0.001 -0.25 to 0.24 0.99
English at 16 years
Separate models n=590 -0.117 -0.19 to -0.05 <0.001 -0.070 -0.14 to 0.00 0.05 -0.040 -0.11 to 0.03 0.27
Simultaneous models -0.189 -0.29 to -0.09 <0.001 0.097 -0.01 to 0.20 0.06
Maths at 16 years
Separate models n=549 -0.117 -0.19 to -0.05 <0.001 -0.098 -0.17 to -0.03 0.01 -0.079 -0.15 to -0.01 0.03
Simultaneous models -0.127 -0.23 to -0.02 0.02 0.014 -0.09 to 0.12 0.79
Science at 16 years
Separate models n=330 -0.095 -0.18 to -0.01 0.03 -0.065 -0.15 to 0.02 0.14 -0.042 -0.13 to 0.04 0.33
Simultaneous models -0.141 -0.027 to -0.01 0.04 0.059 -0.07 to 0.19 0.36

17
Supplementary Table 9. Associations between PA and academic attainment in females, adjusting for all confounders plus full scale IQ; model 6.
Model cpm mvpa % time in mvpa
β 95% CI p value β 95% CI p value β 95% CI p value
English at 11 years
Separate models n= 1211 -0.032 -0.08 to 0.01 0.17 0.015 -0.03 to 0.06 0.52 0.040 -0.01 to 0.09 0.09
Simultaneous models -0.112 -0.18 to -0.05 <0.001 0.116 0.05 to 0.18 <0.001
Maths at 11years
Separate models n=1204 -0.040 -0.09 to 0.01 0.09 -0.033 -0.08 to 0.01 0.16 -0.032 -0.08 to 0.01 0.18
Simultaneous models -0.033 -0.10 to 0.03 0.31 -0.009 -0.07 to 0.05 0.78
Science at 11 years
Separate models n=1207 -0.050 -0.10 to 0.00 0.03 -0.004 -0.05 to 0.05 0.88 0.009 -0.04 to 0.06 0.71
Simultaneous models -0.106 -0.17 to -0.04 <0.001 0.081 0.02 to 0.14 0.01
English at 13 years
Separate models n= 647 -0.103 -0.17 to -0.04 <0.001 -0.047 -0.11 to 0.02 0.16 0.000 0.00 to 0.00 0.10
Simultaneous models -0.183 -0.27 to -0.10 <0.001 0.120 0.03 to 0.21 0.01
Maths at 13years
Separate models n=647 -0.070 -0.14 to 0.00 0.05 -0.050 -0.12 to 0.02 0.17 -0.048 -0.12 to 0.02 0.18
Simultaneous models -0.067 -0.16 to 0.03 0.16 -0.004 -0.10 to 0.09 0.93
Science at 13 years
Separate models n=649 -0.113 -0.19 to -0.04 <0.001 -0.122 -0.20 to -0.05 <0.001 -0.104 -0.18 to -0.03 0.01
Simultaneous models -0.077 -0.18 to 0.03 0.14 -0.053 -0.15 to 0.05 0.30
English at 16 years
Separate models n=854 -0.103 -0.16 to -0.05 <0.001 -0.070 -0.13 to -0.01 0.01 -0.033 -0.09 to 0.02 0.26
Simultaneous models -0.148 -0.22 to -0.07 <0.001 0.068 -0.01 to 0.14 0.08
Maths at 16 years
Separate models n=842 -0.076 -0.13 to -0.02 0.01 -0.048 -0.10 to 0.01 0.08 -0.034 -0.09 to 0.02 0.23
Simultaneous models -0.097 -0.17 to -0.02 0.01 0.032 -0.04 to 0.11 0.39
Science at 16 years
Separate models n=471 -0.112 -0.18 to -0.04 <0.001 -0.055 -0.13 to 0.02 0.14 -0.019 -0.09 to 0.06 0.62
Simultaneous models -0.175 -0.27 to -0.08 <0.001 0.098 0.00 to 0.19 0.04

18
Supplementary Table 10. Model 1 repeated with only participants who have complete data at model 5 for males
Model Cpm mvpa % time in mvpa
English at 11 years β p value β p value β p value
1 (with model 5 cases)
– separate N=991
-0.183 <0.001 -0.096 <0.001 -0.042 0.18
1 (with model 5 cases)
- simultaneous
-0.329 <0.001 0.198 <0.001
Maths at 11 years
1 (with model 5 cases)
– separate N=994
-0.134 <0.001 -0.064 0.05 -0.022 0.48
1 (with model 5 cases)
- simultaneous
-0.254 <0.001 0.163 <0.001
Science at 11 years
1 (with model 5 cases)
– separate N=995
-0.129 <0.001 -0.070 0.03 -0.033 0.30
1 (with model 5 cases)
- simultaneous
-0.226 <0.001 0.132 <0.001
English at 13 years
1 (with model 5 cases)
– separate N=532
-0.139 <0.001 -0.039 0.37 0.021 0.63
1 (with model 5 cases)
- simultaneous
-0.319 <0.001 0.250 <0.001
Maths at 13 years
1 (with model 5 cases)
– separate N=531
-0.139 <0.001 -0.086 0.05 -0.043 0.33
1 (with model 5 cases)
- simultaneous
-0.224 <0.001 0.118 0.06
Science at 13 years
1 (with model 5 cases)
– separate N=533
-0.092 0.03 -0.040 0.36 -0.008 0.85
1 (with model 5 cases) -0.178 <0.001 0.120 0.05

19
- simultaneous
English at 16 years
1 (with model 5 cases)
– separate N=635
-0.211 <0.001 -0.106 0.01 -0.033 0.41
1 (with model 5 cases)
- simultaneous
-0.406 <0.001 0.265 <0.001
Maths at 16 years
1 (with model 5 cases)
– separate N=592
-0.194 <0.001 -0.104 0.01 -0.035 0.40
1 (with model 5 cases)
- simultaneous
-0.362 <0.001 0.230 <0.001
Science at 16 years
1 (with model 5 cases)
– separate N=352
-0.227 <0.001 -0.141 0.01 -0.072 0.18
1 (with model 5 cases)
- simultaneous
-0.396 <0.001 0.225 <0.001
20
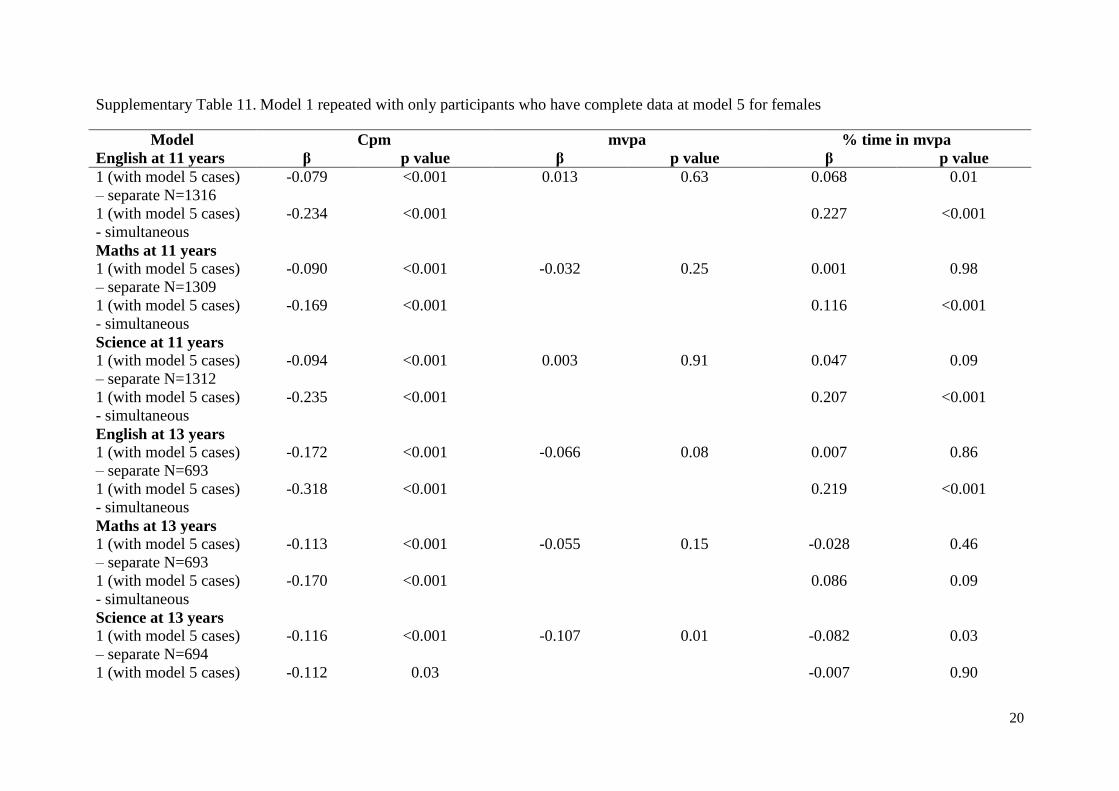
Supplementary Table 11. Model 1 repeated with only participants who have complete data at model 5 for females
Model Cpm mvpa % time in mvpa
English at 11 years β p value β p value β p value
1 (with model 5 cases)
– separate N=1316
-0.079 <0.001 0.013 0.63 0.068 0.01
1 (with model 5 cases)
- simultaneous
-0.234 <0.001 0.227 <0.001
Maths at 11 years
1 (with model 5 cases)
– separate N=1309
-0.090 <0.001 -0.032 0.25 0.001 0.98
1 (with model 5 cases)
- simultaneous
-0.169 <0.001 0.116 <0.001
Science at 11 years
1 (with model 5 cases)
– separate N=1312
-0.094 <0.001 0.003 0.91 0.047 0.09
1 (with model 5 cases)
- simultaneous
-0.235 <0.001 0.207 <0.001
English at 13 years
1 (with model 5 cases)
– separate N=693
-0.172 <0.001 -0.066 0.08 0.007 0.86
1 (with model 5 cases)
- simultaneous
-0.318 <0.001 0.219 <0.001
Maths at 13 years
1 (with model 5 cases)
– separate N=693
-0.113 <0.001 -0.055 0.15 -0.028 0.46
1 (with model 5 cases)
- simultaneous
-0.170 <0.001 0.086 0.09
Science at 13 years
1 (with model 5 cases)
– separate N=694
-0.116 <0.001 -0.107 0.01 -0.082 0.03
1 (with model 5 cases) -0.112 0.03 -0.007 0.90

21
- simultaneous
English at 16 years
1 (with model 5 cases)
– separate N=911
-0.137 <0.001 -0.051 0.12 0.018 0.58
1 (with model 5 cases)
- simultaneous
-0.271 <0.001 0.200 <0.001
Maths at 16 years
1 (with model 5 cases)
– separate N=898
-0.122 <0.001 -0.036 0.28 0.014 0.68
1 (with model 5 cases)
- simultaneous
-0.235 <0.001 0.170 <0.001
Science at 16 years
1 (with model 5 cases)
– separate N=352
-0.139 <0.001 -0.033 0.46 0.039 0.39
1 (with model 5 cases)
- simultaneous
-0.277 <0.001 0.216 <0.001