Embed Size (px)
Citation preview
1
Supplementary Information
Activity and Stability Trends of Perovskite Oxides at Neutral pH for
Oxygen Evolution Catalysis
Binghong Han,a,c‡
Marcel Risch,b,c‡
Yueh-Lin Lee,b,c
Chen Ling,d Hongfei Jia,
d Yang
Shao-Horna,b,c*
aDepartment of Materials Science and Engineering,
bResearch Laboratory of
Electronics, and cElectrochemical Energy Lab, Massachusetts Institute of Technology,
Cambridge, Massachusetts 02139, United States dToyota Research Institute of North America, Ann Arbor, Michigan 48105, United
States
Corresponding Author
* Yang Shao-Horn, [email protected]
Index Page
Detailed Experimental Section
Materials Preparation ..................................................................................................... 2
Electrochemical Measurements ..................................................................................... 2
Transmission Electron Microscopy ............................................................................... 2
Density Function Theory studies. .................................................................................. 3
Supporting Figures
Figure S1 ........................................................................................................................ 5
Figure S2 ........................................................................................................................ 6
Figure S3 ........................................................................................................................ 7
Figure S4 ........................................................................................................................ 8
Figure S5 ........................................................................................................................ 9
Figure S6 ...................................................................................................................... 10
Figure S7 ...................................................................................................................... 11
Figure S8 ...................................................................................................................... 11
Figure S9 ...................................................................................................................... 12
Figure S10 .................................................................................................................... 12
Figure S11 .................................................................................................................... 13
Figure S12 .................................................................................................................... 14
Figure S13 .................................................................................................................... 14
Figure S14 .................................................................................................................... 15
Electronic Supplementary Material (ESI) for Physical Chemistry Chemical Physics.This journal is © the Owner Societies 2015
2
Detailed Experimental Section
Materials Preparation. Perovskite catalysts were synthesized using a conventional
solid-state route.1 IrO2 (99.99%) were bought from Alfa Aesar Premion as the
precious-metal oxides reference. The specific surface area of each oxide sample was
determined using BET analysis on a Quantachrome ChemBET Pulsar from a
single-point BET analysis performed after 12 h outgassing at 150 C.
Electrochemical Measurements. The rotating disk electrode (RDE) configuration
was employed for electrochemical measurements, which has a rotatable working
electrode at the rotation speed of 1600 rpm in a three-electrode cell with a Pt wire and
a saturated calomel electrode (Pine Instrument Co.) as the counter and reference
electrodes, respectively. All potentials were calibrated to the reversible hydrogen
electrode (RHE) using H2/H+ redox. Working electrodes were prepared by
drop-casting oxide ink on a glassy carbon electrode, as described previously1, with an
oxide loading of 0.25 mgoxide/cm2
disk and a mass ratio of 5:1:1 of oxide catalyst to
acetylene black carbon to Nafion® . The pH 13 electrolyte was prepared with 0.1 M
KOH (Sigma-Aldrich, 99.99%) and deionized water (18 MΩ). pH 7 electrolyte was
prepared with 0.4 M NaH2PO4 (Sigma-Aldrich), 0.6 M Na2SO4 (Sigma-Aldrich),
proper amount of NaOH (Mallinckrodt) and deionized water (18 MΩ). The potential
was controlled using a Biologic VSP-300 potentiostat. A scan rate of 10 mV/s and a
scan range between 1.1 and 1.8 V vs. RHE were used for all CV measurements. All
CV, galvanostatic and potentiostatic OER measurements were done in O2 (99.999%,
Airgas) saturated and bubbled electrolyte. Error bars in all activity data represent the
standard deviation of multiple independent measurements. Ohmic losses were
corrected by subtracting the ohmic voltage drop from the measured potential, using an
electrolyte resistance determined by high-frequency alternating current impedance,
where iR-corrected potentials are denoted as E-iR (i as the current and R as the
electrolyte resistance). The resistance of the RDE system with pH 7 electrolyte (~15
Ω) is smaller than that with pH 13 electrolyte (~40 Ω), and therefore the Ohmic drop
within the narrow pores2 might not be a reason for the activity reduction observed at
pH 7.
Transmission Electron Microscopy. TEM samples were prepared by dropping the
catalyst ink onto Cu grids or using grids to scratch the working electrode after OER
measurements. TEM images in this work were taken on JEOL 2010F equipped with
ultrahigh resolution polepiece, having a point resolution of 0.19 nm. Bright field
diffraction contrast imaging was used to determine particle size distributions and
general morphology of the catalyst nanoparticles. The digital images were analyzed
using Gatan Digital Micrograph v2.01 (Gatan Inc.) and ImageJ v1.44p (National
Institute of Health, USA). High resolution TEM (HRTEM) images were formed
without an objective aperture and were analyzed using Gatan Digital Micrograph.
Parallel-beam energy dispersive spectroscopy (EDS) data were collected and the
3
atomic compositions were determined using INCA (Oxford Instruments) software.
For each oxides sample, three different spots with a diameter of ~ 200 nm were used
to collect the bulk chemical composition, while three different spots with a diameter
of ~ 5 nm at the particle edges were used to collect the surface chemical composition.
Error bars in all EDS data represent the standard deviation of the results on multiple
spots.
Density Function Theory studies. Spin polarized DFT calculations of the oxygen
p-band center were performed with the Vienna Ab-initio Simulation Package (VASP)3
using a plane wave basis set, the GGA-Perdew-Wang-914 exchange correlation
function, and the Projector Augmented Wave (PAW) method.5 We used PAW
potentials with electronic configurations La (5s2 5p6 6s2 5d1), Sr (5s2 4p6), Os (soft
oxygen pseudopotential, 2s2 2p4), B = Mnpv (3p6 3d6 4s1), Fepv (3p6 3d7 4s1), Co
(3d8 4s1), and Nipv (3p6 3d9 4s1). All calculations were performed with an energy
cut-off of 450 eV. For the GGA+U calculation, we used the standard Dudarev
implementation6, where the on-site Coulomb interaction for the localized transition
metal d orbitals was parametrized by Ueff = U − J with the Perdew-Wang-91
functional. Optimized Ueff for the transition metal atoms in the investigated perovskite
systems (Ueff = 4.0, 4.0, 3.3, and 6.4 eV for Mn, Fe, Co and Ni, respectively) were
taken from References.7, 8
Full optimization of bulk 2×2×2 perovskite supercell
calculations were performed using the experimental symmetry at low temperature9
based on the ferromagnetic ordering in order to use a consistent and tractable set of
magnetic structures using a (2×2×2) k-point mesh. An effective O p-band center of
each perovskite systems was determined by taking the centroid of the projected
density of states of O 2p states relative to the Fermi level.
The leaching reaction energies of LaCoO3 in Figure 5 of the main text were also
calculated with the same DFT approach described above. The electrochemical
reactions of the dissolution process on working electrode can be written as:
𝐿𝑎𝐶𝑜𝑂3 → 𝐿𝑎1−𝑥𝐶𝑜𝑂3 + 𝑥 ∙ 𝐿𝑎𝑎𝑞3+ + 3𝑥 ∙ 𝑒− Eq. S1
and
𝐿𝑎𝐶𝑜𝑂3 + 𝑦𝑧 ∙ 𝐻2𝑂 → 𝐿𝑎𝐶𝑜1−𝑦𝑂3 + 𝑦 ∙ 𝐶𝑜𝑂𝑧 + 2𝑦𝑧 ∙ 𝐻+ + 2𝑦𝑧 ∙ 𝑒− Eq. S2
for La and Co leaching, respectively. At the same time, there is other half-cell reaction
to balance the chemical reaction in the DFT calculation, which could be written as:
𝑂2 + 4𝐻+ + 4𝑒− → 2𝐻2𝑂 Eq. S3
It is worth noticing here that the influential factor in A-site and B-site leaching
mechanisms is the competition between Eq. S1 and S2 as well as the OER on the
working electrode, and the compensation half-cell reaction (Eq. S3) has little
influence to the degradation of the perovskite oxides on the working electrodes. Here
Eq. S3 is just used to complete the whole reaction for DFT calculation, altering the
voltage shifts to the oxygen chemical potential change. The real counter electrode
reaction could be other forms of oxygen reduction (such as that in high pH involving
OH- rather than H
+) or even other redox reactions, but it won’t influence our
conclusion. In the case of Eq. S3, the overall reactions for the DFT calculation can be
obtained by combining Eq. S1 and S2 with Eq. S3:
4
LaCoO3 + 3𝑥 ∙ 𝐻+ +3𝑥
4O2 → La1−𝑥CoO3 + 𝑥 ∙ 𝐿𝑎𝑎𝑞
3+ +3𝑥
2H2𝑂
LaCoO3 +𝑧𝑦
2O2 → LaCo1−𝑦O3 + 𝑦 ∙ Co𝑂𝑧
which are Eq. 1 and Eq. 2 in the main text, respectively.
The simulated LaCoO3 bulk structures with 0.125, 0.25, 0.375, and 0.5 concentration
of A-site or B-site vacancy in the 2×2×2 perovskite supercells are provided in Figure
S14. The corresponding chemical potential of oxygen a given potential relative to the
standard hydrogen electrode (SHE), , were computed following the
computational SHE method10, 11
and can be defined as:
where and are the calculated DFT energy of gas phase
H2O and H2, ( ) and ( ) are the zero point energy and
entropy of H2O (H2), respectively, T is the room temperature, and 𝜙 is the applied
potential. The stability of solvated La3+
(assumed to be at 10-6
M concentration12, 13
)
was assessed by referencing to the experimental formation enthalpy of La2O3 (-18.58
eV per formula unit14
) based on the reaction free energy of 1/2La2O3 + 3H+ La
3+
+3/2H2O, and the calculated DFT total energy of La2O3 is used to align with the
experimental La2O3 formation enthalpy.
The stable degradation product of Co-loss reaction was assumed to be CoOz (z=4/3,
3/2, and 2, and the most stable compound among the three at the applied potential
condition vs. RHE will be used in the Co-loss reaction) as a sufficient criteria for the
Co-loss reaction. The extreme oxidative condition studied in this paper, especially at
2.33 V vs. RHE, other Co species, such as Co(IV)-oxo and CoOm(OH)n, might also be
the direct or second-step product of Co-loss reaction.15-17
, but here we only focus on
the stable CoOz product. We note even if CoOm(OH)n or other Co species are more
stable than CoOz, it will just further increase the actual driving force of the oxide Co
leaching reaction, and has limited influence to the conclusions. Therefore, we hold the
calculation of Co-loss reaction only with CoOz. Here multiple z values were tried
from 4/3 to 2 to find the most stable Co oxides under different voltage. Our
calculation showed that at 1.23 V vs. RHE, z = 4/3; while at 1.75 and 2.33 V vs. RHE,
z = 2.
m(O)
m(O) = EDFT (H2O(g))+ ZPEH2O
-TSH2O
(g )
0 (0.035bar)éë
ùû
- EDFT (H2
(g) + ZPEH2-TS
H2(g )
0éë
ùû+ 2 kbT lna
H+ - ef( )
EDFT H2O(g)( ) EDFT (H2
(g))
ZPEH2OZPEH2
S0
H2O(g ) S0
H2(g )
5
Supporting Figures
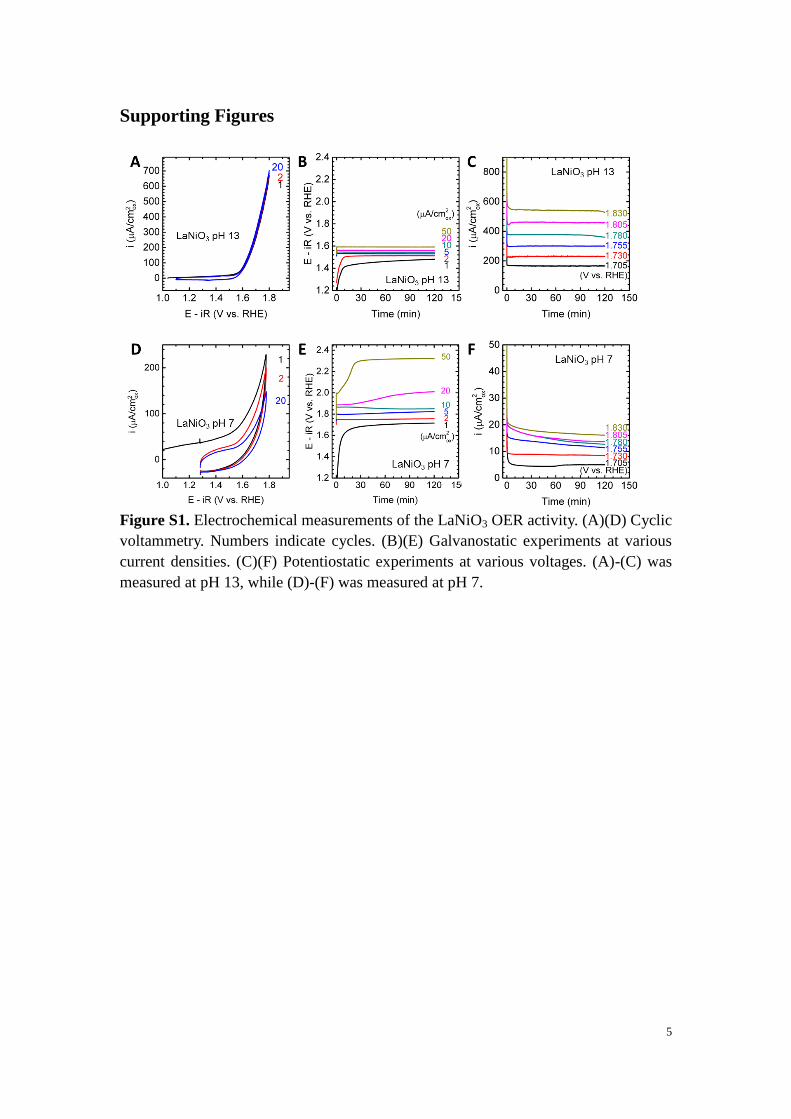
Figure S1. Electrochemical measurements of the LaNiO3 OER activity. (A)(D) Cyclic
voltammetry. Numbers indicate cycles. (B)(E) Galvanostatic experiments at various
current densities. (C)(F) Potentiostatic experiments at various voltages. (A)-(C) was
measured at pH 13, while (D)-(F) was measured at pH 7.
6
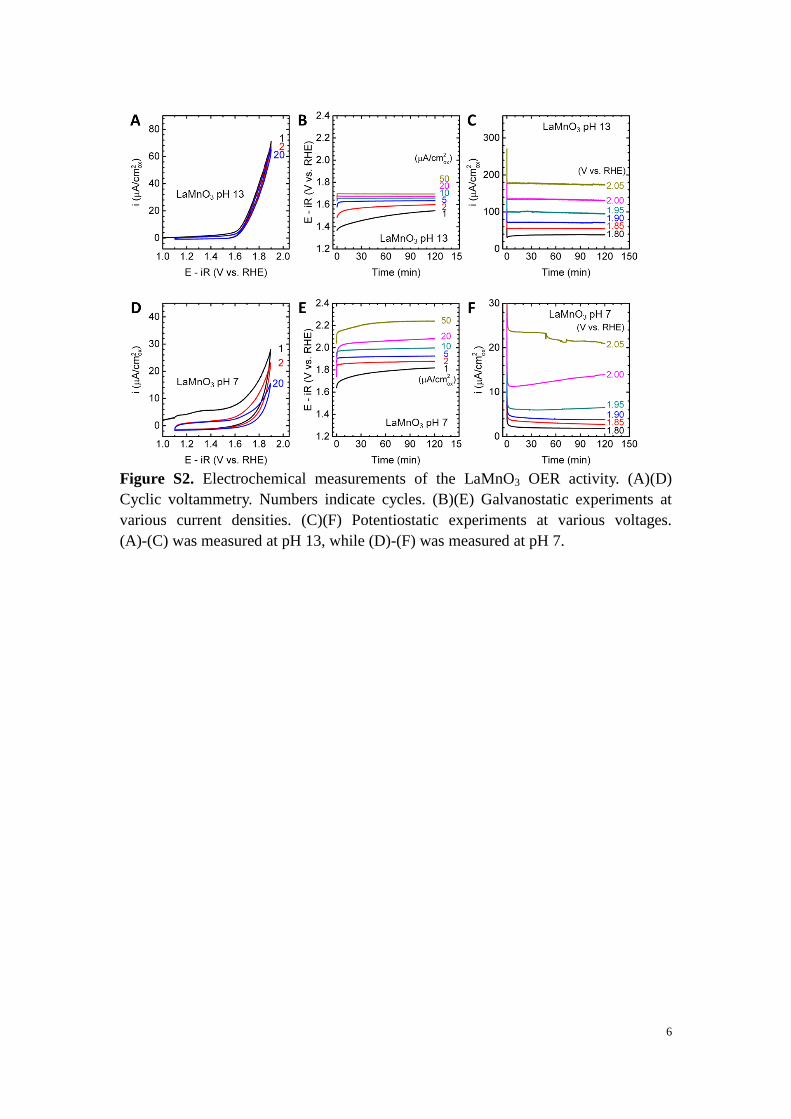
Figure S2. Electrochemical measurements of the LaMnO3 OER activity. (A)(D)
Cyclic voltammetry. Numbers indicate cycles. (B)(E) Galvanostatic experiments at
various current densities. (C)(F) Potentiostatic experiments at various voltages.
(A)-(C) was measured at pH 13, while (D)-(F) was measured at pH 7.
7
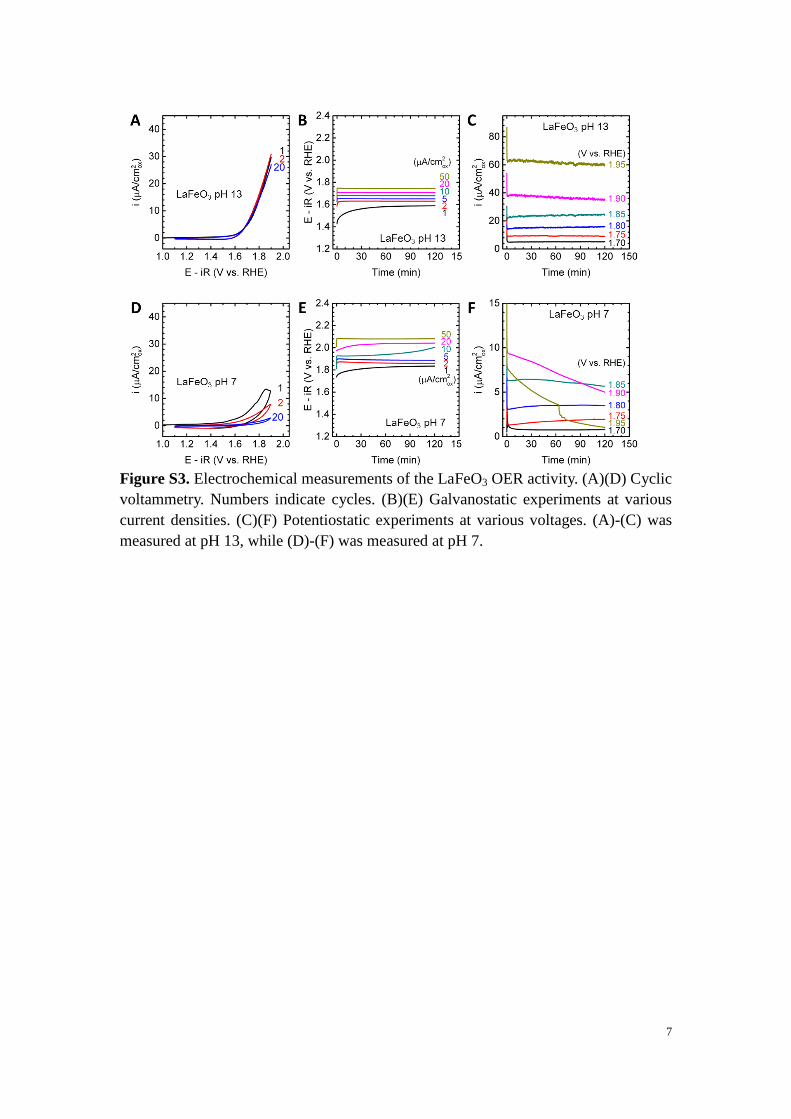
Figure S3. Electrochemical measurements of the LaFeO3 OER activity. (A)(D) Cyclic
voltammetry. Numbers indicate cycles. (B)(E) Galvanostatic experiments at various
current densities. (C)(F) Potentiostatic experiments at various voltages. (A)-(C) was
measured at pH 13, while (D)-(F) was measured at pH 7.
8
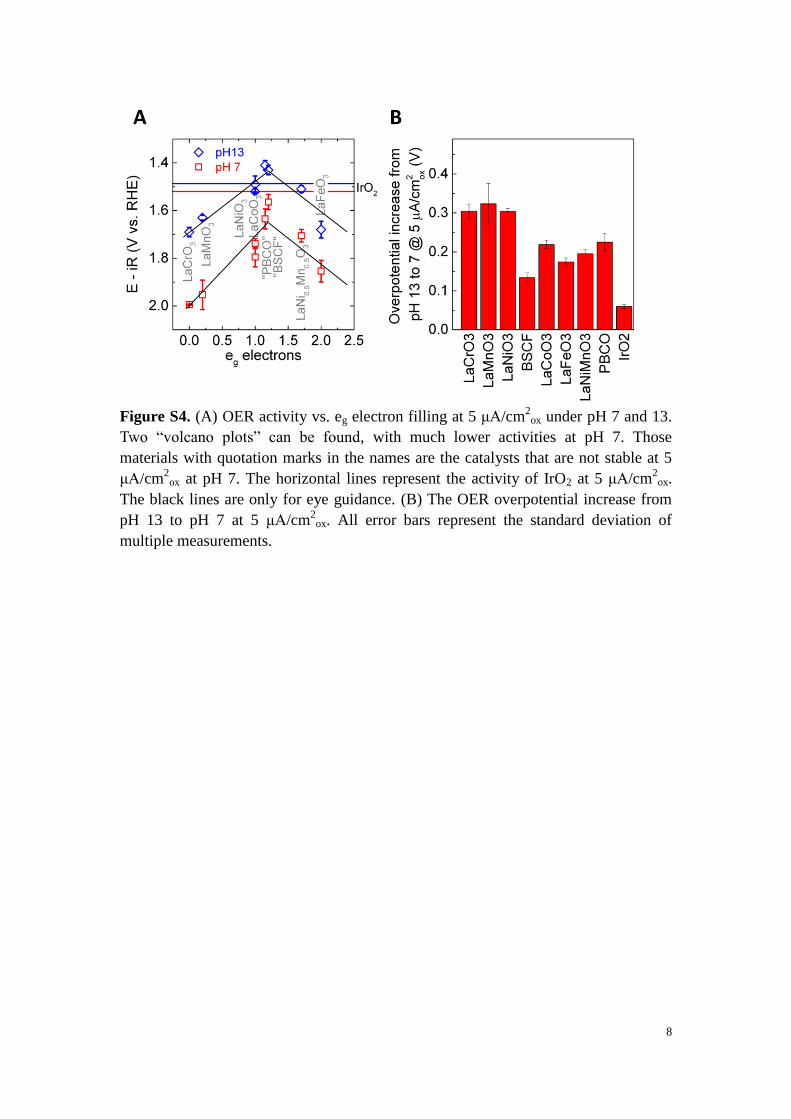
Figure S4. (A) OER activity vs. eg electron filling at 5 μA/cm2
ox under pH 7 and 13.
Two “volcano plots” can be found, with much lower activities at pH 7. Those
materials with quotation marks in the names are the catalysts that are not stable at 5
μA/cm2
ox at pH 7. The horizontal lines represent the activity of IrO2 at 5 μA/cm2
ox.
The black lines are only for eye guidance. (B) The OER overpotential increase from
pH 13 to pH 7 at 5 μA/cm2
ox. All error bars represent the standard deviation of
multiple measurements.
9
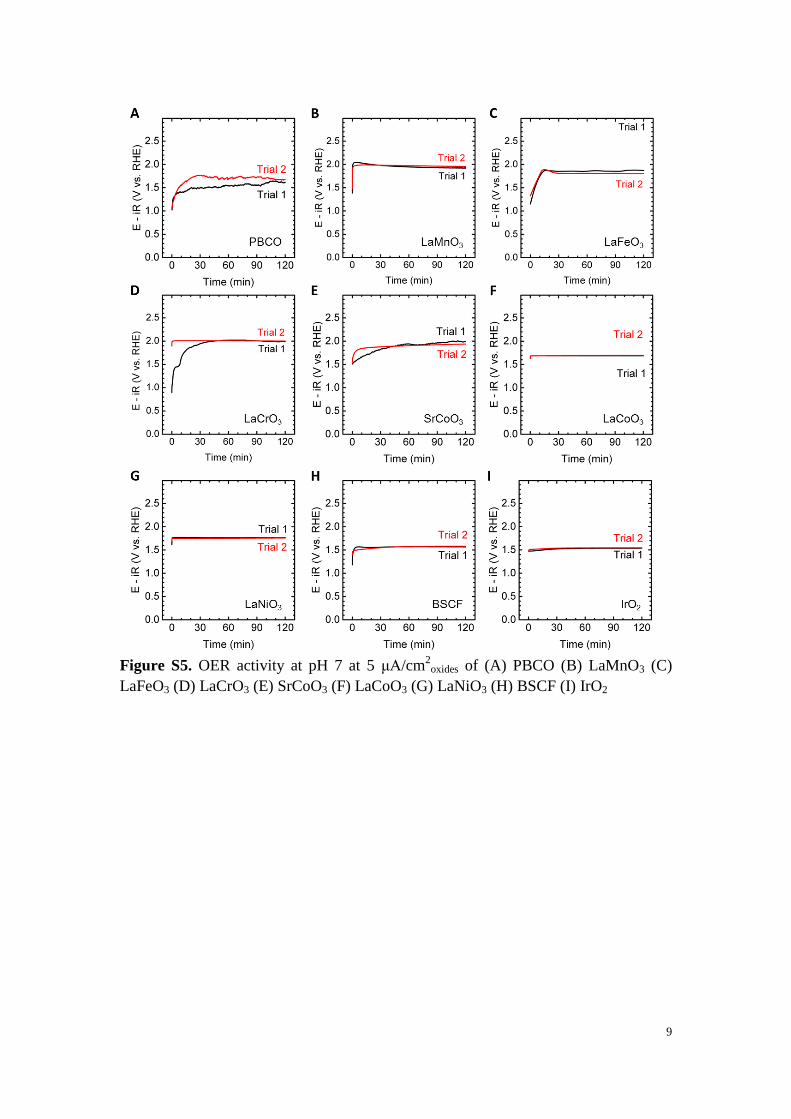
Figure S5. OER activity at pH 7 at 5 μA/cm
2oxides of (A) PBCO (B) LaMnO3 (C)
LaFeO3 (D) LaCrO3 (E) SrCoO3 (F) LaCoO3 (G) LaNiO3 (H) BSCF (I) IrO2
10
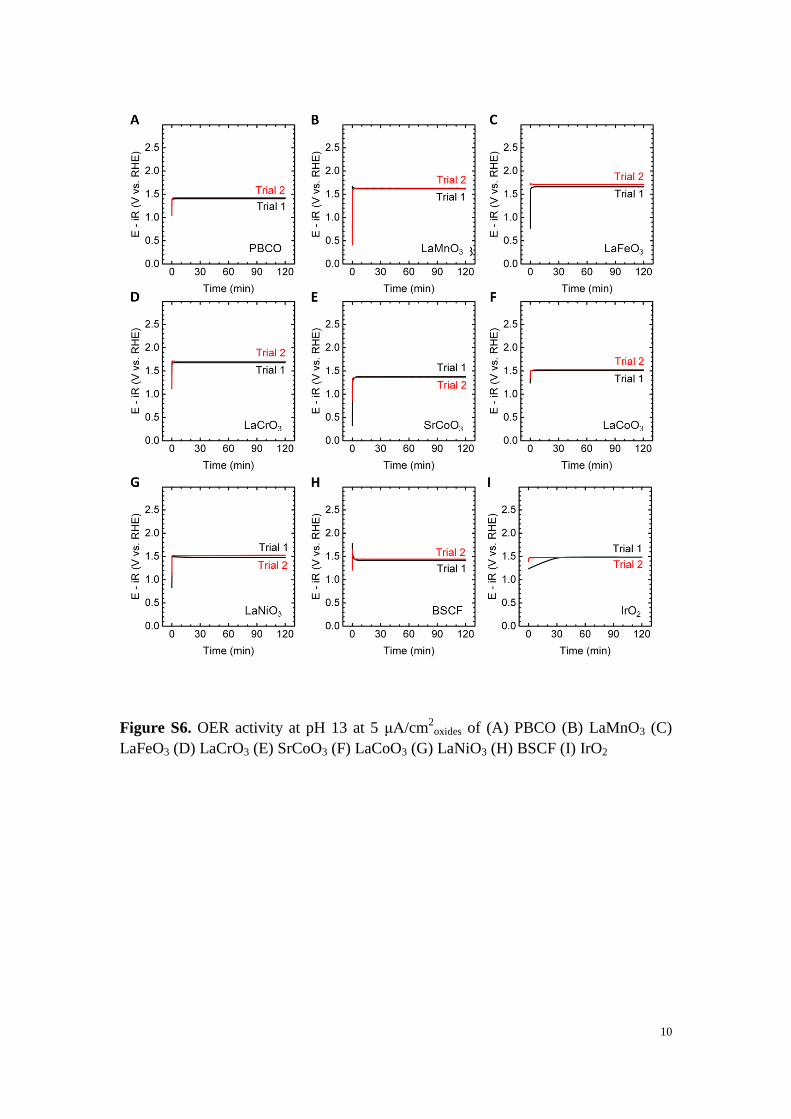
Figure S6. OER activity at pH 13 at 5 μA/cm2
oxides of (A) PBCO (B) LaMnO3 (C)
LaFeO3 (D) LaCrO3 (E) SrCoO3 (F) LaCoO3 (G) LaNiO3 (H) BSCF (I) IrO2
11
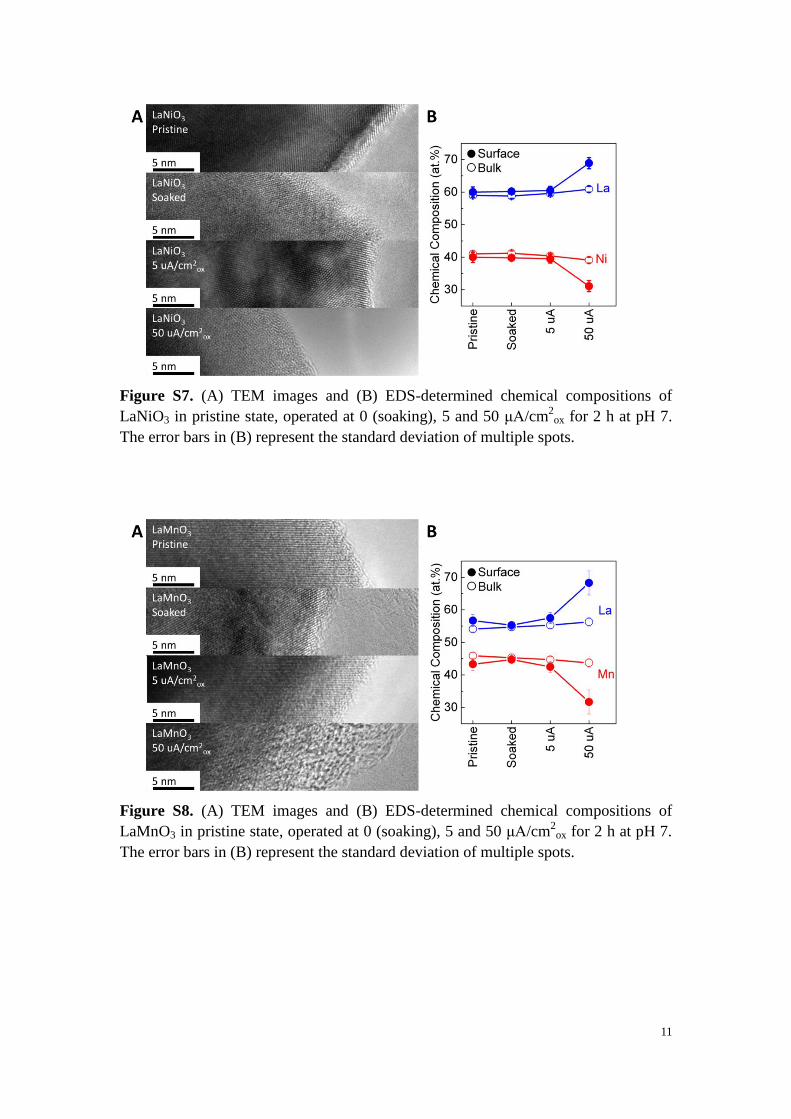
Figure S7. (A) TEM images and (B) EDS-determined chemical compositions of
LaNiO3 in pristine state, operated at 0 (soaking), 5 and 50 μA/cm2
ox for 2 h at pH 7.
The error bars in (B) represent the standard deviation of multiple spots.
Figure S8. (A) TEM images and (B) EDS-determined chemical compositions of
LaMnO3 in pristine state, operated at 0 (soaking), 5 and 50 μA/cm2
ox for 2 h at pH 7.
The error bars in (B) represent the standard deviation of multiple spots.
12
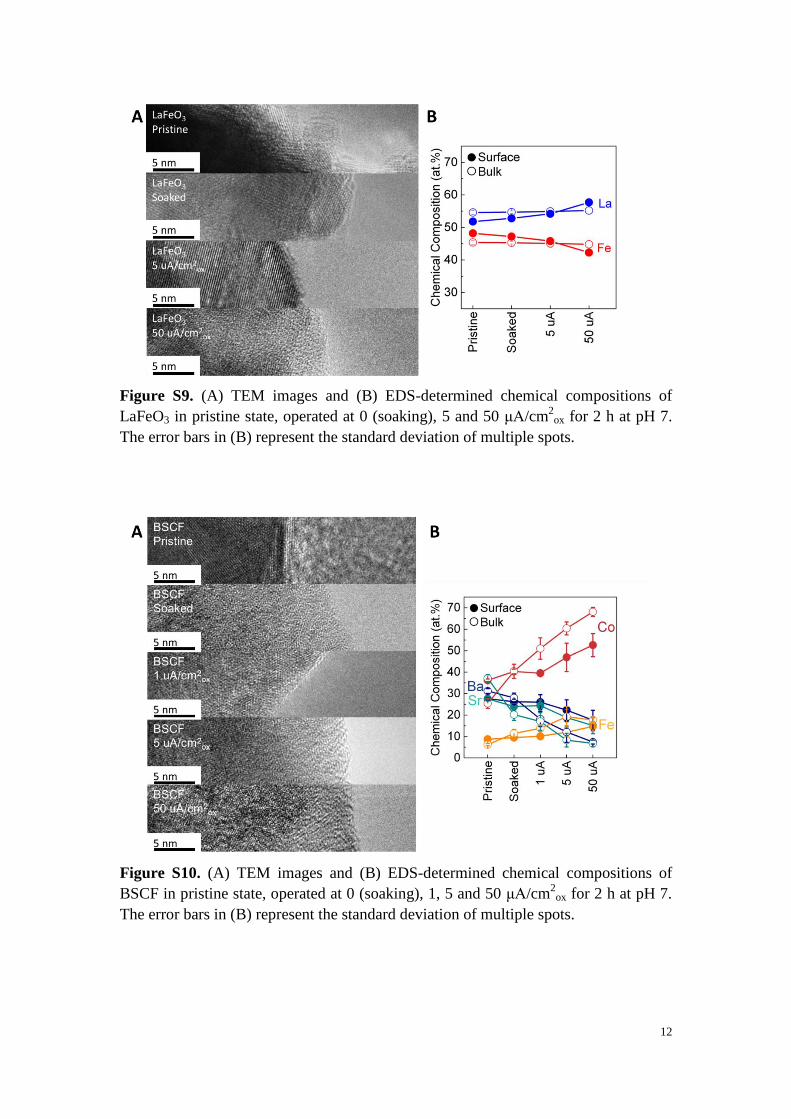
Figure S9. (A) TEM images and (B) EDS-determined chemical compositions of
LaFeO3 in pristine state, operated at 0 (soaking), 5 and 50 μA/cm2
ox for 2 h at pH 7.
The error bars in (B) represent the standard deviation of multiple spots.
Figure S10. (A) TEM images and (B) EDS-determined chemical compositions of
BSCF in pristine state, operated at 0 (soaking), 1, 5 and 50 μA/cm2
ox for 2 h at pH 7.
The error bars in (B) represent the standard deviation of multiple spots.
13
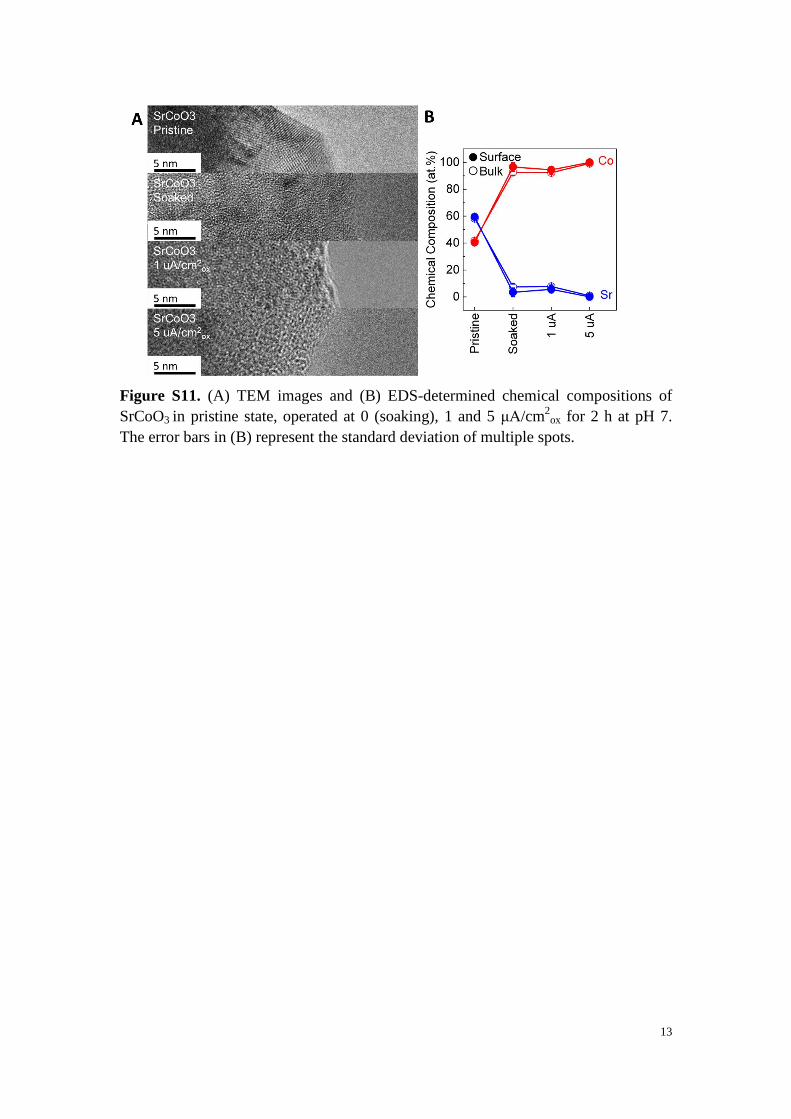
Figure S11. (A) TEM images and (B) EDS-determined chemical compositions of
SrCoO3 in pristine state, operated at 0 (soaking), 1 and 5 μA/cm2
ox for 2 h at pH 7.
The error bars in (B) represent the standard deviation of multiple spots.
14
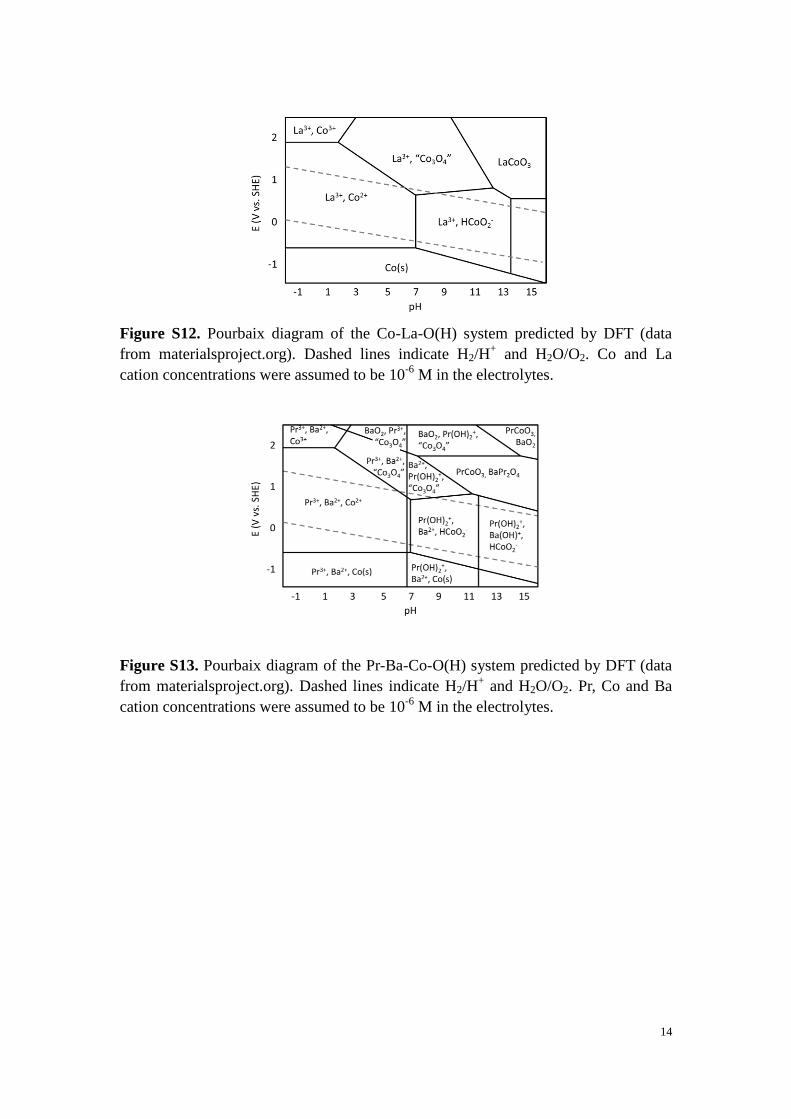
Figure S12. Pourbaix diagram of the Co-La-O(H) system predicted by DFT (data
from materialsproject.org). Dashed lines indicate H2/H+ and H2O/O2. Co and La
cation concentrations were assumed to be 10-6
M in the electrolytes.
Figure S13. Pourbaix diagram of the Pr-Ba-Co-O(H) system predicted by DFT (data
from materialsproject.org). Dashed lines indicate H2/H+ and H2O/O2. Pr, Co and Ba
cation concentrations were assumed to be 10-6
M in the electrolytes.
15
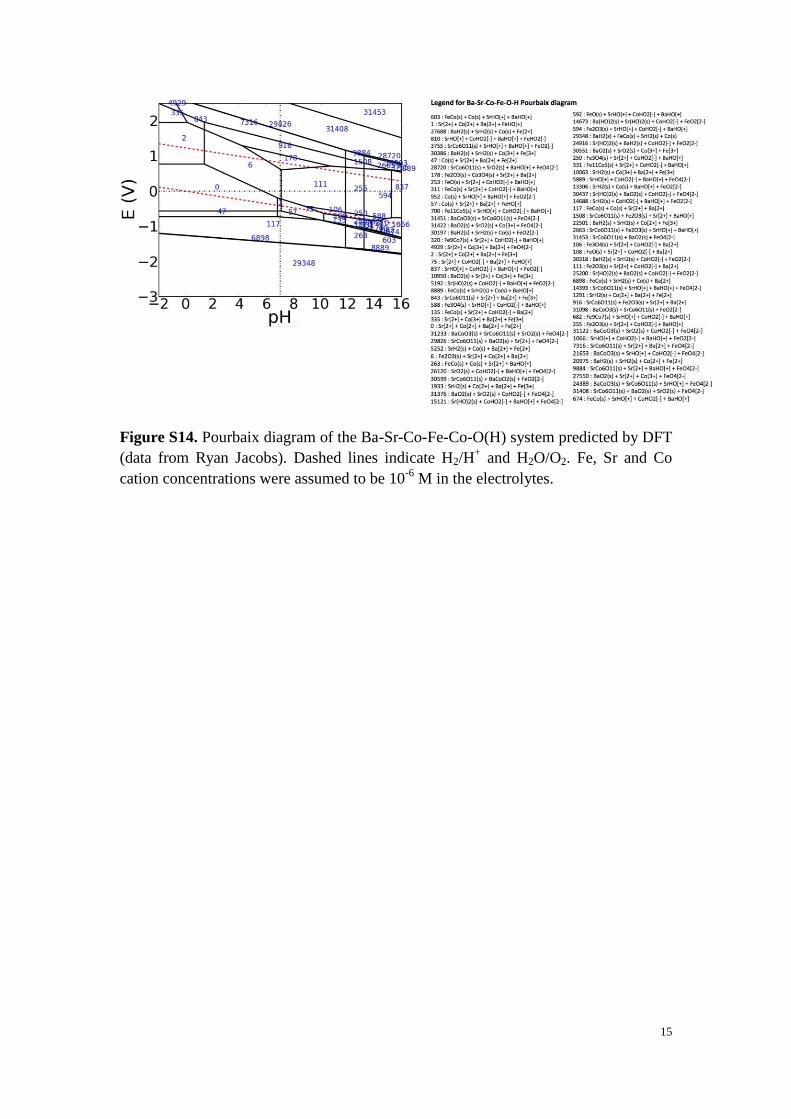
Figure S14. Pourbaix diagram of the Ba-Sr-Co-Fe-Co-O(H) system predicted by DFT
(data from Ryan Jacobs). Dashed lines indicate H2/H+ and H2O/O2. Fe, Sr and Co
cation concentrations were assumed to be 10-6
M in the electrolytes.
16
References
1. A. Grimaud, K. J. May, C. E. Carlton, Y.-L. Lee, M. Risch, W. T. Hong, J. Zhou and Y.
Shao-Horn, Nat. Commun., 2013, 4, 2439 2431-2437.
2. L. Bai, L. Gao and B. E. Conway, Journal of the Chemical Society, Faraday Transactions,
1993, 89, 243-249.
3. G. Kresse and J. Furthmuller, Physical Review B, 1996, 54, 11169-11186.
4. J. P. Perdew, K. Burke and M. Ernzerhof, Physical Review Letters, 1996, 77, 3865-3868.
5. G. Kresse and D. Joubert, Physical Review B, 1999, 59, 1758-1775.
6. S. L. Dudarev, G. A. Botton, S. Y. Savrasov, C. J. Humphreys and A. P. Sutton, Physical
Review B, 1998, 57, 1505-1509.
7. Y.-L. Lee, J. Kleis, J. Rossmeisl and D. Morgan, Physical Review B (Condensed Matter and
Materials Physics), 2009, 80, 224101.
8. L. Wang, T. Maxisch and G. Ceder, Physical Review B, 2006, 73, 195107.
9. N. Furuhata, E. Nakamura and E. Sawaguchi, 1969.
10. J. K. Norskov, J. Rossmeisl, A. Logadottir, L. Lindqvist, J. R. Kitchin, T. Bligaard and H.
Jonsson, The Journal of Physical Chemistry B, 2004, 108, 17886-17892.
11. I. C. Man, H.-Y. Su, F. Calle-Vallejo, H. A. Hansen, J. I. Martínez, N. G. Inoglu, J. Kitchin, T.
F. Jaramillo, J. K. Nørskov and J. Rossmeisl, Chem. Catal. Chem., 2011, 3, 1159-1165.
12. K. A. Persson, B. Waldwick, P. Lazic and G. Ceder, Phys. Rev. B, 2012, 85, 235438.
13. I. Castelli, K. Thygesen and K. Jacobsen, Top. Catal., 2014, 57, 265-272.
14. E. H. P. Cordfunke and R. J. M. Konings, Thermochimica Acta, 2001, 375, 65-79.
15. M. Risch, F. Ringleb, M. Kohlhoff, P. Bogdanoff, P. Chernev, I. Zaharieva and H. Dau, Energy
Environ. Sci., 2015, 8, 661-674.
16. J. B. Gerken, J. G. McAlpin, J. Y. C. Chen, M. L. Rigsby, W. H. Casey, R. D. Britt and S. S.
Stahl, J. Am. Chem. Soc., 2011, 133, 14431-14442.
17. J. G. McAlpin, Y. Surendranath, M. Dincǎ, T. A. Stich, S. A. Stoian, W. H. Casey, D. G.
Nocera and R. D. Britt, J. Am. Chem. Soc., 2010, 132, 6882-6883.