Embed Size (px)
Citation preview

S1
Supplementary Information
PBTTT-C16 sol-gel transition by hierarchical colloidal bridging
Han-Liou Yi and Chi-Chung Hua*
Department of Chemical Engineering, National Chung Cheng University, Chiayi 62102, Taiwan
S1 Comparison of pBTTT-C14 and pBTTT-C16 solutions under varying experimental conditions
Fig. S1 Photographs showing the outer apperances of freshly prepared 10 mg/mL pBTTT solutions
(pBTTT-C14/CB, pBTTT-C14/T, and Hw-pBTTT-C16/CB) at 80 °C (upper right) and after 1 (bottom) or
7-day (upper left) aging at 15 °C.
Electronic Supplementary Material (ESI) for Soft Matter.This journal is © The Royal Society of Chemistry 2018

S2
S2 Absorbance of Hw-pBTTT-C16/CB solution and gels
A UV-vis spectrometer (JASCO, V-570) was employed to examine the absorbance of Hw-pBTTT-
C16/CB solution and gels. The measurement was conducted with a cell having a path length of 2 mm
(Hellma, 110-QS) to minimize the scattering associated with large Hw-pBTTT-C16 clusters. Fig. S2
reveals that the present Hw-pBTTT-C16/CB samples have negligible absorption at the incident light
wavelength (λ0 = 785 nm) used in this work.
Fig. S2 Time evolutions of the UV-vis absorption spectra during the Hw-pBTTT-C16/CB sol-gel
transition at T = 15 °C, where results at four different gelation times are shown: t = 0 h (solid line), 8 h
(dotted line), 16 h (dashed line), and 24 h (dashed-dotted line). The absorption at 785 nm is marked by
the vertical dashed line in the magnified inset figure.

S3
S3 Effect of laser power on the dynamics of Hw-pBTTT-C16/CB gel
Fig. S3 shows the effect of incident laser power on the intensity correlation function, g(2)(q,t) − 1, for
a Hw-pBTTT-C16/CB gel. It is apparent that g(2)(q,t) − 1 obtained under 50% of the incident laser
power (20 mW) differs considerably from those of 25% and 5%. According to the wavy feature at long
decay times, it is possible that laser-induced convection has some effect on the the relaxation spectrum
of the Hw-pBTTT-C16/CB gel. As the incident laser power is reduced to 5% of its original intensity,
however, it seems that such an effect can be minimized.
Fig. S3 Intensity correlation functions, g(2)(q,t) − 1, for the Hw-pBTTT-C16/CB gel incubated at T = 15
°C (t = 24 h), with the laser power equal to 5%, 10% or 50% of the original intensity. The results for two
representative scattering angles are shown.

S4
S4 Assessment of ergodicity of Hw-pBTTT-C16/CB gels
Nonergodic media, such as glasses1,2 and gels,3 are known to bear frozen spatial inhomogeneities due to
the effects of frozen structure (in glasses) and topological constraint, i.e., cross-linking (in gels).4 Among
the most noticeble manifestations of nonergodicity is the appearance of speckles, i.e., random
fluctuations in scattering intensity with varying sample position. At early times, it was generally believed
that spatial inhomogeneities are a characteristic feature of chemical gels so that speckles won’t be
observable in physical gels. More recently, there have been numerous examples clearly demonstrating
that the previous hypothesis is incorrect, considering, for instance, PVA/CR gel,5 gelatin gel,6,7 and
hybrid gel.8 The notion of nonergodicity, first advocated by Pusey and Van Megen,4 has led to the
subsequent development of analysis schemes for resolving the dynamic properties of gels, including
partial heterodyne method9,10 and intermediate scattering function analysis.11
For nonergodic gels, the time-averaged scattering intensity ⟨I⟩T accommodates two distinct
contributions denoted as ⟨I⟩T = ⟨Is⟩T + ⟨Id⟩T ,12 where ⟨Is⟩T represents the frozen-in component that
changes with varying sample position, and ⟨Id⟩T is the mobile (or intrinsic) dynamic component that is
independent of the sample position. At each randomly selected position, one simultaneously measures
⟨I⟩T from static light scattering (SLS) and g(2)(q, t) from dynamic light scattering (DLS) at a given
scattering angle.9,10,13 According to partial heterodyne method, the contribution from the mobile dynamic
component, ⟨Id⟩T, may be obtained through the following relation:8,10,14-18
IT
DA =
2IT
D −
IdT
D (S1)
where DA denotes the apparent diffusion coefficient and D is the collective diffusion coefficient in pure

S5
heterodyne. The experimental strategy is as follows: at each randomly selected sample position, ⟨I⟩T
can be obtained from the SLS experiment while DA can be simultaneously extracted from g(2)(q, t) in
the DLS experiment. Then, the values of D and ⟨Id⟩T can be estimated from the slope and intercept,
respectively, of the plot of ⟨I⟩T DA⁄ versus ⟨I⟩T. On the other hand, the ensemble-averaged scattering
intensity, ⟨I⟩E, is evaluated by ∑ ⟨I⟩T,ii N⁄ , with N being the total number of randomly selected sample
positions (N = 100 in this experiment). Only in an ergodic system will ⟨I⟩E = ⟨I⟩T and ⟨Is⟩T = 0 hold
true. Note that the disparity between ⟨Id⟩T and ⟨I⟩E reflects the degree of nonergodicity.
Fig. S4 presents the time-averaged scattering intensity, ⟨I⟩T, for Hw-pBTTT-C16/CB solution and
gel, as the sample position was arbitrarily chosen by rotating and lifting the sample cuvette. It can be
seen that at T = 80 °C the speckle pattern vanishes because the solution remains as a uniform dispersion.
In contrast, a notable speckle pattern emerges for the gel, and nonergodicity clearly reflects in the marked
difference between ⟨I⟩E and ⟨Id⟩T. The value of DA also varies with sample position in this case, and a
plot of eqn (S1) shows that all data points fall on a straight line; see Fig. S5. Accordingly, the fluctuating
component of the scattering intensity, ⟨Id⟩T, denoted by the dashed lines in Fig. S4, and the collective
diffusion coefficient, D, can be evaluated, as indicated in Fig. S5. The corresponding position
dependence of g(2)(q,t) − 1 is shown in Fig. S6. All the results reported in the main manuscript on the
gel samples represent an average over 10–20 independent positions.

S6
Fig. S4 Sample position dependences of time-averaged scattering intensity, ⟨I⟩T, for Hw-pBTTT-C16/CB
solution (T = 80 °C) and gel (T = 15 °C; t = 24 h) at two representative scattering angles θ = 30° and
90°. The horizontal dashed and solid lines represent the results for ⟨Id⟩T and ⟨I⟩E, respectively.
Fig. S5 Plots of ⟨I⟩T DA⁄ versus time-averaged scattering intensity, ⟨I⟩T, for the Hw-pBTTT-C16/CB
gel incubated at 15 °C (t = 24 h), where the collective difussion coefficient, D, and the dynamic mobile
component, ⟨Id⟩T, are obtained simultaneously by the slope and intercept, respectively, of the regressive
line according to eqn (S1).
S7
Fig. S6 Intensity correlation functions, g(2)(q,t) − 1, measured at two representative scattering angles θ
= 30° and 90° for different sample positions as considered in Fig. S5 for the Hw-pBTTT-C16/CB gel
incubated at 15 °C (t = 24 h).

S8
S5 Dynamic features of Hw-pBTTT-C16/CB sol and gel
We first examine the time evolution of the normalized field autocorrelation functions, |g(1)
(q, t)|, shown
in Fig. 6a of the main text, as the Hw-pBTTT-C16/CB sol (t = 0 h) has been brought into the gel state at
15°C. As shown in Fig. S7 for the initial (sol) state, |g(1)
(q, t)| at various scattering angles do not collapse
onto a single curve when the decay time is rescaled with q2; this feature can also be seen in the CONTIN
modes shown in the same figure, where three major modes may be identified (there is, in fact, a fourth
mode at short times, possibly representing the sporadic gelators revealed in a later SAXS analysis). By
taking into account the effect of some polydispersity in aggregate size, the scaling behaviors of the mean
decay rate, ⟨Γi⟩ ∼ qα, shown in Fig. 6b of the main text suggest that the fast and intermediate modes are
diffusive in nature, as the scaling exponents fall around 2. In contrast, the (third) slow mode is q-
independent. The corresponding distributions of the mean hydrodynamic radius are presented in the inset
of Fig. 6a in the main text, where the two (diffusive) aggregate species correspond to Rh ~ 10 nm and Rh
~ 100 nm (recall that the DDLS analysis indicated that the aggregate species for the initial (sol) state at
15°C is spherical in shape). As suggested by a later SAXS analysis, the fast mode represents the building
particles of larger aggregate clusters, which in turn are manifested by the second (intermediate) mode.
The origin of the nearly q-independent relaxation (⟨Γ⟩ ~ q0 in Fig. 6b of the main text) for the slow
mode is of particular interest and worth pursuing. In general, similar relaxation behavior has been
reported for a variety of polymer solutions,19-24 where it customarily involved either elastic responses
due to the formation of physical bonds, or chain relaxations subject to physical confinements (such as
chain reptation). Interestingly, the analysis shown in Fig. 6b of the main text indicates that at an

S9
intermediate stage of gelation (t = 8 h) the same slow mode has been transformed to a nearly q2-dependent
relaxation (i.e., ⟨Γ⟩ = q2); meanwhile, we notice that the corresponding SAXS profile exhibits a notable
increase in the fractal dimension (df = 2 to 3) in the low-q region, as shown in Fig. S8. These features
together imply that the slow mode could represent certain large yet loose clusters, which begin to take
shape as the gelation proceeds. At still longer times, these (micrometer-sized) clusters are among the first
that interconnect to form the gel network, and the scaling law resumes to ⟨Γ⟩ ~ q0 again for a different
reason, as seen in Fig. 6b of the main text for t = 16 and 24 h.
In Fig. 6a of the main text, the time-evolving |g(1)
(q, t)| for the Hw-pBTTT-C16/CB gel at 15 °C is
observed to undergo the following stages: The initial (multiple-mode) exponential decay broadens
substantially toward longer relaxation times, similar to the result of particle (or aggregate) clustering.25
At intermediate times, the stretched exponential decay (at t = 8 h) transits to a power-law one (at t = 16
h). However, the long-time decay (at t = 24 h) appears to resume to an exponential type, a peculiar feature
that had not been reported for polymer gels. Below, we perform detailed analyses of the DLS data to gain
insight into these phenomena.
In the initial sol state (t = 0–8 h), three major relaxation modes have been identified in Fig. 6b of
the main text. As discussed earlier, the fast mode may be attributed to the building particles of larger
aggregate clusters (recall that these building particles represent the same rod-like species in the pristine
solution at 80 °C that have since morphed into spherical ones at the gelation temperature). The second
(intermediate) mode represents the diffusive (in sol) or collective (in gel) motion of the aggregate clusters,
as described by the first term in eqn (S2) or (S3) discussed shortly. Described by the second term in the

S10
same equation, the slow mode is associated with the translational diffusion of micrometer-sized clusters.
With still longer gelation time (t = 16 h), the attributes of the first two modes change little while the third
(slow) mode is indicative of arrested dynamics for micrometer-sized clusters. The overall power-law
decay seen at this stage has previously been associated with the percolation threshold for polymers26 as
well as for irreversible aggregating silica,27 copolymer micelles,28 and thermoreversible (polymer-grafted)
silica.29 Finally (t = 24 h), a progressive drop in ICF (see Fig. 5 in the main text) is known to be a signature
of ergodic-to-nonergodic transition during gelation.27,30-32 The wavy feature in the long-time relaxation
of |g(1)
(q, t)| has been suggested to be a consequence of low damping of acoustic waves that is typical
in colloidal gels.33 Detailed structural features are analyzed below.
For percolating systems, such as gelling polymer solutions26 and colloid dispersions,8,27,31,34 wherein
individual chains or particles are being embedded in large aggregate clusters, the dynamic features have
been well established both in theories and experiments. According to Martin and Wilcoxon,35,36 the ICF
in the sol state may be described by a fast mode (a single-exponential decay) and a slow mode (a
stretched-exponential decay) as
g(2)(q,t) − 1 = σI2{A exp(−Dq2t) + (1 − A) exp[−(t tc⁄ )β]}
2 (S2)
where σI2 is the initial amplitude of ICF, A (≤1) is the fraction of the collective diffusion mode, D is the
(collective) diffusion coefficient of the fast mode, tc is the characteristic decay time for the stretched
exponential mode, and β is the stretched exponent. The fits based on eqn (S2) for the DLS data (i.e.,
|g(1)
(q, t)|) at t = 8 h are shown in Fig. 6a of the main text (solid lines).
When approaching a sol-gel transition point, the slow mode becomes dominant (when micrometer-

S11
sized clusters in the present study interconnect to form the gel network), and the ICF becomes a power-
law function which may be described by
g(2)(q,t) − 1 = σI2 {A exp(−Dq2t) + (1 − A)[1 + (t t*⁄ )]
(n−1) 2⁄}
2
(S3)
Here, t* is the characteristic decay time when the power-law behavior emerges, and n (0 < n < 1) is the
fractal dimension of the gel network.
It is important to note, however, that we here observe an initial stretched exponential decay of
|g(1)
(q, t)| followed by a plateau region at intermediate decay times for the Hw-pBTTT-C16/CB gel at t =
24 h, indicative of restricted particle displacements and nonergodicity. A similar feature in |g(1)
(q, t)| at
long decay times has previously been attributed to the restructuring, aging, or re-equilibration event in
weak colloidal gels.29,37,38 In this case, the model proposed by Krall and Weitz25 for the dynamics of
fractal cluster gels may be utilized:
|g(1)
(q, t)| = exp
– (qδ)
2
6[1– exp(– t/τ
β)p] exp(– t/τ
γ)1.5
(S4)
where δ2 is the maximum mean-squared displacement of a segment of size q-1 (and, hence, may be used
to infer the mean porosity size of a gel), τβ is the characteristic decay time of density fluctuations, p is the
argument of the stretched exponential decay, and τγ is the characteristic time for the aging behavior
observed at long decay times. The exponential decay with a power exponent of 1.5 arises because of the
local deformations by gel syneresis, which acts as force dipoles in the network.38 The dotted lines in Fig.
6a of the main text (for t = 24 h) represent the best fits of |g(1)
(q, t)| according to eqn (S4), where δ, τβ ,
τγ , and p were usually treated as q-dependent parameters. It can be seen that the |g(1)
(q, t)| curves at four
different scattering angles can be described excellently by the fits with eqn (S4), and, notably, the

S12
parameters are found to be independent of q.
Tracing back, a power-law fit with eqn (S3) is also carried out for t = 16 h (dashed lines) to determine
the power-law exponent n, and its q2 dependence is examined in Fig. S9. It appears that the values of n
all fall around 0.54, in fair agreement with the “viscoelastic” exponents previously obtained by Michon
et al. (i.e., 0.6-0.71, depending on the polymer concentration and system temperature)39 and by Okamoto
et al. (i.e., 0.74).6 Thus, the q independence of n has been confirmed in the present study as well as in
early work,6,7 although the results reported by Ren et al. seem to exhibit a different trend.40,41 Given that
the exponent is physically related to the so-called viscoelastic exponent discussed earlier by Doi and
Onuki,42 the q independence seems to be more reasonable.
The power-law exponent, n, so determined may be used to estimate the fractal dimension df of the
gel network. Models of this kind have been proposed for percolating polymers, varying mainly in their
assumptions about hydrodynamic and excluded-volume interactions. There is a permitted range of n
values for ensuring realistic fractal dimensions between 1 and 3. As the Rouse dynamics is assumed,43
one has
n = 3
df+2
(S5)
which requires the power-law exponent to fall in the range of 0.6 < n < 1. If excluded-volume interactions
are fully screened (yet with hydrodynamic interactions), df may be determined by44
n = 3(5–2d
f)
2(5–df)
(S6)
with 0 < n < 1 instead. Fractal dimensions estimated using the presently obtained power-law exponents
along with eqn (S5) and (S6) are provided in Table S1, wherein it is evident that eqn (S6) better describes

S13
the present data. Using the values of D previously obtained, the correlation length, ξ—a spatial length
scale for describing the mean cluster separation (for sols) or mesh size (for gels)—can be estimated via
the relation45
ξ = kBT
6πηD (S7)
The reduction of ξ (see Table S1) with increased gelation time is in accord with the progressive formation
of a gel.
Fig. S7 Angular dependences of the field autocorrelation function, |g(1)
(q, t)|, for the Hw-pBTTT-C16/CB
gel incubated at 15 °C (t = 0 h), where the decay time τ has been rescaled with q2. The corresponding
decay time distribution functions, G(τ), extracted from CONTIN are shown in the inset figure.

S14
Fig. S8 Time evolutions of the SAXS profile for the Hw-pBTTT-C16/CB gel at 15 °C, where symbols
represent the results at three different gelation times: t = 0 h (green up-triangles), 4 h (orange spheres),
and 8 h (gray diamonds), respectively.
Fig. S9 q2-dependences of the power-law exponent, n, determined from the fits to eqn (S3) using the
data shown in Fig. 6a of the main text (dashed lines) for t = 16 h.

S15
Table S1 Material properties extracted from DLS analysis for the Hw-pBTTT-C16/CB sol and gel
incubated at 15 °C
Methods Parameters Sol Gel
DLS
Fraction of the collective diffusion mode (A) 0.78±0.09 0.10±0.07
Collective diffusion coefficient (D) [nm2˙ms-1] 107±21 283±67
Characteristic time (tc, t*) [ms] 2.5±1.8 0.34±0.06
Stretched exponent (β)/Power-law exponent (n) 0.95±0.12 0.54±0.11
Fractal dimension (df)
-Rouse dynamics a
-Hydrodynamic interactions b
- 3.56
- 1.95
Correlation length (ξ) [nm] c 2334±458 883±209
Maximum mean displacement (δ) [nm] - 237±28
Characteristic decay time of density fluctuations (τβ) [ms] - 0.31±0.17
Stretched exponential decay (p) - 0.25±0.08
Characteristic time (τγ) [ms] - 902±291
a Calculated from eqn (S5); b Calculated from eqn (S6); c Calculated from eqn (S7).

S16
S6 Experssions used for the fitting of SALS/SLS/SAXS data
I(q) = IG(0)exp
–1
3R
2
gq2
+ I
L(0)
{1+[(df +1)/3]ζ 2q2}
df /2Psph(q) (S8)
where a spherical form factor is utilized (R being the radius):
Psph (q) =
3 sin( )qR – qR cos( )qR
( )qR 3
2
(S9)
I(q) = I
L(0)
{1+[(df +1)/3]ζ 2q2}
df /2Psph, gelator(q) + I
P(0)Psph, gelator(q) (S10)

S17
S7 Viscoelastic characterizations of Hw-pBTTT-C16/CB solution and gels
Viscoelastic properties of Hw-pBTTT-C16/CB solution and gels were characterized using three different
rheological modes: (1) strain sweep with an angular frequency of 10.0 rad/s was used to identify the
linear viscoelastic (LVE) region, as the sample solution was converted to the gel state at the gelation
temperature (5, 10, and 15 °C); (2) frequency sweep was subsequently conducted with a (linear) strain
amplitude of 0.01 to explore the variations of storage modulus (G') and loss modulus (G") from solution
to gel state (or the reverse process); (3) finally, the aging-time dependent, time-sweep complex modulus
(G*) data of Hw-pBTTT-C16/CB gels were obtained using a strain amplitude of 0.01 along with a constant
frequency of 10.0 rad/s.
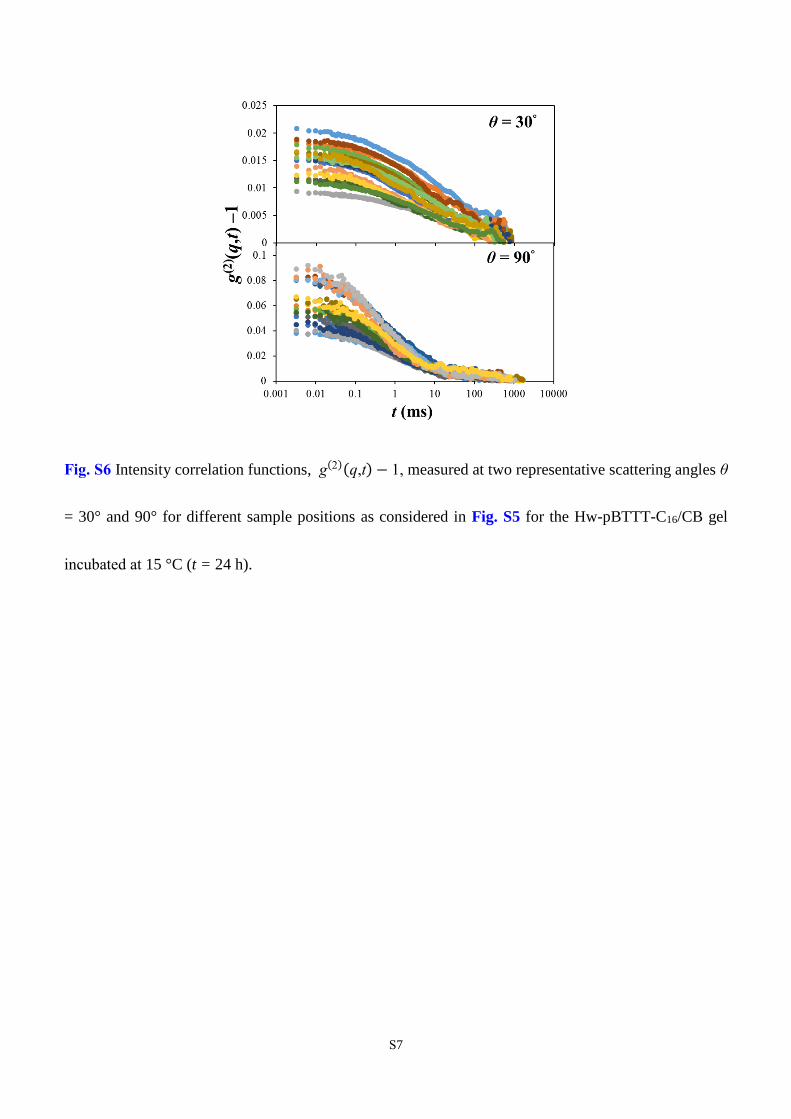
We first perform (oscillatory) strain-sweep measurements to locate the linear viscoelastic (LVE)
region of the Hw-pBTTT-C16/CB gels investigated herein at a constant frequency of 10.0 rad/s. The
results are shown in Fig. S10, with the central findings summarized as follows: All gels incubated at three
different temperatures show constant magnitudes and solid-like behavior, G′ > G″, at low strains. As the
imposed strain exceeding a certain value in each case, the LVE region terminates and G′ and G″ start to
drop with increased strain magnitude. Near the crossover point of G′ and G″, however, the Hw-pBTTT-
C16/CB gel exhibits a slight overshoot in G″ before it drops significantly with increased strain owing to
the destruction of gel structure. Similar behavior, classified as a ‘‘weak strain overshoot,’’ was previously
reported for a 4% xanthan gum solution46 in strain-sweep experiment as well as in stress sweeps of mucin
gels with properties similar to those of polyelectrolytes.47,48 Comparatively, reducing the gelation
temperature leads to a notable shortening of the LVE region, along with higher mechanical strength with

S18
larger G′ and G″ values.
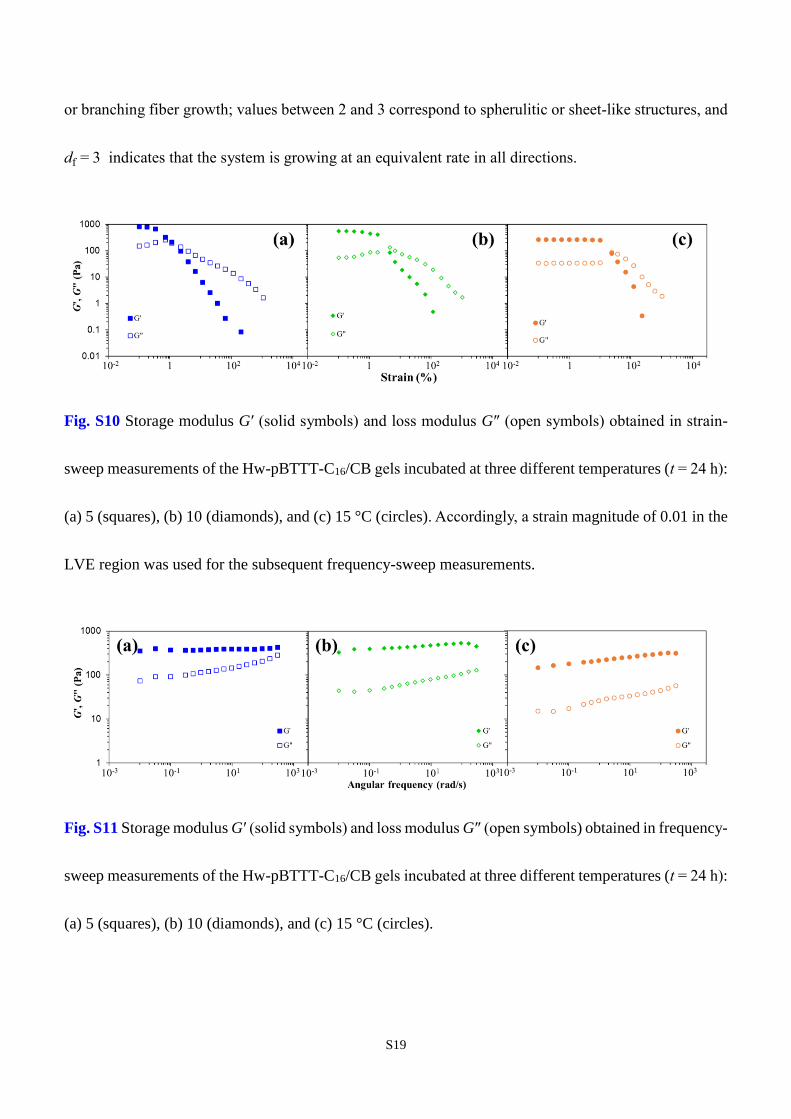
In frequency-sweep measurements, a constant shear strain of 0.01 within the LVE range for all three
samples is utilized to ensure that the gel properties are preserved without altering its microstructure.
Moreover, the oscillatory frequency falls in a range of 0.01 to 300 rad/s to minimize the impact of fixture
inertia. Results for a representative gelation temperature, T = 15 °C, are shown in Fig. 9 of the main text
for various stages of gelation (t = 0, 8, and 16 h), while the results on all three gel samples for t = 24 h
are compared in Fig. S11.
To resolve the gelation kinetics, the following model derived by Li and Liu49 for the Avrami theory
of phase changes is employed:
ln [−ln (1 − ϕg
t )] = df[ln k + ln(t − tgel)] (S11)
where df is the Avrami component that reflects the fractal dimension of the gel structure, k is a rate
constant proportional to the rate of gel growth, and t and tgel are the elapsed time and the initial gelation
time (i.e., at G′ = G″), respectively. The extent of gelation, ϕg
t, (i.e., how far the gelation proceeds from
the initial sol state) can be expressed in terms of G* at different times as ϕ
g
t =
(G*(t) − Gbkg
* ) (Gmax* − Gbkg
* )⁄ , where G*(t) is the time-dependent complex modulus, Gbkg
* is the
complex modulus at the initial gelation time, and Gmax*
is the maximum complex modulus at a kinetic
equilibrium. Here, Gmax*
is taken from the mean value of the modulus data at long times. Similar
schemes have been used in early work to study the effects of solvent quality on the self-assembly behavior
of PFO,50 P3HT,51 and MEH-PPV52 organogels. For instance, df = 1 indicates that the gel network is
formed by following a 1-D kinetic pathway (e.g., straight fibers); values between 1 and 2 imply bifurcated
S19
or branching fiber growth; values between 2 and 3 correspond to spherulitic or sheet-like structures, and
df = 3 indicates that the system is growing at an equivalent rate in all directions.
Fig. S10 Storage modulus G′ (solid symbols) and loss modulus G″ (open symbols) obtained in strain-
sweep measurements of the Hw-pBTTT-C16/CB gels incubated at three different temperatures (t = 24 h):
(a) 5 (squares), (b) 10 (diamonds), and (c) 15 °C (circles). Accordingly, a strain magnitude of 0.01 in the
LVE region was used for the subsequent frequency-sweep measurements.
Fig. S11 Storage modulus G′ (solid symbols) and loss modulus G″ (open symbols) obtained in frequency-
sweep measurements of the Hw-pBTTT-C16/CB gels incubated at three different temperatures (t = 24 h):
(a) 5 (squares), (b) 10 (diamonds), and (c) 15 °C (circles).

S20
References
1. P. N. Pusey and W. van Megen, Phys. Rev. Lett., 1987, 59, 2083-2086.
2. W. van Megen and P. N. Pusey, Phys. Rev. A, 1991, 43, 5429-5441.
3. S. Mallam, A. M. Hecht, E. Geissler and P. Pruvost, J. Chem. Phys., 1989, 91, 6447-6454.
4. P. N. Pusey and W. Van Megen, Phys. A, 1989, 157, 705-741.
5. F. Ikkai and M. Shibayama, Phys. Rev. Lett., 1999, 82, 4946-4949.
6. M. Okamoto, T. Norisuye and M. Shibayama, Macromolecules, 2001, 34, 8496-8502.
7. M. Shibayama and M. Okamoto, J. Chem. Phys., 2001, 115, 4285-4291.
8. Y. Zhao, G. Zhang and C. Wu, Macromolecules, 2001, 34, 7804-7808.
9. J. G. H. Joosten, E. T. F. Geladé and P. N. Pusey, Phys. Rev. A, 1990, 42, 2161-2175.
10. J. G. H. Joosten, J. L. McCarthy and P. N. Pusey, Macromolecules, 1991, 24, 6690-6699.
11. L. Fang and W. Brown, Macromolecules, 1992, 25, 6897-6903.
12. C. Rouf, J. Bastide, J. M. Pujol, F. Schosseler and J. P. Munch, Phys. Rev. Lett., 1994, 73, 830-
833.
13. B. J. Berne and R. Pecora, Dynamic Light Scattering: With Applications to Chemistry, Biology,
and Physics, Dover Publications, New York, 2013.
14. M. Shibayama, T. Norisuye and S. Nomura, Macromolecules, 1996, 29, 8746-8750.
15. M. Shibayama, Y. Fujikawa and S. Nomura, Macromolecules, 1996, 29, 6535-6540.
16. M. Shibayama, S. Takata and T. Norisuye, Phys. A, 1998, 249, 245-252.
17. M. Shibayama, Macromol. Chem. Phys., 1998, 199, 1-30.
18. T. Ngai, C. Wu and Y. Chen, J. Phys. Chem. B, 2004, 108, 5532-5540.
19. M. Doi and S. F. Edwards, The Theory of Polymer Dynamics, Clarendon Press, New York, 1988.
20. K. Thuresson, S. Nilsson, A.-L. Kjøniksen, H. Walderhaug, B. Lindman and B. Nyström, J. Phys.
Chem. B, 1999, 103, 1425-1436.
21. A. Koike, N. Nemoto, T. Inoue and K. Osaki, Macromolecules, 1995, 28, 2339-2344.
22. R. Johannsson, C. Chassenieux, D. Durand, T. Nicolai, P. Vanhoorne and R. Jerome,
Macromolecules, 1995, 28, 8504-8510.
23. G. Fytas, H. G. Nothofer, U. Scherf, D. Vlassopoulos and G. Meier, Macromolecules, 2002, 35,
481-488.
24. J. Li, W. Li, H. Huo, S. Luo and C. Wu, Macromolecules, 2008, 41, 901-911.
25. A. H. Krall and D. A. Weitz, Phys. Rev. Lett., 1998, 80, 778-781.
26. M. Takeda, T. Norisuye and M. Shibayama, Macromolecules, 2000, 33, 2909-2915.
27. S. L. Elliott, R. J. Butera, L. H. Hanus and N. J. Wagner, Faraday Discuss., 2003, 123, 369-383.
28. F. Mallamace, P. Gambadauro, N. Micali, P. Tartaglia, C. Liao and S. H. Chen, Phys. Rev. Lett.,
2000, 84, 5431-5434.
29. M. J. Solomon and P. Varadan, Phys. Rev. E, 2001, 63, 051402.
30. S. Mitsuhiro and N. Tomohisa, Bull. Chem. Soc. Jpn., 2002, 75, 641-659.
31. T. Norisuye, M. Inoue, M. Shibayama, R. Tamaki and Y. Chujo, Macromolecules, 2000, 33, 900-

S21
905.
32. H. Guo, S. Ramakrishnan, J. L. Harden and R. L. Leheny, Phys. Rev. E, 2010, 81, 050401.
33. M. Sztucki, T. Narayanan, G. Belina, A. Moussaïd, F. Pignon and H. Hoekstra, Phys. Rev. E, 2006,
74, 051504.
34. X. J. Cao, H. Z. Cummins and J. F. Morris, Soft Matter, 2010, 6, 5425-5433.
35. J. E. Martin and J. P. Wilcoxon, Phys. Rev. Lett., 1988, 61, 373-376.
36. J. E. Martin, J. Wilcoxon and J. Odinek, Phys. Rev. A, 1991, 43, 858-872.
37. A. Mohraz and M. J. Solomon, J. Colloid Interface Sci., 2006, 300, 155-162.
38. L. Cipelletti, S. Manley, R. C. Ball and D. A. Weitz, Phys. Rev. Lett., 2000, 84, 2275-2278.
39. C. Michon, G. Cuvelier and B. Launay, Rheol. Acta, 1993, 32, 94-103.
40. S. Z. Ren and C. M. Sorensen, Phys. Rev. Lett., 1993, 70, 1727-1730.
41. S. Z. Ren, W. F. Shi, W. B. Zhang and C. M. Sorensen, Phys. Rev. A, 1992, 45, 2416-2422.
42. M. Doi and A. Onuki, J. Phys. II, 1992, 2, 1631-1656.
43. D. Adolf and J. E. Martin, Macromolecules, 1990, 23, 3700-3704.
44. W. Hess, T. A. Vilgis and H. H. Winter, Macromolecules, 1988, 21, 2536-2542.
45. P. G. de Gennes, Scaling Concepts in Polymer Physics, Cornell University Press, New York, 1979.
46. K. Hyun, S. H. Kim, K. H. Ahn and S. J. Lee, J. Non-Newtonian Fluid Mech., 2002, 107, 51-65.
47. C. Taylor, A. Allen, P. W. Dettmar and J. P. Pearson, Biochim. Biophys. Acta, Gen. Subj., 2004,
1674, 131-138.
48. J. P. Celli, B. S. Turner, N. H. Afdhal, R. H. Ewoldt, G. H. McKinley, R. Bansil and S. Erramilli,
Biomacromolecules, 2007, 8, 1580-1586.
49. J.-L. Li and X.-Y. Liu, Adv. Funct. Mater., 2010, 20, 3196-3216.
50. P. de la Iglesia and D. C. Pozzo, Soft Matter, 2013, 9, 11214-11224.
51. G. M. Newbloom, K. M. Weigandt and D. C. Pozzo, Macromolecules, 2012, 45, 3452-3462.
52. R. H. Guo, C. H. Hsu, C. C. Hua and S. A. Chen, J. Phys. Chem. B, 2015, 119, 3320-3331.