Embed Size (px)
Citation preview
Disease Models & Mechanisms 8: doi:10.1242/dmm.019935: Supplementary Material
Supplementary Material
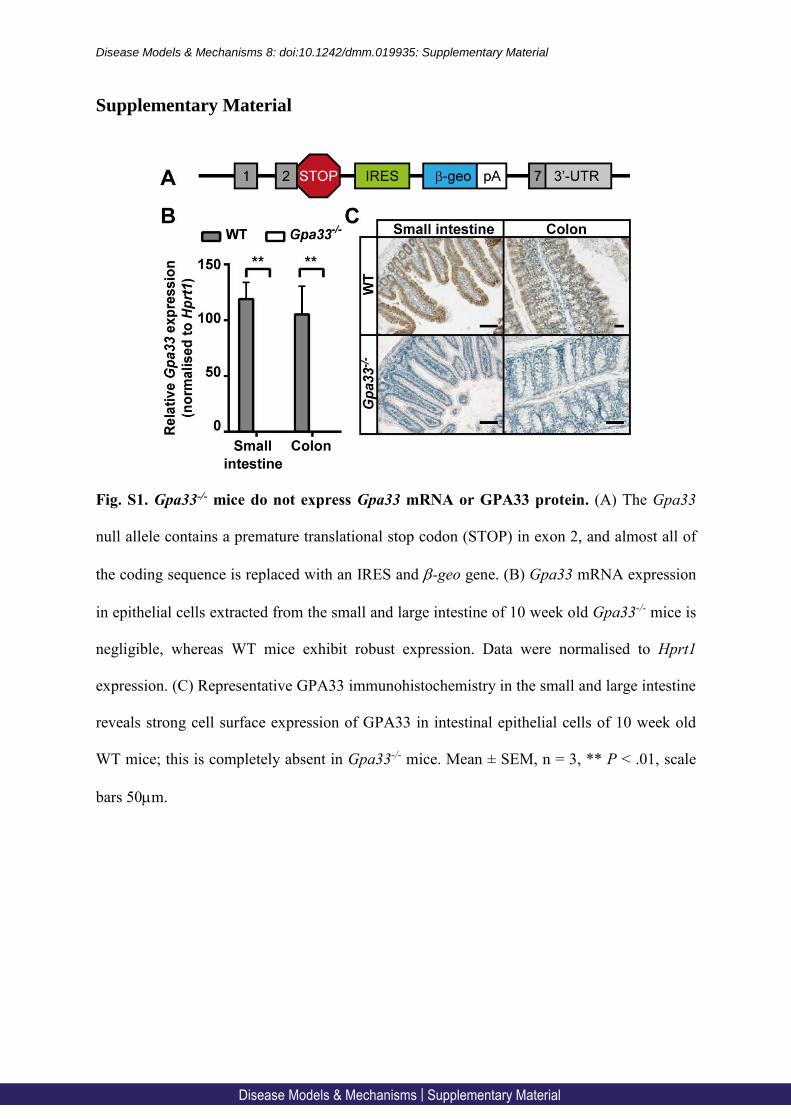
Fig. S1. Gpa33-/- mice do not express Gpa33 mRNA or GPA33 protein. (A) The Gpa33
null allele contains a premature translational stop codon (STOP) in exon 2, and almost all of
the coding sequence is replaced with an IRES and -geo gene. (B) Gpa33 mRNA expression
in epithelial cells extracted from the small and large intestine of 10 week old Gpa33-/- mice is
negligible, whereas WT mice exhibit robust expression. Data were normalised to Hprt1
expression. (C) Representative GPA33 immunohistochemistry in the small and large intestine
reveals strong cell surface expression of GPA33 in intestinal epithelial cells of 10 week old
WT mice; this is completely absent in Gpa33-/- mice. Mean ± SEM, n = 3, ** P < .01, scale
bars 50m.
Disease Models & Mechanisms | Supplementary Material

Disease Models & Mechanisms 8: doi:10.1242/dmm.019935: Supplementary Material
Fig. S2. Flow cytometry analysis of haematopoietic cells within the colon LP and spleen.
Single cell suspensions prepared from colon lamina propria (LP) and spleen were analysed by
flow cytometry for myeloid and lymphoid populations. Absolute cell numbers for whole
colon LP or spleen were calculated using relative cell populations and viable single cell
counts. (A) B-cell (Epcam- CD45+ CD11b- TCR- B220+) and T-cell (Epcam- CD45+ CD11b-
TCR+ B220+ and CD4+ or CD8+) populations were unchanged in the colon LP of Gpa33-/-
and WT mice. (B) Dendritic cells (DCs; Epcam- CD45+ CD11c+ F4/80- MHC-II+), activated
DCs (Epcam- CD45+ CD11c+ F4/80- MHC-II+, CD86+) and macrophages (Epcam- CD45+
CD11c+ F4/80+) populations were unchanged in the spleen of Gpa33-/- and WT mice. (C)
CD8+ T cell (Epcam- CD45+ CD11b- TCR+ B220- CD8+) numbers were slightly elevated in
the spleen of Gpa33-/- and WT mice, whereas B-cell (Epcam- CD45+ CD11b- TCR- B220+)
and CD4+ T-cell (Epcam- CD45+ CD11b- TCR+ B220- and CD4+) numbers were unchanged.
Mean ± SEM, n = 6, * P < .05.
Disease Models & Mechanisms | Supplementary Material

Disease Models & Mechanisms 8: doi:10.1242/dmm.019935: Supplementary Material
Fig. S3. Gpa33 is not expressed in haematopoietic populations. Expression of Gpa33 in 39
haematopoietic populations within the bone marrow, spleen and thymus was analysed using
the Gene Expressions Commons (GEXC) Mouse Haematopoiesis Model (dataset GSE34723
(Seita et al., 2012)). This model separated haematopoietic cell populations identified by
expression of unique combinations of surface markers with flow cytometry cell sorting. Gene
expression was analysed for each cell population on the Affymetrix Mouse Genome 430 2.0
Array (Affymetrix, Santa Clara, CA, USA) microarray platform. Gene expression activity < 0
indicates that Gpa33 is not expressed in any haematopoietic cell populations. Gpa33
expression activity was analysed using two independent probesets; (A) probeset 1 and (B)
probeset 2. (C) Abbreviations used for cell populations in (A, B). Mean ± SEM, n = 3.
Disease Models & Mechanisms | Supplementary Material

Disease Models & Mechanisms 8: doi:10.1242/dmm.019935: Supplementary Material
Fig. S4. Both Gpa33-/- and WT mice exhibit activation of the WNT pathway in colitis
associated tumours. (A) Representative H&E and -catenin immunohistochemistry of CAC
tumours from Gpa33-/- and WT mice reveals elevated -catenin expression within tumours
compared to normal epithelium. (B) Relative mRNA expression of WNT pathway target
genes CD44 and Lgr5 is increased in CAC tumours compared to normal colonic epithelium.
Data were normalized to Hprt1 expression. Mean ± SEM, n = 5-9 for (A, B) and 4-8 for (D),
* P < .05, ** P < .01, scale bar 100m.
Disease Models & Mechanisms | Supplementary Material

Disease Models & Mechanisms 8: doi:10.1242/dmm.019935: Supplementary Material
Fig. S5. EPCAM and FAP expression in the inflamed bowel of IBD patients. Relative
EPCAM and FAP expression in normal (N), uninflamed (U) and inflamed (I) bowel of IBD
patients represented as whisker and box plots. (A) EPCAM expression is not significantly
different in inflamed compared to uninflamed bowel from Crohn’s disease patients
(uninflamed n = 18, inflamed n = 8; dataset GDS3119) (Olsen et al., 2009) or (B) in inflamed
compared to normal and uninflamed bowel from ulcerative colitis patients (normal n = 22,
uninflamed n = 15, inflamed n = 19; dataset GDS3268) (Noble et al., 2008). (C) FAP
expression is not significantly different in inflamed compared to uninflamed bowel from
Crohn’s disease patients, but is significantly higher in the inflamed compared to the normal
and uninflamed tissue from the ulcerative colitis patients (D) * P < .05, ** P < .005. Relative
gene expression values were normalised using (A) Human Genome U133 Plus 2.0 Array
Normalisation Controls (Affymetrix) and (B) Stratagene Universal Human Reference
(Stratagene).
Disease Models & Mechanisms | Supplementary Material

Disease Models & Mechanisms 8: doi:10.1242/dmm.019935: Supplementary Material
Table S1. Histological colitis scoring system
The total colitis score comprises epithelial damage and inflammation scores for the proximal,
mid and distal colon.
Colitis criteria Scoring Tissue compartments
Epithelial damage 0 normal
1 hyperplasia
2 <50% crypt loss
3 >50% crypt loss
4 100% crypt loss
5 ulceration
Epithelium
Presence of inflammatory
cells
0 none
1 mild
2 moderate
3 severe
Mucosa
Submucosa
Muscle
References
Johnstone, C. N., Tebbutt, N. C., Abud, H. E., White, S. J., Stenvers, K. L., Hall,
N. E., Cody, S. H., Whitehead, R. H., Catimel, B., Nice, E. C. et al. (2000).
Characterization of mouse A33 antigen, a definitive marker for basolateral surfaces of
intestinal epithelial cells. Am J Physiol Gastrointest Liver Physiol 279, G500-10.
Seita, J., Sahoo, D., Rossi, D. J., Bhattacharya, D., Serwold, T., Inlay, M. A.,
Ehrlich, L. I., Fathman, J. W., Dill, D. L. and Weissman, I. L. (2012). Gene Expression
Commons: an open platform for absolute gene expression profiling. PLoS One 7, e40321.
Disease Models & Mechanisms | Supplementary Material