Embed Size (px)
Citation preview
S1
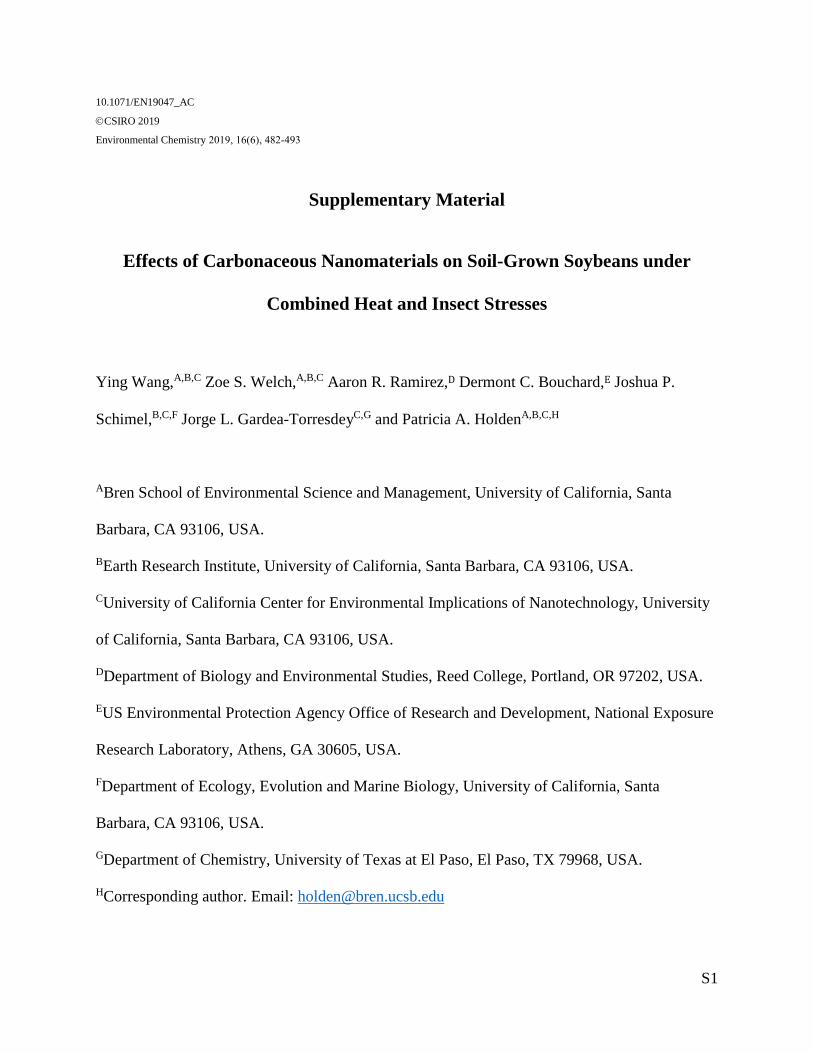
10.1071/EN19047_AC
CSIRO 2019
Environmental Chemistry 2019, 16(6), 482-493
Supplementary Material
Effects of Carbonaceous Nanomaterials on Soil-Grown Soybeans under
Combined Heat and Insect Stresses
Ying Wang,A,B,C Zoe S. Welch,A,B,C Aaron R. Ramirez,D Dermont C. Bouchard,E Joshua P.
Schimel,B,C,F Jorge L. Gardea-TorresdeyC,G and Patricia A. HoldenA,B,C,H
ABren School of Environmental Science and Management, University of California, Santa
Barbara, CA 93106, USA.
BEarth Research Institute, University of California, Santa Barbara, CA 93106, USA.
CUniversity of California Center for Environmental Implications of Nanotechnology, University
of California, Santa Barbara, CA 93106, USA.
DDepartment of Biology and Environmental Studies, Reed College, Portland, OR 97202, USA.
EUS Environmental Protection Agency Office of Research and Development, National Exposure
Research Laboratory, Athens, GA 30605, USA.
FDepartment of Ecology, Evolution and Marine Biology, University of California, Santa
Barbara, CA 93106, USA.
GDepartment of Chemistry, University of Texas at El Paso, El Paso, TX 79968, USA.
HCorresponding author. Email: [email protected]

S2
Number of Pages: 15
Number of Tables: 8
Number of Figures: 6
S3
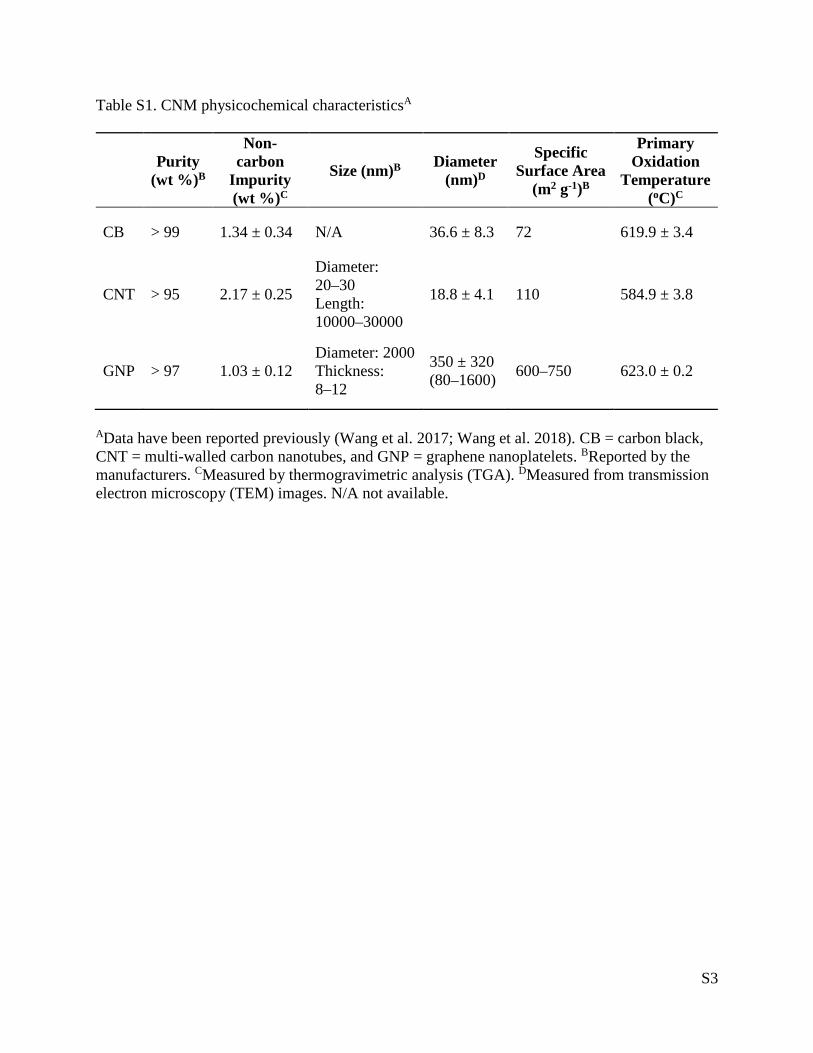
Table S1. CNM physicochemical characteristicsA
Purity (wt %)B
Non-carbon
Impurity (wt %)C
Size (nm)B Diameter (nm)D
Specific Surface Area
(m2 g-1)B
Primary Oxidation
Temperature (oC)C
CB > 99 1.34 ± 0.34 N/A 36.6 ± 8.3 72 619.9 ± 3.4
CNT > 95 2.17 ± 0.25
Diameter: 20–30 Length: 10000–30000
18.8 ± 4.1 110 584.9 ± 3.8
GNP > 97 1.03 ± 0.12 Diameter: 2000 Thickness: 8–12
350 ± 320 (80–1600) 600–750 623.0 ± 0.2
AData have been reported previously (Wang et al. 2017; Wang et al. 2018). CB = carbon black, CNT = multi-walled carbon nanotubes, and GNP = graphene nanoplatelets. BReported by the manufacturers. CMeasured by thermogravimetric analysis (TGA). DMeasured from transmission electron microscopy (TEM) images. N/A not available.
S4
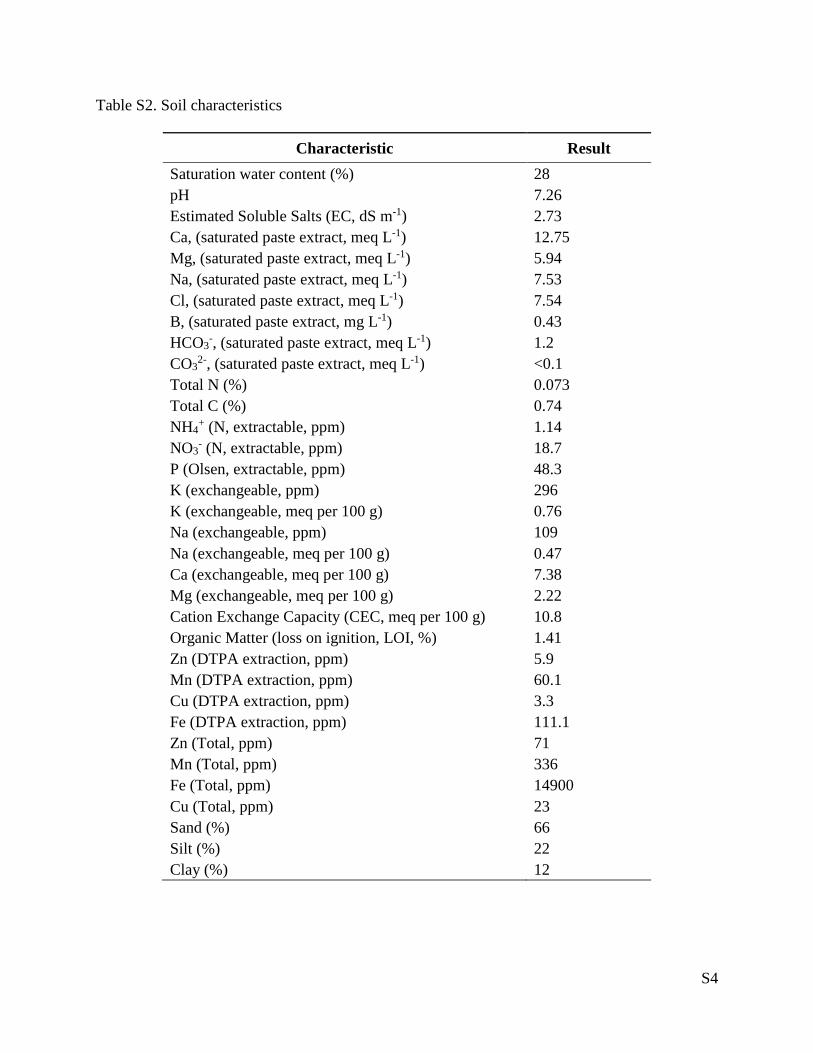
Table S2. Soil characteristics
Characteristic Result Saturation water content (%) 28 pH 7.26 Estimated Soluble Salts (EC, dS m-1) 2.73 Ca, (saturated paste extract, meq L-1) 12.75 Mg, (saturated paste extract, meq L-1) 5.94 Na, (saturated paste extract, meq L-1) 7.53 Cl, (saturated paste extract, meq L-1) 7.54 B, (saturated paste extract, mg L-1) 0.43 HCO3
-, (saturated paste extract, meq L-1) 1.2 CO3
2-, (saturated paste extract, meq L-1) <0.1 Total N (%) 0.073 Total C (%) 0.74 NH4
+ (N, extractable, ppm) 1.14 NO3
- (N, extractable, ppm) 18.7 P (Olsen, extractable, ppm) 48.3 K (exchangeable, ppm) 296 K (exchangeable, meq per 100 g) 0.76 Na (exchangeable, ppm) 109 Na (exchangeable, meq per 100 g) 0.47 Ca (exchangeable, meq per 100 g) 7.38 Mg (exchangeable, meq per 100 g) 2.22 Cation Exchange Capacity (CEC, meq per 100 g) 10.8 Organic Matter (loss on ignition, LOI, %) 1.41 Zn (DTPA extraction, ppm) 5.9 Mn (DTPA extraction, ppm) 60.1 Cu (DTPA extraction, ppm) 3.3 Fe (DTPA extraction, ppm) 111.1 Zn (Total, ppm) 71 Mn (Total, ppm) 336 Fe (Total, ppm) 14900 Cu (Total, ppm) 23 Sand (%) 66 Silt (%) 22 Clay (%) 12
S5
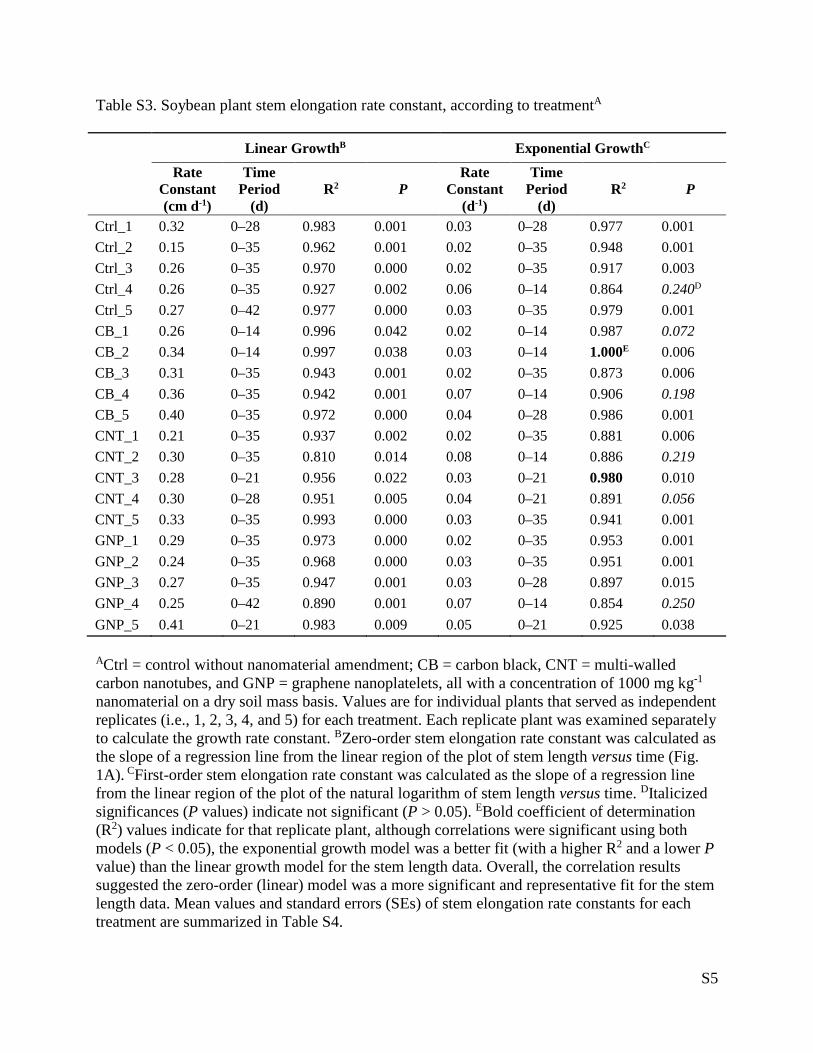
Table S3. Soybean plant stem elongation rate constant, according to treatmentA
Linear GrowthB Exponential GrowthC
Rate Constant (cm d-1)
Time Period
(d) R2 P
Rate Constant
(d-1)
Time Period
(d) R2 P
Ctrl_1 0.32 0–28 0.983 0.001 0.03 0–28 0.977 0.001 Ctrl_2 0.15 0–35 0.962 0.001 0.02 0–35 0.948 0.001 Ctrl_3 0.26 0–35 0.970 0.000 0.02 0–35 0.917 0.003 Ctrl_4 0.26 0–35 0.927 0.002 0.06 0–14 0.864 0.240D Ctrl_5 0.27 0–42 0.977 0.000 0.03 0–35 0.979 0.001 CB_1 0.26 0–14 0.996 0.042 0.02 0–14 0.987 0.072 CB_2 0.34 0–14 0.997 0.038 0.03 0–14 1.000E 0.006 CB_3 0.31 0–35 0.943 0.001 0.02 0–35 0.873 0.006 CB_4 0.36 0–35 0.942 0.001 0.07 0–14 0.906 0.198 CB_5 0.40 0–35 0.972 0.000 0.04 0–28 0.986 0.001 CNT_1 0.21 0–35 0.937 0.002 0.02 0–35 0.881 0.006 CNT_2 0.30 0–35 0.810 0.014 0.08 0–14 0.886 0.219 CNT_3 0.28 0–21 0.956 0.022 0.03 0–21 0.980 0.010 CNT_4 0.30 0–28 0.951 0.005 0.04 0–21 0.891 0.056 CNT_5 0.33 0–35 0.993 0.000 0.03 0–35 0.941 0.001 GNP_1 0.29 0–35 0.973 0.000 0.02 0–35 0.953 0.001 GNP_2 0.24 0–35 0.968 0.000 0.03 0–35 0.951 0.001 GNP_3 0.27 0–35 0.947 0.001 0.03 0–28 0.897 0.015 GNP_4 0.25 0–42 0.890 0.001 0.07 0–14 0.854 0.250 GNP_5 0.41 0–21 0.983 0.009 0.05 0–21 0.925 0.038 ACtrl = control without nanomaterial amendment; CB = carbon black, CNT = multi-walled carbon nanotubes, and GNP = graphene nanoplatelets, all with a concentration of 1000 mg kg-1 nanomaterial on a dry soil mass basis. Values are for individual plants that served as independent replicates (i.e., 1, 2, 3, 4, and 5) for each treatment. Each replicate plant was examined separately to calculate the growth rate constant. BZero-order stem elongation rate constant was calculated as the slope of a regression line from the linear region of the plot of stem length versus time (Fig. 1A). CFirst-order stem elongation rate constant was calculated as the slope of a regression line from the linear region of the plot of the natural logarithm of stem length versus time. DItalicized significances (P values) indicate not significant (P > 0.05). EBold coefficient of determination (R2) values indicate for that replicate plant, although correlations were significant using both models (P < 0.05), the exponential growth model was a better fit (with a higher R2 and a lower P value) than the linear growth model for the stem length data. Overall, the correlation results suggested the zero-order (linear) model was a more significant and representative fit for the stem length data. Mean values and standard errors (SEs) of stem elongation rate constants for each treatment are summarized in Table S4.
S6
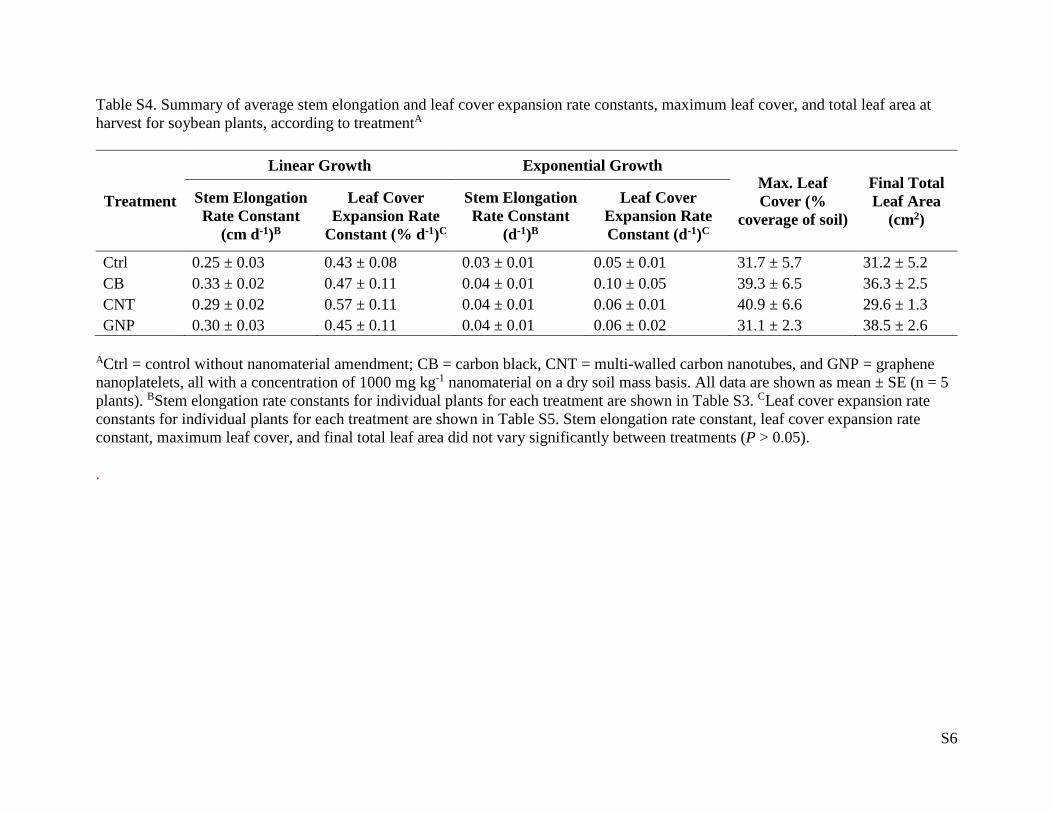
Table S4. Summary of average stem elongation and leaf cover expansion rate constants, maximum leaf cover, and total leaf area at harvest for soybean plants, according to treatmentA
Treatment
Linear Growth Exponential Growth Max. Leaf Cover (%
coverage of soil)
Final Total Leaf Area
(cm2) Stem Elongation Rate Constant
(cm d-1)B
Leaf Cover Expansion Rate
Constant (% d-1)C
Stem Elongation Rate Constant
(d-1)B
Leaf Cover Expansion Rate Constant (d-1)C
Ctrl 0.25 ± 0.03 0.43 ± 0.08 0.03 ± 0.01 0.05 ± 0.01 31.7 ± 5.7 31.2 ± 5.2 CB 0.33 ± 0.02 0.47 ± 0.11 0.04 ± 0.01 0.10 ± 0.05 39.3 ± 6.5 36.3 ± 2.5 CNT 0.29 ± 0.02 0.57 ± 0.11 0.04 ± 0.01 0.06 ± 0.01 40.9 ± 6.6 29.6 ± 1.3 GNP 0.30 ± 0.03 0.45 ± 0.11 0.04 ± 0.01 0.06 ± 0.02 31.1 ± 2.3 38.5 ± 2.6
ACtrl = control without nanomaterial amendment; CB = carbon black, CNT = multi-walled carbon nanotubes, and GNP = graphene nanoplatelets, all with a concentration of 1000 mg kg-1 nanomaterial on a dry soil mass basis. All data are shown as mean ± SE (n = 5 plants). BStem elongation rate constants for individual plants for each treatment are shown in Table S3. CLeaf cover expansion rate constants for individual plants for each treatment are shown in Table S5. Stem elongation rate constant, leaf cover expansion rate constant, maximum leaf cover, and final total leaf area did not vary significantly between treatments (P > 0.05). .
S7
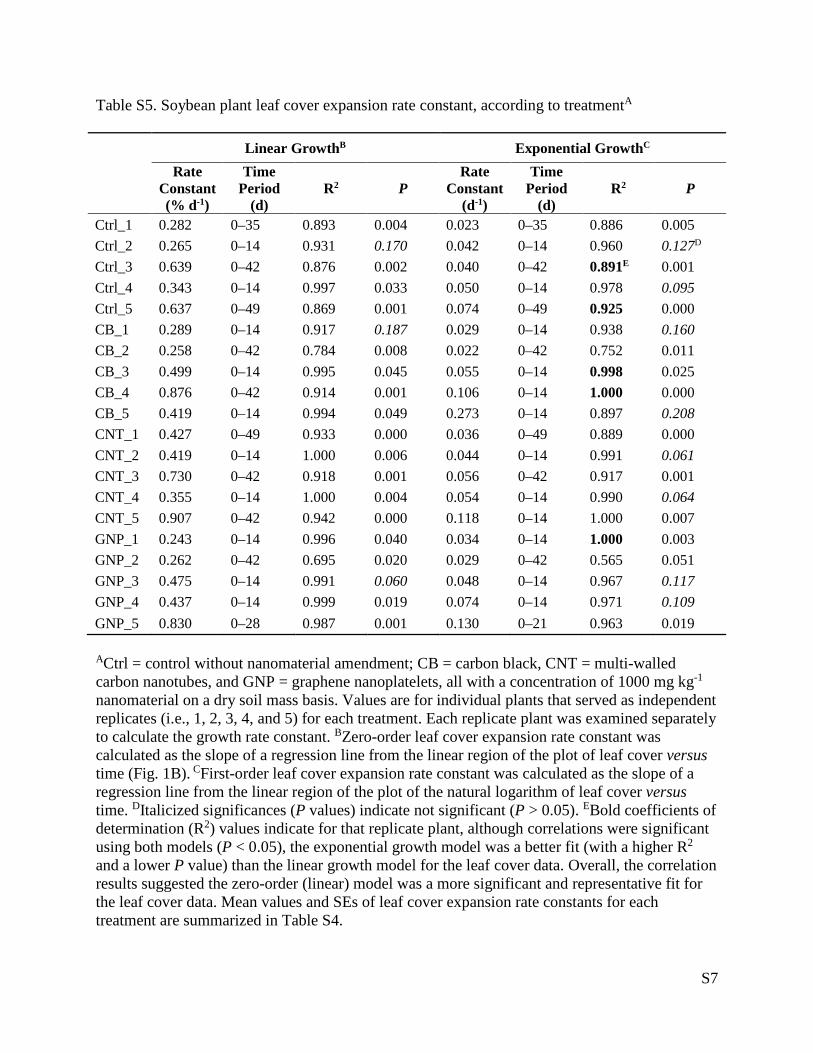
Table S5. Soybean plant leaf cover expansion rate constant, according to treatmentA
Linear GrowthB Exponential GrowthC
Rate Constant (% d-1)
Time Period
(d) R2 P
Rate Constant
(d-1)
Time Period
(d) R2 P
Ctrl_1 0.282 0–35 0.893 0.004 0.023 0–35 0.886 0.005 Ctrl_2 0.265 0–14 0.931 0.170 0.042 0–14 0.960 0.127D Ctrl_3 0.639 0–42 0.876 0.002 0.040 0–42 0.891E 0.001 Ctrl_4 0.343 0–14 0.997 0.033 0.050 0–14 0.978 0.095 Ctrl_5 0.637 0–49 0.869 0.001 0.074 0–49 0.925 0.000 CB_1 0.289 0–14 0.917 0.187 0.029 0–14 0.938 0.160 CB_2 0.258 0–42 0.784 0.008 0.022 0–42 0.752 0.011 CB_3 0.499 0–14 0.995 0.045 0.055 0–14 0.998 0.025 CB_4 0.876 0–42 0.914 0.001 0.106 0–14 1.000 0.000 CB_5 0.419 0–14 0.994 0.049 0.273 0–14 0.897 0.208 CNT_1 0.427 0–49 0.933 0.000 0.036 0–49 0.889 0.000 CNT_2 0.419 0–14 1.000 0.006 0.044 0–14 0.991 0.061 CNT_3 0.730 0–42 0.918 0.001 0.056 0–42 0.917 0.001 CNT_4 0.355 0–14 1.000 0.004 0.054 0–14 0.990 0.064 CNT_5 0.907 0–42 0.942 0.000 0.118 0–14 1.000 0.007 GNP_1 0.243 0–14 0.996 0.040 0.034 0–14 1.000 0.003 GNP_2 0.262 0–42 0.695 0.020 0.029 0–42 0.565 0.051 GNP_3 0.475 0–14 0.991 0.060 0.048 0–14 0.967 0.117 GNP_4 0.437 0–14 0.999 0.019 0.074 0–14 0.971 0.109 GNP_5 0.830 0–28 0.987 0.001 0.130 0–21 0.963 0.019 ACtrl = control without nanomaterial amendment; CB = carbon black, CNT = multi-walled carbon nanotubes, and GNP = graphene nanoplatelets, all with a concentration of 1000 mg kg-1 nanomaterial on a dry soil mass basis. Values are for individual plants that served as independent replicates (i.e., 1, 2, 3, 4, and 5) for each treatment. Each replicate plant was examined separately to calculate the growth rate constant. BZero-order leaf cover expansion rate constant was calculated as the slope of a regression line from the linear region of the plot of leaf cover versus time (Fig. 1B). CFirst-order leaf cover expansion rate constant was calculated as the slope of a regression line from the linear region of the plot of the natural logarithm of leaf cover versus time. DItalicized significances (P values) indicate not significant (P > 0.05). EBold coefficients of determination (R2) values indicate for that replicate plant, although correlations were significant using both models (P < 0.05), the exponential growth model was a better fit (with a higher R2 and a lower P value) than the linear growth model for the leaf cover data. Overall, the correlation results suggested the zero-order (linear) model was a more significant and representative fit for the leaf cover data. Mean values and SEs of leaf cover expansion rate constants for each treatment are summarized in Table S4.
S8
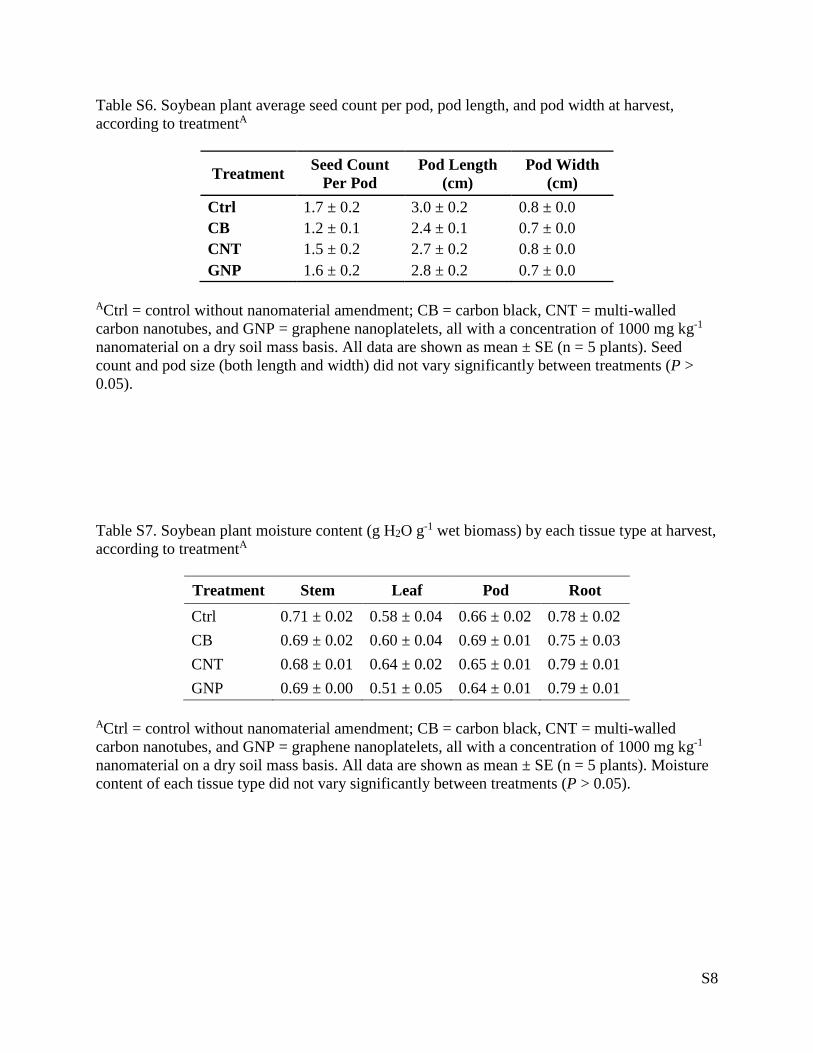
Table S6. Soybean plant average seed count per pod, pod length, and pod width at harvest, according to treatmentA
Treatment Seed Count Per Pod
Pod Length (cm)
Pod Width (cm)
Ctrl 1.7 ± 0.2 3.0 ± 0.2 0.8 ± 0.0 CB 1.2 ± 0.1 2.4 ± 0.1 0.7 ± 0.0 CNT 1.5 ± 0.2 2.7 ± 0.2 0.8 ± 0.0 GNP 1.6 ± 0.2 2.8 ± 0.2 0.7 ± 0.0
ACtrl = control without nanomaterial amendment; CB = carbon black, CNT = multi-walled carbon nanotubes, and GNP = graphene nanoplatelets, all with a concentration of 1000 mg kg-1 nanomaterial on a dry soil mass basis. All data are shown as mean ± SE (n = 5 plants). Seed count and pod size (both length and width) did not vary significantly between treatments (P > 0.05). Table S7. Soybean plant moisture content (g H2O g-1 wet biomass) by each tissue type at harvest, according to treatmentA
Treatment Stem Leaf Pod Root Ctrl 0.71 ± 0.02 0.58 ± 0.04 0.66 ± 0.02 0.78 ± 0.02 CB 0.69 ± 0.02 0.60 ± 0.04 0.69 ± 0.01 0.75 ± 0.03 CNT 0.68 ± 0.01 0.64 ± 0.02 0.65 ± 0.01 0.79 ± 0.01 GNP 0.69 ± 0.00 0.51 ± 0.05 0.64 ± 0.01 0.79 ± 0.01
ACtrl = control without nanomaterial amendment; CB = carbon black, CNT = multi-walled carbon nanotubes, and GNP = graphene nanoplatelets, all with a concentration of 1000 mg kg-1 nanomaterial on a dry soil mass basis. All data are shown as mean ± SE (n = 5 plants). Moisture content of each tissue type did not vary significantly between treatments (P > 0.05).
S9
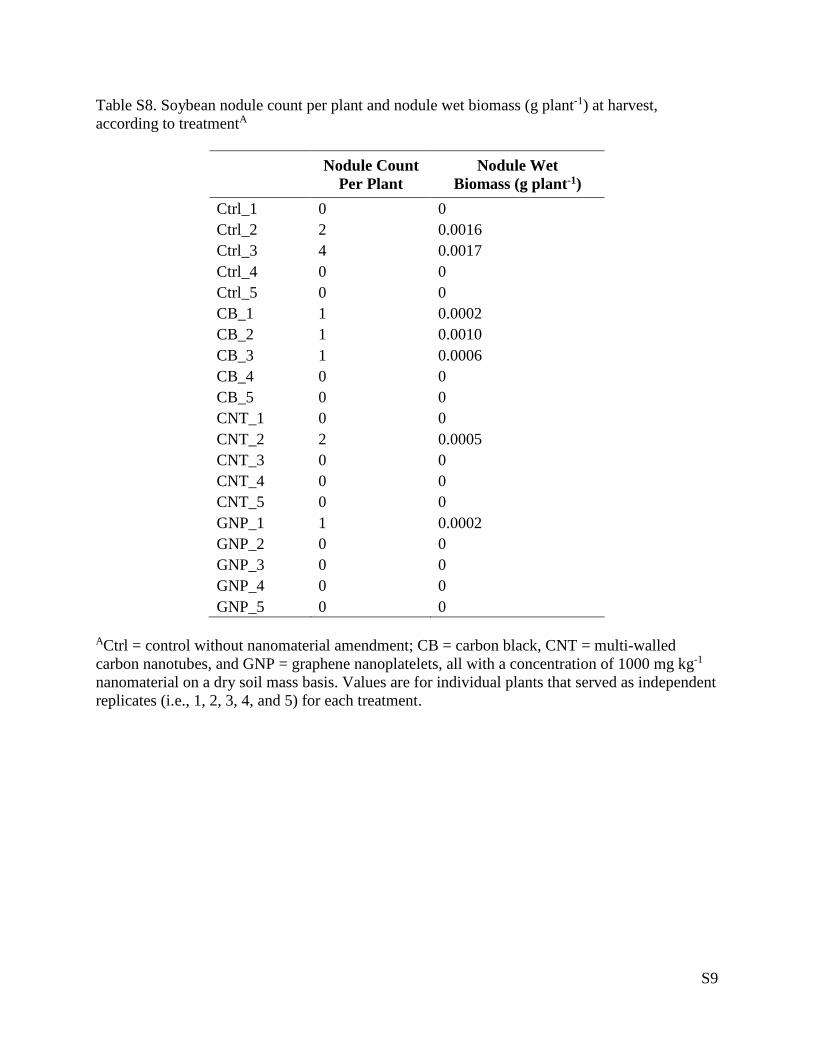
Table S8. Soybean nodule count per plant and nodule wet biomass (g plant-1) at harvest, according to treatmentA
Nodule Count Per Plant
Nodule Wet Biomass (g plant-1)
Ctrl_1 0 0 Ctrl_2 2 0.0016 Ctrl_3 4 0.0017 Ctrl_4 0 0 Ctrl_5 0 0 CB_1 1 0.0002 CB_2 1 0.0010 CB_3 1 0.0006 CB_4 0 0 CB_5 0 0 CNT_1 0 0 CNT_2 2 0.0005 CNT_3 0 0 CNT_4 0 0 CNT_5 0 0 GNP_1 1 0.0002 GNP_2 0 0 GNP_3 0 0 GNP_4 0 0 GNP_5 0 0
ACtrl = control without nanomaterial amendment; CB = carbon black, CNT = multi-walled carbon nanotubes, and GNP = graphene nanoplatelets, all with a concentration of 1000 mg kg-1 nanomaterial on a dry soil mass basis. Values are for individual plants that served as independent replicates (i.e., 1, 2, 3, 4, and 5) for each treatment.
S10
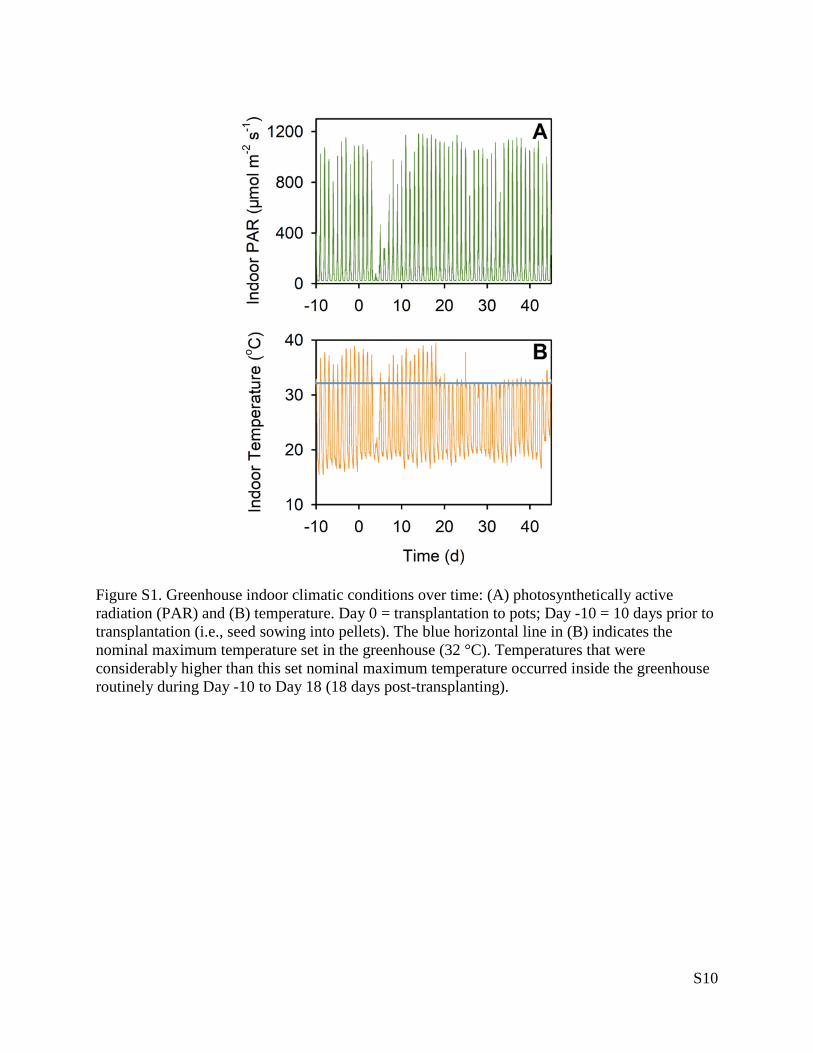
Figure S1. Greenhouse indoor climatic conditions over time: (A) photosynthetically active radiation (PAR) and (B) temperature. Day 0 = transplantation to pots; Day -10 = 10 days prior to transplantation (i.e., seed sowing into pellets). The blue horizontal line in (B) indicates the nominal maximum temperature set in the greenhouse (32 °C). Temperatures that were considerably higher than this set nominal maximum temperature occurred inside the greenhouse routinely during Day -10 to Day 18 (18 days post-transplanting).
S11
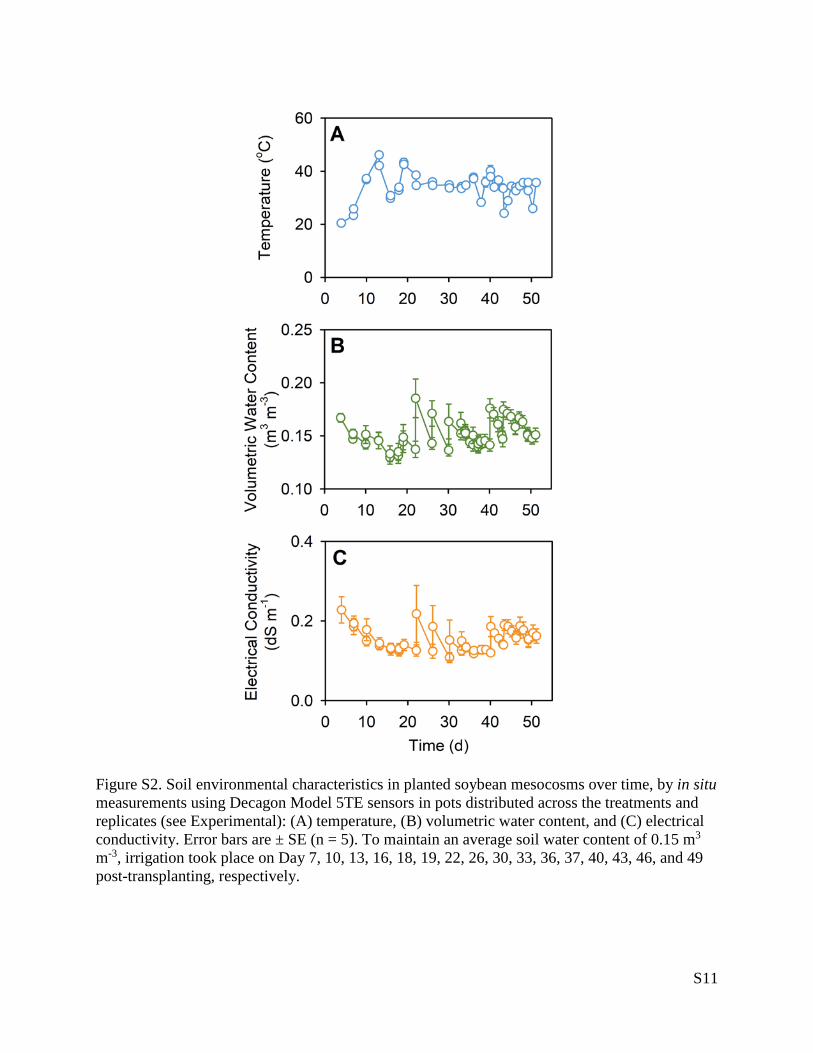
Figure S2. Soil environmental characteristics in planted soybean mesocosms over time, by in situ measurements using Decagon Model 5TE sensors in pots distributed across the treatments and replicates (see Experimental): (A) temperature, (B) volumetric water content, and (C) electrical conductivity. Error bars are ± SE (n = 5). To maintain an average soil water content of 0.15 m3 m-3, irrigation took place on Day 7, 10, 13, 16, 18, 19, 22, 26, 30, 33, 36, 37, 40, 43, 46, and 49 post-transplanting, respectively.
S12
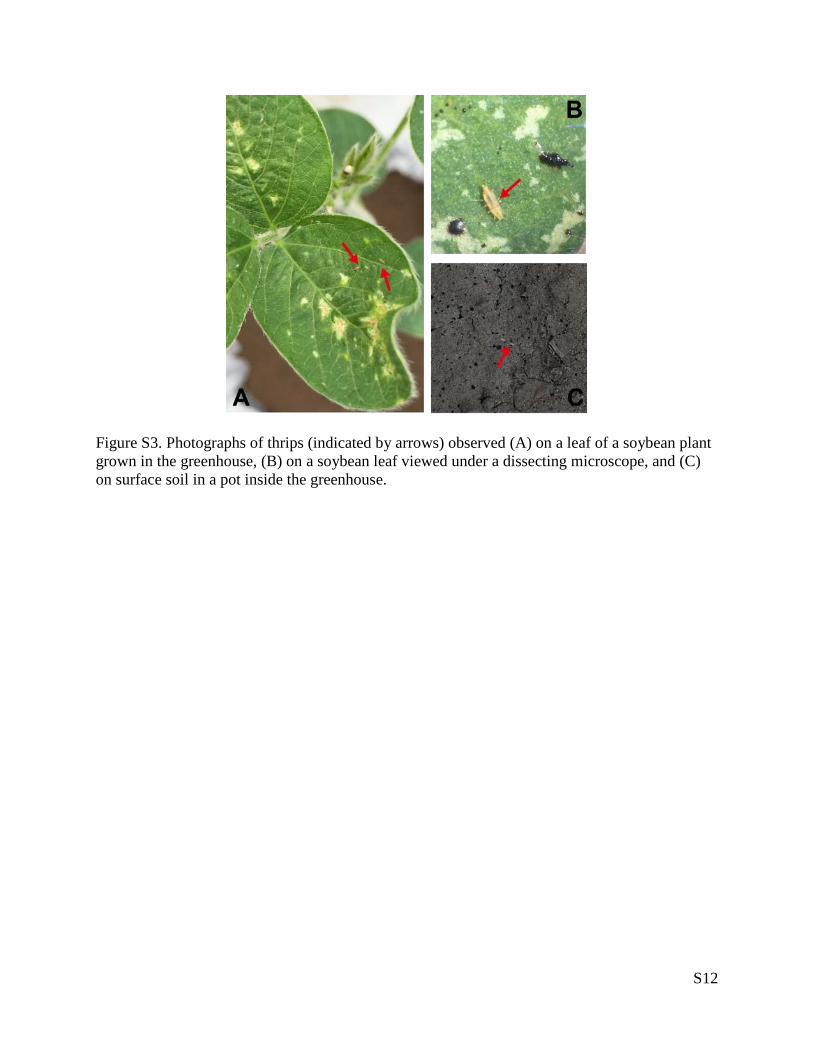
Figure S3. Photographs of thrips (indicated by arrows) observed (A) on a leaf of a soybean plant grown in the greenhouse, (B) on a soybean leaf viewed under a dissecting microscope, and (C) on surface soil in a pot inside the greenhouse.
S13
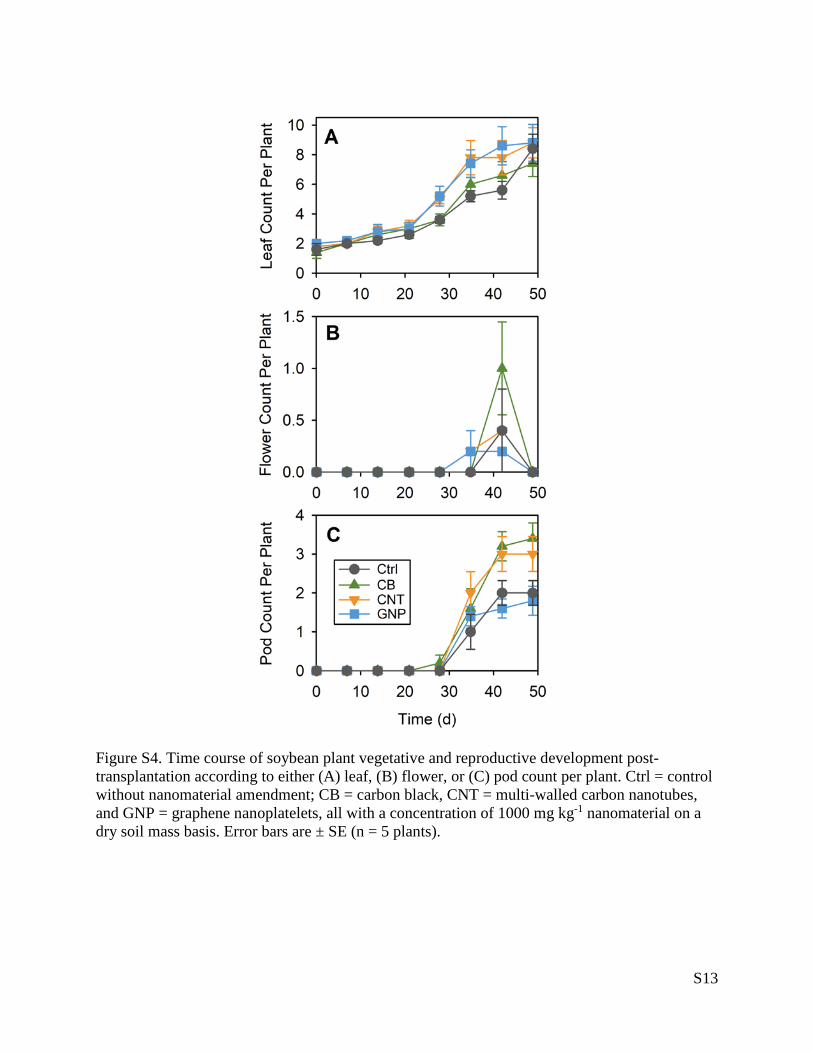
Figure S4. Time course of soybean plant vegetative and reproductive development post-transplantation according to either (A) leaf, (B) flower, or (C) pod count per plant. Ctrl = control without nanomaterial amendment; CB = carbon black, CNT = multi-walled carbon nanotubes, and GNP = graphene nanoplatelets, all with a concentration of 1000 mg kg-1 nanomaterial on a dry soil mass basis. Error bars are ± SE (n = 5 plants).
S14
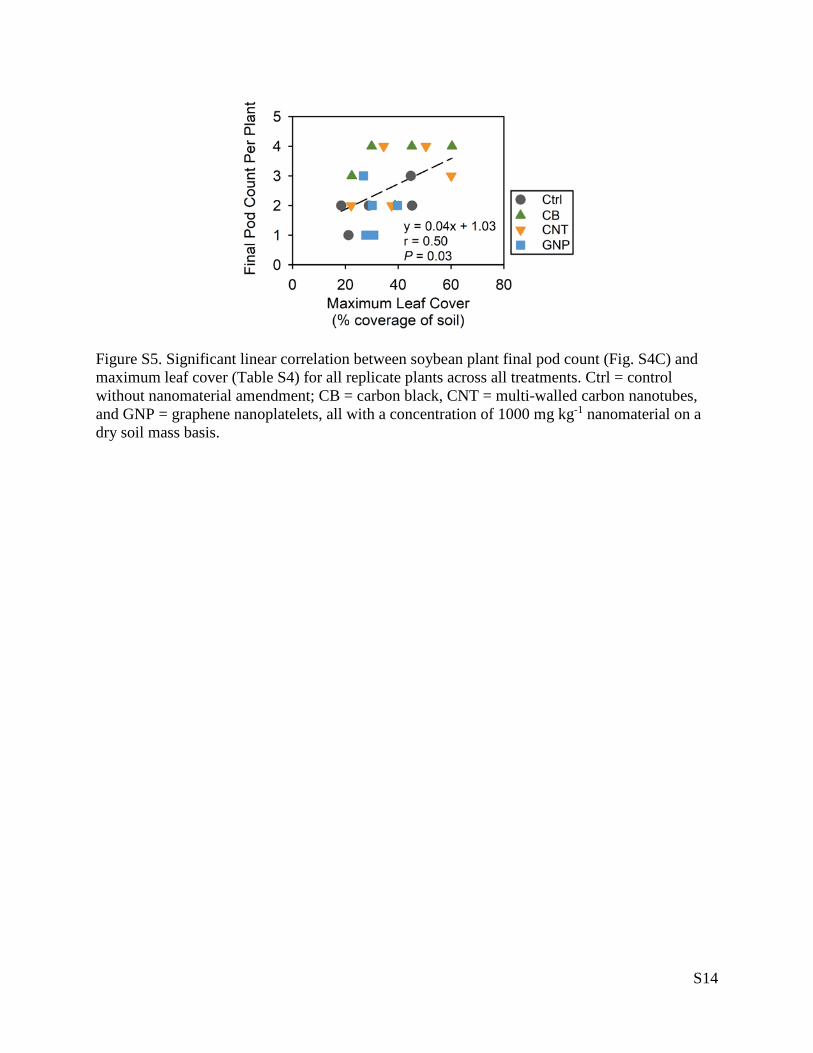
Figure S5. Significant linear correlation between soybean plant final pod count (Fig. S4C) and maximum leaf cover (Table S4) for all replicate plants across all treatments. Ctrl = control without nanomaterial amendment; CB = carbon black, CNT = multi-walled carbon nanotubes, and GNP = graphene nanoplatelets, all with a concentration of 1000 mg kg-1 nanomaterial on a dry soil mass basis.
S15
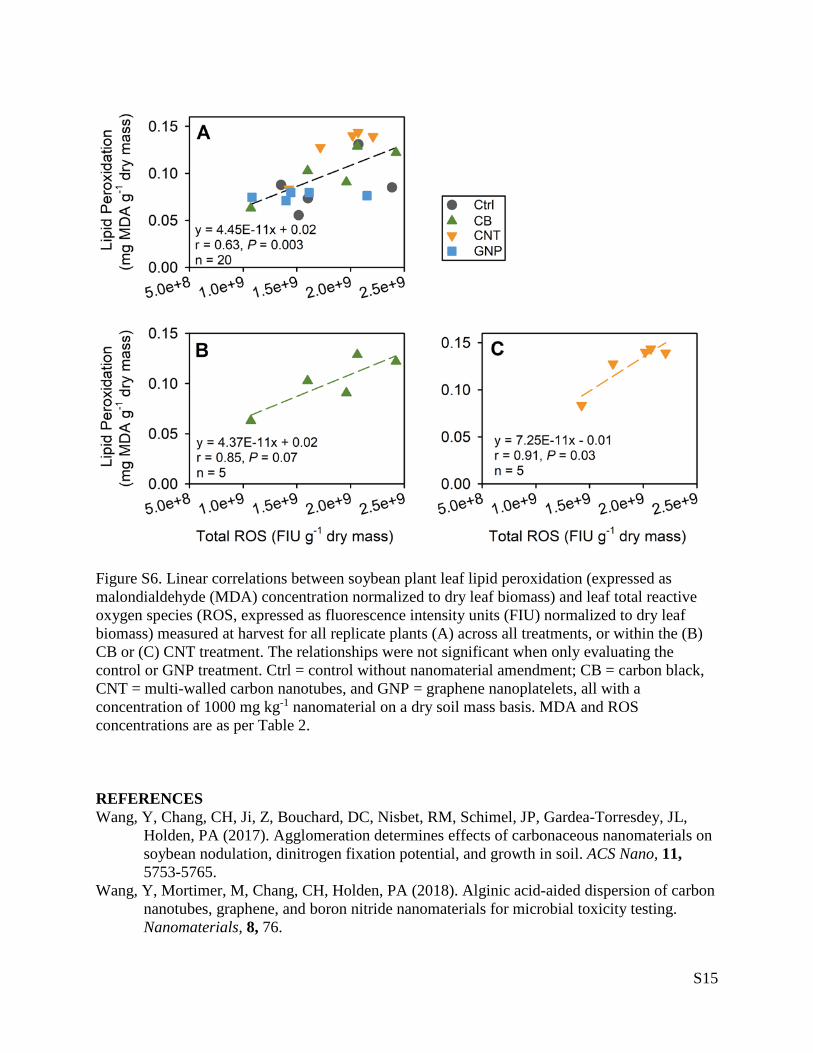
Figure S6. Linear correlations between soybean plant leaf lipid peroxidation (expressed as malondialdehyde (MDA) concentration normalized to dry leaf biomass) and leaf total reactive oxygen species (ROS, expressed as fluorescence intensity units (FIU) normalized to dry leaf biomass) measured at harvest for all replicate plants (A) across all treatments, or within the (B) CB or (C) CNT treatment. The relationships were not significant when only evaluating the control or GNP treatment. Ctrl = control without nanomaterial amendment; CB = carbon black, CNT = multi-walled carbon nanotubes, and GNP = graphene nanoplatelets, all with a concentration of 1000 mg kg-1 nanomaterial on a dry soil mass basis. MDA and ROS concentrations are as per Table 2. REFERENCES Wang, Y, Chang, CH, Ji, Z, Bouchard, DC, Nisbet, RM, Schimel, JP, Gardea-Torresdey, JL,
Holden, PA (2017). Agglomeration determines effects of carbonaceous nanomaterials on soybean nodulation, dinitrogen fixation potential, and growth in soil. ACS Nano, 11, 5753-5765.
Wang, Y, Mortimer, M, Chang, CH, Holden, PA (2018). Alginic acid-aided dispersion of carbon nanotubes, graphene, and boron nitride nanomaterials for microbial toxicity testing. Nanomaterials, 8, 76.