Embed Size (px)
Citation preview
Supplementary Material (ESI) for Chemical Communications This journal is (c) The Royal Society of Chemistry 2017
1
Modification of Ga2O3 by Ag−Cr Core−shell Cocatalyst Enhances
Photocatalytic CO Evolution for the Conversion of CO2 by H2O
Rui Pang,a Kentaro Teramura,*a, b Hiroyuki Tatsumi,a Hiroyuki Asakura,a, b Saburo Hosokawa,a, b
and Tsunehiro Tanaka*a, b
a Department of Molecular Engineering, Graduate School of Engineering, Kyoto University,
Kyoto 615−8510, Japanb Elements Strategy Initiative for Catalysts & Batteries (ESICB), Kyoto University, 1−30
Goryo−Ohara, Nishikyo−ku, Kyoto 615−8245, Japan
Experimental Section
Preparation of Ag−Cr/Ga2O3
Ag−Cr/Ga2O3 was prepared by a facile simultaneously photodeposition method.1, 2 Generally,
1.0 g of Ga2O3 (Kojundo, 99.99%) powder was dispersed in 1.0 L of ultra−pure water containing
a required amount of AgNO3 and Cr(NO3)3, and the dissolved air in the solution was completely
degassed by a flow of Ar gas. The suspension was irradiated under a 400 W high−pressure Hg
lamp with Ar gas flowing for 1.0 h, followed by filtration and drying at room temperature. The
amount of Ag and Cr was the molar ratio of Ag/Ga and Cr/Ga.
1. K. Maeda, D. Lu, K. Teramura and K. Domen, J. Mater. Chem., 2008, 18, 3539−3542.2. K. Maeda, D. Lu, K. Teramura and K. Domen, Energ. Environ. Sci., 2010, 3, 470−477.
Characterization
The as−prepared Ag−Cr/Ga2O3 was studied by X−ray diffractometry (XRD, Rigaku Multiflex)
with Cu Kα radiation (λ = 0.154 nm), field−emission scanning electron microscopy (FE−SEM,
SU−8220, Hitachi High Technologies), transmission electron microscopy (TEM, JEM−2100F),
X−ray photoelectron spectroscopy (XPS, Shimadzu, ESCA 3400, Mg Kα), and X−ray absorption
fine structure (XAFS) at the Ag K−edge and Cr K−edge (beam line BL01B1 of SPring−8).
Electronic Supplementary Material (ESI) for ChemComm.This journal is © The Royal Society of Chemistry 2017
Supplementary Material (ESI) for Chemical Communications This journal is (c) The Royal Society of Chemistry 2017
2
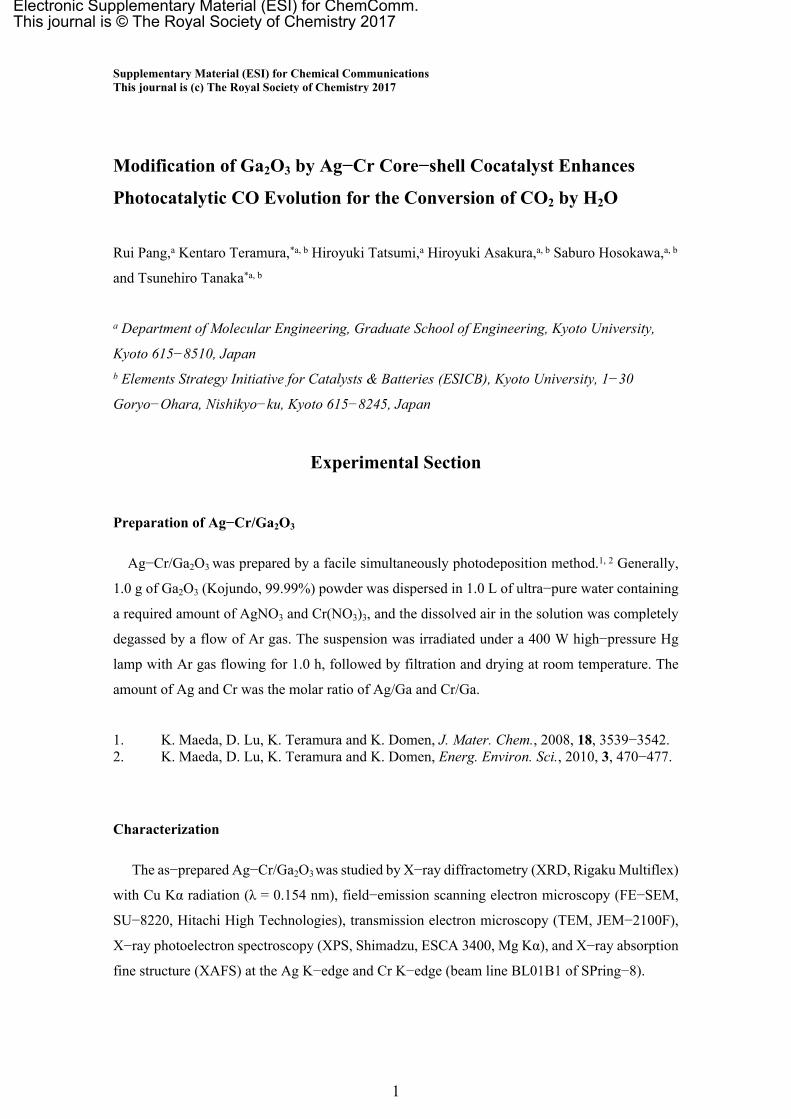
Photocatalytic reaction
The photocatalytic reduction of CO2 was carried out using a flow system with an
inner−irradiation−type reaction vessel at ambient pressure. First, the synthesized photocatalyst
(0.5 g) was dispersed in ultrapure water (1.0 L) containing 0.1 M NaHCO3. Second, CO2 was
bubbled into the solution at a flow rate of 30 mL min−1. Third, the suspension was illuminated
using a 400 W high−pressure mercury lamp with a quartz filter connected to a water cooling
system. The amounts of evolved H2 and O2 were detected using a thermal conductivity detector–
gas chromatography system (TCD−GC, Shimadzu Corp; MS−5A column, Ar carrier). The
amount of evolved CO was analyzed by a flame ionization detector–GC with a methanizer
(FID−GC, ShinCarbon ST column, N2 carrier), the reactor set−up is shown in Figure S1.
In the backward reaction, the processes were almost the same as those of the photocatalytic
reduction of CO2, except that the CO, O2 and diluent gas Ar were bubbled into the ultrapure water
solution with a total flow rate of 30 mL min−1, and the amount of evolved CO2 was analyzed by
a FID−GC.
Fig. S1 Reactor set−up for the photocatalytic reduction of CO2 under UV light irradiation
Supplementary Material (ESI) for Chemical Communications This journal is (c) The Royal Society of Chemistry 2017
3
Supplementary Figures and Table500
400
300
200
100
0Form
atio
n ra
te o
f pro
duct
s / µ
mol
h¯1
Ag Ag-Pt Ag-Pd Ag-Ni Ag-Cu Ag-Cr
100
80
60
40
20
0
Sele
ctiv
ity to
war
d C
O e
volu
tion
(%)
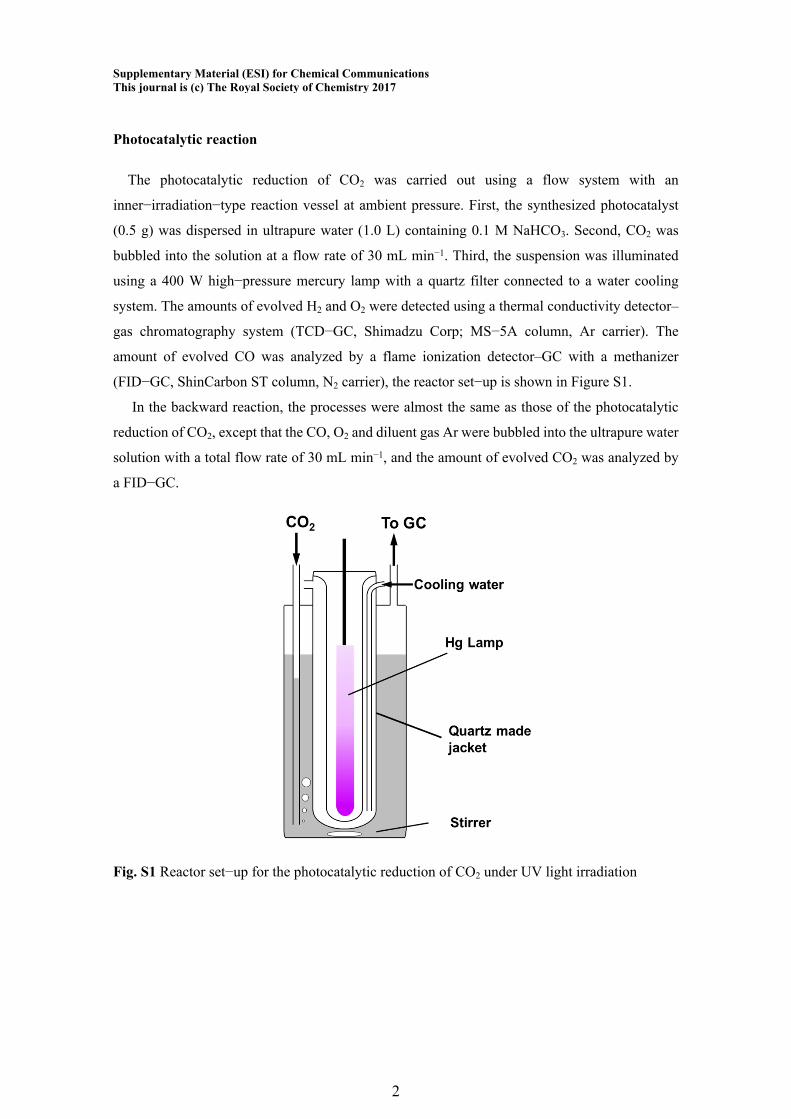
Fig. S2 Formation rate of H2 (blue), O2 (green), CO (red), and selectivity toward CO (black
diamond) evolution for the photocatalytic conversion of CO2 in water over Ag/Ga2O3 and
Ag−metals/Ga2O3 photocatalysts. Photocatalyst powder: 0.5 g, reaction solution volume: 1.0 L,
additive: 0.1 M NaHCO3, Ag loading amount: 1.0 mol% (Ag/Ga), metals loading amount: 1.0
mol% (metals/Ga), modification method: simultaneously photodeposition (SPD) method, CO2
flow rate: 30 mL min−1, light source: 400 W high−pressure Hg lamp.
Supplementary Material (ESI) for Chemical Communications This journal is (c) The Royal Society of Chemistry 2017
4
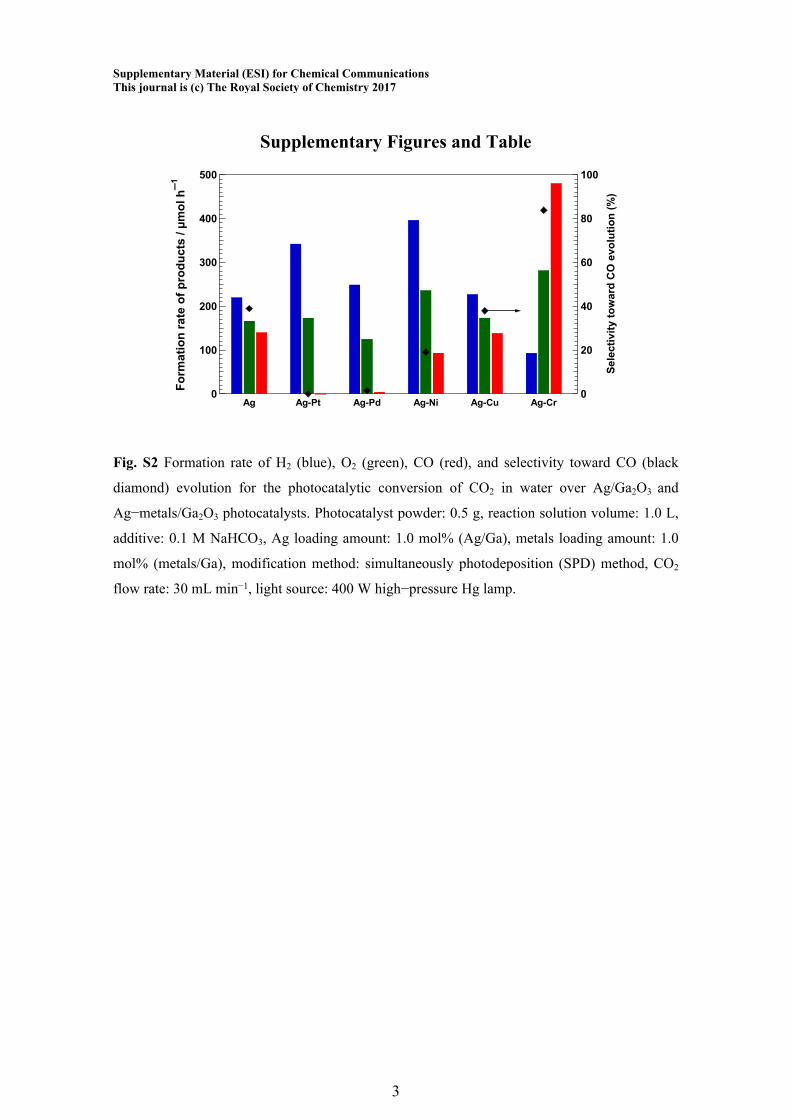
Fig. S3 Amounts of H2 (blue triangle), O2 (green square), and CO (red circle) from controlled
experiments for the photocatalytic conversion of CO2 in water using the Ag−Cr/Ga2O3
photocatalyst. (a) dark condition; (b) no photocatalyst; (c) no additive; (d) with Ar gas flow; (e)
typical condition. Photocatalyst powder: 0.5 g, reaction solution volume: 1.0 L, additive: 0.1 M
NaHCO3, Ag loading amount: 1.0 mol%, Cr loading amount: 1.0 mol%, CO2 flow rate: 30 mL
min−1, light source: 400 W high−pressure Hg lamp.
Supplementary Material (ESI) for Chemical Communications This journal is (c) The Royal Society of Chemistry 2017
5
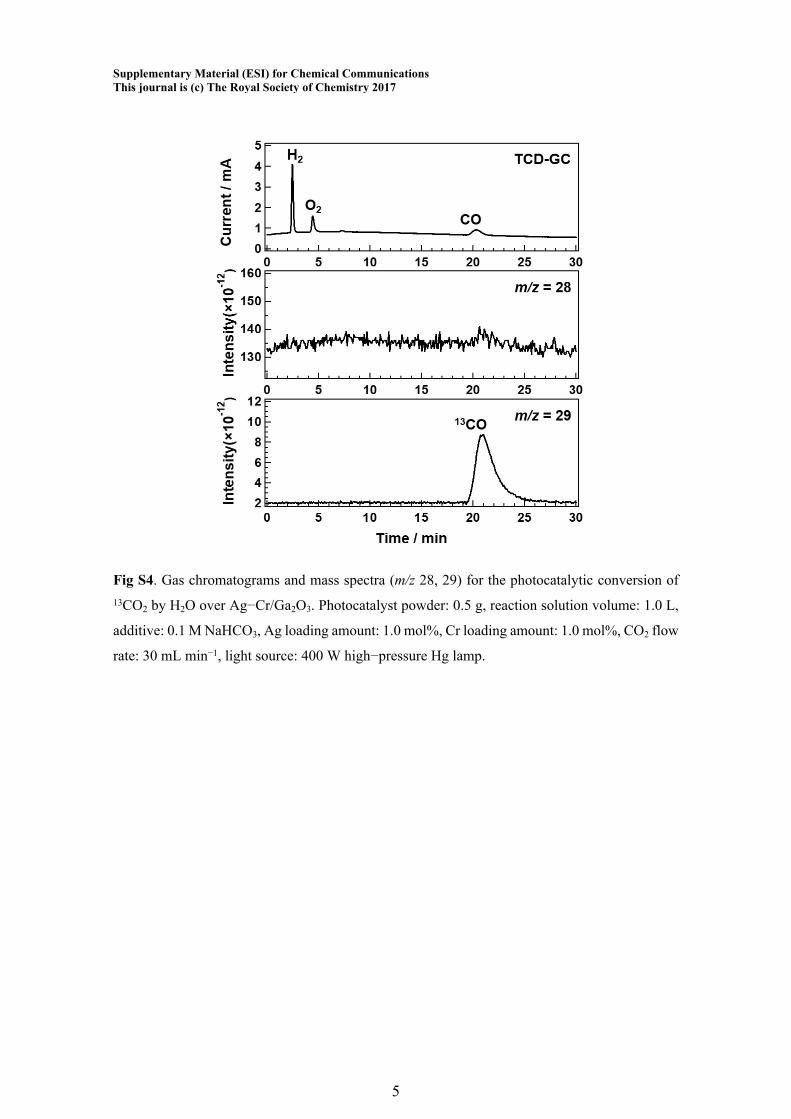
Fig S4. Gas chromatograms and mass spectra (m/z 28, 29) for the photocatalytic conversion of 13CO2 by H2O over Ag−Cr/Ga2O3. Photocatalyst powder: 0.5 g, reaction solution volume: 1.0 L,
additive: 0.1 M NaHCO3, Ag loading amount: 1.0 mol%, Cr loading amount: 1.0 mol%, CO2 flow
rate: 30 mL min−1, light source: 400 W high−pressure Hg lamp.
Supplementary Material (ESI) for Chemical Communications This journal is (c) The Royal Society of Chemistry 2017
6
900
800
700
600
500
400
300
200
100
0
Am
ount
of p
rodu
cts
/ µm
ol
1.51.00.50.0 Photoirradiation time / h
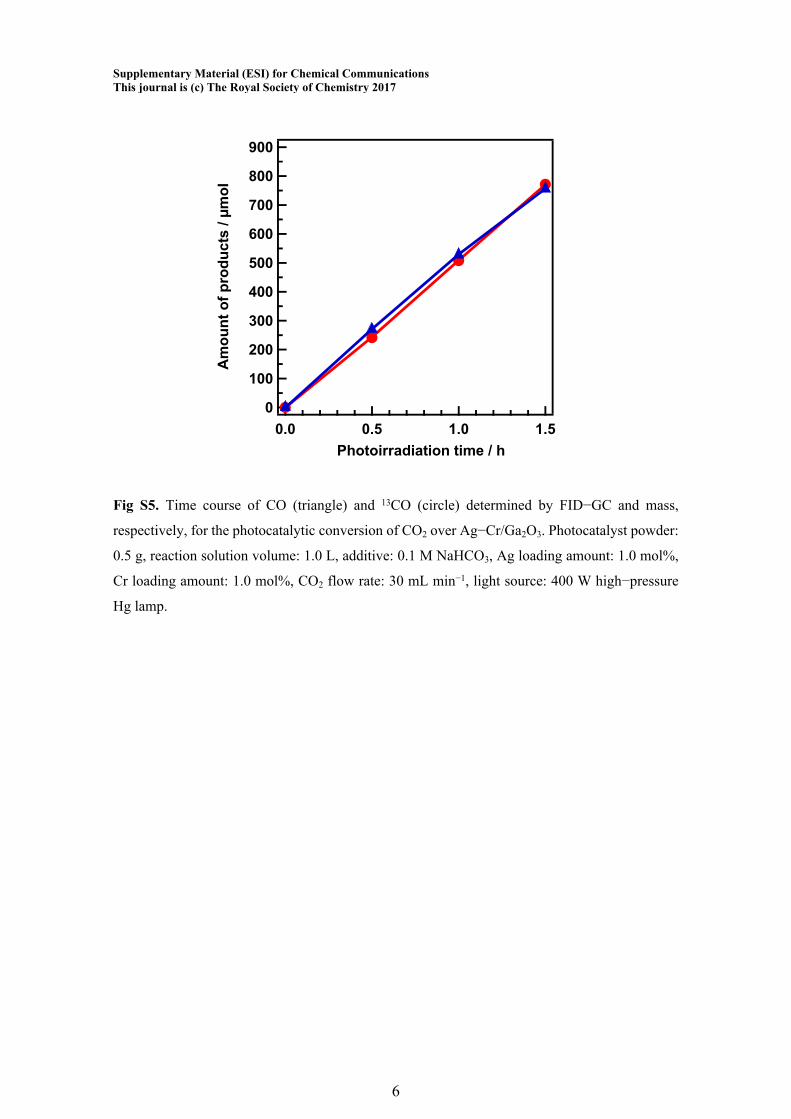
Fig S5. Time course of CO (triangle) and 13CO (circle) determined by FID−GC and mass,
respectively, for the photocatalytic conversion of CO2 over Ag−Cr/Ga2O3. Photocatalyst powder:
0.5 g, reaction solution volume: 1.0 L, additive: 0.1 M NaHCO3, Ag loading amount: 1.0 mol%,
Cr loading amount: 1.0 mol%, CO2 flow rate: 30 mL min−1, light source: 400 W high−pressure
Hg lamp.
Supplementary Material (ESI) for Chemical Communications This journal is (c) The Royal Society of Chemistry 2017
7
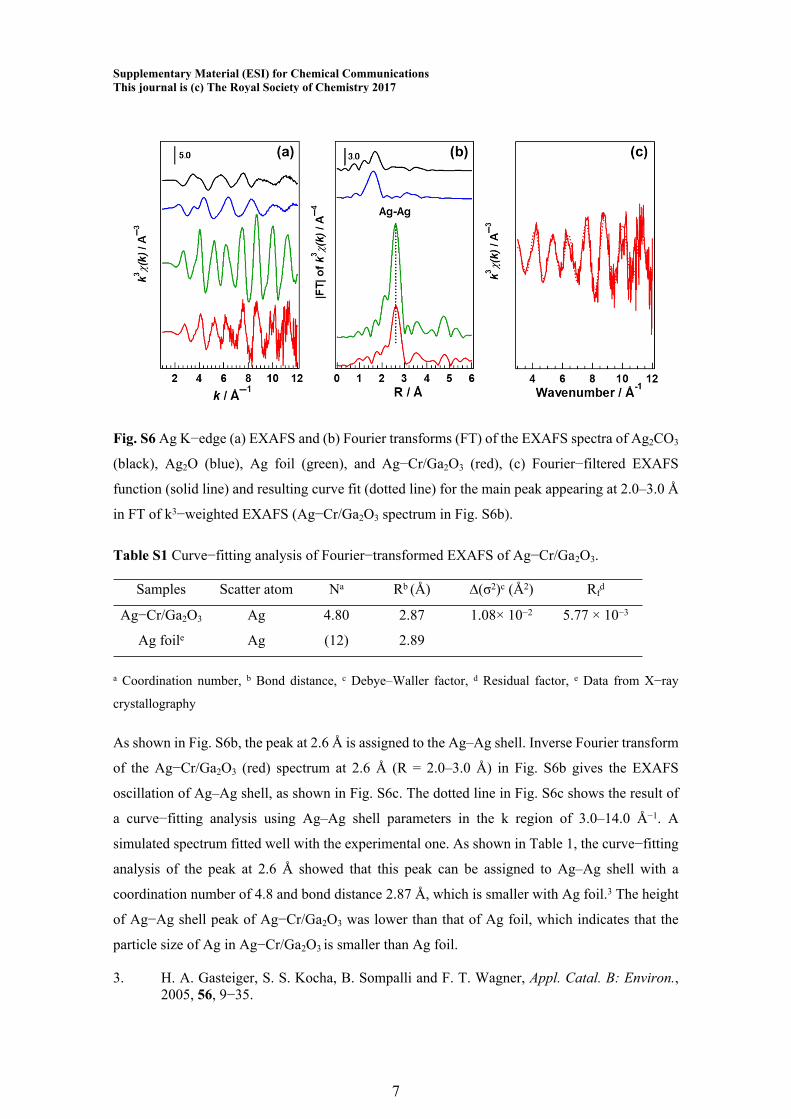
Fig. S6 Ag K−edge (a) EXAFS and (b) Fourier transforms (FT) of the EXAFS spectra of Ag2CO3
(black), Ag2O (blue), Ag foil (green), and Ag−Cr/Ga2O3 (red), (c) Fourier−filtered EXAFS
function (solid line) and resulting curve fit (dotted line) for the main peak appearing at 2.0–3.0 Å
in FT of k3−weighted EXAFS (Ag−Cr/Ga2O3 spectrum in Fig. S6b).
Table S1 Curve−fitting analysis of Fourier−transformed EXAFS of Ag−Cr/Ga2O3.
Samples Scatter atom Na Rb (Å) ∆(σ2)c (Å2) Rfd
Ag−Cr/Ga2O3 Ag 4.80 2.87 1.08× 10⁻² 5.77 × 10⁻³
Ag foile Ag (12) 2.89
a Coordination number, b Bond distance, c Debye–Waller factor, d Residual factor, e Data from X−ray
crystallography
As shown in Fig. S6b, the peak at 2.6 Å is assigned to the Ag–Ag shell. Inverse Fourier transform
of the Ag−Cr/Ga2O3 (red) spectrum at 2.6 Å (R = 2.0–3.0 Å) in Fig. S6b gives the EXAFS
oscillation of Ag–Ag shell, as shown in Fig. S6c. The dotted line in Fig. S6c shows the result of
a curve−fitting analysis using Ag–Ag shell parameters in the k region of 3.0–14.0 Å−1. A
simulated spectrum fitted well with the experimental one. As shown in Table 1, the curve−fitting
analysis of the peak at 2.6 Å showed that this peak can be assigned to Ag–Ag shell with a
coordination number of 4.8 and bond distance 2.87 Å, which is smaller with Ag foil.3 The height
of Ag−Ag shell peak of Ag−Cr/Ga2O3 was lower than that of Ag foil, which indicates that the
particle size of Ag in Ag−Cr/Ga2O3 is smaller than Ag foil.
3. H. A. Gasteiger, S. S. Kocha, B. Sompalli and F. T. Wagner, Appl. Catal. B: Environ., 2005, 56, 9−35.
Supplementary Material (ESI) for Chemical Communications This journal is (c) The Royal Society of Chemistry 2017
8
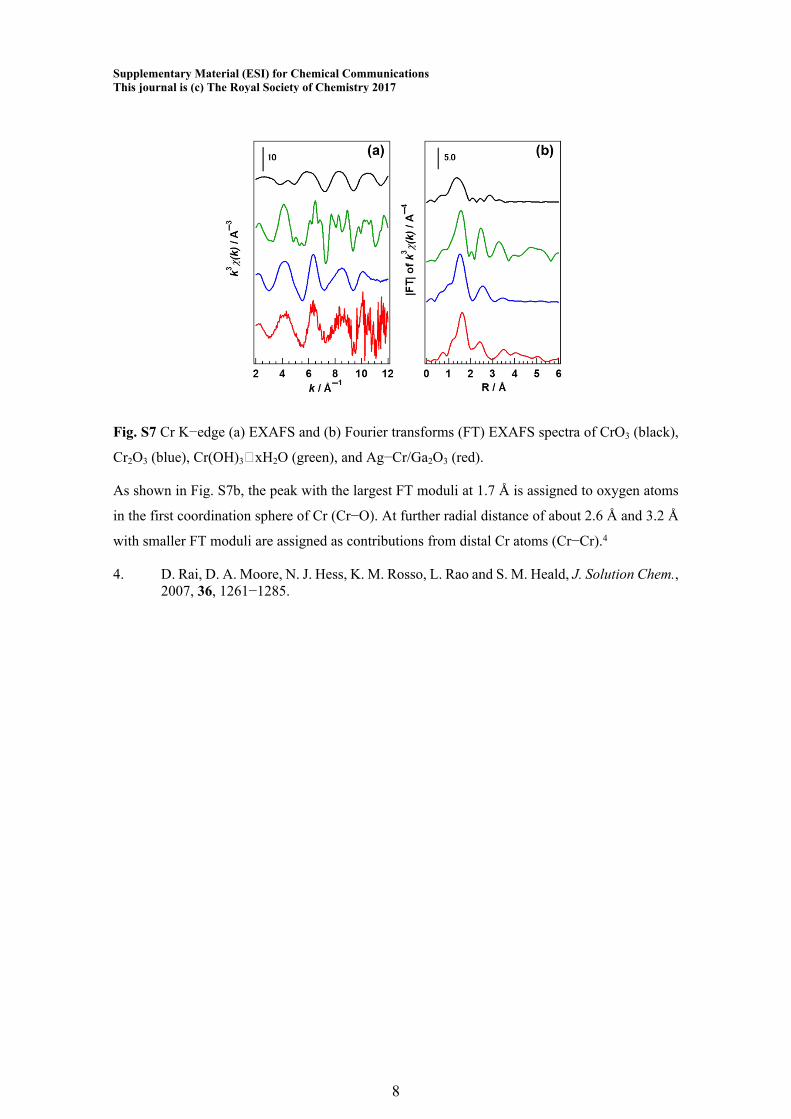
Fig. S7 Cr K−edge (a) EXAFS and (b) Fourier transforms (FT) EXAFS spectra of CrO3 (black),
Cr2O3 (blue), Cr(OH)3⸳xH2O (green), and Ag−Cr/Ga2O3 (red).
As shown in Fig. S7b, the peak with the largest FT moduli at 1.7 Å is assigned to oxygen atoms
in the first coordination sphere of Cr (Cr−O). At further radial distance of about 2.6 Å and 3.2 Å
with smaller FT moduli are assigned as contributions from distal Cr atoms (Cr−Cr).4
4. D. Rai, D. A. Moore, N. J. Hess, K. M. Rosso, L. Rao and S. M. Heald, J. Solution Chem., 2007, 36, 1261−1285.
Supplementary Material (ESI) for Chemical Communications This journal is (c) The Royal Society of Chemistry 2017
9
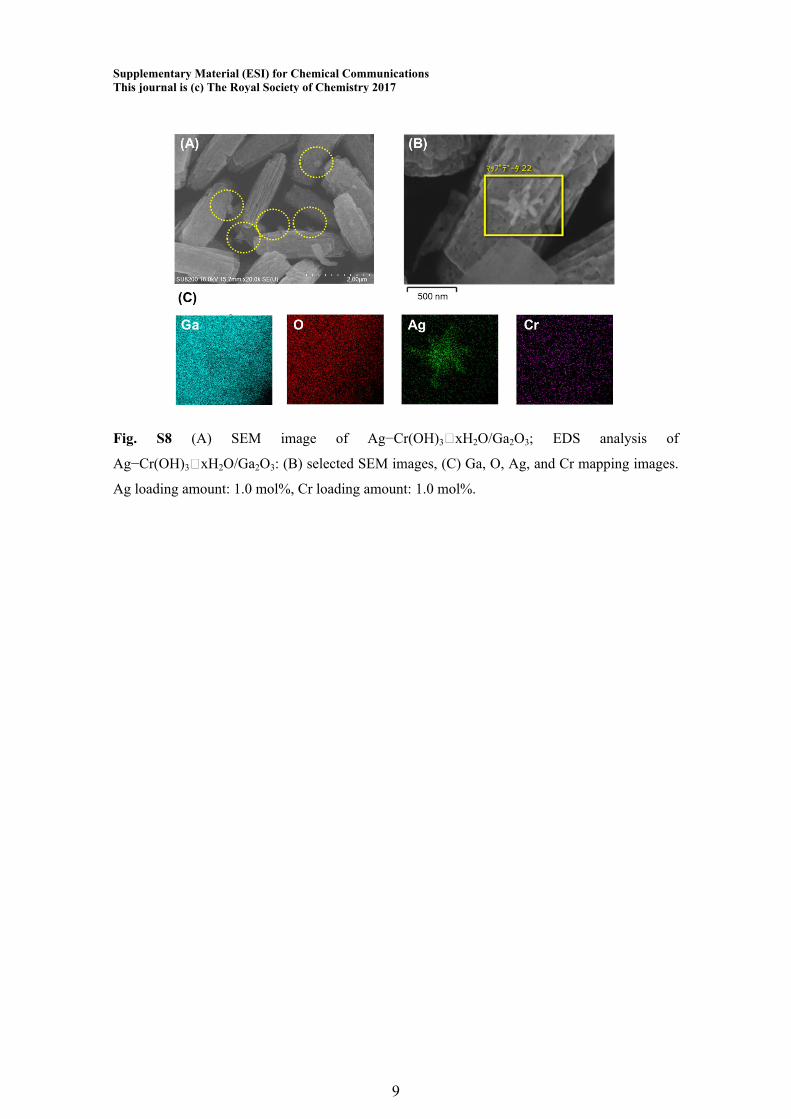
Fig. S8 (A) SEM image of Ag−Cr(OH)3⸳xH2O/Ga2O3; EDS analysis of
Ag−Cr(OH)3⸳xH2O/Ga2O3: (B) selected SEM images, (C) Ga, O, Ag, and Cr mapping images.
Ag loading amount: 1.0 mol%, Cr loading amount: 1.0 mol%.
Supplementary Material (ESI) for Chemical Communications This journal is (c) The Royal Society of Chemistry 2017
10
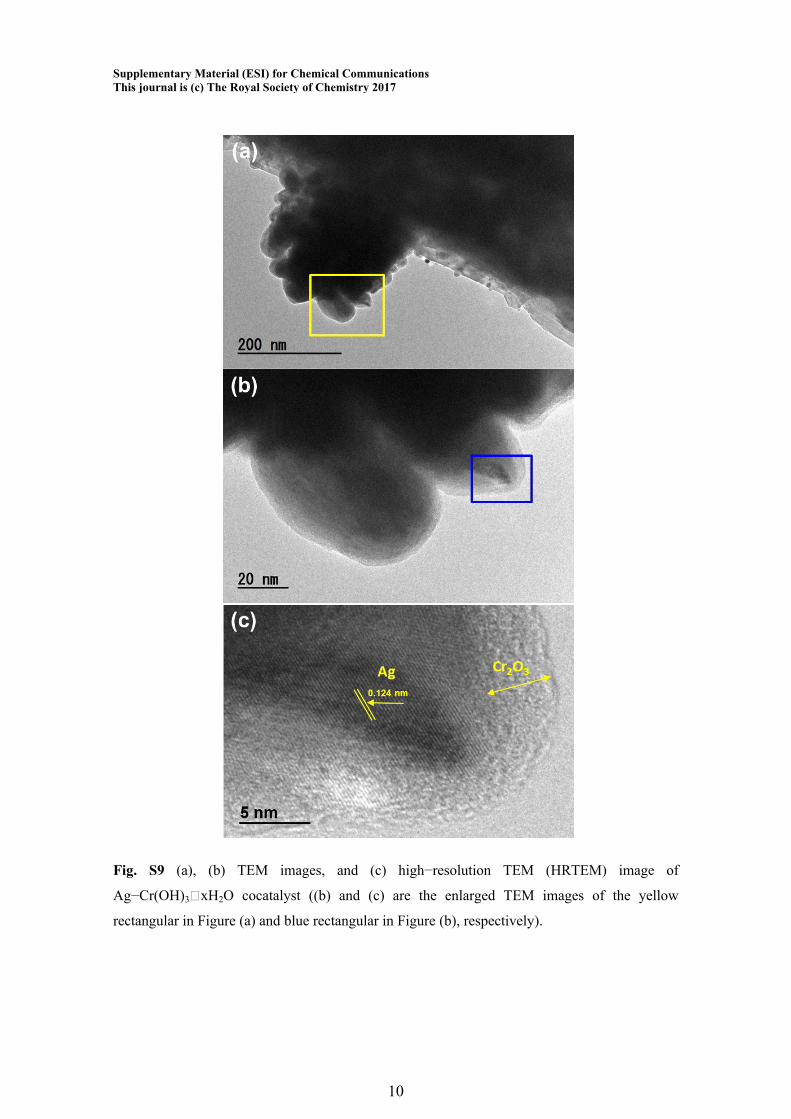
Fig. S9 (a), (b) TEM images, and (c) high−resolution TEM (HRTEM) image of
Ag−Cr(OH)3⸳xH2O cocatalyst ((b) and (c) are the enlarged TEM images of the yellow
rectangular in Figure (a) and blue rectangular in Figure (b), respectively).
Supplementary Material (ESI) for Chemical Communications This journal is (c) The Royal Society of Chemistry 2017
11
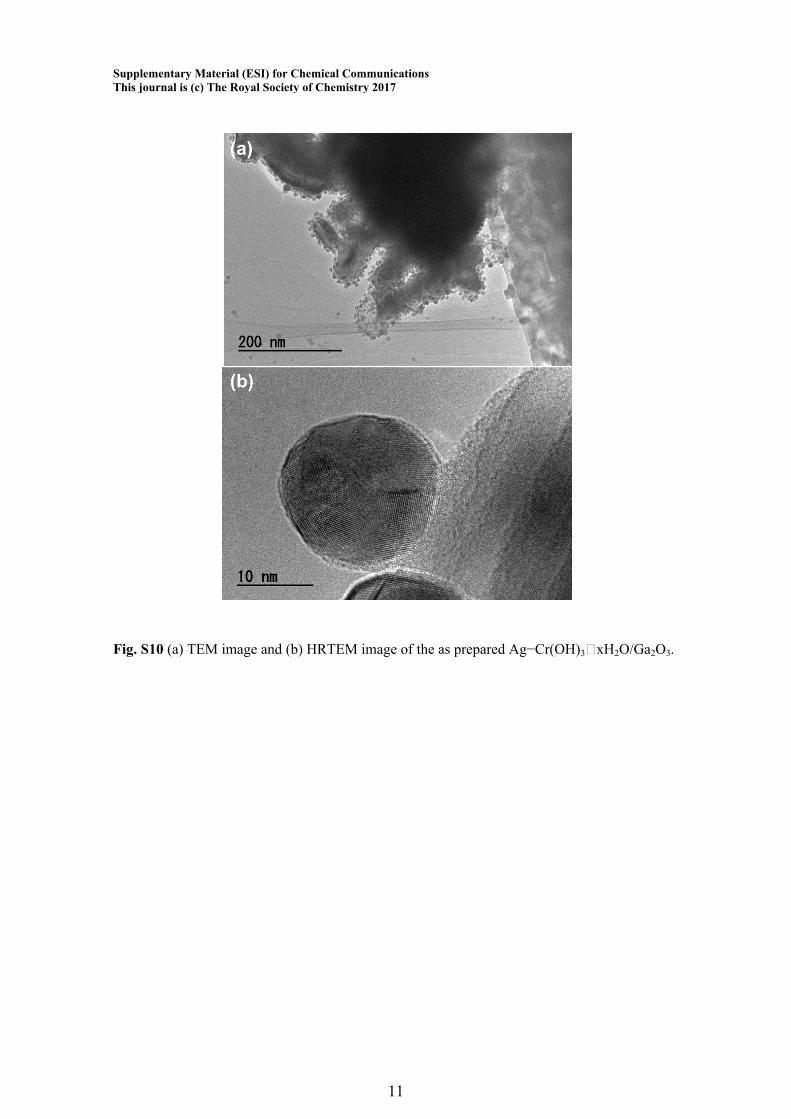
Fig. S10 (a) TEM image and (b) HRTEM image of the as prepared Ag−Cr(OH)3⸳xH2O/Ga2O3.
Supplementary Material (ESI) for Chemical Communications This journal is (c) The Royal Society of Chemistry 2017
12
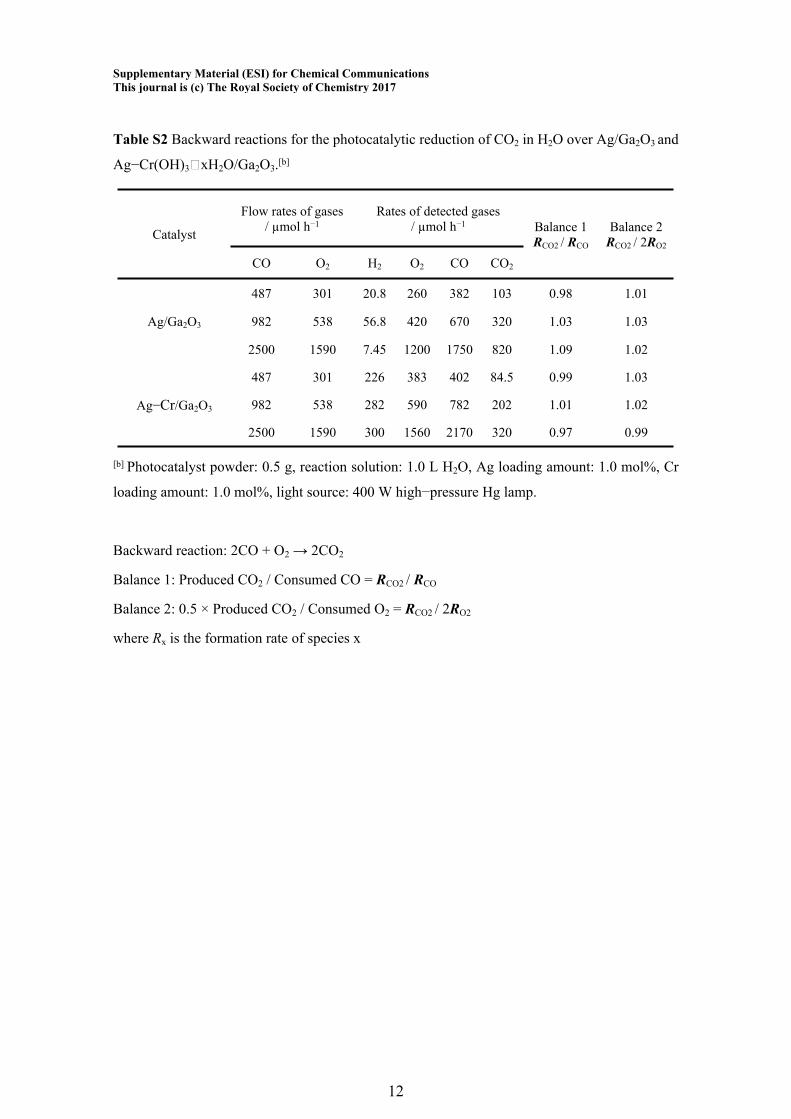
Table S2 Backward reactions for the photocatalytic reduction of CO2 in H2O over Ag/Ga2O3 and
Ag−Cr(OH)3⸳xH2O/Ga2O3.[b]
Flow rates of gases / µmol h−1
Rates of detected gases / µmol h−1
Catalyst
CO O2 H2 O2 CO CO2
Balance 1RCO2 / RCO
Balance 2RCO2 / 2RO2
487 301 20.8 260 382 103 0.98 1.01
982 538 56.8 420 670 320 1.03 1.03Ag/Ga2O3
2500 1590 7.45 1200 1750 820 1.09 1.02
487 301 226 383 402 84.5 0.99 1.03
982 538 282 590 782 202 1.01 1.02Ag−Cr/Ga2O3
2500 1590 300 1560 2170 320 0.97 0.99
[b] Photocatalyst powder: 0.5 g, reaction solution: 1.0 L H2O, Ag loading amount: 1.0 mol%, Cr
loading amount: 1.0 mol%, light source: 400 W high−pressure Hg lamp.
Backward reaction: 2CO + O2 → 2CO2
Balance 1: Produced CO2 / Consumed CO = RCO2 / RCO
Balance 2: 0.5 × Produced CO2 / Consumed O2 = RCO2 / 2RO2
where Rx is the formation rate of species x
Supplementary Material (ESI) for Chemical Communications This journal is (c) The Royal Society of Chemistry 2017
13
Calculation of the consumed amount of CO and O2 for the backward reaction.
Consumed amount of CO = Flowing amount of CO − Detected amount of CO
Because the water splitting and backward reaction for CO2 reduction happen simultaneously in
the reactor under photoirradiation, as a result, the detected O2 contains two parts: the residual of
flowing O2 after the backward reaction, and the O2 produced by water splitting. The detected
amount of O2 can be calculated as follows:
Detected amount of O2 = Flowing amount of O2 − Consumed amount of O2 + Produced amount
of O2
Consumed amount of O2 = Flowing amount of O2 − Detected amount of O2 + Produced amount
of O2 = Flowing amount of O2 − Detected amount of O2 + 0.5 × Produced amount of H2