Embed Size (px)
Citation preview
Supplementary Materials for
2D-PCR: A Method of Mapping DNA in Tissue Sections
Michael Armaniabeg, Jaime Rodriguez-Canalesfg, John Gillespieh, Michael Tangreaeg, Heidi Ericksoni, Michael R. Emmert-Buckeg, Benjamin Shapiroabd, and Elisabeth Smelaacd*
aBioengineering Graduate Program; bFischell Department of Bio-Engineering;
cMechanical Engineering, dUniversity of Maryland, College Park, MD; ePathogenetics Unit; fLaser Microdissection Core; gLaboratory of Pathology, National Cancer
Institute, Bethesda, MD; hSAIC-Frederick, Inc., Frederick, MD;
iUniversity of Texas M.D. Anderson Cancer Center, Department of Thoracic Head & Neck Medical Oncology, Houston, TX
*Corresponding author: 2176 Martin Hall, College Park, MD 20742, [email protected].
1 Supplementary Information for Mini-Vial Results
1.1 Compression Rig
The compression rig that was used to ensure sealing during thermocycling of the mini-vial substrates is illustrated in Figure Sup-1.
Figure Sup-1. Schematic view of the compression-heating rig used for sealing and thermocycling.
1.2 Electrophoresis Gels for Validation of 2D-PCR Method
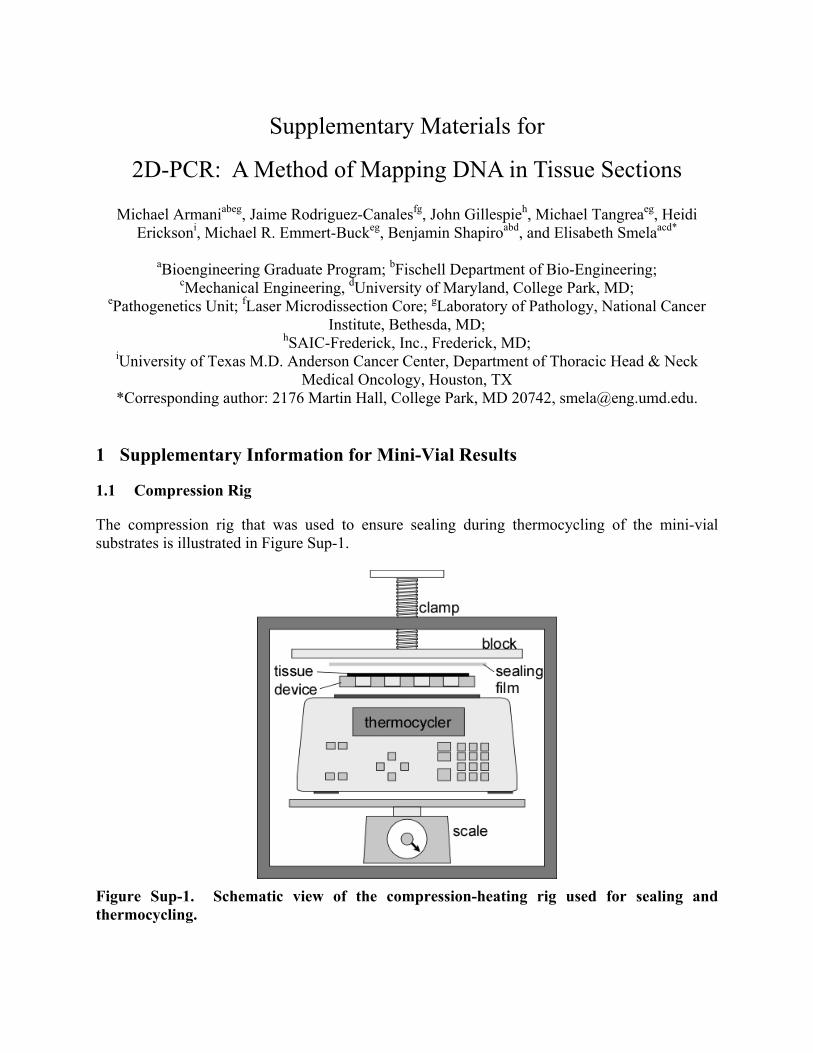
Our tissue DNA extraction protocol was verified by the electrophoresis gel results shown in Figure Sup-2.
Figure Sup-2. Gel electrophoresis from PCR validation experiment. Lanes 1 and 7 show 50 bp molecular weight ladders. Lane 2 had a negative water control, lanes 3-5 had increasing concentrations of purified genomic DNA, and lane 6 had a tissue-derived DNA extract. The PCR DNA amplification protocol in the agarose-filled aluminum miniature wells was also verified via an electrophoresis gel. Twelve amplifications were tested (Table Sup-1) for the twelve mini-vial locations shown in Figure Sup-3a with the resulting electrophoresis bands in Figure Sup-3b. All the observed bands corresponded to primers added to the wells thus verifying in-well PCR.
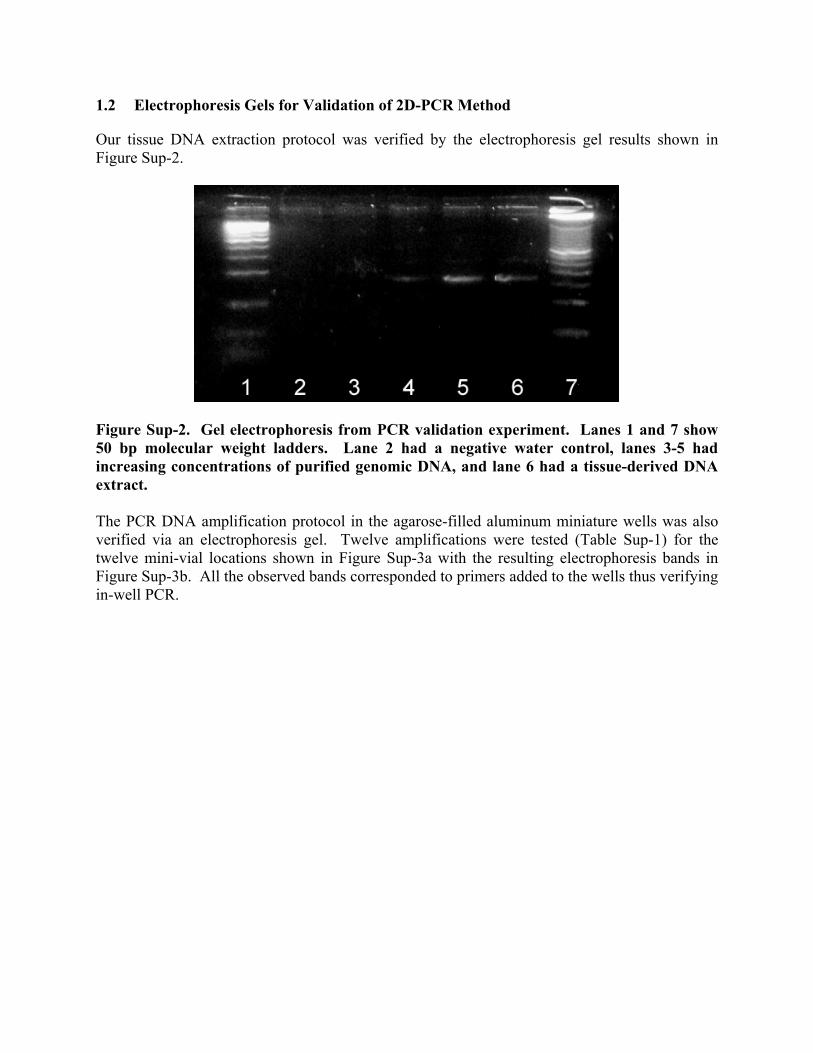
Table Sup-1. Well contents for validating DNA amplification. Well Contents Concentration Target Primers 1 1. cDNA 78 pg/μL BetaActin – 167 bp 5’tcaccctgaagtaccccatc,
5’ggtcatcttctcgcggttg 2 1. cDNA 78 pg/μL BetaActin – 489 bp 5’tcaccctgaagtaccccatc,
5’ccatctcttgctcgaagtcc 3 1. cDNA 78 pg/μL GAPDH – 167 bp 5’catcatctctgccccctct,
5’tgagtccttccacgatacca 4 1. cDNA 78 pg/μL GAPDH – 582 bp 5’aaatcccatcaccatcttcc,
5’gcctgcttcaccaccttctt 5 water --
6 1. cDNA 4.9 pg/μL 7 1. cDNA 20 pg/μL 8 1. cDNA 478 pg/μL 9 2. 582 bp
target 7*102 molecules/μL
10 2. 582 bp target
1.2*104 molecules/μL
11 2. 582 bp target
1.9*105 molecules/μL
12 2. 582 bp target
3.0*106 molecules/μL
GAPDH – 582 bp
5’aaatcccatcaccatcttcc, 5’gcctgcttcaccaccttctt
Figure Sup-3. a) Geometric arrangement of the wells. b) Gel electrophoresis validation of DNA extraction experiment. The lane numbers correspond with the well numbers in Table Sup-1. Lane 13 had a 50 bp ladder. The gel lanes show bands at (1) 167 bp, (2) 489 bp, (3) 167 bp, (4) 582 bp, (5) no bands, (6) no bands, (7) 582 bp, (8) 582 bp, (9) no bands, (10) 582 bp, (11) 582 bp, (12) 582 bp.
Here all the gel bands corresponded to the primers added to wells. These results demonstrate the robustness of PCR in the device since there was specific amplification of four different PCR target regions (lanes 1 to 4). Well 5, filled only with water as a control, showed no bands. This well was directly next to well 12, which contained previously-amplified PCR targets at a high concentration. The fact that no bands were observed demonstrates that there was no cross contamination between wells. To further demonstrate the robustness of PCR, lanes 6-8 contained a genomic DNA dilution series, and lanes 9-12, a PCR product dilution series. 2 Supplementary Information for Further Miniaturization
2.1 Purpose of Further Miniaturization
The current device was developed with a resolution of 1.6 mm as a proof-of-concept for the 2D-PCR approach. This initial effort demonstrated a substantial improvement in resolution (over 100 fold) compared to a whole tissue scrape. However, our long term goal is to create a tool that can map 2D tissue sections for gene expression with a resolution of about 100 cells, or well sizes of 50 to 100 μm. This finer-resolution device would have applications in all areas of biology, including developmental biology, cellular-level studies of genes expressed at low abundance, and animal models. However, miniaturizing 2D-PCR has the additional challenges of microfabrication, batch fluid loading by capillary action, containment of samples that evaporate quickly, lower amplification efficiency, and a smaller volume for fluorescence visualization. All of these have been addressed by the preliminary studies presented here. However, the challenges of loading tissues into the smaller vials and adding reagents while avoiding cross-contamination have not yet been examined. 2.2 Challenges Addressed
2.2.1 Fabrication
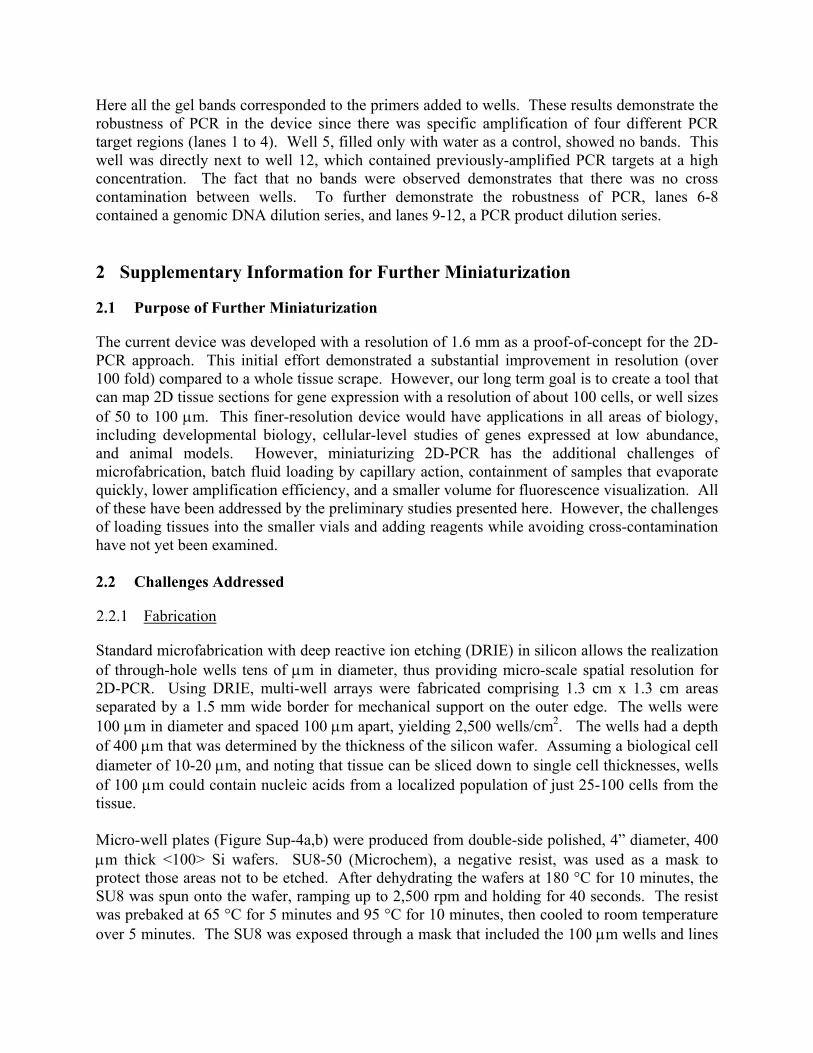
Standard microfabrication with deep reactive ion etching (DRIE) in silicon allows the realization of through-hole wells tens of μm in diameter, thus providing micro-scale spatial resolution for 2D-PCR. Using DRIE, multi-well arrays were fabricated comprising 1.3 cm x 1.3 cm areas separated by a 1.5 mm wide border for mechanical support on the outer edge. The wells were 100 μm in diameter and spaced 100 μm apart, yielding 2,500 wells/cm2. The wells had a depth of 400 μm that was determined by the thickness of the silicon wafer. Assuming a biological cell diameter of 10-20 μm, and noting that tissue can be sliced down to single cell thicknesses, wells of 100 μm could contain nucleic acids from a localized population of just 25-100 cells from the tissue. Micro-well plates (Figure Sup-4a,b) were produced from double-side polished, 4” diameter, 400 μm thick <100> Si wafers. SU8-50 (Microchem), a negative resist, was used as a mask to protect those areas not to be etched. After dehydrating the wafers at 180 °C for 10 minutes, the SU8 was spun onto the wafer, ramping up to 2,500 rpm and holding for 40 seconds. The resist was prebaked at 65 °C for 5 minutes and 95 °C for 10 minutes, then cooled to room temperature over 5 minutes. The SU8 was exposed through a mask that included the 100 μm wells and lines
of 20 μm width between micro-well areas to aid later dicing. The resist was post-baked using the same procedures as for prebaking. The SU8 was developed (MicroChem SU8 Developer) for 2 minutes, then rinsed in isopropanol, methanol, and de-ionized water. The wafer was attached to a second “handle” wafer with a layer of spin-coated Shipley 1813 resist. The holes were etched all the way through the wafer by DRIE using an etch cycle of 10 seconds and a passivation cycle of 6.5 seconds, for a total of 4 hours. A small percentage of holes did not etch all the way through (black dots in Figure Sup-4a,c), and we assume this was due to defects in the SU8 mask. Lastly, the handle wafer was removed in acetone, and the SU8 mask was peeled off.
a) b) c) Figure Sup-4. a) Silicon chip having a 1 cm square area with 100 μm holes spaced 100 μm apart. b) SEM sidewall profile of 50 μm wide holes made by DRIE. c) Silicon chip with 100 μm holes that was pretreated with BSA and spotted in an arbitrary diamond-shaped pattern with water containing food dye. The wells filled completely by capillary action. 2.2.2 Loading reagents by capillary action
Since it is not possible to pipette reagents into these 100 μm wells, capillary action was used to draw the fluid into them. The driving force, F, for capillary action is related to the radius of the well, r, by F = 2πrσLGcosθ , where σLG is the surface tension of the liquid-gas interface and θ is the contact angle. If the surface is hydrophobic and the contact angle goes above 90°, there is a negative force for filing the wells; this is the case for Si, necessitating a surface coating to lower the contact angle. Several surfactants were tested for their ability to facilitate fluid transfer: bovine serum albumin (BSA) (20 mg/mL, BP675-1), Triton X-100 (NC9903183), and Tween 20 (BP337-100), each diluted to 0.2%, 1.0% and 5% of their stock concentrations in 50% ethanol-water. A 10 μL droplet was coated on one side of the micro-well plate and allowed to dry. 5 μL of water-based food coloring (for ease of visualization) was placed on the surface, and the percentage of filled holes determined (Figure Sup-4c). The 5% BSA (1mg/mL) and all the Triton X-100 and Tween 20 coatings resulted in complete filling. The surfactant inhibition limit in PCR was also tested by drying the various surfactants in standard PCR tubes. None of the surfactants inhibited PCR up to the 5% concentration (from stock) that was tested. This is consistent with the well-known observations that Tween 20 stabilizes the Taq enzyme and that surfactants such as X-100 or BSA can be used to improve PCR specificity 1, 2. Since BSA in the reaction mix has previously been used for PCR in silicon plates this was the surface treatment chosen for the remaining work. These experiments allow us to conclude that the use of 5% BSA allows the transfer of reagents into the wells and does not interfere with the PCR processes.
To test the loading of reagents into the (BSA-pretreated) micro-well plate by capillary action, samples of molten agarose at 0.5, 1.0, 1.5 and 3.0% weight/volume were spotted on four different plates, and each plate was covered on both sides with the same sealing film. A 1” plexiglass substrate was placed on top of the plate with a 200 g weight for even spreading. The micro-well plate was placed in a 4 °C refrigerator for 15 minutes to solidify the agarose. The agarose could be seen in all of the micro-wells for concentrations up to 1.5%. The 3.0% gel hardened too quickly to be drawn into the chip by capillary action. 2.2.3 Sample containment in micro-wells
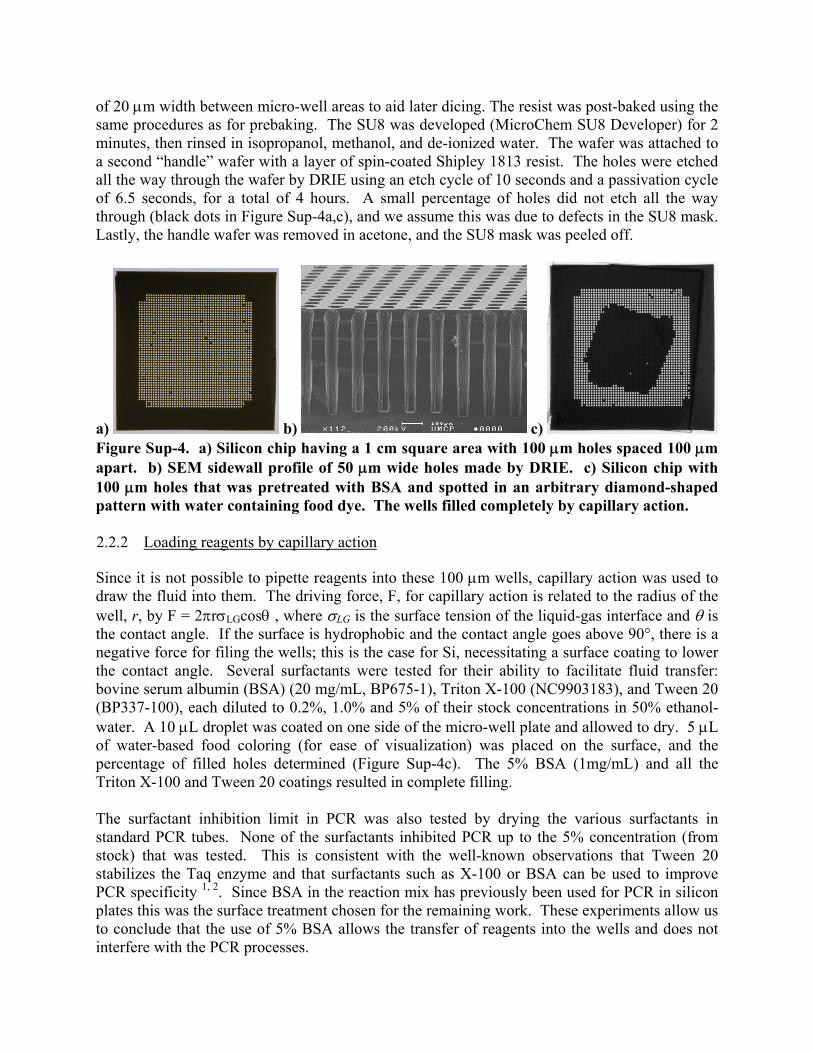
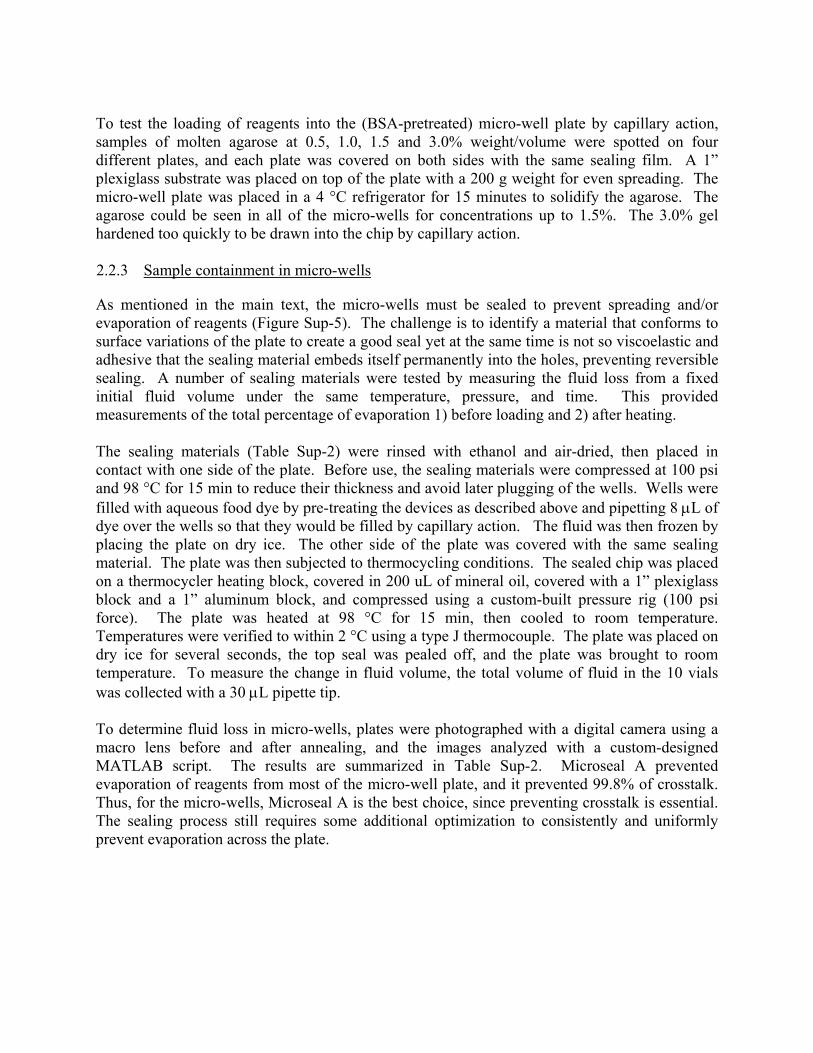
As mentioned in the main text, the micro-wells must be sealed to prevent spreading and/or evaporation of reagents (Figure Sup-5). The challenge is to identify a material that conforms to surface variations of the plate to create a good seal yet at the same time is not so viscoelastic and adhesive that the sealing material embeds itself permanently into the holes, preventing reversible sealing. A number of sealing materials were tested by measuring the fluid loss from a fixed initial fluid volume under the same temperature, pressure, and time. This provided measurements of the total percentage of evaporation 1) before loading and 2) after heating. The sealing materials (Table Sup-2) were rinsed with ethanol and air-dried, then placed in contact with one side of the plate. Before use, the sealing materials were compressed at 100 psi and 98 °C for 15 min to reduce their thickness and avoid later plugging of the wells. Wells were filled with aqueous food dye by pre-treating the devices as described above and pipetting 8 μL of dye over the wells so that they would be filled by capillary action. The fluid was then frozen by placing the plate on dry ice. The other side of the plate was covered with the same sealing material. The plate was then subjected to thermocycling conditions. The sealed chip was placed on a thermocycler heating block, covered in 200 uL of mineral oil, covered with a 1” plexiglass block and a 1” aluminum block, and compressed using a custom-built pressure rig (100 psi force). The plate was heated at 98 °C for 15 min, then cooled to room temperature. Temperatures were verified to within 2 °C using a type J thermocouple. The plate was placed on dry ice for several seconds, the top seal was pealed off, and the plate was brought to room temperature. To measure the change in fluid volume, the total volume of fluid in the 10 vials was collected with a 30 μL pipette tip. To determine fluid loss in micro-wells, plates were photographed with a digital camera using a macro lens before and after annealing, and the images analyzed with a custom-designed MATLAB script. The results are summarized in Table Sup-2. Microseal A prevented evaporation of reagents from most of the micro-well plate, and it prevented 99.8% of crosstalk. Thus, for the micro-wells, Microseal A is the best choice, since preventing crosstalk is essential. The sealing process still requires some additional optimization to consistently and uniformly prevent evaporation across the plate.
Figure Sup-5. Compression-Thermocycling rig showing PCR machine on a weight scale. Table Sup-2. Testing evaporation and spreading for different micro-well sealing films.
Material Micro-Wells Sealing Material Description Evaporation Spreading Comments
Parafilm thick, viscoelastic N/A N/A plugs wells Microseal A clear, proprietary ~11% <1%
Microseal B clear, proprietary N/A N/A plugs some wells
Alum sticky foil adhesive N/A N/A removal breakage
Adhesive FEP adhesive fluoropolymer 0% ~5% Silicone medical grade N/A N/A Inconsistent
2.3 PCR
To demonstrate PCR in the micro-well plates, they were pretreated on one side as previously described and then loaded by capillary action with 8 μL of the following mixture: 50 μL of PCR supermix containing an additional 2 μL of native Taq DNA polymerase, 3.5 μL of 25 mM MgCl2, 250 μM of the 587bp GAPDH primer set, and 1 μL of the cDNA (5 ng/μL) used previously, as well as an additional 2 mg/mL BSA. A second PCR supermix contained the same reagents with 1 μL of water in place of cDNA as a negative control. Since no gel was used in
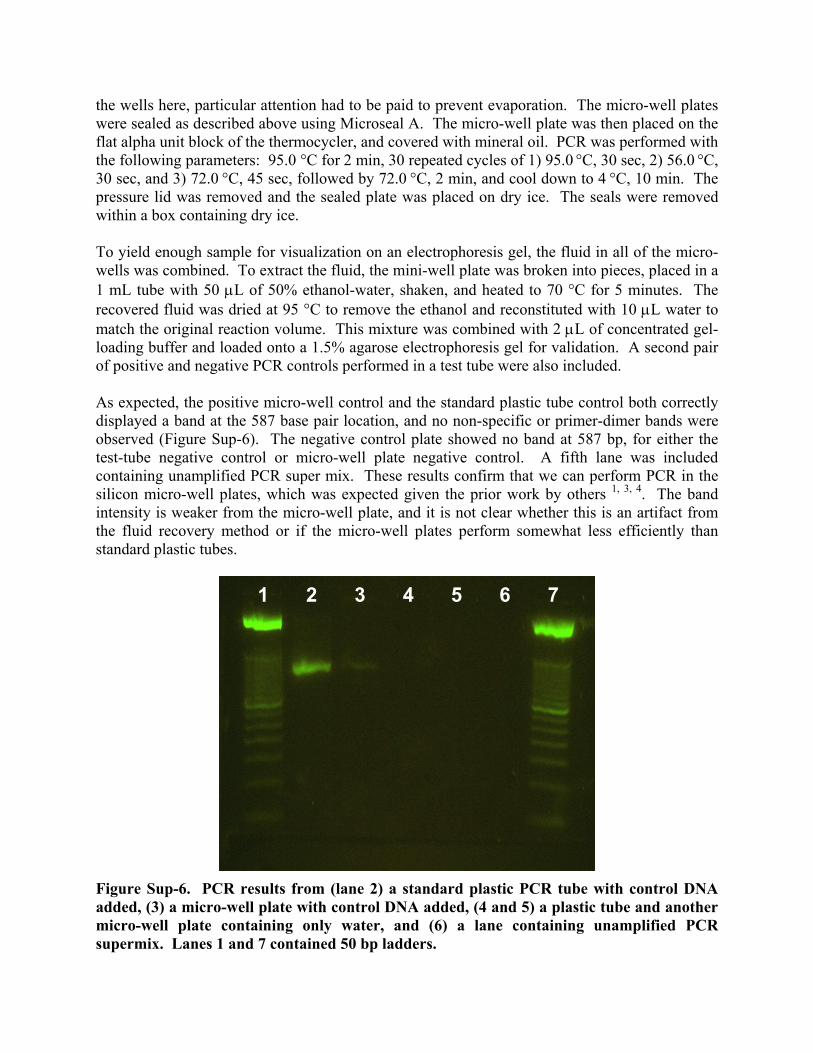
the wells here, particular attention had to be paid to prevent evaporation. The micro-well plates were sealed as described above using Microseal A. The micro-well plate was then placed on the flat alpha unit block of the thermocycler, and covered with mineral oil. PCR was performed with the following parameters: 95.0 °C for 2 min, 30 repeated cycles of 1) 95.0 °C, 30 sec, 2) 56.0 °C, 30 sec, and 3) 72.0 °C, 45 sec, followed by 72.0 °C, 2 min, and cool down to 4 °C, 10 min. The pressure lid was removed and the sealed plate was placed on dry ice. The seals were removed within a box containing dry ice. To yield enough sample for visualization on an electrophoresis gel, the fluid in all of the micro-wells was combined. To extract the fluid, the mini-well plate was broken into pieces, placed in a 1 mL tube with 50 μL of 50% ethanol-water, shaken, and heated to 70 °C for 5 minutes. The recovered fluid was dried at 95 °C to remove the ethanol and reconstituted with 10 μL water to match the original reaction volume. This mixture was combined with 2 μL of concentrated gel-loading buffer and loaded onto a 1.5% agarose electrophoresis gel for validation. A second pair of positive and negative PCR controls performed in a test tube were also included. As expected, the positive micro-well control and the standard plastic tube control both correctly displayed a band at the 587 base pair location, and no non-specific or primer-dimer bands were observed (Figure Sup-6). The negative control plate showed no band at 587 bp, for either the test-tube negative control or micro-well plate negative control. A fifth lane was included containing unamplified PCR super mix. These results confirm that we can perform PCR in the silicon micro-well plates, which was expected given the prior work by others 1, 3, 4. The band intensity is weaker from the micro-well plate, and it is not clear whether this is an artifact from the fluid recovery method or if the micro-well plates perform somewhat less efficiently than standard plastic tubes.
1 2 3 4 5 6 7
Figure Sup-6. PCR results from (lane 2) a standard plastic PCR tube with control DNA added, (3) a micro-well plate with control DNA added, (4 and 5) a plastic tube and another micro-well plate containing only water, and (6) a lane containing unamplified PCR supermix. Lanes 1 and 7 contained 50 bp ladders.
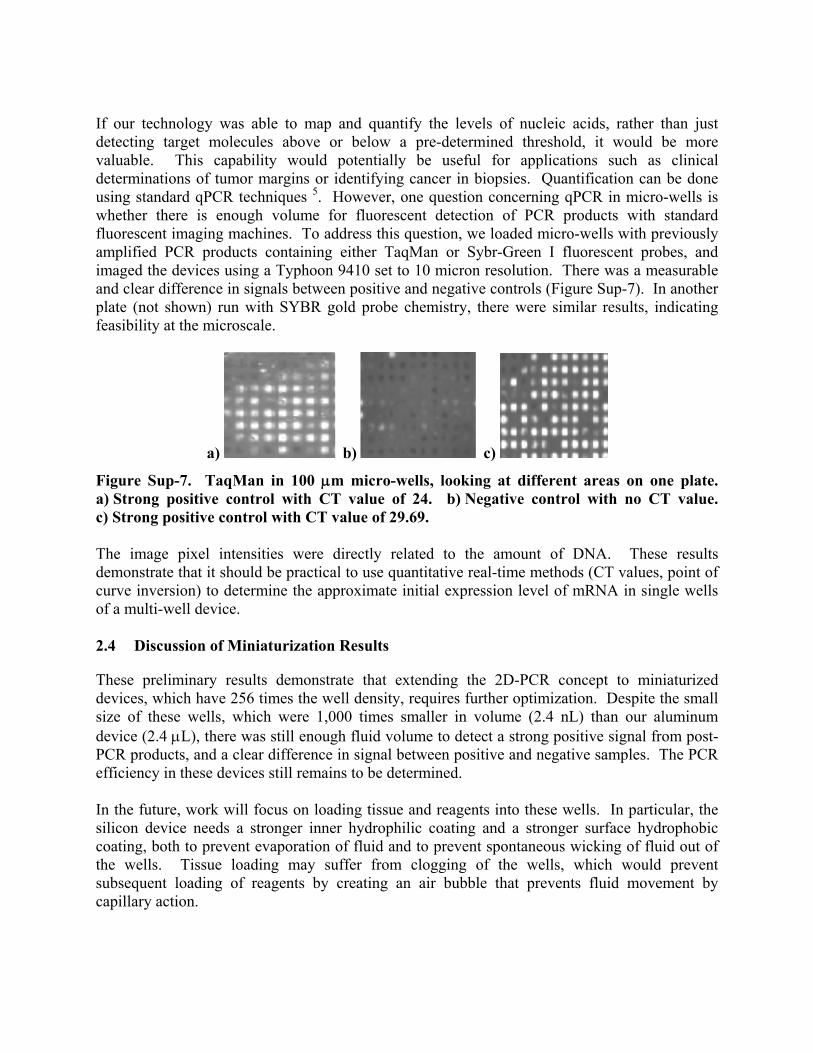
If our technology was able to map and quantify the levels of nucleic acids, rather than just detecting target molecules above or below a pre-determined threshold, it would be more valuable. This capability would potentially be useful for applications such as clinical determinations of tumor margins or identifying cancer in biopsies. Quantification can be done using standard qPCR techniques 5. However, one question concerning qPCR in micro-wells is whether there is enough volume for fluorescent detection of PCR products with standard fluorescent imaging machines. To address this question, we loaded micro-wells with previously amplified PCR products containing either TaqMan or Sybr-Green I fluorescent probes, and imaged the devices using a Typhoon 9410 set to 10 micron resolution. There was a measurable and clear difference in signals between positive and negative controls (Figure Sup-7). In another plate (not shown) run with SYBR gold probe chemistry, there were similar results, indicating feasibility at the microscale.
a) b) c)
Figure Sup-7. TaqMan in 100 μm micro-wells, looking at different areas on one plate. a) Strong positive control with CT value of 24. b) Negative control with no CT value. c) Strong positive control with CT value of 29.69. The image pixel intensities were directly related to the amount of DNA. These results demonstrate that it should be practical to use quantitative real-time methods (CT values, point of curve inversion) to determine the approximate initial expression level of mRNA in single wells of a multi-well device. 2.4 Discussion of Miniaturization Results
These preliminary results demonstrate that extending the 2D-PCR concept to miniaturized devices, which have 256 times the well density, requires further optimization. Despite the small size of these wells, which were 1,000 times smaller in volume (2.4 nL) than our aluminum device (2.4 μL), there was still enough fluid volume to detect a strong positive signal from post-PCR products, and a clear difference in signal between positive and negative samples. The PCR efficiency in these devices still remains to be determined. In the future, work will focus on loading tissue and reagents into these wells. In particular, the silicon device needs a stronger inner hydrophilic coating and a stronger surface hydrophobic coating, both to prevent evaporation of fluid and to prevent spontaneous wicking of fluid out of the wells. Tissue loading may suffer from clogging of the wells, which would prevent subsequent loading of reagents by creating an air bubble that prevents fluid movement by capillary action.
2D-PCR is expected to be scalable because the single-well procedure requires no pipetting of reagent out of the wells, enabling reagents to be added by capillary action. Since the volume of sample is always proportionate to number of cells, we do not expect a loss of efficiency in these devices when trying to amplify the same concentration, even if there is smaller number of transcripts per well. To support this hypothesis, the results of testing quantitative fluorescent dyes showed that there was plenty of fluorescence to distinguish positive and negative samples (Figure Sup-7). References
1. C. Zhang, J. Xu, W. Ma, and W. Zheng, "PCR microfluidic devices for DNA amplification," Biotechnology Adv., 2006, 24, 243-284.
2. O. Henegariu, N. A. Heerema, S. R. Dlouhy, G. H. Vance, and P. H. Vogt, "Multiplex PCR: critical parameters and step-by-step protocol," Biotechniques, 1997, 23, 504-511.
3. C. J. H. Brenan, T. Morrison, K. Stone, T. Heitner, A. Katz, T. S. Kanigan, R. Hess, S. J. Kwon, H. C. Jung, and J. G. Pan, "Massively parallel microfluidics platform for storage and ultra-high-throughput screening," SPIE, 2002, 4626, 560.
4. L. Chen, A. Manz, and P. J. R. Day, "Total nucleic acid analysis integrated on microfluidic devices," Lab on a Chip, 2007, 7, 1413-1423.
5. A. Dahl, M. Sultan, A. Jung, R. Schwartz, M. Lange, M. Steinwand, K. J. Livak, H. Lehrach, and L. Nyarsik, "Quantitative PCR based expression analysis on a nanoliter scale using polymer nano-well chips," Biomedical Microdevices, 2007, 9, 307-314.