Embed Size (px)
Citation preview
www.sciencemag.org/cgi/content/full/336/6086/1304/DC1
Supplementary Materials for
Global Honey Bee Viral Landscape Altered by a Parasitic Mite Stephen J. Martin,* Andrea C. Highfield, Laura Brettell, Ethel M Villalobos, Giles E.
Budge, Michelle Powell, Scott Nikaido, Declan C. Schroeder*
*To whom correspondence should be addressed. E-mail: [email protected] (S.J.M.); [email protected] (D.C.S.)
Published 8 June 2012, Science 336, 1304 (2012)
DOI: 10.1126/science.1220941
This PDF file includes:
Materials and Methods Table S1 Figs. S1 to S7 References (28–37)
2
Materials and Methods
Specimen sampling and RNA extraction
During November 2009, ~100 adult honeybees were sampled from 280 managed and
13 feral colonies across the four main Hawaiian Islands. During November 2010 an
additional 38 colonies were sampled from Big Island (6 apiaries) and 11 colonies
from one apiary on Oahu. All samples were kept frozen and transported back to the
UK on dry ice and then stored at -80 °C. From each colony, 30 asymptomatic bees
(i.e., without deformed wings) were individually checked for the presence of mites,
before being pooled and ground to a fine homogenous powder in liquid nitrogen using
a pestle and mortar, which allows subsequent detection of virus at more than a 10%
prevalence in a colony, with 95% confidence. Samples were then stored at -80 °C.
With each batch of 20–30 samples, ‘dummy’ control tubes were left open on the
bench to test for airborne contamination. Total RNA was extracted from 30 mg of
ground material using an RNeasy mini kit (Qiagen), according to the manufacturer’s
instructions, except that samples were eluted in 40 µl RNase free water. Total RNA
samples were quantified using a Nanodrop 8000 (Thermo Scientific). One microgram
of isolated RNA was treated with DNase I (Promega), according to the
manufacturer’s instructions, followed by Nanodrop quantification to standardise the
amounts of total RNA to 25 ng/µl, before storage at -80 °C. Two independent RT-
PCR methods were used, as these are 100-fold more sensitive than conventional non-
nested PCR (29).
Virus quantification using probe-based (TaqMan®) chemistry
Real-time RT PCR was performed using duel labelled (TaqMan®) probes designed to
detect six honeybee viruses: DWV (two assays, including one designed to detect
Varroa destructor variant-1 (VaDV-1) strains (22), KBV, SPV (minor and major
forms), ABPV (two assays), and IAPV (table S1). All 293 honeybee samples
collected in 2009 were tested against all probes. Reactions were set up in either a 96-
well or 384-well reaction plate using PCR core-reagent kits (Applied Biosystems),
according to the manufacturer’s protocols, with the addition of approximately 25 ng
of RNA, 5 units of M-MuLV reverse transcriptase enzyme (Fermentas Life Sciences)
and 0.1 mM DTT. Reactions were run on the ABI 7900 HT Sequence Detection
3
System using generic cycling conditions of 48°C for 30 min, 95°C for 10 min
followed by 40 cycles of 95°C for 10 s and 60°C for 1 min.
Additionally, SYBR green chemistry was used to screen for ABPV (29), using
SYBR green PCR Mastermix (Applied Biosystems), 25 pmol of each primer and 5
units of M-MuLV reverse transcriptase enzyme (Fermentas Life Sciences).
Absolute quantification of DWV using SYBR green qPCR
All samples that tested positive for DWV using TaqMan probes were analyzed using
SYBR green chemistry, as follows. Total RNA was analyzed in triplicate for each
sample using the one-step SensiMix with SYBR green kit (Bioline). PCR reactions
contained 50 ng RNA, 1× SYBR one-step Sensimix, 2.5 mM MgCl2, 5 units of RNase
inhibitor, and 7.5 pmol of each primer: DWVQ-F1 and R1 for DWV, and Actin F1
and R1, for the reference gene actin (Supplemental Table 1). Reactions were run on a
Rotorgene 6000 Thermocycler (Corbett Research) with an initial reverse transcription
stage at 49 °C for 30 min and a denaturation step of 95 °C for 10 min, followed by 40
cycles of denaturation for 15 sec at 95 °C, annealing for 20 sec at 54 °C for DWV, and
58 °C for actin, and extension for 20 sec at 72 °C. The SYBR green signal was
measured on the green channel after each extension step. To
ensure that a single
product was amplified, and that no
contamination was present in the reverse
transcription negative controls or in the no-template controls, a final dissociation
curve was performed between 72 °C and 95 °C, at 0.5°C increments, each with a 10
sec hold and acquisition to the green channel. Sample copy numbers were determined
for each target using Corbett analysis software where the threshold cycle (CT) number
was determined for each sample run in triplicate, before the average was taken.
DWV copy number was quantified in the positive samples using cRNA
standards previously developed (7), which were run in parallel to the samples
analysed. DWV copy number was normalised to actin for each run and the copy
number per bee was calculated (7). To increase confidence in the detection of low
DWV viral levels, three DWV runs (two with TaqMan® probes and one with
SYBRgreen) were compared and a positive sample was determined if two of the three
tests were positive. Only one of the 293 control samples (elongation factor 1, [EF1])
failed, and none of the 16 dummy controls tested positive, indicating that there was
minimal chance of cross-sample contamination. Reaction efficiency was calculated as
<90% for the TaqMan® probes.
4
Statistical analysis
Comparison of viral load for the five different viruses was conducted using the ∆CT
values derived from the TaqMan® probe analysis. Subsequently, both relative (DWV
& KBV using TaqMan® and a known positive) and absolute (DWV using
SYBRgreen and cRNA standards) (7) viral loads were obtained to allow comparisons
with other studies. Average viral loads were calculated only using positive samples.
The same distinctive pattern for DWV distribution and load was obtained across all
datasets, irrespective of the PCR assay method (TaqMan® or SYBRgreen) or
quantification method (relative or absolute) used, because the change in viral load was
so large.
Analysis of DWV RdRp sequences
Four colonies, one from Oahu, Maui, Kauai, and Big Island were analysed for DWV
sequence diversity using high resolution melt (HRM) analysis and clone
libraries/sequencing of a region of the RdRp gene. This is a highly conserved region
vital for viral survival so any substitutions in this region would be significant and
could contribute to variations in viral epidemiology, since any variation in this gene
could suggest a more significant genetic shift in the rest of the viral genome. HRM
analysis was performed using the Quantace one-step probe kit (Bioline), using the
same PCR reactions as the SYBR green kit, with the exception that the SYBR green
was replaced with 5× EvaGreen (Cambridge Biosciences). PCR proceeded with the
same protocol used for SYBR green, until the melt stage where a HRM melt curve
was performed between 72 °C and 95 °C, with 0.1 °C increments each with a 5 sec
hold and acquisition to the HRM channel. For HRM analysis fragments no greater
that 250 bp should be used (CorProtocolTM
6000-1-July06). DWV PCR products were
verified by gel electrophoresis and products were purified from the agarose gels using
the QiaexII gel extraction kit (Qiagen). Purified fragments were cloned using the
Invitrogen TA cloning kit (Invitrogen), according to the manufacturer’s instructions.
Positive colonies were screened for inserts using M13 colony PCR and these PCR
products were used for sequencing. Approximately 40 clones from each of the
samples from the four islands in 2009 were sequenced using the BigDye Terminator
V3.1 cycle sequencing kit (Applied Biosystems). Reaction mixtures contained 0.875×
Sequencing dilution buffer, 0.05× Big Dye V3.1, 3.3 pmol M13 forward primer, and
5
approximately 35 ng DNA. Reactions proceeded with an initial denaturation step at
95 °C for 1 min, followed by 39 cycles of denaturation at 94 °C for 10 sec, annealing
at 50 °C for 5 sec,
and extension at 60 °C for 4 min. Ethanol/EDTA/sodium acetate
precipitation was then carried out to purify the sequencing PCR products and to
remove dye terminators, before direct sequencing using the ABI3730 Genetic
Analyzer. Electropherograms were edited using CodonCode Aligner v1.6.3 and
unclear traces were re-sequenced using the reverse primer, before the two sequences
were aligned and edited. BioEdit was used to align sequences and to create the
consensus.
For HRM runs, thresholds were determined individually depending on the
amount of product yielded by the PCR, which is determined by the fluorescent signal
detected above the background noise. This is because a sample with a lower viral
load results in less fluorescence being produced so the resultant melt curve also has a
lower fluorescence. Consequently, the threshold used to determine the melt peak
temperature was adjusted accordingly so that the signal for each positive sample was
above the background noise level.
Variant sequences were determined based on the melting temperatures derived
from the HRM data, where a unique OTU (operational taxonomic unit) was defined
according to data acquired from running HRM on individual clones of the DWV PCR
product (fig. S5). Identical sequences were found to vary in their melt temperature by
up to 0.1°C and this temperature range was used to define a variant melt temperature,
i.e., 78.5 °C ± 0.1°C would be equivalent to a variant. Rarefaction curves for the
HRM data for each island were calculated using Analytic Rarefaction version 1.3
(http://strata.uga.edu/software/).
Analysis of other DWV sequences
To investigate the possibility of the formation of DWV/VaVD-1 hybrids we
sequenced regions of the Lp, VP3, helicase and RdRp genes using established primers
(L protein (DWV-F1153/DWV-B1806) de Miranda (personal communication), VP3
primers (DWV-F1/DWV-B1) (30), Helicase primers (DWV-6285F/DWV-6693R)
(31), RdRp (DWV-F15/DWV-B23) (30). DWV was extracted and sequenced from
three bees and three Varroa mites from an infested Oahu apiary in 2009. The methods
used were as given above, except PCR products were not cloned before sequencing.
The similarity of the six Oahu isolates to other DWV and VaDV-1 sequences on
6
Genbank was determined using the BLASTn algorithm and the range of similarities
against both DWV and VaDV-1 presented. Using MEGA-5 (32) we re-constructed
the phylogram for the Lp region (15) before adding in our Oahu sequence data and
new VaVD-1-DWV recombinants data (22, 33). Minimum Evolution criteria was
used and statistical strength is based on 1000 replicate bootstrap analysis.
7
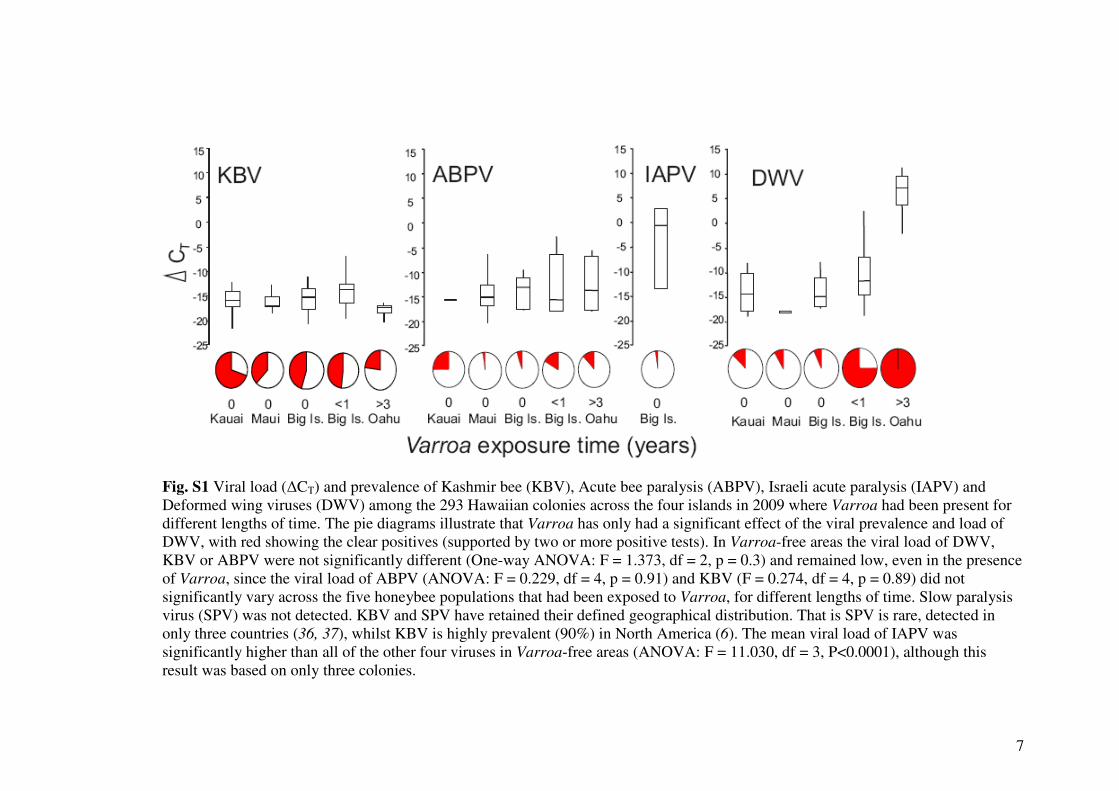
Fig. S1 Viral load (∆CT) and prevalence of Kashmir bee (KBV), Acute bee paralysis (ABPV), Israeli acute paralysis (IAPV) and
Deformed wing viruses (DWV) among the 293 Hawaiian colonies across the four islands in 2009 where Varroa had been present for
different lengths of time. The pie diagrams illustrate that Varroa has only had a significant effect of the viral prevalence and load of
DWV, with red showing the clear positives (supported by two or more positive tests). In Varroa-free areas the viral load of DWV,
KBV or ABPV were not significantly different (One-way ANOVA: F = 1.373, df = 2, p = 0.3) and remained low, even in the presence
of Varroa, since the viral load of ABPV (ANOVA: F = 0.229, df = 4, p = 0.91) and KBV (F = 0.274, df = 4, p = 0.89) did not
significantly vary across the five honeybee populations that had been exposed to Varroa, for different lengths of time. Slow paralysis
virus (SPV) was not detected. KBV and SPV have retained their defined geographical distribution. That is SPV is rare, detected in
only three countries (36, 37), whilst KBV is highly prevalent (90%) in North America (6). The mean viral load of IAPV was
significantly higher than all of the other four viruses in Varroa-free areas (ANOVA: F = 11.030, df = 3, P<0.0001), although this
result was based on only three colonies.
8
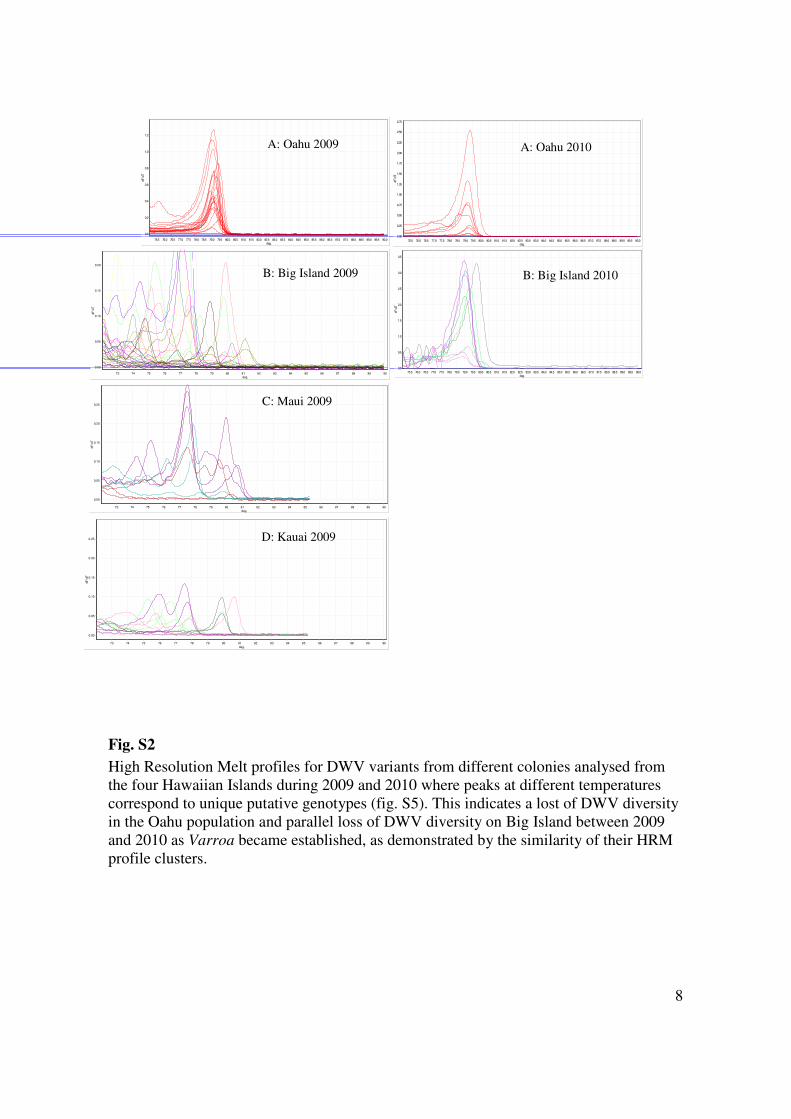
Fig. S2
High Resolution Melt profiles for DWV variants from different colonies analysed from
the four Hawaiian Islands during 2009 and 2010 where peaks at different temperatures
correspond to unique putative genotypes (fig. S5). This indicates a lost of DWV diversity
in the Oahu population and parallel loss of DWV diversity on Big Island between 2009
and 2010 as Varroa became established, as demonstrated by the similarity of their HRM
profile clusters.
deg.
75.5 76.0 76.5 77.0 77.5 78.0 78.5 79.0 79.5 80.0 80.5 81.0 81.5 82.0 82.5 83.0 83.5 84.0 84.5 85.0 85.5 86.0 86.5 87.0 87.5 88.0 88.5 89.0 89.5 90.0
dF
/dT
1.2
1.0
0.8
0.6
0.4
0.2
0.0
deg.75.5 76.0 76.5 77.0 77.5 78.0 78.5 79.0 79.5 80.0 80.5 81.0 81.5 82.0 82.5 83.0 83.5 84.0 84.5 85.0 85.5 86.0 86.5 87.0 87.5 88.0 88.5 89.0 89.5 90.0
dF
/dT
3.5
3.0
2.5
2.0
1.5
1.0
0.5
0.0
deg.73 74 75 76 77 78 79 80 81 82 83 84 85 86 87 88 89 90
dF
/dT
0.20
0.15
0.10
0.05
0.00
deg.73 74 75 76 77 78 79 80 81 82 83 84 85 86 87 88 89 90
dF
/dT
0.25
0.20
0.15
0.10
0.05
0.00
deg.
73 74 75 76 77 78 79 80 81 82 83 84 85 86 87 88 89 90
dF
/dT
0.25
0.20
0.15
0.10
0.05
0.00
B: Big Island 2009
C: Maui 2009
D: Kauai 2009
B: Big Island 2010
A: Oahu 2009
deg.75.5 76.0 76.5 77.0 77.5 78.0 78.5 79.0 79.5 80.0 80.5 81.0 81.5 82.0 82.5 83.0 83.5 84.0 84.5 85.0 85.5 86.0 86.5 87.0 87.5 88.0 88.5 89.0 89.5 90.0
dF
/dT
2.75
2.50
2.25
2.00
1.75
1.50
1.25
1.00
0.75
0.50
0.25
0.00
A: Oahu 2010
deg.75.5 76.0 76.5 77.0 77.5 78.0 78.5 79.0 79.5 80.0 80.5 81.0 81.5 82.0 82.5 83.0 83.5 84.0 84.5 85.0 85.5 86.0 86.5 87.0 87.5 88.0 88.5 89.0 89.5 90.0
dF
/dT
1.2
1.0
0.8
0.6
0.4
0.2
0.0
deg.75.5 76.0 76.5 77.0 77.5 78.0 78.5 79.0 79.5 80.0 80.5 81.0 81.5 82.0 82.5 83.0 83.5 84.0 84.5 85.0 85.5 86.0 86.5 87.0 87.5 88.0 88.5 89.0 89.5 90.0
dF
/dT
3.5
3.0
2.5
2.0
1.5
1.0
0.5
0.0
deg.73 74 75 76 77 78 79 80 81 82 83 84 85 86 87 88 89 90
dF
/dT
0.20
0.15
0.10
0.05
0.00
deg.73 74 75 76 77 78 79 80 81 82 83 84 85 86 87 88 89 90
dF
/dT
0.25
0.20
0.15
0.10
0.05
0.00
deg.
73 74 75 76 77 78 79 80 81 82 83 84 85 86 87 88 89 90
dF
/dT
0.25
0.20
0.15
0.10
0.05
0.00
B: Big Island 2009
C: Maui 2009
D: Kauai 2009
B: Big Island 2010
A: Oahu 2009
deg.75.5 76.0 76.5 77.0 77.5 78.0 78.5 79.0 79.5 80.0 80.5 81.0 81.5 82.0 82.5 83.0 83.5 84.0 84.5 85.0 85.5 86.0 86.5 87.0 87.5 88.0 88.5 89.0 89.5 90.0
dF
/dT
2.75
2.50
2.25
2.00
1.75
1.50
1.25
1.00
0.75
0.50
0.25
0.00
A: Oahu 2010
9
A
B
A
B
0.1
L=Big Island
M=UK, Big Island
N=UK, Big Island
D=UK
K=Europe*, Oahu, Big Island, Kauai
O=UK, Big Island
J=UK
F=UK
G=UK
H=UK
I=UK, USA
A=UK
Y=Maui
S=UK
V=UK
W=UK
U=UK
C=UK, Kakugo
P=UK, Uruguay, Kauai
E=UK
Q=UK, Kakugo, Spain
B=UK, Turkey, Big Island
X=UK
R=UK
T=UK
Z=Kauai
AB=UK, Kauai
AA=VaDV-1
52
51
Group A
Group B
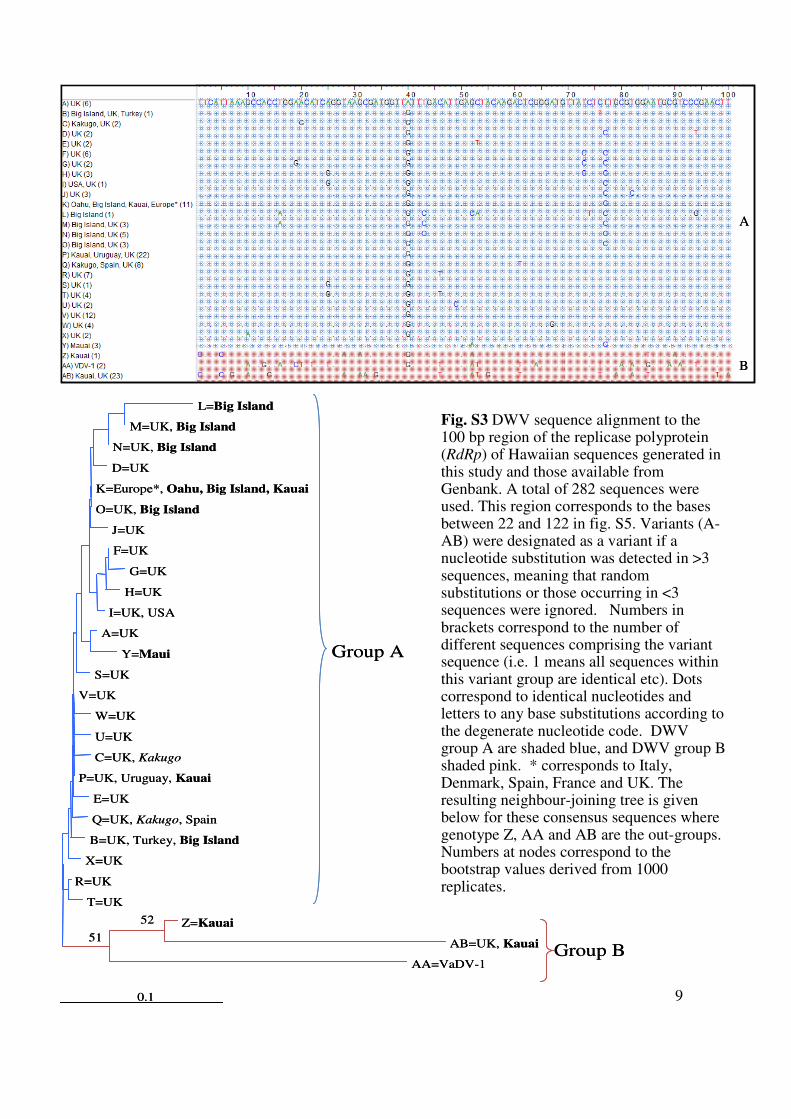
Fig. S3 DWV sequence alignment to the 100 bp region of the replicase polyprotein(RdRp) of Hawaiian sequences generated in this study and those available from Genbank. A total of 282 sequences were used. This region corresponds to the bases between 22 and 122 in fig. S5. Variants (A-AB) were designated as a variant if a nucleotide substitution was detected in >3 sequences, meaning that random substitutions or those occurring in <3 sequences were ignored. Numbers in brackets correspond to the number of different sequences comprising the variant sequence (i.e. 1 means all sequences within this variant group are identical etc). Dots correspond to identical nucleotides and letters to any base substitutions according to the degenerate nucleotide code. DWV group A are shaded blue, and DWV group B shaded pink. * corresponds to Italy, Denmark, Spain, France and UK. The resulting neighbour-joining tree is given below for these consensus sequences where genotype Z, AA and AB are the out-groups. Numbers at nodes correspond to the bootstrap values derived from 1000 replicates.
10
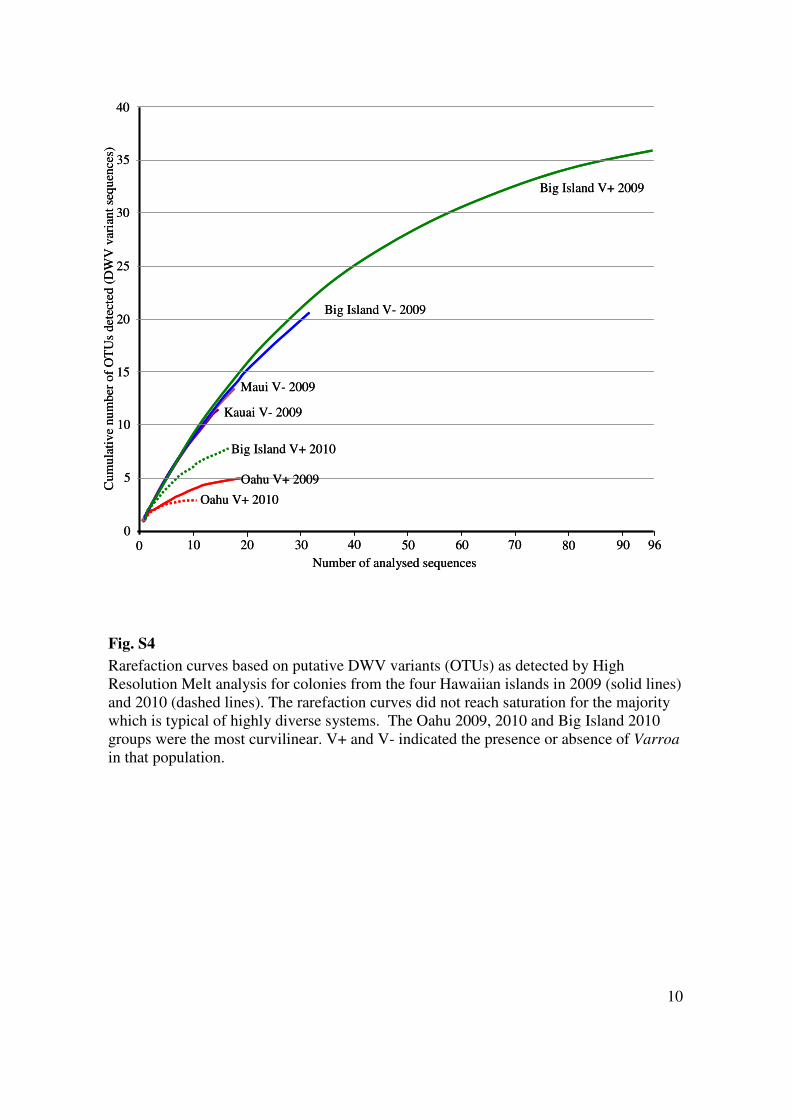
Fig. S4
Rarefaction curves based on putative DWV variants (OTUs) as detected by High
Resolution Melt analysis for colonies from the four Hawaiian islands in 2009 (solid lines)
and 2010 (dashed lines). The rarefaction curves did not reach saturation for the majority
which is typical of highly diverse systems. The Oahu 2009, 2010 and Big Island 2010
groups were the most curvilinear. V+ and V- indicated the presence or absence of Varroa
in that population.
Big Island V+ 2009
40
30
25
20
15
10
5
0
35
Cum
ula
tiv
e nu
mb
er o
f O
TU
sdet
ecte
d (
DW
V v
aria
nt
seq
uen
ces)
Number of analysed sequences
302010 60 80 90 9640 700 50
Big Island V- 2009
Maui V- 2009
Kauai V- 2009
Big Island V+ 2010
Oahu V+ 2009
Oahu V+ 2010
Big Island V+ 2009
40
30
25
20
15
10
5
0
35
Cum
ula
tiv
e nu
mb
er o
f O
TU
sdet
ecte
d (
DW
V v
aria
nt
seq
uen
ces)
Number of analysed sequences
302010 60 80 90 9640 700 50
Big Island V- 2009
Maui V- 2009
Kauai V- 2009
Big Island V+ 2010
Oahu V+ 2009
Oahu V+ 2010
11
A
B
A
B
BI-B BI-M
BI-O
BI-L
M-Y
K-P
K-Z K-ABK-AB
O-K
BI-NK-K
BI-K
BI-B BI-M
BI-O
BI-L
M-Y
K-P
K-Z K-ABK-AB
O-K
BI-NK-K
BI-K
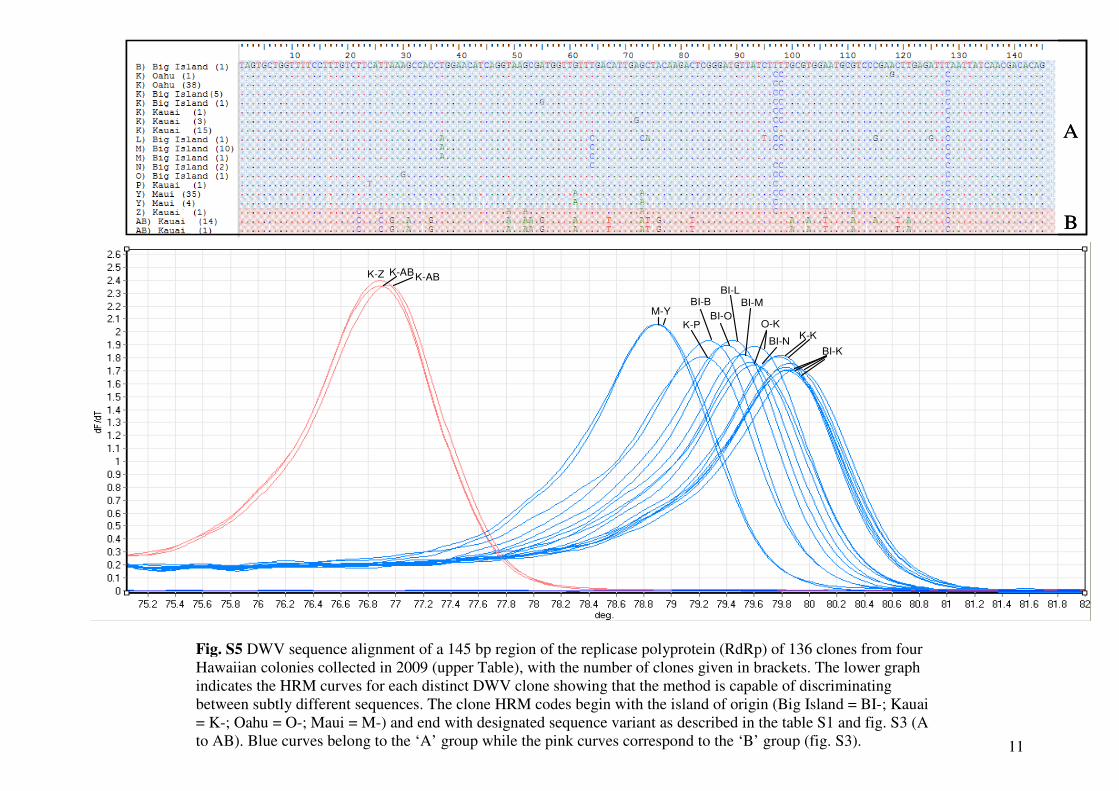
Fig. S5 DWV sequence alignment of a 145 bp region of the replicase polyprotein (RdRp) of 136 clones from four
Hawaiian colonies collected in 2009 (upper Table), with the number of clones given in brackets. The lower graph
indicates the HRM curves for each distinct DWV clone showing that the method is capable of discriminating
between subtly different sequences. The clone HRM codes begin with the island of origin (Big Island = BI-; Kauai
= K-; Oahu = O-; Maui = M-) and end with designated sequence variant as described in the table S1 and fig. S3 (A
to AB). Blue curves belong to the ‘A’ group while the pink curves correspond to the ‘B’ group (fig. S3).
12
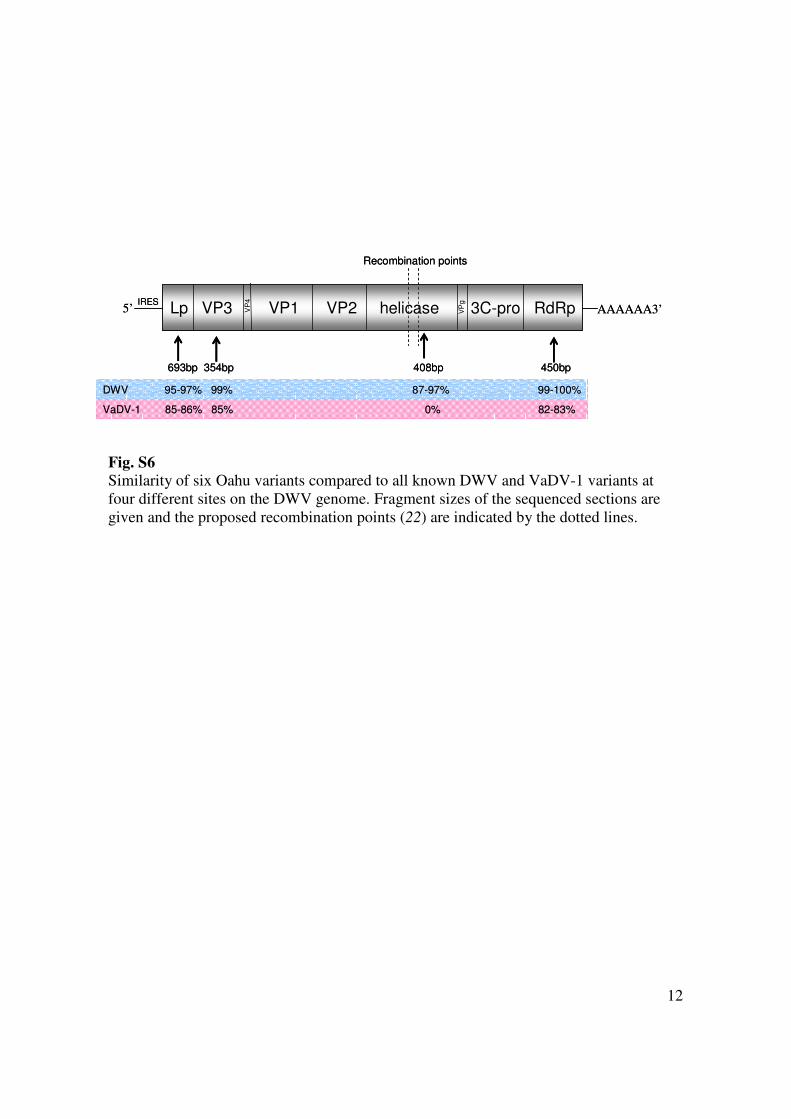
Fig. S6
Similarity of six Oahu variants compared to all known DWV and VaDV-1 variants at
four different sites on the DWV genome. Fragment sizes of the sequenced sections are
given and the proposed recombination points (22) are indicated by the dotted lines.
5’IRES
Lp VP3 VP1 VP2 helicase 3C-pro RdRpVP
4
VP
g
AAAAAA3’
Recombination points
DWV 95-97% 99% 87-97% 99-100%
693bp 354bp 408bp 450bp
VaDV-1 85-86% 85% 0% 82-83%
5’IRES
Lp VP3 VP1 VP2 helicase 3C-pro RdRpVP
4
VP
g
AAAAAA3’
Recombination points
DWV 95-97% 99% 87-97% 99-100%
693bp 354bp 408bp 450bp
VaDV-1 85-86% 85% 0% 82-83%
13
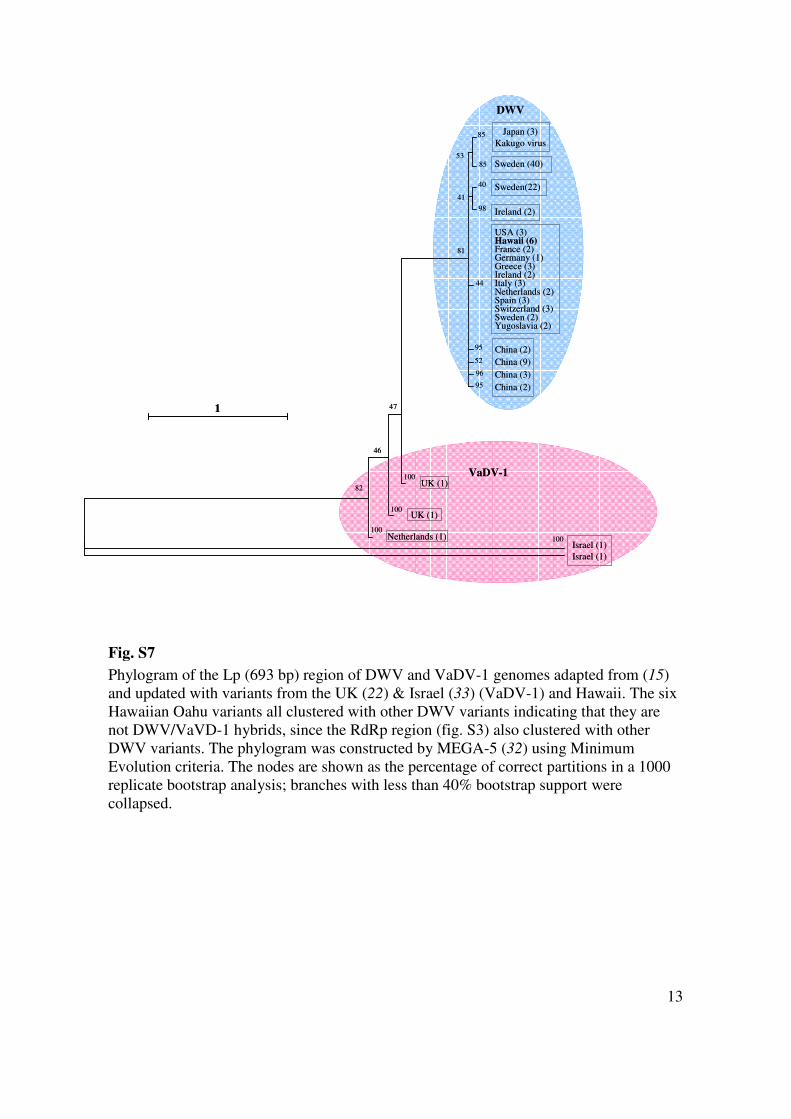
Fig. S7
Phylogram of the Lp (693 bp) region of DWV and VaDV-1 genomes adapted from (15)
and updated with variants from the UK (22) & Israel (33) (VaDV-1) and Hawaii. The six
Hawaiian Oahu variants all clustered with other DWV variants indicating that they are
not DWV/VaVD-1 hybrids, since the RdRp region (fig. S3) also clustered with other
DWV variants. The phylogram was constructed by MEGA-5 (32) using Minimum
Evolution criteria. The nodes are shown as the percentage of correct partitions in a 1000
replicate bootstrap analysis; branches with less than 40% bootstrap support were
collapsed.
UK (1)
98
96
95
95
85
40
85
53
52
44
41
81
47
46
82
Sweden (40)
Sweden(22)
Ireland (2)
USA (3)Hawaii (6)France (2)Germany (1)Greece (3)Ireland (2)Italy (3)Netherlands (2)Spain (3)Switzerland (3)Sweden (2)Yugoslavia (2)
UK (1)
Netherlands (1)Israel (1)
Israel (1)
1
VaDV-1
DWV
Japan (3)
Kakugo virus
China (2)
China (9)
China (3)
China (2)
100
100
100
100
UK (1)
98
96
95
95
85
40
85
53
52
44
41
81
47
46
82
Sweden (40)
Sweden(22)
Ireland (2)
USA (3)Hawaii (6)France (2)Germany (1)Greece (3)Ireland (2)Italy (3)Netherlands (2)Spain (3)Switzerland (3)Sweden (2)Yugoslavia (2)
UK (1)
Netherlands (1)Israel (1)
Israel (1)
1
VaDV-1
DWV
Japan (3)
Kakugo virus
China (2)
China (9)
China (3)
China (2)
100
100
100
100
14
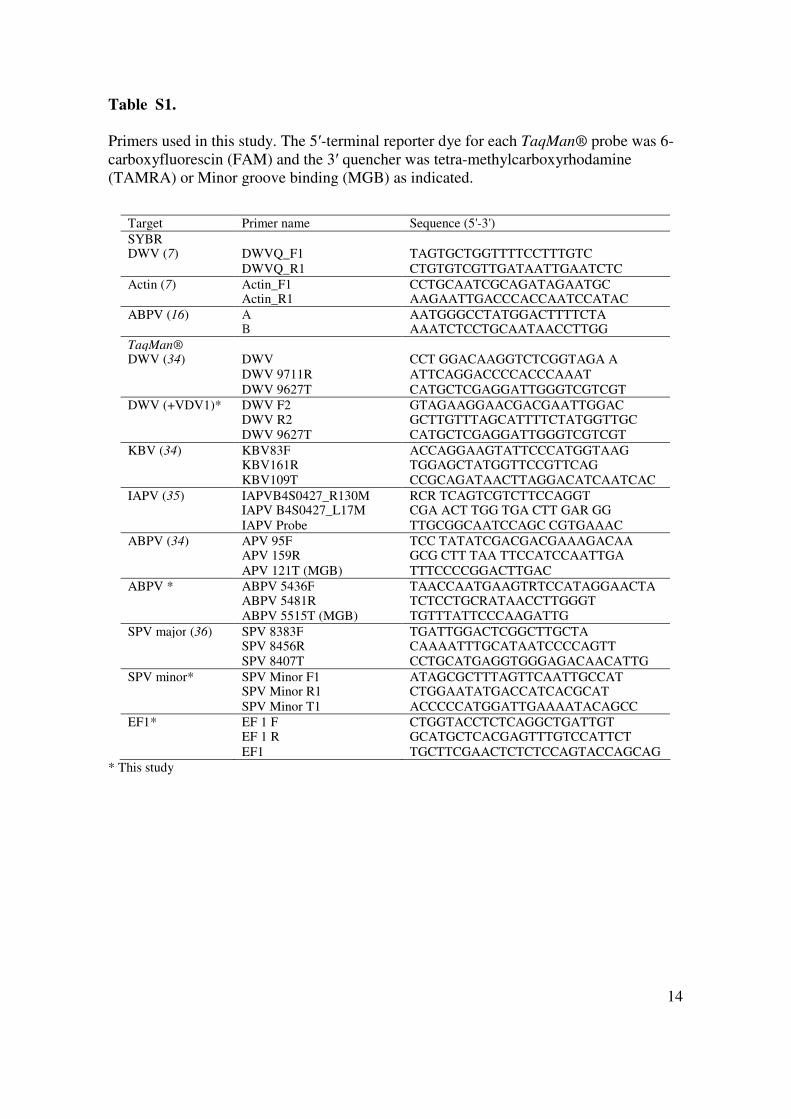
Table S1.
Primers used in this study. The 5′-terminal reporter dye for each TaqMan® probe was 6-
carboxyfluorescin (FAM) and the 3′ quencher was tetra-methylcarboxyrhodamine
(TAMRA) or Minor groove binding (MGB) as indicated.
* This study
Target Primer name Sequence (5'-3')
SYBR DWV (7) DWVQ_F1 TAGTGCTGGTTTTCCTTTGTC
DWVQ_R1 CTGTGTCGTTGATAATTGAATCTC
Actin (7) Actin_F1 CCTGCAATCGCAGATAGAATGC Actin_R1 AAGAATTGACCCACCAATCCATAC
ABPV (16) A AATGGGCCTATGGACTTTTCTA B AAATCTCCTGCAATAACCTTGG
TaqMan® DWV (34) DWV CCT GGACAAGGTCTCGGTAGA A
DWV 9711R ATTCAGGACCCCACCCAAAT
DWV 9627T CATGCTCGAGGATTGGGTCGTCGT
DWV (+VDV1)* DWV F2 GTAGAAGGAACGACGAATTGGAC DWV R2 GCTTGTTTAGCATTTTCTATGGTTGC DWV 9627T CATGCTCGAGGATTGGGTCGTCGT
KBV (34) KBV83F ACCAGGAAGTATTCCCATGGTAAG KBV161R TGGAGCTATGGTTCCGTTCAG KBV109T CCGCAGATAACTTAGGACATCAATCAC
IAPV (35) IAPVB4S0427_R130M RCR TCAGTCGTCTTCCAGGT IAPV B4S0427_L17M CGA ACT TGG TGA CTT GAR GG
IAPV Probe TTGCGGCAATCCAGC CGTGAAAC
ABPV (34) APV 95F TCC TATATCGACGACGAAAGACAA APV 159R GCG CTT TAA TTCCATCCAATTGA
APV 121T (MGB) TTTCCCCGGACTTGAC
ABPV * ABPV 5436F TAACCAATGAAGTRTCCATAGGAACTA ABPV 5481R TCTCCTGCRATAACCTTGGGT ABPV 5515T (MGB) TGTTTATTCCCAAGATTG
SPV major (36) SPV 8383F TGATTGGACTCGGCTTGCTA SPV 8456R CAAAATTTGCATAATCCCCAGTT SPV 8407T CCTGCATGAGGTGGGAGACAACATTG
SPV minor* SPV Minor F1 ATAGCGCTTTAGTTCAATTGCCAT SPV Minor R1 CTGGAATATGACCATCACGCAT
SPV Minor T1 ACCCCCATGGATTGAAAATACAGCC
EF1* EF 1 F CTGGTACCTCTCAGGCTGATTGT EF 1 R GCATGCTCACGAGTTTGTCCATTCT
EF1 TGCTTCGAACTCTCTCCAGTACCAGCAG
1
References 1. A. R. Blaustein, P. T. J. Johnson, Conservation biology: When an infection turns
lethal. Nature 465, 881 (2010). doi:10.1038/465881a Medline
2. K. E. Jones et al., Global trends in emerging infectious diseases. Nature 451, 990 (2008). doi:10.1038/nature06536 Medline
3. J. K. Waage, J. D. Mumford, Agricultural biosecurity. Philos. Trans. R. Soc. London Ser. B 363, 863 (2008). doi:10.1098/rstb.2007.2188 Medline
4. R. A. Morse, N. W. Calderone, The value of honey bees as pollinators of U.S. crops in 2000. Bee Culture 128, 1 (2000)
5. S. J. Martin, The role of Varroa and viral pathogens in the collapse of honey bee colonies: A modelling approach. J. Appl. Ecol. 38, 1082 (2001). doi:10.1046/j.1365-2664.2001.00662.x
6. D. L. Cox-Foster et al., A metagenomic survey of microbes in honey bee colony collapse disorder. Science 318, 283 (2007). doi:10.1126/science.1146498 Medline
7. A. C. Highfield et al., Deformed wing virus implicated in overwintering honeybee colony losses. Appl. Environ. Microbiol. 75, 7212 (2009). doi:10.1128/AEM.02227-09 Medline
8. N. L. Carreck, B. V. Ball, S. J. Martin, Honey bee colony collapse and changes in viral prevalence associated with Varroa destructor. J. Apic. Res. 49, 93 (2010). doi:10.3896/IBRA.1.49.1.13
9. E. Genersch, M. Aubert, Emerging and re-emerging viruses of the honey bee (Apis mellifera L.). Vet. Res. 41, 54 (2010). doi:10.1051/vetres/2010027 Medline
10. R. M. Johnson, J. D. Evans, G. E. Robinson, M. R. Berenbaum, Changes in transcript abundance relating to colony collapse disorder in honey bees (Apis mellifera). Proc. Natl. Acad. Sci. U.S.A. 106, 14790 (2009). doi:10.1073/pnas.0906970106 Medline
11. P. L. Bowen-Walker, S. J. Martin, A. Gunn, The transmission of deformed wing virus between honey bees (Apis mellifera L.) by the ecto-parasitic mite Varroa jacobsoni Oud. J. Invertebr. Pathol. 73, 101 (1999). doi:10.1006/jipa.1998.4807
12. D. Sumpter, S. J. Martin, The dynamics of virus epidemics in Varroa-infested honey bee colonys. J. Anim. Ecol. 73, 51 (2004). doi:10.1111/j.1365-2656.2004.00776.x
13. S. Gisder, P. Aumeier, E. Genersch, Deformed wing virus: replication and viral load in mites (Varroa destructor). J. Gen. Virol. 90, 463 (2009). doi:10.1099/vir.0.005579-0 Medline
14. S. J. Martin, A. Hogarth, J. van Breda, J. Perrett, A scientific note on Varroa jacobsoni Oudemans and the collapse of Apis mellifera colonies in the United Kingdom. Apidologie (Celle) 29, 369 (1998). doi:10.1051/apido:19980407
15. J. R. de Miranda, E. Genersch, Deformed wing virus. J. Invertebr. Pathol. 103 (suppl. 1), S48 (2010). doi:10.1016/j.jip.2009.06.012 Medline
2
16. E. Genersch et al., The German bee monitoring project: A long term study to understand periodically high winter losses of honey bee colonies. Apidologie (Celle) 41, 332 (2010). doi:10.1051/apido/2010014
17. D. Tentcheva et al., Prevalence and seasonal variations of six bee viruses in Apis mellifera L. and Varroa destructor mite populations in France. Appl. Environ. Microbiol. 70, 7185 (2004). doi:10.1128/AEM.70.12.7185-7191.2004 Medline
18. A. C. Baker, D. C. Schroeder, Occurrence and genetic analysis of picorna-like viruses infecting worker bees of Apis mellifera L. populations in Devon, South West England. J. Invertebr. Pathol. 98, 239 (2008). doi:10.1016/j.jip.2008.02.010 Medline
19. S. J. Martin, Trouble in paradise: Varroa spreads across Hawaii. Am. Bee J. 150, 381 (2010).
20. K. M. Roddy, L. A. Arita-Tsutsumi, History of honey bees in the Hawaiian Islands. J. Hawaiian Pacific Agriculture 8, 59 (1997).
21. C. Yue, M. Schröder, S. Gisder, E. Genersch, Vertical-transmission routes for deformed wing virus of honeybees (Apis mellifera). J. Gen. Virol. 88, 2329 (2007). doi:10.1099/vir.0.83101-0 Medline
22. J. Moore et al., Recombinants between Deformed wing virus and Varroa destructor virus-1 may prevail in Varroa destructor-infested honeybee colonies. J. Gen. Virol. 92, 156 (2011). doi:10.1099/vir.0.025965-0 Medline
23. C. Yue, E. Genersch, RT-PCR analysis of Deformed wing virus in honeybees (Apis mellifera) and mites (Varroa destructor). J. Gen. Virol. 86, 3419 (2005). doi:10.1099/vir.0.81401-0 Medline
24. J. H. Todd, J. R. de Miranda, B. V. Ball, Incidence and molecular characterization of viruses found in dying New Zealand honey bee (Apis mellifera) colonies infested with Varroa destructor. Apidologie (Celle) 38, 354 (2007). doi:10.1051/apido:2007021
25. P. G. Gregory, J. D. Evans, T. Rinderer, L. de Guzman, Conditional immune-gene suppression of honeybees parasitized by Varroa mites. J. Insect Sci. 5, 7 (2005). Medline
26. M. Navajas et al., Differential gene expression of the honey bee Apis mellifera associated with Varroa destructor infection. BMC Genomics 9, 301 (2008). doi:10.1186/1471-2164-9-301 Medline
27. X. Yang, D. L. Cox-Foster, Impact of an ectoparasite on the immunity and pathology of an invertebrate: Evidence for host immunosuppression and viral amplification. Proc. Natl. Acad. Sci. U.S.A. 102, 7470 (2005). doi:10.1073/pnas.0501860102 Medline
28. C. Ratti et al., Detection and relative quantitation of soil-borne cereal mosaic virus (SBCMV) and Polymyxa graminis in winter wheat using real-time PCR (TaqMan). J. Virol. Methods 122, 95 (2004). doi:10.1016/j.jviromet.2004.08.013 Medline
3
29. R. Siede, M. König, R. Büchler, K. Failing, H.-J. Thiel, A real-time PCR based survey on acute bee paralysis virus in German bee colonies. Apidologie (Celle) 39, 650 (2008). doi:10.1051/apido:2008044
30. E. Genersch, Development of a rapid and sensitive RT-PCR method for the detection of deformed wing virus, a pathogen of the honeybee (Apis mellifera). Vet. J. 169, 121 (2005). doi:10.1016/j.tvjl.2004.01.004 Medline
31. O. Berényi et al., Phylogenetic analysis of deformed wing virus genotypes from diverse geographic origins indicates recent global distribution of the virus. Appl. Environ. Microbiol. 73, 3605 (2007). doi:10.1128/AEM.00696-07 Medline
32. K. Tamura et al., MEGA5: Molecular evolutionary genetics analysis using maximum likelihood, evolutionary distance, and maximum parsimony methods. Mol. Biol. Evol. 28, 2731 (2011). doi:10.1093/molbev/msr121 Medline
33. N. Zioni, V. Soroker, N. Chejanovsky, Replication of Varroa destructor virus 1 (VDV-1) and a Varroa destructor virus 1-deformed wing virus recombinant (VDV-1-DWV) in the head of the honey bee. Virology 417, 106 (2011). doi:10.1016/j.virol.2011.05.009 Medline
34. P. Chantawannakul, L. Ward, N. Boonham, M. A. Brown, A scientific note on the detection of honeybee viruses using real-time PCR (TaqMan) in Varroa mites collected from a Thai honeybee (Apis mellifera) apiary. J. Invertebr. Pathol. 91, 69 (2006). doi:10.1016/j.jip.2005.11.001 Medline
35. R. Kajobe et al., First molecular detection of a viral pathogen in Ugandan honey bees. J. Invertebr. Pathol. 104, 153 (2010). doi:10.1016/j.jip.2010.02.007 Medline
36. J. R. de Miranda et al., Genetic characterization of slow bee paralysis virus of the honeybee (Apis mellifera L.). J. Gen. Virol. 91, 2524 (2010). doi:10.1099/vir.0.022434-0 Medline
37. M. Allen, B. V. Ball, The incidence and world distribution of honey bee viruses. Bee World 77, 141 (1996).