Embed Size (px)
Citation preview

advances.sciencemag.org/cgi/content/full/4/4/e1700988/DC1
Supplementary Materials for
Fossil scales illuminate the early evolution of lepidopterans and
structural colors
Qingqing Zhang, Wolfram Mey, Jörg Ansorge, Timothy A. Starkey, Luke T. McDonald,
Maria E. McNamara, Edmund A. Jarzembowski, Wilfried Wichard, Richard Kelly, Xiaoyin Ren, Jun Chen,
Haichun Zhang, Bo Wang
Published 11 April 2018, Sci. Adv. 4, e1700988 (2018)
DOI: 10.1126/sciadv.1700988
This PDF file includes:
fig. S1. Jurassic Lepidoptera from United Kingdom and China.
fig. S2. SEM image of forewing scales on Kazakhstan specimen PIN2239/607.
fig. S3. Jurassic Lepidoptera from Germany.
fig. S4. SEM image of forewing scales on Grimmen specimen LGA1500.
fig. S5. Reflectance color maps.
fig. S6. Structural color of extant Micropterigidae.
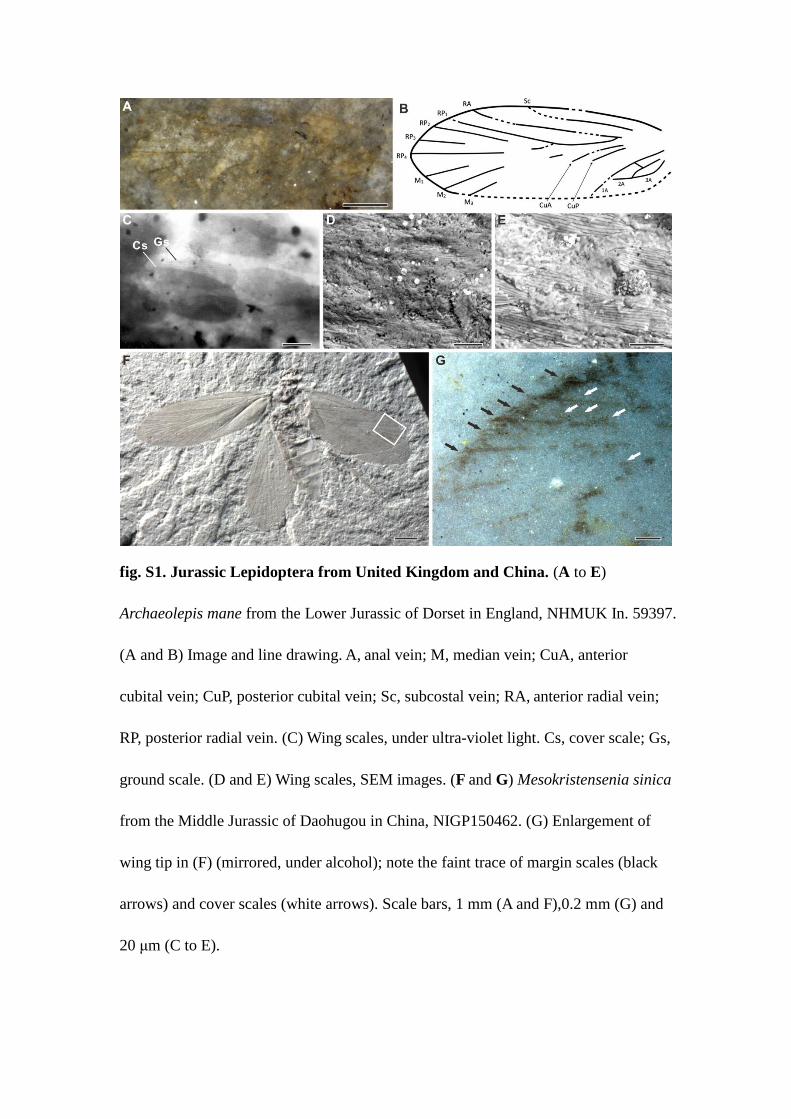
fig. S1. Jurassic Lepidoptera from United Kingdom and China. (A to E)
Archaeolepis mane from the Lower Jurassic of Dorset in England, NHMUK In. 59397.
(A and B) Image and line drawing. A, anal vein; M, median vein; CuA, anterior
cubital vein; CuP, posterior cubital vein; Sc, subcostal vein; RA, anterior radial vein;
RP, posterior radial vein. (C) Wing scales, under ultra-violet light. Cs, cover scale; Gs,
ground scale. (D and E) Wing scales, SEM images. (F and G) Mesokristensenia sinica
from the Middle Jurassic of Daohugou in China, NIGP150462. (G) Enlargement of
wing tip in (F) (mirrored, under alcohol); note the faint trace of margin scales (black
arrows) and cover scales (white arrows). Scale bars, 1 mm (A and F),0.2 mm (G) and
20 μm (C to E).
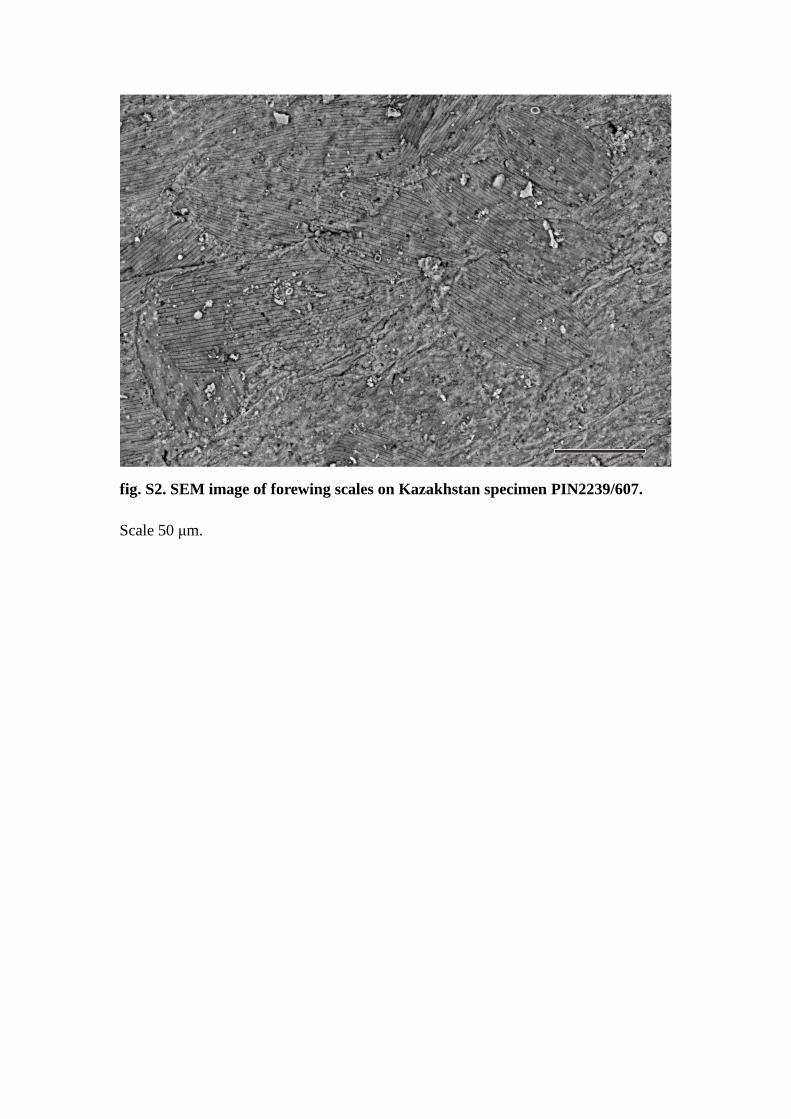
fig. S2. SEM image of forewing scales on Kazakhstan specimen PIN2239/607.
Scale 50 μm.
fig. S3. Jurassic Lepidoptera from Germany. (A−D) LGA1500. (B) Enlargement of
forewing in (A), SEM image. (C) Enlargement of wing scale in (B), SEM image. (D)
Enlargement of wing scale in (C), SEM image. (E and F) LGA968. (F) Enlargement
of forewing in (E). (G and H) LGA2150. (H) Enlargement of forewing in (G). Scale
bars, 1 mm (A, E, and G), 0.2 mm (F and H), 20 μm (B), 2 μm (C) and 1 μm (D).
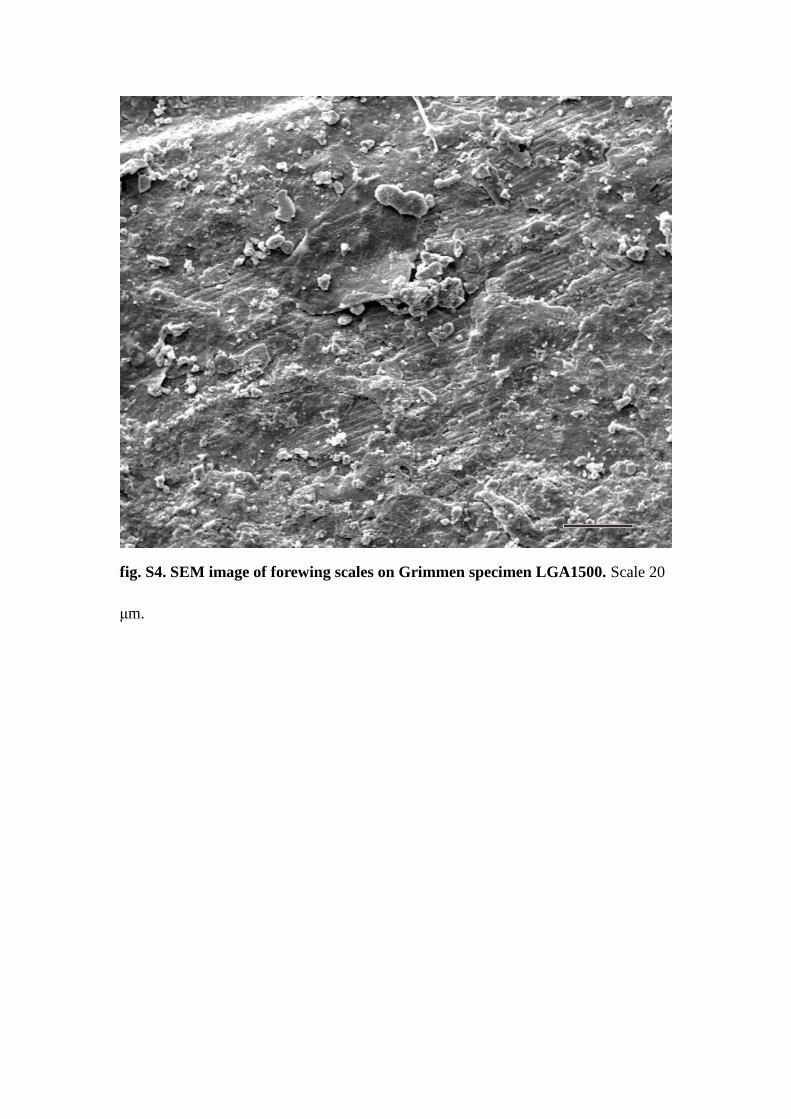
fig. S4. SEM image of forewing scales on Grimmen specimen LGA1500. Scale 20
μm.

fig. S5. Reflectance color maps. Reflectance color maps showing the unpolarized
zeroth-order reflectance (i.e. the solid black plot in Fig. 5B) as a function of: (A)
Scale thickness; (B) Primary ridge height; (C) Primary ridge pitch. The varied
structural parameters are labeled in the model schematic (Fig. 5A). The shift of
spectral features in response to varying structural parameters can be tracked. The
numeric values of the color bars correspond to the reflected intensity.

fig. S6. Structural color of extant Micropterigidae. (A) Micropterix aruncella,
female (above) and male (below). (B) M. calthella, female (above) and male (below).
Scale bars, 1 mm.


![[PPT]Hypersensitivitym-learning.zju.edu.cn/.../uploadfile/20140918092159820.ppt · Web viewHypersensitivity (超敏反应) Qingqing Wang Institute of Immunology Zhejiang University](https://img.pdfslide.net/doc/110x75/5aa9eb4b7f8b9a7c188d7298/ppthypersensitivitym-viewhypersensitivity-qingqing-wang-institute.jpg)