Embed Size (px)
Citation preview

www.sciencemag.org/cgi/content/full/336/6086/1314/DC1
Supplementary Materials for
Interactions Between Commensal Fungi and the C-type Lectin Receptor
Dectin-1 Influence Colitis
Iliyan D. Iliev, Vincent A. Funari, Kent D. Taylor, Quoclinh Nguyen, Christopher N. Reyes, Samuel P. Strom, Jordan Brown, Courtney A. Becker, Phillip R. Fleshner,
Marla Dubinsky, Jerome I. Rotter, Hanlin L. Wang, Dermot P. B. McGovern, Gordon D. Brown, David M. Underhill
*To whom correspondence should be addressed. E-mail: [email protected]
Published 8 June 2012, Science 336, 1314 (2012)
DOI: 10.1126/science.1211789
This PDF file includes:
Materials and Methods Supplementary Text Figs. S1 to S22 Tables S1 and S2 Full References

2
Materials and Methods Mice and Fungal strains
6-10 weeks old female C57BL/6J mice were purchased from Jackson Laboratories (Bar Harbor, ME). Clec7a-/- generated as previously described (16) were crossed 9 generations onto the C57BL/6J background. Progeny homozygous for Clec7a-/- and wild-type littermates aged 7–12 weeks were used where indicated. All animals were housed under specific pathogen-free conditions at the Cedars-Sinai Medical Center and experiments were performed after prior approval by the Institutional Animal Care and Use Committee at Cedars-Sinai Medical Center and conformed to the policies and procedures of the Comparative Medicine Department.
Candida tropicalis (ATCC 750) and Saccharomyces cerevisiae (ATCC 201388) were obtained directly from the American Type Culture Collection (Manassas, VA). Saccharomycopsis fibuligera was isolated directly from murine feces and identified by rDNA sequencing. Yeasts were cultured in aerobic conditions on Sabouraud Dextrose Broth (SDB; EMD Chemicals) at 37oC. In situ staining of intestinal fungi
OCT-embedded intestinal specimens were sectioned, mounted on microscope slides and then incubated for 40 min in PBS containing 2% FCS. Murine soluble Dectin-1 (sDec-1) was generated and biotin-labeled as previously described (21). sDec-1 (10 μg/ml) was fluorescently labeled with streptavidin-Alexa 647 (2 μg/ml, Invitrogen) (sDec-1-Alexa647), and intestinal sections were stained for 1hr. To block Dectin-1 interaction, sDec-1-Alexa647 was incubated with 1 μg/ml laminarin (soluble β-glucan from Laminaria digitata, Sigma) and intestinal sections were stained as previously described. Alternatively, intestinal sections were stained with FITC-conjugated rabbit anti-Candida polyclonal antibody (Meridian Life Science, Cincinnati, OH). We found that this “anti-Candida antibody” was cross-reactive with a wide variety of fungal species including C. tropicalis, C. albicans, S. cerevisiae, S. fibuligera and A. fumigatus, but did not stain bacteria (E. coli, C. jejuni, S. aureus). Therefore throughout this study we have referred to the antibody as an “anti-fungal antibody”. Slides were rinsed with PBS and stained for 5 min with 0.1 µg/ml 4',6-diamidino-2-phenylindole (DAPI, Invitrogen) and overlaid with mounting medium (Vectashield; Vector, Burlingame, CA). Slides were examined using a Zeiss Axio Observer Fluorescence microscope. All compared images were collected and processed identically. Colons from Fluconazole (0.5 mg/ml for 2 weeks in the drinking water) treated mice were used in control staining. Staining of fungi in the feces
Fecal pellets were collected, homogenized in PBS containing 2% FCS and filtered through a mesh to obtain homogeneous fecal suspensions. Fecal suspensions were stained for 1 hour with sDec-1-Alexa647, anti-fungal FITC-conjugated antibody and DAPI as previously described. Control suspensions were stained with laminarin blocked sDec-1-Alexa647, FITC-labeled rabbit-IgG-isotype control antibody and DAPI. Data were analyzed by flow cytometry. To visualize intestinal fungi bound to Dectin-1, fecal samples were stained with sDec-1-Alexa647, fixed in 4% formaldehyde and sorted using

3
a FACSAria (BD Biosciences). Sorted fungal cells were viewed using a TCS SP5 laser-scanning confocal microscope (Leica). Detection of anti-Saccharomyces cerevisiae antibodies (ASCA)
For the induction of ASCA antibody responses to intestinal fungal antigens, mice were kept on 2.5% DSS supplemented water for 2 cycles of 7 days each. After each cycle mice were given regular water for 2 weeks. Then mice were sacrificed, blood was collected and blood serum was obtained. ELISA detection of ASCA specific IgM and IgG was carried out as previously described (26). Samples were read at 405 nm on a Molecular Devices E-Max microtiter plate reader (Menlo Park, CA).
Candida killing assay
Intestinally conditioned dendritic cells (DCs) were prepared from WT and Clec7a-/- mice as previously described (27). Candida tropicalis (1×10⁵) was reuspended in RPMI 1640 supplemented with 5% fetal bovine serum (FBS) and added onto 1×10⁵ DCs, and incubated at 37°C in a 5% CO2 incubator for 1 hour. Wells were washed and fresh media containing fluconazole (300 μg/ml) was added. At 6 hours and 18 hours, DCs were washed three times with PBS, lysed in water, and C. tropicalis CFU were calculated by plating on SDB agar.
Induction of DSS colitis and histopathology
WT and Clec7a-/- mice were co-housed for three weeks prior the experiments. Alternatively, WT and Clec7a-/- littermates were used where indicated. For the induction of colitis, mice were given drinking water supplemented with 2.5% (w/v) Dextran sulphate sodium (DSS, MP Biomedicals, LLC, Aurora, OH) for 7 days and sacrificed at day 12. For ablation of intestinal fungi, mice were given Fluconazole (0.5 mg/ml, Sigma) in the drinking water for total of 14 days starting 2 days prior the induction of DSS colitis. In some experiments, prior and upon colitis induction, mice were supplemented every other day with four doses (1x10⁸ yeast/mouse/dose) of Candida tropicalis or Saccharomycopsis fibuligera as shown in Supplementary Figure 18.
Body weight, gross blood, and stool consistency were analyzed on a daily basis. Paraffin-embedded colon tissues were sectioned and stained with H&E for pathology assessment. Assessment of the severity of colitis was measured by the disease activity index (DAI) as previously described (28).
Antibiotic treatment and microbiota reconstitution
For depletion of intestinal microbiota, mice were given an antibiotic cocktail, containing ampicillin (1 g/l; Sigma, St. Louis, MO), vancomycin (500 mg/l, Sigma), neomycin sulfate (1 g/l, Sigma), metronidazole (1 g/l, Sigma) and fluconazole (0.5 mg/ml, Sigma) in drinking water for 3 weeks. Fecal pellets were collected and tested for microbiota depletion by culture method (aerobic and anaerobic), sDec-1-Alexa647 staining (to evaluate depletion of fungi) and quantitative PCR. Microbiota-depleted mice were both, orally gavaged and intrarectally administrated with homogenates prepared from WT or Clec7a-/- feces, and 10 days after reconstitution DSS administration was started.

4
Isolation of intestinal mucosa, colonic cells and large intestine lamina propria (LI-LP) lymphocytes
LI-LP lymphocytes were isolated as previously described (29) with some modifications. Briefly, colons were isolated, opened longitudinally, washed of fecal contents and then cut into 1 cm pieces. Intestinal pieces were transferred into HBSS medium (Sigma), supplemented with 5% fetal bovine serum (FBS) and 2 mM EDTA, and were shaken for 15 min at 37°C. The suspensions were filtered through a mesh and the filtrate containing the mucosa and mucosa-associated microflora was used further for DNA isolation. The remaining tissue was washed, cut in small pieces and subsequently incubated in digestion medium consisting of RPMI 1640, 5% FBS, 0.5 mg/ml collagenase type VIII (Sigma), 5 U/ml DNase (Roche Diagnostics), 100 IU/ml penicillin and 100 μg/ml streptomycin for 30 min at 37°C by gentle shaking. The cell suspensions were filtered through a mesh, and then centrifuged at 1300 rpm. Cell suspensions were cultured overnight and TNF-α production by colonic cells was measured by ELISA (BioLegend, San Diego, CA).
The rest of the pellets were resuspended in 6 ml of 40% Percoll (GE Healthcare Bio-Sciences AB, Uppsala, Sweden), overlaid on 3 ml of 70% Percoll and centrifuged at 2000 rpm for 20 min at 25°C. The interface cells were collected and used as LI-LP lymphocytes. Lymphocyte stimulation and cytokine analysis
Cell suspensions were prepared from MLNs and the LI-LP as described above. Cells were incubated with 50 ng/ml phorbol 12-myristate 13-acetate (PMA; Sigma-Aldrich), 500 ng/ml ionomycin (Sigma-Aldrich) and 10 μg/ml Brefeldin A (BFA; Sigma-Aldrich) in complete RPMI media at 37° C for 6 h. After surface staining with CD4, cells were permeabilized and intracellular cytokine staining was performed using APC-labeled anti-IFN-γ mAb (XMG1.2; BD Biosciences) and PE-labeled anti-IL-17 mAb (TC11-18H10; BD Biosciences) according to the manufacturer's instructions. Flow cytometry was performed using a LSRII (BD Biosciences) and data were analyzed with FlowJo software (TreeStar Inc.).
For detection of cytokines by ELISA, MLN cells and LI-LP lymphocytes were stimulated with 10 μg/ml plate bound anti-CD3 and anti-CD28 antibodies (BioLegend, San Diego, CA). Supernatants were collected after 36 hrs and analyzed for IFN-γ and IL-17 production by ELISA (BioLegend, San Diego, CA).
DNA isolation, fungal and bacterial rDNA gene quantitative analysis
Intestinal mucosa from ileum, caecum, proximal and distal colon was obtained as described above. Feces were collected from non-treated or DSS treated C57BL/6J and Clec7a-/- mice. Additionally, feces were collected from BALB/c mice, 129S2/Sv mice, Rat, Guinea Pig, Pig, Rabbit and Dog, all breed and housed in the animal facility of Cedars-Sinai medical center. Human fecal samples from 3 healthy donors were collected after obtaining informed consent and immediately frozen. Fecal or mucosal samples were resuspended in 50 mM Tris buffer (pH7.5) containing 1 mM EDTA, 0.2% β-mercaptoethanol (Sigma) and 1000 U/ml of lyticase (Sigma). The mix was incubated at 37oC for 30 min and fungal genomic DNA was isolated by using QIAamp DNA Stool Mini Kit (Qiagen) according to the manufacturer's instructions.

5
For evaluation of fungal rDNA in feces, 80 ng of total fecal DNA was used as a template for qPCR analysis. The following anti-fungal primers were used:
Target Forward Reverse 18S rDNA 5’- ATTGGAGGGCAAGTCTGGTG -3 5’- CCGATCCCTAGTCGGCATAG -3’ ITS1-2 5’-CTTGGTCATTTAGAGGAAGTAA-3 5’- GCTGCGTTCTTCATCGATGC-3’ C. tropicalis 5’-TTTGGTGGCGGGAGCAATCCT-3 5’- CGATGCGAGAACCAAGAGATCCGT-3’ S. fibuligera 5’- CTGCGCTTAACTGCGCGGTT-3’ 5’-TGCGAGAACCAAGAGATCCGTTGC-3’
For detection of mucosa-associated fungi, quantitative PCR was performed on DNA
isolated from intestinal mucosa using fungal-specific primers listed above. Relative quantity was calculated by the ΔCt method and normalized to the amount of β-actin (actb, for mucosal samples) or to the weight of the sample and the amount of total DNA used (for the fecal samples). The following β-actin (actb) primers were used: forward primer 5’-ATGACCCAGATCATGTTTGA-3’ and reverse primer 5’- TACGACCAGAGGCATACAG-3’.
Microbiome sequencing analysis Mouse fungal and bacterial microbiomes were interrogated using Roche 454 and an Illumina GAIIxe next generation sequencing platforms. DNA was isolated from feces of co-housed or littermate mice before and after DSS treatment, and from a sample of food (Mouse Diet 5015; LabDiet, St. Louis, MO) using the protocol described above.
454 library generation and sequencing Fungal ITS1-2 regions were amplified by PCR using primers modified to include
sample barcodes and sequencing adaptors (22). DNA was amplified using the following PCR protocol: Initial denaturation at 94oC for 10 min, followed by 40 cycles of denaturation at 94oC for 30 s, annealing at 55oC for 30 s, and elongation at 72oC for 2 min, followed by an elongation step at 72oC for 30 min. The PCR products containing ITS fungal regions were purified and subjected to emulsion PCR and pyrosequencing using a 454 GS FLX System (Roche Diagnostics GmbH/454 Life Sciences Corporation) at the UCLA Genotyping and Sequencing Core.
Illumina library generation Fecal DNA was amplified using the PCR protocol described above using the
following primers (22), (30):
Amplicon Forward Reverse ITS1-2 5’-CTTGGTCATTTAGAGGAAGTAA-3’ 5’- GCTGCGTTCTTCATCGATGC-3’ 16S (8F&R357) 5’-AGAGTTTGATCMTGGCTCAG-3’ 5’-CTGCTGCCTYCCGTA-3’
ITS1-2 and Bacterial 16S amplicons were subjected to a modified TruSeq protocol
(version 2). Unique duplexed primers containing paired end adapters and indexes were ligated to the 1 μg of ITS1-2 or 16S amplicons respectively. Library enrichment was performed with 10 cycles of PCR and purification was performed using Agencourt Ampure Magnetic Beads (Beckman). All libraries were subjected to quality control using

6
qPCR, DNA 1000 Bioanalyzer (Agilent), and Qubit (Life Technologies) to validate and quantitate library construction prior to preparing a Paired End flow cell. Samples were randomly divided among flow cells to minimize sequencing bias. Clonal bridge amplification (Illumina) was performed using a cBot (Illumina). 100x150 bp sequencing-by-synthesis was performed. At 150 bps, 89% of bps were above Q30, exceeding Illumina’s standard sequence quality metric.
Data Analysis
454 data analysis: Raw sequence data were identified by their unique barcodes for each dataset and tabulated using QIIME (31);Unlike bacteria, the range of sequence divergence both between and within species of fungi may differ <3% in ITS-2 sequence, approaching the error rate of the 454 and making the delineation of sequence reads into OTUs less precise (32).To avoid spurious OTU clustering using 454 data, we used an alternate approach to defining OTUs in which each unique sequence read was aligned to a previously described fungal ITS reference database (32) using BLAST (33). A custom Perl script was then used to parse the alignment results to identify alignments with ≥ 98% identity over the entire sequence read. Reads failing to align at this stringent level were discarded. The alignment results were then tabulated across all reads, using the accession identifier of the ITS reference sequences as surrogate OTUs. Over 85% of our sequences aligned with at least 98% identity to a reference sequence, which corresponds well to both the 98% mapping cut-off previously used in the analysis of the fungal mycobiome (22) and to our own analysis of the complete dataset. Finally, the OTUs were manually curated to establish species names.
For Illumina bacterial and fungal analysis, because of the abundance of Illumina reads and higher overall sequence quality of the reads, we used the QIIME package with minimal customization. Bcl files were de-multiplexed using cassava (v1.8). qSeq files were converted to FASTA files for QIIME using SAMTOOLS (34).QIIME was installed on a 400 node dual processor high performance cluster each with 4 GB of RAM.
Each 150bp fungal sequence was then BLASTed against the reference database using blastn and a cut off for a 99% nt identity match (>148/150 bps). Each result was summed across unique GenBank accession numbers. For bacterial biome analysis, 150bp single end reads from each sample were collapsed into OTUs using UCLUST and annotated.
Rarefaction curves
Using QIIME we performed rarefaction analysis. The original OTU table was randomly subsampled (rarefied) to create a series of subsampled OTU tables. Alpha diversity was calculated on each sample using the OTU table and a variety of metrics (PD whole tree, observed species, etc). The results of the alpha diversity were collated into a single file and the number of species identified for each sample versus the depth of subsampling was plotted.
Phylogenic Analysis
Multiple alignments were created for OTU sequences that were found in murine feces or in the mouse food. Sequences were obtained using the accession numbers in the dendrograms. Multiple alignments were performed on these sequences using Clustal W2
7
(35) with a GAP open penalty of 5 and gap extension penalty of 1. Distances from the multiple alignments were then analyzed using Unweighted Pair Group Method with Arithmetic Mean (UPGMA) clustering creating dendrograms which were populated at each node with the distance between each pair wise relationship.
Real Time PCR
Tissue samples from the proximal and distal colon were isolated and homogenized. RNA was isolated by using RNeasy Mini Kit (Qiagen) and reverse transcribed. Real-time RT-PCR analyses were done on the Applied Biosystems 7500 Fast Real-Time PCR System with the SYBR Green PCR kit as instructed by the manufacturer (Applied Biosystems). The amount of mRNA was normalized to the amount of rpl32 mRNA, a housekeeping control gene that does not change substantially during gut inflammation which we have previously used for this purpose (27), (29). Samples were analyzed for gene expression using the following primers:
Gene Forward Reverse rpl32 5’-AAGCGAAACTGGCGGAAAC-3 5’- TAACCGATGTTGGGCATCAG-3’ Il23a 5’-GAACAAGATGCTGGATTGCAGAG-3 5’-TGTGCGTTCCAGGCTAGCA-3’ Il17a 5’- CAGGACGCGCAAACATGA-3’ 5’-GCAACAGCATCAGAGACACAGAT-3’ Tnfa 5’- TCCAGGCGGTGCCTATGT-3’ 5’- CACCCCGAAGTTCAGTAGACAGA-3’ defa3-defa6
5’- TCCTCCTCTCTGCCCTYGTCCTG-3’ 5’- AGACACAGCCTGGTCSTCTTCC-3’
cxcl2 5’-AACATCCAGAGCTTGAGTGTGA-3’ 5’- TTCAGGGTCAAGGCAAACTT-3’ Statistics
Unpaired-Student’s t-test was used to evaluate differences between experimental groups. Multiple groups (4–10 mice/group) were analyzed by one way analysis of variance (one way ANOVA) followed by a Tukey multiple comparisons test. Statistical analysis was performed using GraphPad Prism software (Graphpad Software Inc., San Diego, CA).
Study of medically refractory ulcerative colitis
Ulcerative colitis subjects were recruited at the Inflammatory Bowel Disease Center at Cedars-Sinai Medical Center following informed patient consent and Cedars Sinai-Medical Center Institutional Review Board approval. Details of UC diagnosis was based on standard clinical, endoscopic, and histological findings; details have been previously described along with details of the definition of medically refractory ulcerative colitis (MRUC) (25). In brief, MRUC subjects required colectomy for severe disease refractory to medical therapies. For the MRUC group, time from diagnosis to date of colectomy was obtained; for the non-MRUC group time from diagnosis to last follow-up visit was obtained. Demographics for these subjects have been previously published; in general the median follow-up of the non-MRUC group was twice that of time to colectomy of the MRUC group (25). Healthy controls were obtained from the Cardiovascular Health Study (CHS), a population-based cohort study of risk factors for cardiovascular disease and stroke in adults 65 years of age or older, recruited at four field centers (36, 37) 5,201 predominantly Caucasian individuals were recruited in 1989-1990 from random samples of Medicare eligibility lists, followed by an additional 687 African-Americans recruited

8
in 1992-1993 (total n= 5,888). CHS was approved by the Institutional Review Board at each recruitment site, and subjects provided informed consent for the use of their genetic information. A total of 3208 Caucasian non-IBD control subjects who underwent GWAS were included in these analyses. African-American CHS participants were excluded from analysis due to insufficient number of ethnically-matched cases. Genotyping was performed at the Medical Genetics Institute at Cedars-Sinai Medical Center using the Illumina HumanCNV370 platform (Illumina, San Diego, CA). Five SNPs passing quality control spanned the CLEC7A gene (Supplementary Figure 23A); a total of 806 UC subjects with complete CLEC7A genotyping data, MRUC determination, and time to surgery or to last visit and were included in these analyses (MRUC n= 315; non-MRUC n= 491).
The rs2078178-rs16910631 haplotype was identified by loading the SNP data into Haploview v4 and testing for association (Supplementary Figure 23B). Assignment of haplotypes for final analysis employed PHASE v2.3 (38, 39). The number of each haplotype assigned is as follows:
Haplotype number assigned 1 AG 430 2 AA 45 3 GG 1314 4 GA 43
The greatest uncertainty in the assignment was when the subject was heterozygous
for both markers. These were removed from the analysis. Haplotypes formed with probability > 0.99 were tested for association with MRUC
by logistic regression and Fisher’s Exact Test, and for association with time to surgery by fitting with a Cox proportional hazards model (Survival package in R) (40). Haplotypes listed as “Other combinations” were those that could not be reliably determined (posterior p<0.95). These were not included in the logistic regression or Cox proportional hazards analyses.
Supplemental Acknowledgements:
We acknowledge Cardiovascular Health Study for providing us with healthy controls for performing the genetic analysis on CLEC7A: This CHS research was supported by contracts HHSN268201200036C, N01-HC-85239, N01-HC-85079 through N01-HC-85086, N01-HC-35129, N01 HC-15103, N01 HC-55222, N01-HC-75150, N01-HC-45133, and grant HL080295 from the National Heart, Lung, and Blood Institute (NHLBI), with additional contribution from the National Institute of Neurological Disorders and Stroke (NINDS). Additional support was provided through AG-023629, AG-15928, AG-20098, and AG-027058 from the National Institute on Aging (NIA). A full list of principal CHS investigators and institutions can be found at http://www.chs-nhlbi.org/pi.htm. DNA handling and genotyping was supported in part by the National Center for Research Resources, Grant UL1RR033176, and is now at the National Center for Advancing Translational Sciences, Grant UL1TR000124, and National Institute of Diabetes and Digestive and Kidney Diseases grant DK063491 to the Southern California Diabetes Endocrinology Research Center.
9
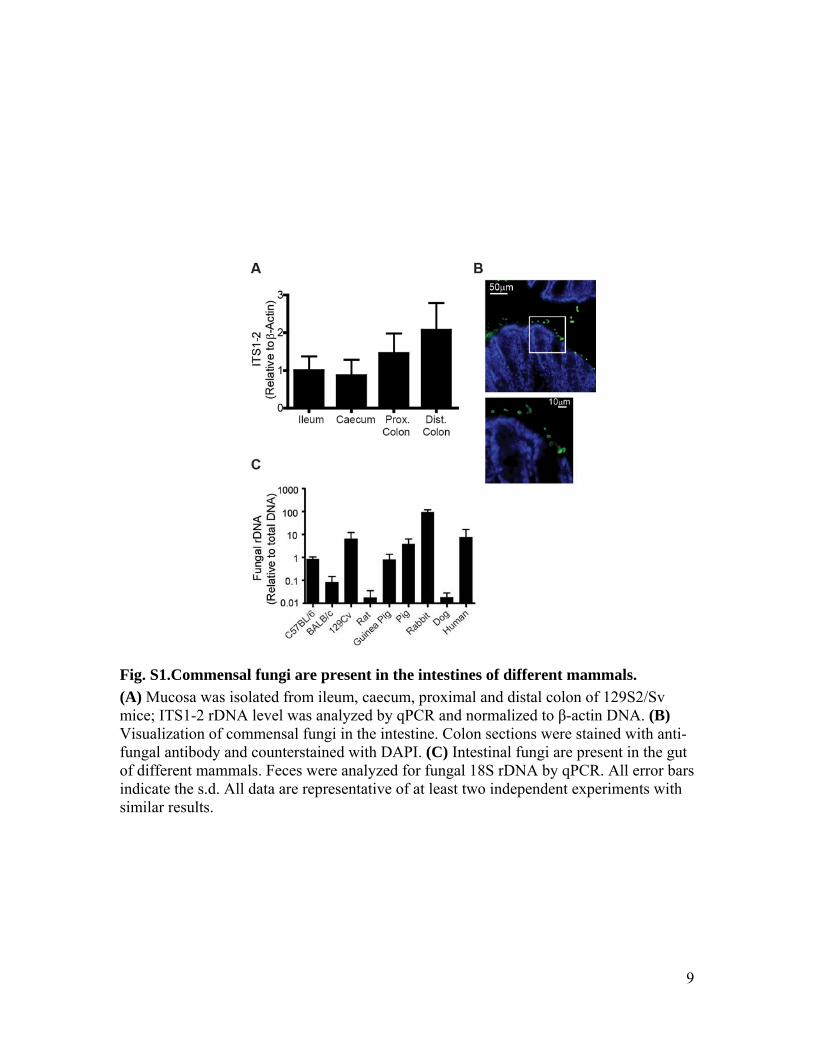
Fig. S1.Commensal fungi are present in the intestines of different mammals. (A) Mucosa was isolated from ileum, caecum, proximal and distal colon of 129S2/Sv mice; ITS1-2 rDNA level was analyzed by qPCR and normalized to β-actin DNA. (B) Visualization of commensal fungi in the intestine. Colon sections were stained with anti-fungal antibody and counterstained with DAPI. (C) Intestinal fungi are present in the gut of different mammals. Feces were analyzed for fungal 18S rDNA by qPCR. All error bars indicate the s.d. All data are representative of at least two independent experiments with similar results.

10
Fig. S2. Soluble β-glucan blocks binding of Dectin-1 to intestinal fungi. Colon sections were stained with a soluble Dectin-1 probe (sDEC-1) in the presence or absence of soluble β-glucan (laminarin) and counterstained with DAPI. The soluble Dectin-1 probe (red) binds to abundant luminal fungi, and this interaction is completely blocked by soluble glucan, indicating that the probe is specific.

11
Fig. S3. Fluconazole treatment of mice depletes intestinal fungi. Mice were treated or not with fluconazole for 2 weeks, and colon sections were stained with a soluble Dectin-1 probe (sDEC-1) and counterstained with DAPI. The soluble Dectin-1 probe (red) binds to abundant luminal fungi in untreated animals, but fluconazole treatment substantially reduces the presence of fungi.

12
Fig. S4. Fungi and bacteria coexist in the gut. Colon sections were stained with an anti-fungal antibody (green, upper panels) or sDectin-1 (sDEC-1, red, lower panels) and counterstained with DAPI. Images were collected with long exposures to reveal DAPI binding to plentiful intestinal bacteria. Fungi are abundant and in close proximity with commensal bacteria.

13
Fig. S5. Dectin-1 and an anti-fungal antibody specifically identify a substantial fungal population in feces. Fecal pellets were homogenized and labeled with soluble Dectin-1 (sDEC-1) and an anti-fungal antibody (α-fungi) and briefly stained with DAPI. The samples were analyzed by flow cytometry, gating on the DAPI-intermediate and -low fractions (lower plots, sample 1 & 2 are from two separate representative mice). To assess specificity of staining by flow cytometry, control feces were stained with sDEC-1 in the presence of soluble glucan and an isotype control antibody (upper left panel). Also feces from a mouse treated with fluconazole were stained (upper right panel). The data show that both probes identify the same population of fungi in feces.

14
Fig. S6. Enhanced production of IL-17 and IFN-γ by CD4+ T cells in the intestines of Clec7a-/- mice after DSS. WT and Clec7a-/- mice were treated with 2.5% DSS for 7 days and kept on water for 4 additional days. (A) LI-LP cells were isolated and stimulated in vitro with PMA, ionomycin and Brefeldin A. Cells were permabilized and stained with anti-CD4, anti-IL-17 and anti-IFN-γ antibodies. Samples were analyzed using FACS. Dot plots show the percentage of IL-17 and IFN-γ producing CD4+ T cells isolated from large intestine lamina propria (LI-LP) and mesenteric lymph nodes (MLN) on day 11. (B) Graphs represent the frequency of IL-17+ and IFN-γ+ cells inside the CD4+ T cell population. (C) LI-LP and MLN cells were cultured with antibodies against CD3 and CD28. The production of IL-17 and IFN-γ was measured by ELISA. Each symbol represents a different mouse. ** P < 0.01. Data are from one experiment representative of three.

15
Fig. S7. Dectin-1 regulates severity of colitis in co-housed mice. Mice were co-housed for 3 weeks before DSS treatment. (A) Body weight in wild type (WT) and Clec7a-/- mice treated with 2.5% DSS for 7 days and kept on water for 4 additional days. Histology score (B) on haematoxylin and eosin stained colon sections (C) was determined on day 11. (D) LI-LP and MLN cells were cultured with antibodies against CD3 and CD28. The production of IL-17 and IFN-γ was measured by ELISA. (E) The expression of tnfa (TNF-α), Il23a (IL-23p19) and Il17a (IL-17A) in colons of WT and Clec7a-/- mice 4 days after DSS treatment was measured by qPCR and normalized to Rpl32 mRNA. Each symbol represents a different mouse. One of four independent experiments is shown. Error bars, s.d., * P < 0.05, ** P < 0.01.

16
Fig. S8. Bacterial phyla analysis of feces from WT and Clec7a-/- mice. DNA was isolated from feces of WT and Clec7a-/- littermates (n=5) and subjected to Illumina GA sequencing. (A) Rarefaction curve of phylogenic diversity in fecal samples from WT and Clec7a-/- mice. The curve depicts the number of operational taxonomic units (OTU) observed at different sampling depths where the X axis is the number of reads in the V2/V3 region and the Y axis is the number of OTUs observed. (B) Quantitative analysis of the major bacterial phyla in wild type and Clec7a-/- mice. Illumina GA data were analyzed and presented as relative percentage of dominant bacterial phyla.

17
Fig. S9. Fecal transplant does not rescue Clec7a-/- mice. WT and Clec7a-/- mice were given an antibiotic cocktail including fluconazole for 3 weeks, transplanted as indicated (red) with fecal microflora from WT or Clec7a-/- mice and treated with 2.5% DSS for 7 days. (A) To access microflora depletion, feces were collected and plated before and after antibiotic treatment (n=10). (B) Colitis progression and severity were assessed by measuring body weight during treatment, and (C) TNF-α production in the colon on day 11. Each symbol represents a different mouse. One of two independent experiments is shown. Error bars, s.d., * P < 0.05, ** P < 0.01.
18
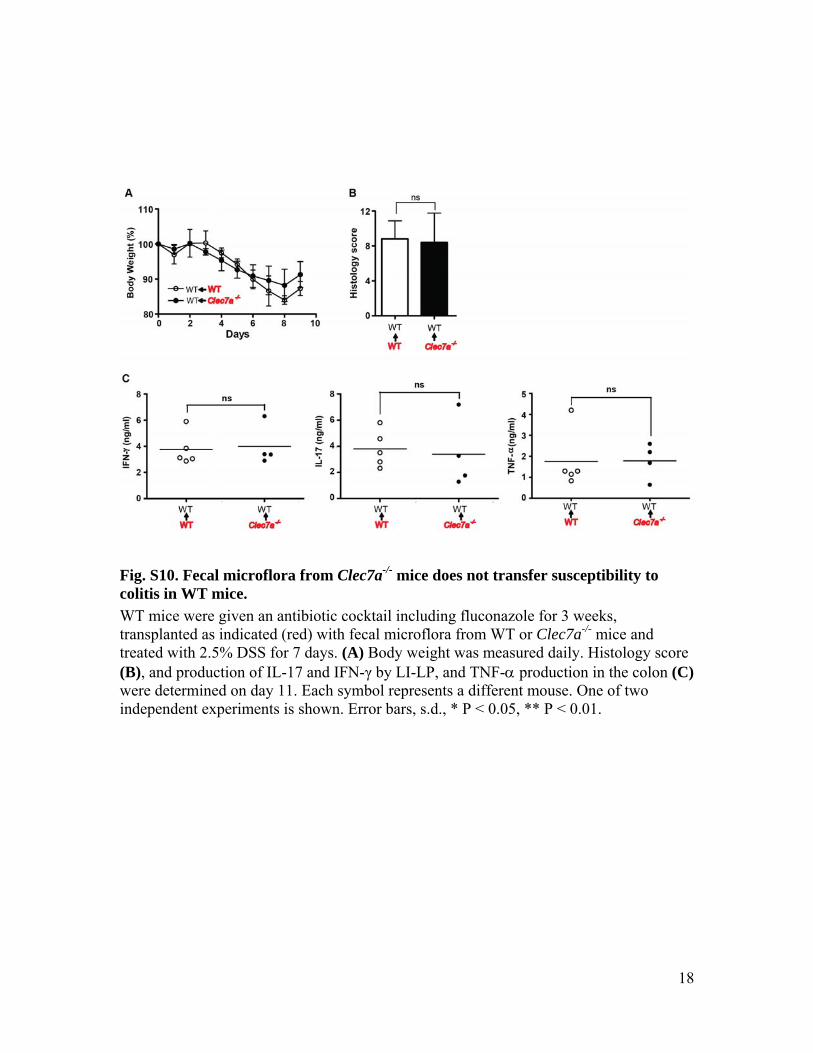
Fig. S10. Fecal microflora from Clec7a-/- mice does not transfer susceptibility to colitis in WT mice. WT mice were given an antibiotic cocktail including fluconazole for 3 weeks, transplanted as indicated (red) with fecal microflora from WT or Clec7a-/- mice and treated with 2.5% DSS for 7 days. (A) Body weight was measured daily. Histology score (B), and production of IL-17 and IFN-γ by LI-LP, and TNF-α production in the colon (C) were determined on day 11. Each symbol represents a different mouse. One of two independent experiments is shown. Error bars, s.d., * P < 0.05, ** P < 0.01.

19
Fig. S11. Rarefaction curve demonstrating fungal sequence coverage in WT and Clec7a-/- mice before and after colitis. DNA was isolated from feces of WT and Clec7a-/- mice before and after the onset of colitis (n=16) and subjected to Illumina GA sequencing. The curve depicts the number of operational taxonomic units (OTU) observed at different sampling depth where the X axis is the number of ITS1-2 reads and the Y axis is the number of OTUs observed.

20
Fig. S12. Phylogenetic tree representing fungal diversity in murine feces.

21
Fig. S13. Comparing the fungal microbiome in feces and food. DNA was isolated from mouse food and murine feces. Fungal microbiome analysis was performed using Roche 454 and Illumina GA sequencing of ITS1-2 rDNA. Pie charts represent taxonomic distribution of 20 most abundant fungal species in murine feces (left pie chart) and in mouse food (right pie chart). Species breakdown for major groups are provided (small pie charts on the left).Red arrows show species present in both mouse food and feces. The left pie chart is the same as in Figure 3A and is included again here for comparison.

22
Fig. S14. Phylogenetic tree representing fungal diversity in murine food.

23
Fig S15. Clec7a-/- show changes in the distribution of major fungal genera during colitis. Quantitative analysis of the three major intestinal fungal genera in wild type and Clec7a-/- mice before and after treatment with DSS was performed. Illumina GA data were analyzed and presented as relative percentage of dominant fungal genera (n=16 mice). Error bars, s.d., * P < 0.05, ** P < 0.01.

24
Fig. S16. Fungal invasion of colonic tissue in Clec7a-/- mice during colitis. Colon sections from WT and Clec7a-/- mice before and after colitis were stained with the anti-fungal antibody and counterstained with DAPI.

25
Fig. S17. C. tropicalis but not S. fibuligera exacerbates colitis in Clec7a-/- mice. WT and Clec7a-/- mice were supplemented with four doses of C. tropicalis or S. fibuligera, treated with 2.5% DSS for 7 days (beginning on day 7 after the first dose of fungi) and then kept on water for 4 additional days (A). Graph represent body weight in WT and Clec7a-/- mice supplemented or not with C. tropicalis (B) or S. fibuligera (C) (n=4). Weight loss in (B) was significantly greater in Clec7a-/- mice supplemented with C. tropicalis at the peak of disease (days 8 and 9). The production of IL-17 and IFN-γ by LI-LP (D) and MLN (E)T cells were determined by ELISA 4 days after DSS treatment. Each symbol represents a separate mouse. Data represent one of 2 independent experiments. Error bars, s.d., * P < 0.05.

26
Fig. S18. S. fibuligera is dimorphic and is recognized by Dectin-1. (A) S. fibuligera was grown on Sabouraud Dextrose Agar (SDA) to obtain filamentous form (left and middle picture) or in Sabouraud Dextrose Broth (SDB) to obtain yeast form (far right picture). (B, C) Bone marrow-derived macrophages from wild type or Clec7a-/- mice were IFN-γ-primed and stimulated with S. fibuligera (1:1). (B) Production of reactive oxygen species (ROS) was measured with luminol-enhanced chemiluminescence (ECL). (C) TNF-α production was measured by ELISA after 24h of stimulation. Data points are means of triplicate culture. RLU, relative light units; Error bars, s.d.

27
Fig. S19. C. tropicalis but not S. fibuligera enhances inflammatory cytokine production in colons of DSS-treated Clec7a-/- mice. Mice were treated as described in Supplementary Figure 18. The expression of tnfa, Il23a, Il17a, cxcl2 and defa3-defa6 in colons was measured by qPCR and normalized to Rpl32 mRNA (n=3) Data represent one of 2 independent experiments. Error bars, s.d., * P < 0.05, ** P < 0.01.
28
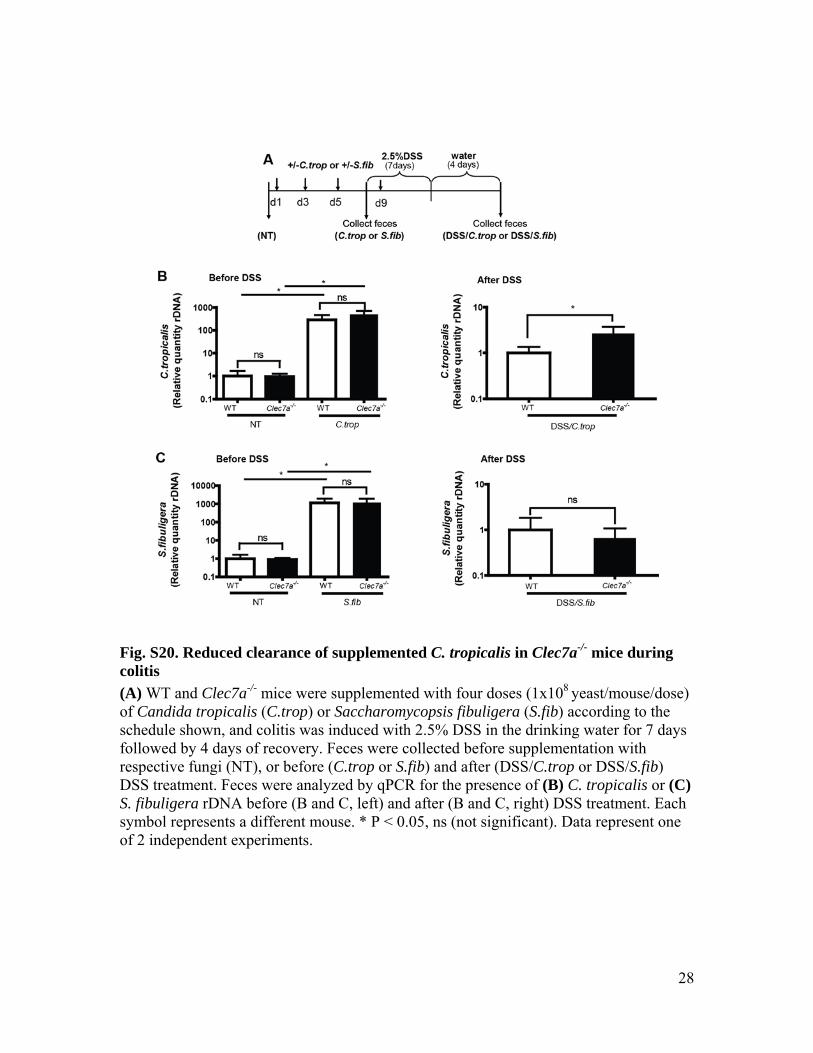
Fig. S20. Reduced clearance of supplemented C. tropicalis in Clec7a-/- mice during colitis (A) WT and Clec7a-/- mice were supplemented with four doses (1x10⁸ yeast/mouse/dose) of Candida tropicalis (C.trop) or Saccharomycopsis fibuligera (S.fib) according to the schedule shown, and colitis was induced with 2.5% DSS in the drinking water for 7 days followed by 4 days of recovery. Feces were collected before supplementation with respective fungi (NT), or before (C.trop or S.fib) and after (DSS/C.trop or DSS/S.fib) DSS treatment. Feces were analyzed by qPCR for the presence of (B) C. tropicalis or (C) S. fibuligera rDNA before (B and C, left) and after (B and C, right) DSS treatment. Each symbol represents a different mouse. * P < 0.05, ns (not significant). Data represent one of 2 independent experiments.

29
Fig. S21. Anti-fungal therapy ameliorates colitis in Clec7a-/- mice. WT and Clec7a-/- mice were given fluconazole in the drinking water for total of 14 days starting 2 days prior the induction of DSS colitis. (A) Cells were isolated and stimulated in vitro with PMA, ionomycin and Brefeldin A. Cells were permeabilized and stained with anti-CD4, anti-IL-17 and anti-IFN-γ antibodies. Samples were analyzed by flow cytometry. Graphs represent the frequency of IL-17+ and IFN-γ+ cells inside the CD4+ T cell population. (B) IL-17 and IFN-γ produced by LI-LP, and (C) TNF-α production in the colon was determined by ELISA. (D) The expression of tnfa, Il23a and Il17a in colons was measured by qPCR and normalized to Rpl32 mRNA (n=3). Data were obtained from three independent experiments with similar results. Each symbol represents a different mouse. One of three independent experiments is shown. Error bars, s.d., * P < 0.05, ** P < 0.01.

30
Fig. S22. Analysis of CLEC7A SNPs and haplotypes. (A) Location of CLEC7A SNPs. Cartoon of CLEC7A gene with a track showing position on Human Genome Build 37, a track showing the location of the 5 SNPs (in red) examined in this study, and a track showing exon/intron structure of transcript variants. (B) Linkage disequilibrium between CLEC7A SNPs. Using Haploview v4, linkage disequilibrium between CLEC7A SNPs was plotted; red diamonds without numbers indicate r2=1. The rs2078178-rs16910631 haplotype is marked as “Block 1”.

31
Table S1. CLEC7A risk haplotype analysis of MRUC and Non-MRUC patients

32
Table S2. CLEC7A risk haplotype analysis of MRUC and Non-MRUC patients compared to healthy controls

33
References and Notes 1. C. Lupp et al., Host-mediated inflammation disrupts the intestinal microbiota and
promotes the overgrowth of Enterobacteriaceae. Cell Host Microbe 2, 204 (2007).
2. B. P. Willing et al., A pyrosequencing study in twins shows that gastrointestinal microbial profiles vary with inflammatory bowel disease phenotypes. Gastroenterology 139, 1844, e1 (2010).
3. E. Elinav et al., NLRP6 inflammasome regulates colonic microbial ecology and risk for colitis. Cell 145, 745 (2011).
4. M. Arumugam et al., Enterotypes of the human gut microbiome. Nature 473, 174 (2011).
5. J. Henao-Mejia et al., Inflammasome-mediated dysbiosis regulates progression of NAFLD and obesity. Nature 482, 179 (2012).
6. M. Vijay-Kumar et al., Metabolic syndrome and altered gut microbiota in mice lacking Toll-like receptor 5. Science 328, 228 (2010).
7. J. Qin et al., A human gut microbial gene catalogue established by metagenomic sequencing. Nature 464, 59 (2010).
8. A. J. Scupham et al., Abundant and diverse fungal microbiota in the murine intestine. Appl. Environ. Microbiol. 72, 793 (2006).
9. S. J. Ott et al., Fungi and inflammatory bowel diseases: Alterations of composition and diversity. Scand. J. Gastroenterol. 43, 831 (2008).
10. S. C. Cheng et al., The dectin-1/inflammasome pathway is responsible for the induction of protective T-helper 17 responses that discriminate between yeasts and hyphae of Candida albicans. J. Leukoc. Biol. 90, 357 (2011).
11. S. I. Gringhuis et al., Dectin-1 is an extracellular pathogen sensor for the induction and processing of IL-1beta via a noncanonical caspase-8 inflammasome. Nat. Immunol. 13, 246 (2012).
12. S. LeibundGut-Landmann et al., Syk- and CARD9-dependent coupling of innate immunity to the induction of T helper cells that produce interleukin 17. Nat. Immunol. 8, 630 (2007).
13. H. R. Conti et al., Th17 cells and IL-17 receptor signaling are essential for mucosal host defense against oral candidiasis. J. Exp. Med. 206, 299 (2009).
14. B. Ferwerda et al., Human dectin-1 deficiency and mucocutaneous fungal infections. N. Engl. J. Med. 361, 1760 (2009).
15. E. O. Glocker et al., A homozygous CARD9 mutation in a family with susceptibility to fungal infections. N. Engl. J. Med. 361, 1727 (2009).
16. P. R. Taylor et al., Dectin-1 is required for beta-glucan recognition and control of fungal infection. Nat. Immunol. 8, 31 (2007).
17. A. Franke et al., Genome-wide association study for ulcerative colitis identifies risk loci at 7q22 and 22q13 (IL17REL). Nat. Genet. 42, 292 (2010).

34
18. D. P. McGovern et al., Genome-wide association identifies multiple ulcerative colitis susceptibility loci. Nat. Genet. 42, 332 (2010).
19. C. H. Seow et al., Novel anti-glycan antibodies related to inflammatory bowel disease diagnosis and phenotype. Am. J. Gastroenterol. 104, 1426 (2009).
20. S. Joossens et al., The value of serologic markers in indeterminate colitis: A prospective follow-up study. Gastroenterology 122, 1242 (2002).
21. B. N. Gantner, R. M. Simmons, D. M. Underhill, Dectin-1 mediates macrophage recognition of Candida albicans yeast but not filaments. EMBO J. 24, 1277 (2005).
22. M. A. Ghannoum et al., Characterization of the oral fungal microbiome (mycobiome) in healthy individuals. PLoS Pathog. 6, e1000713 (2010).
23. W. S. Garrett et al., Enterobacteriaceae act in concert with the gut microbiota to induce spontaneous and maternally transmitted colitis. Cell Host Microbe 8, 292 (2010).
24. S. Jawhara et al., Colonization of mice by Candida albicans is promoted by chemically induced colitis and augments inflammatory responses through galectin-3. J. Infect. Dis. 197, 972 (2008).
25. T. Haritunians et al., Genetic predictors of medically refractory ulcerative colitis. Inflamm. Bowel Dis. 16, 1830 (2010).
26. C. J. Landers et al., Selected loss of tolerance evidenced by Crohn’s disease-associated immune responses to auto- and microbial antigens. Gastroenterology 123, 689 (2002).
27. I. D. Iliev, E. Mileti, G. Matteoli, M. Chieppa, M. Rescigno, Intestinal epithelial cells promote colitis-protective regulatory T-cell differentiation through dendritic cell conditioning. Mucosal Immunol. 2, 340 (2009).
28. B. Kelsall, Recent progress in understanding the phenotype and function of intestinal dendritic cells and macrophages. Mucosal Immunol. 1, 460 (2008).
29. G. Matteoli et al., Gut CD103+ dendritic cells express indoleamine 2,3-dioxygenase which influences T regulatory/T effector cell balance and oral tolerance induction. Gut 59, 595 (2010).
30. Z. Liu, T. Z. DeSantis, G. L. Andersen, R. Knight, Accurate taxonomy assignments from 16S rRNA sequences produced by highly parallel pyrosequencers. Nucleic Acids Res. 36, e120 (2008).
31. J. G. Caporaso et al., QIIME allows analysis of high-throughput community sequencing data. Nat. Methods 7, 335 (2010).
32. R. H. Nilsson, G. Bok, M. Ryberg, E. Kristiansson, N. Hallenberg, A software pipeline for processing and identification of fungal ITS sequences. Source Code Biol. Med. 4, 1 (2009).
33. W. J. Kent, BLAT—the BLAST-like alignment tool. Genome Res. 12, 656 (2002).

35
34. H. Li et al., The Sequence Alignment/Map format and SAMtools. Bioinformatics 25, 2078 (2009).
35. R. Chenna et al., Multiple sequence alignment with the Clustal series of programs. Nucleic Acids Res. 31, 3497 (2003).
36. L. P. Fried et al., The Cardiovascular Health Study: Design and rationale. Ann. Epidemiol. 1, 263 (1991).
37. B. M. Psaty et al., Cohorts for Heart and Aging Research in Genomic Epidemiology (CHARGE) Consortium: Design of prospective meta-analyses of genome-wide association studies from 5 cohorts. Circ Cardiovasc Genet 2, 73 (2009).
38. M. Stephens, N. J. Smith, P. Donnelly, A new statistical method for haplotype reconstruction from population data. Am. J. Hum. Genet. 68, 978 (2001).
39. M. Stephens, P. Donnelly, A comparison of Bayesian methods for haplotype reconstruction from population genotype data. Am. J. Hum. Genet. 73, 1162 (2003).
40. R.D.C. Team, R: A Language and Environment for Statistical Computing (R Foundation for Statistical Computing, Vienna, 2005).